Embed Size (px)
Citation preview

NEES at CU Boulder
The George E Brown, Jr. Network for Earthquake Engineering Simulation
01000110 01001000 01010100CU-NEES-08-04
Performance Evaluation of Reinforced Concrete Masonry Infill
Walls A Concentration on the Evaluation of
Masonry Infill Properties
By
Evan Tusini The George Washington University
Kaspar Willam
University of Colorado, Boulder
Center for Fast Hybrid Testing Department of Civil Environmental and Architectural Engineering University of Colorado UCB 428 Boulder, Colorado 80309-0428
September 2008

PERFORMANCE EVANLUATION OF REINFORCED CONCERETE MASONRY INFILL WALLS
A CONCENTRATION ON THE EVALUTATION OF MASONRY INFILL PROPERTIES
Evan Tusini
The George Washington University
University of Colorado, Boulder
Kaspar Willam
1 Abstract
In the seismic evaluation of reinforced concrete (RC) framed, masonry infill walls - a
common cell in many buildings – a thorough understanding of the elemental interactions
becomes imperative. These elements include the concrete and reinforcement steel which
comprise the frame, as well as the brick and mortar infill which comprise the span of the wall.
The nature of the testing which the subject of this report will supplement includes six,
cyclic, static tests of 2/3 scale RC infill walls being performed at the University of Colorado,
Boulder. This project is to be carried out in conjunction with 1/5 scale static testing at Stanford
University, as well as 2/3 scale dynamic testing at the University of California San Diego.
Together these tests comprise one NEESR small group project.
The subject of this discussion is to include cylindrical mortar specimens, as well as three
stack brick-mortar prisms, all to be tested in compression. While it is known that the mortar
has high ductility and relatively low yield strength compared to the brick, these properties must
be more quantitatively defined in order to add usefulness in understanding the behavior of the
overall RC framed infill wall. Furthermore, the interactions between these two elements in the
form of a brick-mortar prism are imperative to a fill understanding of the wall itself. These
interactions, and more importantly, the interface between the brick and mortar will be closely
evaluated
As a secondary objective during these proceedings, validation will be carried out to
determine the accuracy of testing methods at the University of Colorado. This discussion allows
an ideal venue for determining the usefulness of a relatively untested method of strain
calculation at the university, the Vic-2D image correlation system.
2 Introduction
2.1 Mortar
Mortar is used in masonry practice as a means of joining the main blocks, in the case of
this study clay brick has been used. Mortar is comprised of a mixture of cement, water,
aggregate, and sometimes lime. The mortar in the following tests uses Portland Type I-II
cement and contains an aggregate composed of all purpose sand. Lime has been used in all
mixtures and a standard construction practice of using a 1:1:5 volumetric ratios of cement lime
and sand, with water added until desired workability is achieved has been assumed. The goal
this study is to determine the materials properties for mortar mixtures, of volumetric ratios,
varying off of this standard.
The necessity to test multiple specimens illustrates one of the most important traits of
mortar. When working with mortar, it is important to realize that there are hundreds of
variations that can be and are used everyday due to a lack of industry standards. Cements and
sands of different types and mixtures can be combined, and lime can be added to or neglected
from the mixture. On top of all of this, one of the most subjective portions of the mix is the
water which is added based on desired workability and not by a set volume. For these reasons,
a set number of variables during the following mortar testing have been selected, and further
variations will not be entertained due to time and resource constraints.

3 Review
3.1 Sand Ratios in Mortar
In 1998, Yang and Ran conducted a study entitled “The Approximate Strength of
Lightweight Aggregate” in order to understand the mode of failure of concrete with different
aggregates (artificial, lightweight, etc). Concrete is formed in the same way as mortar, the
difference being the aggregate. While standard mortar aggregate is sand, standard concrete
aggregate is crushed stone. In performing this study, Yang and Ran not only look at their
concrete, which they call the “composite,” but they also individually looked at their aggregate,
and their mortar, also dubbed their “matrix”. It is this matrix that is relevant to our subject.
Yang and Ran’s mortar is comprised of Type I cement and natural sand. Their
compression tests were done on 50x50x50 mm cubes and their specimens are comprised of six
different mixtures ranging from 0 to 50 percent ratio of sand to total mortar ratio by volume.
While they do not contain lime, these mixtures are still of good comparative relevance.
A plot of the elastic modulus versus volume ratio of fine aggregate shows an
exponentially increasing curve. The Elastic Modulus defined as stress/strain shows that as the
ratio of total volume to volume of sand increases, the mortar’s Elastic Modulus also increases
according to equation 1, meaning that as less of the mortar is comprised of sand, its stiffness
increases. A plot of Mortar Compressive Strength vs. Volume Ratio of Fine Aggregate was also
created and shows a decreasing compressive strength with an increase of the fine aggregate,
this will prove to hold consistent [Yang, 1998].
Equation 1:
With similar relevance, a 2005 study by Sarangapani, Reddy and Jagadish attempt to
study the effects of the bond between brick and mortar. Their article, "Brick-Mortar Bond and
Masonry Compressive Strength" attempts to determine the flexural bond strength by utilizing a
“bond-wrench” test setup. While these tests are not necessarily important in our study, as a
precursor to these tests, Sarangapani, Reddy and Jagadish perform compression tests on
mortar cubes of 70x70x70 mm. Their tests include three relevant mortars, two are cement and
sand mortars of different ratios, and one is cement, lime, sand mortar. We are interested in
the results of their compression tests. It is important to note that the mixture with lime-the
most relevant to our subject-displays a lower yield strength than those without lime. This holds
true to common knowledge that lime is weaker than cement, therefore it is important to keep
this in mind when comparing to non-lime mixtures. These compression tests also display once
more, an increased compressive strength with a lower sand proportion in the mixture
With a similar desire, an extremely relevant study by Glencross-Grant and Walker in
2002 compares the use of different sands collected across Australia to determine their
suitability for mortar. What makes this study so relevant is the author’s use of general purpose
cement and a 1:1:6 cement lime sand mixture, creating an extremely similar mixture to that
which is the subject of this discussion. Of over 50 sands collected, 18 were eventually used in
mortar compression tests, and what is most interesting about the findings was that it was not
the type of sand that had the greatest effect on mortar strength, but instead it was the water

content. While water in this case was added until workability was achieved, the water/cement
or “w/c” ratio shows that in general, the less water added, the stronger the mix became
[Glencross-Grant, 2003]. This is an interesting concept-that less water creates a stronger
mortar- but this may not be entirely correct. To look more into this subject, we will review a
study that attempts to understand Abram’s Law.
3.2 Abrams’ Law
After looking at the sand content of mortar mixtures, it is clear that the less aggregate
used in the mixture, the stronger the mortar becomes. This next project involves a study in
Abrams’ law. This law states that for any mixtures of workable consistency, its strength is
determined by the ratio of water to cement. After reviewing the study by Glencross-Grant and
Walker, it is clear that there is certainly a connection between water content and strength, but
In an extremely thorough investigation, Rao tests mortar in several different ways, for
our purposes we will look at his compression tests. Rao’s goal is verify the importance of
Abrams’ findings in varying cement to water ratio as the governing factor in dealing with
mortar. Portland Type III cement, natural river sand, and potable tap water are used in the
creation of his 100x100x100 mm cubes. A cement sand ratios of 1:2, 1:2.5 and 1:3 were tested
with cement water ratios ranging from 1:3 to 1:65. Because Rao uses a different cement type,
and a much lower sand ratio, these tests are relevant in terms of basic trends, and not absolute
strengths [Rao, 2001].
As expected, the mix containing the lowest cement to sand ratio, held consistently
higher compressive strengths for all water ratios. This has been consistent throughout Yang,
Sarangapani, and now Rao’s tests as well.
More importantly, these tests also show that mortar strength-within workable levels-
increases with the correct cement water ratio. Samples 3 and 4 from mixes I, II, and III show a
consistently higher strength, suggesting that a 1:.4 or a 1:.45 cement to water ratio is close to
ideal. Our tests contained a much higher cement to water ratio, but they contained a much
higher sand content as well. This explains our need for extra water to achieve workability, and
might also suggest that a total mortar volume to water volume ratio may necessary as well for a
full understand of the results.
3.3 Conclusion
The variable properties of mortar make individual testing imperative. In each of the
previously discussed studies, the properties of the specimens have been specifically tailored for
each authors own purpose. Despite this fact, results from all tests can be used to gain a feel for
mortar, as a masonry tool in general. With the specimens created for the performance
evaluation of reinforced concrete masonry infill walls, we can expect the following trends. A
higher strength in specimens with lower sand content, clear variation in the specimens with
variable water content, and an overall lower strength than would be seen with a lime free
mortar mixture.

4 Relevant Site History
4.1 Brick-Mortar Prisms
Masonry, specifically brick and mortar, requires much more than knowledge of the brick
or mortar individually in order to fully understand its properties. Why would two materials of
very different strengths, combine to form a composite system which displays a yield strength
intermediate to both, and not that of the lower strength material? This question, underscored
by figure 1 below, can be answered by the investigation of the materials mismatch. This
mismatch demonstrates fact that a brick-mortar prism cannot be thought of as a serial
arrangement, of brick properties and mortar properties but as a more complicated system.
This interaction explains why the prism does not fail at the mortar’s lower yield, or the
brick’s higher yield, but at an intermediate yield strength. This materials interaction is being
reviewed at the University of Colorado, Boulder [Blackard, 2008].
Figure 1 Compression test of Brick, Mortar, and Brick-Mortar prisms [Blackard, 2008].
As the prisms are subjected to compression, both the brick and mortar are forced to
expand laterally as described by Poisson’s ratio. During this phenomenon variable Young’s
(elastic) moduli and Poison’s ratios cause each to expand differently. This would be a non-issue
if the two were not joined, but the interface between the brick and mortar causes a constraint
on the mortar, and a lateral tension on the brick. This constraint forces the mortar into a three-
way compression and places the brick in tension which eventually leads to splitting as the
mortar pulls the brick apart [Blackard, 2008].

Figure 2 Mortar in three-way compression. Brick in lateral tension [Blackard, 2008].
Ironically, it is this tension that eventually leads to the failure of the prism, even though
the prism is under compression. This theory assumes that a solid bond between the brick and
the mortar is maintained at all times; however; this is not necessarily the case. Finite element
modeling shows that if there were to be a slip in this interface, that the overall strength of the
prism would be greatly reduced. This loss of strength is demonstrated in Figure 3 below.
Figure 3 Brick-Mortar bond slip. [Blackard, 2008].
brick
mortar

4.2 Conclusion
It is still to be determined, how much if any slip occurs in actuality. While the models
show that a slip would have detrimental effects to the overall strength of the prism, cell, and
therefore wall, this slip must be quantitatively defined. If the slip is discovered, than it will
remain possible if not probable, that this slip is the cause of failure under compression.
5 Methods and Materials
5.1 Cylindrical Mortar Specimens
For this testing, relevant mortar mixtures were used in the creation of specimens. The
specimens are right cylinders of four inches in diameter, and approximately eight inches in
height. Nawy, in his Concrete Construction Engineering Handbook suggests a correction factor
for concrete cylinders of less than a two to one height to diameter ratio. While it may be
assumed that a similar correction would be utilized for the mortar, this correction must only be
used for a height to diameter ratio of 1.75 or lower. Therefore, although several of the
specimens in these tests are slightly less than the full eight inches - due to the cutting technique
used to smooth the tops and bottoms of the cylinders before capping - this dimensional
irregularity can be safely ignored.
The mortar mixture being studied is composed of cement, lime, sand, and water. Each
batch was measured by hand, and mixed using a cement mixer for a uniform sample mixture.
The mortar was hand pored into plastic cylindrical molds and was then vibrated and prodded to
achieve maximum settle. Five batches were created, with the goal of determining the variable
effects of both sand and water, the mixture results are summarized in Table 1 below.
During creation, the primary single “unit” measurement was approximately 212 in3
whereas the secondary single “unit” measurement was approximately 100.5 in3. The purpose
of these units was simply to create the proper amount of each mixture. Ten “wet” cylinders of
high cement water volumetric ratio were cured along with nine standard batch cylinders; eight
“dry” cylinders; ten cylinders of high and eight cylinders of low cement sand volumetric ratios.
Table 1
Cylindrical Mortar Specimens Batch Specifications
Description High Water
Content
Standard* Low Water
Content
High Sand
Content
Standard* Low Sand
Content
Designation IA B IC IIA B IIC
Cement (in3) 313 212 212 122 212 212
Lime (in3) 313 212 212 122 212 212
Sand (in3) 1563 1060 848 612 1060 1060
Water (in3) 610 372 305 408 372 305
Water (L) 10 6.1 5 6.7 6.1 5
Cement:Sand:Lime:Water
(volumetric ratio) 1:1:5:1.95 1:1:5:1.75 1:1:5:1.44 1:1:6:1.92 1:1:5:1.75 1:1:4:1.44
Cast Date 6/13/2008 6/13/2008 6/13/2008 6/16/2008 6/13/2008 6/16/2008
*Shown twice for comparison purposes

Each cylinder was “capped” on both sides, using a plaster of Paris. This procedure is to
ensure even and continuous contact between the cylinders and the plates of the MTS Universal
Testing Machine that was used in compressing the cylinders. The cylinders were allowed to
cure at least 28 days before testing began.
5.2 Brick-Mortar Prisms
What this study terms as brick-mortar prisms, are stacks of brick, three high, joined by
two mortar bed joints. The bricks are clay fired, and cut to four and one quarter inches in
length. The bricks were submerged in water, before being hand stacked using the assumed
standard mortar mixture of 1:1:5, cement, lime and sand ratio with water added until desired
workability was achieved.
Three separate test groups were created. Five controlled specimens, five “cut”
specimens, and five “poly” specimens. The control specimens used the standard brick, cut in
length, and made into a prism. The cut specimen’s center brick’s top surface was cut to create
a smooth surface and a more probable slip interface between it and the mortar. The poly
specimens contained the same center brick as the cut specimens, along with six coats of
polyurethane to create and even more ideal slip interface. The prisms were allowed to cure at
least 28 days before testing began. This surface is detailed in figure 17 later in this report.
Figure 4 Prisms waiting to be tested.

6 Setup and Testing
6.1 Compression Testing
The mortar specimens, as well as the brick-mortar prisms were subjected to
compressions tests using an MTS Universal Testing Machine. This load frame has a 110 kilo
pound capacity, and platelet surface diameters of six inches. Each specimen was subjected to a
constant displacement of .0004 inches per second, through failure, and until destruction was
imminent. During the mortar cylinder testing, force and displacement data were collected in
intervals of .5 seconds, and during the prism testing data was collected in intervals of two
seconds as to be aligned with the data collection from our Vic-2D imagine acquisition system.
Along with the mortar specimens and the brick-mortar prisms, single bricks were tested
with a vertical orientation in compression and with a data acquisition rate of every five seconds.
Three bricks were tested in compression, and all were instrumented with both axial
extensometers, and the speckle pattern used by the Vic-2D. The goal of these tests was to
verify the accuracy between these two data acquisition systems.
Strain data for all tests were also collected via internal linear variable differential
transformers (LVDTs) but this data is largely neglected due to known inaccuracies.
6.2 Extensometers
Two types of extensometers were used during the testing of cylindrical specimens.
These instruments, which measure both axial and lateral strain, were used in order to calculate
the Young’s modulus and Poisons ratio for the mortar. Five cylinders from each mortar batch
were instrumented, each with two adjacent MTS Axial Extensometers, and one MTS
Circumferential Extensometer. The adjacent axial extensometers were then also used during
the testing of vertically oriented bricks. The extensometers are visible in the pictures below,
also note the speckle pattern used by the Vic-2D image system, on the front of the brick.
Figure 5 Mortar Specimen with instrumentation Figure 6 Vertical Brick with speckle pattern

The axial extensometers can be seen above, attached axially to opposite sides of the
specimen. Relative displacements are measure by each of the two units; these displacements
are then divided over an original gauge length and averaged to account for any uneven loading.
The circumferential extensometer can be seen also, attached by a chain to the mortar specimen
in figure 5. This instrument measures a change in the angle created by caliper opening and
then uses equation 2 below to convert this change into a change in circumference of the
cylinder.
∆C = (∆L π) / {sin(θi) + [ π – (θi / 2)] cos(θi / 2)} Equation 2 [MTS Systems Corporation, 2000]
∆C change in circumference of the specimen
∆L change in length of the chain
θi initial angle of the caliper opening
6.3 Vic-2D
The Vic-2D image acquisition system was used alongside the other instruments, as a way
of ensuring the correlation and accuracy of the strain calculations acquired by the two different
methods. The Vic-2D can only be used on a flat surface, and therefore was not used on the
mortar specimens, but was important to this study because it was the only useful method to
study the brick-mortar prisms. This system is able to create a visual strain map that will be
useful when determining whether or not a slip occurs within the interface between the brick
and mortar of the prisms. Due to the necessity to view this slip, a successfully accomplished
verification between the extensometers and the Vic-2D system must be completed.
The Vic-2D camera uses digital image correlation by taking pictures of the specimen at
set intervals; the software that accompanies the camera can then analyze the pictures and
create strain calculations. In order for the Vic-2D to accomplish this, the specimen must first be
coated with a special speckled paint pattern that allows the software to track displacement.
When used, this system is able to create a two dimensional strain map of an entire plane of the
specimen [Cintron 2008]. This speckle pattern is seen in figure 6. For more on the Vic-2D
system, refer to Cintron, 2008.
7 Data and Results
7.1 Cylindrical Mortar Specimens
The mortar specimens subjected to a constant displacement compression load, behaved
as expected from review of previous testing. The force versus displacement curves of the
mortar mixes with a varying cement water and cement sand ratios are displayed below.
Figure 7 confirms that a lower cement to water volumetric ratio does indeed yield a
stronger mortar, but does little to confirm the nature of this relationship. This relationships
non linearity becomes clearer via the changes in average compression strengths versus changes
in volumetric ratios as displayed in figure 9. From batch IA to B, as the volumetric ratio of
cement to water drops by 10% while compressive strength increases by a meager 7%. From
batch B to IC, the volumetric ratio drops by 18% while compressive strength increases by a

much larger 26%. While a larger drop in volumetric ratio yields also yields a larger increase in
compressive strength, these proportions are not constant and therefore seem to show some
form of non linearity in this relationship.
For the full relationship between mortar compressive strength to be determined, many
more specimens of varying water content would need to be tested. With more data points on
the plot in figure 8, a clearer picture would be developed. This being said, it appears as though
Abram’s law as explored earlier has not been proved false, but will require more testing to be
confirmed.
Mortar Cylinders of High (A) Low (C) and Standard (B) Water
Content (I) in Compression
0
2
4
6
8
10
12
14
16
18
0 0.02 0.04 0.06 0.08 0.1Displacement (in)
Fo
rce
(kip
)
IA1IA2IA3IA4IA5B1B2B3B4B5IC1IC2IC3IC4
Figure 7 Water cement volumetric ratios are as follows. [IA 1:1.95] [B 1:1.75] [IC 1:1.44]

Compressive Strength Vs. Water Ratio in Mortar Cylinders
0.9 ksi
0.84 ksi
1.22 ksi
0
0.2
0.4
0.6
0.8
1
1.2
1.4
1 2 3 4 5 6 7 8
Cement to Water Volumetric Ratio
Co
mp
ress
ive
Str
en
gth
Figure 8 Note a possible exponential decay.
Mortar Cylinders of High (A) Low (C) and Standard (B) Sand
Content (II) in Compression
0
2
4
6
8
10
12
14
16
18
20
0 0.02 0.04 0.06 0.08 0.1
Displacement (in)
Fo
rce
(k
ip)
IIA1IIA2IIA3IIA4IIA5B1B2B3B4B5IIC1IIC2IIC3IIC4IIC5
Figure 9 Sand cement volumetric ratios are as follows. [IIA 1:6] [B 1:5] [IIC 1:4]

Compressive Strength Vs. Sand Ratio in Mortar Cylinders
1.45 ksi
0.9 ksi
0.67 ksi
0
0.2
0.4
0.6
0.8
1
1.2
1.4
1.6
1 2 3 4 5 6 7 8
Cement to Sand Volumetric Ratio
Com
pre
ssiv
e S
trength
Figure 10 Note a possible linear relationship.
In comparison to the aforementioned relationship, figure 9 above shows that a lower
cement sand ratio in the mortar yields a stronger mix as expected from both Yang and
Sarangapani. In this set of testing, unlike the previous set, the cement sand volumetric ratio
seems as though it may relate more linearly to compressive strength. From batch IIA to B the
volumetric ratio of cement to sand drops by 17% and the compressive strength increases by
26%, while during a 20% volumetric drop from batch B to IIC, compressive strength increase by
an even larger 38%. For these batches, a larger decrease in cement sand ratio yields a
proportionally larger increase in compressive strength, as evident from figure 10. Regardless of
this fact it is still to be determined, as with the previous set of tests, whether or not this
relationship indeed holds true.
One more important piece of information that these plots display is that mixtures IC and
IIC did not only yield stronger, but stiffer specimens as well. This information is important
when considering possible drift and deformation levels of the RC Infill wall.

Mortar Cylinders of High (A) Low (C) and Standard (B) Water
Content (I) in Compression
0
200
400
600
800
1000
1200
1400
1600
0 0.002 0.004 0.006 0.008 0.01
Strain (in/in)
Str
ess
(p
si)
IA1IA2IA3IA4IA5B1B2B3B4B5IC1IC2IC3IC4
Figure 11 Stress strain curves for cylinders variable cement water volumetric ratios.
Mortar Cylinders of High (A) Low (C) and Standard (B) Sand
Content (II) in Compression
0
200
400
600
800
1000
1200
1400
1600
0 0.002 0.004 0.006 0.008 0.01
Strain (in/in)
Str
ess
(p
si)
IIA1IIA2IIA3IIA4IIA5B1B2B3B4B5IIC1IIC2IIC3IIC4IIC5
Figure 12 Stress strain curves for cylinders of variable cement sand volumetric ratios.
From the stress strain data displayed in figures 11 and 12, a Young’s Modulus was
determined for each instrumented cylinder. This modulus was calculated via a chord modulus
taken at the most linear elastic region for each cylinder. When compared, these Young’s
Moduli confirm that with an increase in cement to water volumetric ratio, there is a decrease in
mortar stiffness, as well as with an increase in cement to sand volumetric ratio. These results
are consistent for each batch; this consistency can be seen from figures 13 and 14 below.

Young's Modulus for Mortar Cylinders of High (A) Low (C) and
Standard (B) Water Content (I)
0
200
400
600
800
1000
1200
1400
1600
1800
0 1 2 3 4 5 6
Specimen Number
Yo
un
g's
Mo
du
lus
(ksi
)
IA
B
IC
Figure 13 Young’s Moduli for cylinders of variable cement water volumetric ratios
Table 2 Average Young’s Moduli for cylinders of variable cement water volumetric ratios
Young’s Modulus Values (ksi) Specimen 1 Specimen 2 Specimen 3 Specimen 4 Specimen 5 Average
IA 729 750 1024 906 872 856
B 1184 925 1069 977 941 1019
IC 1477 1447 1517 1566 X* 1501
*Poor instrumentation yielded no results

Young's Modulus for Mortar Cylinders of High (A) Low (C) and
Standard (B) Sand Content (II)
0
200
400
600
800
1000
1200
1400
1600
1800
0 1 2 3 4 5 6
Specimen Number
Yo
un
g's
Mo
du
lus
(ksi
)
IIA
B
IIC
Figure 14 Young’s Moduli for cylinders of variable cement sand volumetric ratios
Table 3 Average Young’s Moduli for cylinders of variable cement sand volumetric ratios
Specimen 1 Specimen 2 Specimen 3 Specimen 4 Specimen 5 Average
IIA 604 587 697 726 749 673
B 1184 925 1069 977 941 1019
IIC 1622 1489 1303 1408 1615 1487
It is interesting to note that both the highest (IIC Specimen 1) and the lowest (IIA
Specimen 2) Young’s Moduli, come as a result of variation in the cement sand volumetric ratio,
and the not the cement water volumetric ratio. This might imply that it is the cement to sand
volumetric ratio that has a larger overall impact on the properties of the mortar itself, and not
the cement to water volumetric ratio as implied by Abram’s Law. But while this is an
interesting concept to pursue, once again, more testing must be done to verify.
Figure 15 below, shows the typical procedure for determining the Young’s Modulus of a
given cylinder as described above. Note on this plot that the positive strain represents axial
compression, and the negative strain represents lateral expansion. The black line represents
the chord modulus of the linear elastic portion of the stress strain curve as developed by the
axial extensometers. The blue curve is a stress strain curve developed by the axial
extensometers, the red curve is a stress strain curve developed by the circumferential
extensometer, and the purple curve is a stress strain curve developed by the MTS machines
internal LVDT’s. It is important to note softer curve given by the internal LVDT’s due to
deformation of the machine itself. For this reason the purple curve shows higher strain values
in general, and this is why this study utilizes the extensometers in place of the LVDT’s

Along with the determination of Young’s Moduli for the mortar specimens, further
analysis was done using this typical plot. A Poisson’s ratio, that is, a relation between axial and
lateral displacement was also determined comparing the values of each of these two strains at
60% to yield. These values proved to be inconsistent and therefore useless to this study. It is
believed that due to the material’s relatively small lateral deformations, the MTS
Circumferential Extensometer could not providing accurate results. For this reason, a study
must be done to ensure this piece of equipment’s usefulness.
IA1 Stress Vs. Strain
0
100
200
300
400
500
600
700
800
900
1000
-0.01 -0.005 0 0.005 0.01
Strain (in/in)
Stre
ss (
psi
)
Axial Ext.
MTS LVDT
Linear Elastic
Circumferential
Ext.
Linear (Linear
Elastic)
Figure 14 A typical Stress Strain plot used for analysis in this study
7.2 Vertical Brick
The tests used to verify the extensometers and the Vic-2D system was a thrice repeated
compression test of a single vertically oriented brick, as seen in figure 6. This test was used to
verify accuracy and consistency between these two systems, and to ensure full understand of
the Vic-2D system. Results from the tests did indeed yield consistent results as reported by the
MTS Axial Extensometers, as well as a strong correlation between these results and those from
the Vic-2D system.
These quantitative discoveries were made by the determination of Young’s modulus for
each brick, in the same manor as was used for the cylindrical specimens. Figure 15 below
shows the stress strain plots of each brick, and table 4 displays each corresponding Young’s
Modulus as determined by the external extensometer instrumented on each brick.
Vertical Brick in Compression
0
500
1000
1500
2000
2500
3000
3500
4000
0 0.001 0.002 0.003 0.004
Strain (in/in)
Str
ess
(p
si)
Brick 1
Brick 2
Brick 3
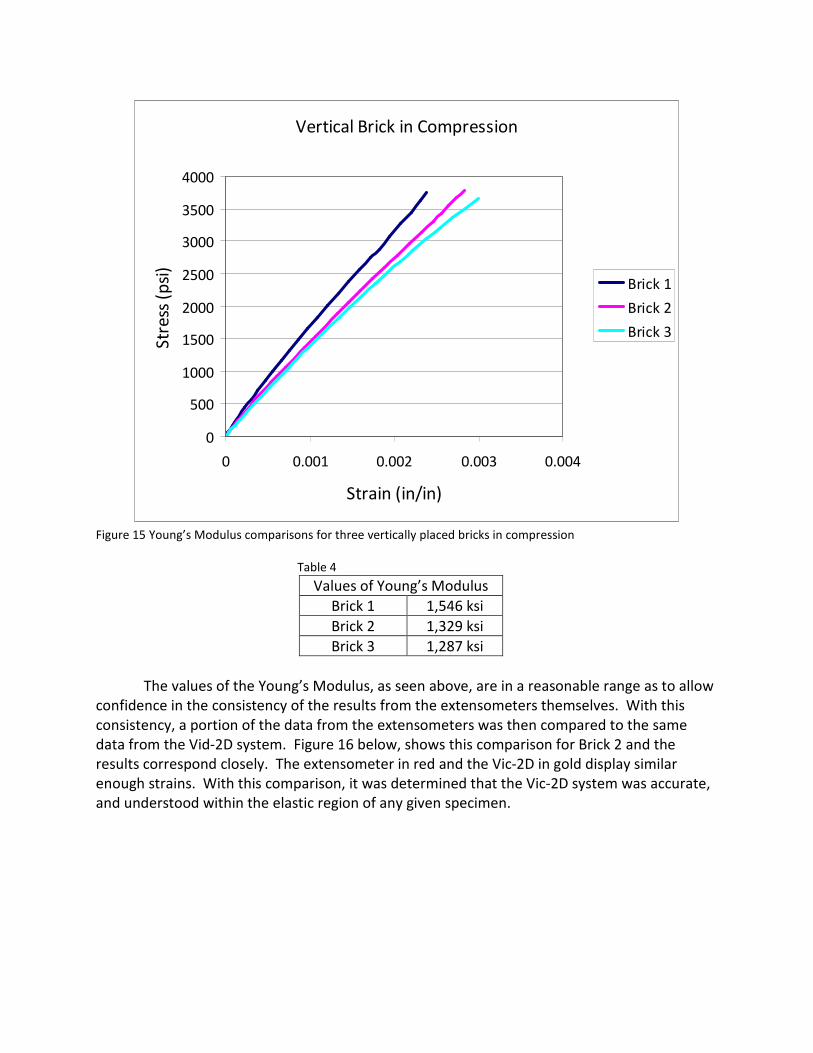
Figure 15 Young’s Modulus comparisons for three vertically placed bricks in compression
Table 4
Values of Young’s Modulus
Brick 1 1,546 ksi
Brick 2 1,329 ksi
Brick 3 1,287 ksi
The values of the Young’s Modulus, as seen above, are in a reasonable range as to allow
confidence in the consistency of the results from the extensometers themselves. With this
consistency, a portion of the data from the extensometers was then compared to the same
data from the Vid-2D system. Figure 16 below, shows this comparison for Brick 2 and the
results correspond closely. The extensometer in red and the Vic-2D in gold display similar
enough strains. With this comparison, it was determined that the Vic-2D system was accurate,
and understood within the elastic region of any given specimen.

Brick 2: Extensometer and Vic-2D Comparison
0
200
400
600
800
1000
1200
1400
1600
1800
0.0005 0.0007 0.0009 0.0011 0.0013
Strain (in/in)
Str
ess
(p
si)
Axial
Ext.
Vic-2D
Figure 16 Stress Strain plot comparing the results of the MTS Axial Extensometer and the Vic-2D system
7.3 Brick-Mortar Prisms
The compression tests were done on the brick-mortar prisms in the usual method, but
as mentioned earlier these prisms were not instrumented with extensometers. The prisms
were outfitted only with the prescribed speckle pattern for use with the Vid-2D software in the
determination of a slip in the brick to mortar interface. Figure 17 below shows a closer view of
this pattern, along with a denotation of the specific interface being studied.
Figure 17 The specimen variations (cut or polyurethane coating) were performed at the top of center brick

Compression testing of these prisms yielded no appreciable change in strength for each
specimen type. As seen from table 5 below, the “cut” and “poly” specimens, meant to induce
slip, had practically identical strengths as the standard specimens.
Table 5 Prism Compression strengths
Prism Max Load in Compression
Specimen Max Load (kip) Average Max Load
(kip)
1 51.42
2 60.19
3 57.17
4 45.18
Normal
5 48.90
52.57
1 62.56
2 58.42
3 63.76
4 38.47
Cut
5 52.34
55.11
1 53.29
2 58.617
3 58.47
4 56.88
Poly
5 52.87
56.02
These tests seem to prove that there is, after all, no slip occurring in the bond between
the mortar and brick. Failure occurs via the same mode in all three types of specimens, this
mode is tensile splitting of the brick due to the materials mismatch as described earlier. The
Vic-2D system verifies this with the images from figure 18. Figure 18a displays the higher axial
strains in the mortar as expected, while figures 18c and b respectively show the higher lateral
strain as a result of a vertical crack due to tension in the bricks, and the corresponding crack
itself.

Figure 18 a) Axial Strain b) Failure mode c) Lateral strain, in prisms
8 Conclusions and Further Suggestions
8.1 Mortar
As can be seen from the compression testing of the cylindrical specimens, the cement to
water and cement to sand volumetric ratios have large effects on the strength and stiffness of
mortar. The lower ratio of cement to water yielded a stronger and stiffer result, regardless of
its less than desirable workability. The lower ratio of cement to sand yielder a stronger and
stiffer result as well; and while this result was expected our tests show some qualitative data
that the relationship between the ratio and strength may be linear.
While the properties of the specific mixtures in this set of testing were identified, the
actual relationship between these component ratios, and their effects on the over properties of
the mortar have yet to be determined. In order to achieve this, further testing must be done
with far more batches. I believe that in order to thoroughly identify the effect of varying the
mix proportion on mortar performance, it will be imperative to vary both water and sand
content simultaneously. This will results in a true understand of the effects of each, both in
description and magnitude. One possible set of tests could use the batch specifications from
table 6 in order to achieve this.
One further option, not mentioned in the table would be to use a set ratio or
measurement of water, instead of using a “workability factor.” This ratio would have to be
predetermined based on workability, but could then hold constant for all specimens.
Furthermore, mass ratios may be considered as an alternate means of determining batch
specification, in this way, the settle in a given material would have no effect on the amount of
that material being incorporated into the mixture.

Table 6 Possible batch specification for future testing
Mortar Specimens Batch Specifications
Description Designation
Sand Water
Specification (Volumetric
Ratio)
1A Low Dry 1:1:4
1B Low Standard 1:1:4
1C Low Wet 1:1:4
2A Standard Dry 1:1:5
2B Standard Standard 1:1:5
2C Standard Wet 1:1:5
3A High Dry 1:1:6
3B High Standard 1:1:6
3C High Wet 1:1:6
8.2 Equipment
The MTS Axial Extensometers proved during these tests, to be a reliable source of
relative displacement, and when the proper gauge length is used, strain. That being said, these
instruments are truly imperative, due to the inherent error in the 110 kip Load Frame in the
materials testing laboratory, accompanying the NEES facility at the University of Colorado,
Boulder. Furthermore, the MTS Circumferential Extensometer has proved to yield uncertain
results. While I believe that correct attachment and data collection methods are being used,
analysis or use may still be erred. I suggest that this equipment be used on a sample with well
known properties, in order to be correctly calibrated.
More importantly, correlation between the axial extensometers used during materials
testing in this report, and the Vic-2D image correlation system has verified that this system is
indeed accurate, useful, and relevant. Throughout the elastic period of a specimen, the Vic-2D
system results in a reliable image of the strain on the prepared face of a specimen. It is yet to
be seen how this tool can be used more effectively after the elastic period. For more
information on this, refer to the report by Cintron, 2008.
8.3 Brick-Mortar Prisms
Compression tests on the MTS Universal Testing Machine show that brick-mortar prism
specimens of different preparation show little variation in average compressive strength. As
was displayed in table 5, unfinished, cut, and polyurethaned surfaces between the brick and the
mortar bed joints in the prism yield no variation in these results. Moreover, as was shown in by
the Vic-2D imaging in figure 18, all prisms failed in the expected manor, lateral tension.
Suggestions for further investigation in this topic at the Fast Hybrid Testing Laboratory
at the University of Colorado, Boulder include testing on several more specimens using the
larger platelets of the 1000 kip MTS Universal Testing Machine. Full sized, not 4.15 inch cut,
three and five stack brick-mortar prism specimens should be created using the same
procedures as discussed in this report. Furthermore, unit cells consisting of full bricks, half

bricks, and their accompanying bed and head mortar joints should be tested; once again
preparing these specimens in the same manor as described previously in this report.
I believe that if the Vic-2D system suggests that compressive strength varies
inconsequently with these more advanced specimens, than there will be significant evidence
against the possibility of slip within the interface of the prisms.
9 Acknowledgements
This research was supported by the George E. Brown Jr. Network for Earthquake
Engineering Simulation (NEES), mainly the Fast Hybrid Testing Laboratory at the University of
Colorado, Boulder (CU). Additionally this research was supported by the National Science
Foundation (NSF). Also, special thanks are necessary for the support given by the CUNEES Staff
as well as for the support from Rommel Cintron, Ryan Doheny, Kent Pokinghorne, Tom Bowen
and especially for the guidance of Kaspar Willam, and Ben Blackard.

10 References
Blackard, Ben. Unpublished internal report, July 2008.
Circumferntial Extensometer Strain Calculations. Eden Prairie: MTS Systems Corporation, 2000.
Glencross-Grant, R, and P Walker. "Survey of Building Sands in Australia." Construction and
Building Materials 17 (2003): 259-268.
Rao, G A. "Generalization of Abrams' Law for Cement Mortars." Cement and Concrete Research
31 (2001): 495-502.
Cintron, Rommel. Strain Measurements with the Digital Image Correlation System: Vic-2D.
Civil, Environmental, and Architectural Engineering, University of Colorado
Boulder. Boulder, CO, 2008.
Sarangapani, G, B V. Reddy, and K S. Jagadish. "Brick-Mortar Bond and Masonry Compressive
Strength." Journal of Materials in Civil Engineering (2005): 229-237.
Yang, Chung-Chia, and Ran Huang. "Approximate Strength of Lightweight Aggrigate Using
Micromechanics Method." Advanced Cement Based Materials 7 (1998): 133-138.
Sarangapani, G, B V. Reddy, and K S. Jagadish. "Brick-Mortar Bond and Masonry Compressive
Strength." Journal of Materials in Civil Engineering (2005): 229-237.
Willam, Kaspar, Benn Blackard, Carlo Citto, and Siva Mettupalayam. "Mini-Symposium in honor
of Giulio Maier." 8th World Congress on Computational Mechanics, June-July 2008,
Venice, Italy. PERFORMANCE EVALUATION OF MASONRY INFILL WALLS SUBJECTED TO
AXIAL AND IN PLANE SHEAR LOADING
Zhang, Guoxue, Jianxia Song, Jiansen Yang, and Xiyuan Liu. "Performance of Mortar and
Concrete Made with a Fine Aggregate of Desert Sand." Building and Environment 41
(2006): 1478-1481.