Embed Size (px)
Citation preview
Performance Evaluation Report
Operations Evaluation Department
Project Number: PPE: INO 32255 Loan Numbers: 1622-INO and 1623-INO December 2006
Indonesia: Social Protection Sector Development Program

CURRENCY EQUIVALENTS
Currency Unit – rupiah (Rp)
At Fact-Finding At Program Completion At Operations Evaluation (April 1998) (January 2001) (31 October 2006)
Rp1.00 = $0.00012 $0.00010 $0.00011 $1.00 = Rp8,200 Rp9,450 Rp9,102
ABBREVIATIONS
ADB – Asian Development Bank AusAID – Australian Agency for International Development BAPPENAS – Badan Perencanaan Pembangunan Nasional (National Development Planning Board) BKKBN – Badan Koordinasi Kiluarga Buencana Nasional (National Family Planning Coordinating Board) BPS – Biro Pusat Statistik (Central Bureau of Statistics) CIMU – Central Independent Monitoring Unit HNSDP – Health and Nutrition Sector Development Program ICB – international competitive bidding MOEC – Ministry of Education and Culture MOF – Ministry of Finance MOH – Ministry of Health MOHA – Ministry of Home Affairs MONE – Ministry of National Education MORA – Ministry of Religious Affairs MOSA – Ministry of Social Affairs NGO – nongovernment organization OEM – Operations Evaluation Mission PCR – program completion report PT Pos – Perseroan Terbatas Pos (Post Office) SPSDP – Social Protection Sector Development Program SUSENAS – national socioeconomic survey TA – technical assistance

NOTES
(i) The fiscal year (FY) during the initial period of program implementation (calendar 1998 and 1999) ran from 1 April to 31 March. For these years, FY before a calendar year denotes the year in which the fiscal year starts, for example, FY1999 refers to the period from 1 April 1999 to March 2000. Starting in 2001 the fiscal year shifted to be the same as the calendar year, running from 1 January to 31 December. Transition was accomplished by shortening FY2000 to 9 months from 1 April 2000 to 31 December 2000.
(ii) In this report, “$” refers to US dollars.
Key Words
asian development bank, capacity building, decentralization, education, family planning, health, indonesian social services, nutrition
Director General B. Murray, Operations Evaluation Department (OED) Director R. K. Leonard, Operations Evaluation Division 1, OED Team members C. F. Infantado, Portfolio Evaluation Officer, Operations Evaluation
Division 1, OED B. Q. Cafirma, Evaluation Assistant, Operations Evaluation Division 1, OED
Operations Evaluation Department, PE-695

CONTENTS
Page BASIC DATA iii EXECUTIVE SUMMARY v MAP vii
I. INTRODUCTION 1 A. Evaluation Purpose and Process 1 B. Expected Results and Program Objectives 2
II. DESIGN AND IMPLEMENTATION 3 A. Formulation 3 B. Rationale 4 C. Cost, Financing, and Executing Arrangements 4 D. Application of Counterpart Funds 5 E. Procurement, Construction, and Scheduling 5 F. Design Changes 5 G. Outputs 6 H. Consultants 7 I. Loan Covenants 8
III. PERFORMANCE ASSESSMENT 8 A. Overall Assessment 8 B. Other Assessments 15
IV. ISSUES, LESSONS, AND FOLLOW-UP ACTIONS 21 A. Issues 21 B. Lessons 23 C. Follow-Up Actions 24
APPENDIXES 1. Cost Breakdown by Project Component 26 2. Update on the Policy Matrix 28 3. Program Performance against the Program Framework 48 4. Assessment of Overall Program Performance 56 5. Social Development Impact 60 The guidelines formally adopted by the Operations Evaluation Department (OED) on avoiding conflict of interest in its independent evaluations were observed in the preparation of this report. Mayling Oey-Gardiner is the consultant. To the knowledge of the management of OED, the individuals preparing, reviewing, or approving this report had no conflict of interest.

BASIC DATA Social Protection Sector Development Program (Loans 1622/1623-INO)
Program Preparation and Institution Building
TA No. TA Project Name Type Person-Months Amount ($’000) Approval Date
3005 Social Protection Sector Development Program
SSTA 1.7 150 14 Apr 1998
ADTA ongoing 1,500 9 Jul 1998 ADTA ongoing 1,000 15 Apr 1999
3041 Monitoring and Evaluating the Program (with supplementary approvals) ADTA ongoing 2,000 13 Jun 2000
3042 Capacity Building for Decentralized Social Services Delivery
ADTA 140 900 9 Jul 1998
3043 Capacity Building for Planning and Evaluating Programs for Street Children
ADTA 36 500 9 Jul 1998
Key Program Data ($ million)
As per ADB Loan Documents
Actual
Total Program and Project Cost Program Loan Amount/Utilization (Loan 1622)
300.00 100.00
287.52 100.00
Project Loan Amount/Utilization (Loan 1623) 200.00 187.52
Key Dates Expected Actual Loan Fact Finding 6 Apr–4 May 1998 Loan Negotiations 11 Jun 1998 12 Jun 1998 Board Approval 9 Jul 1998 Loan Agreement 10 Jul 1998 Loan Effectiveness 7 Oct 1998 14 Jul 1998 First Tranche Release 14 Jul 1998 Second Tranche Release 18 Feb 2000 Loan Closing 31 Jan 2001 20 Nov 2001 Program Completion 31 Jul 2000 31 Jul 2000 Months (effectiveness to completion) 22 25
Borrower Government of Indonesia Executing Agency BAPPENAS
Mission Data Type of Mission Number of Missions Person-Days Fact-Finding 10a 245 Inception 1 10 Program Administration Review 8 317 Program Completion 4 51 Operations Evaluationb 1 114
ADB = Asian Development Bank, ADTA = advisory technical assistance, SSTA = small-scale technical assistance, TA = technical assistance. a The mission comprised eight people for 29 days from 6 April to 4 May 2005. The mission was joined by two
staff; one for 1 and one for 2 weeks. b The Operations Evaluation Mission comprised Susan Tamondong, evaluation specialist (mission leader);
Mayling Oey-Gardiner (international consultant); and Lamtiur Hasianna Tampubolon, Kurniyati Indahsari, and Endang Sulastri (national consultants).
Source: ADB. 2003. Project Completion Report on the Social Protection Sector Development Program in Indonesia. Manila; Asian Development Bank technical assistance information system.

EXECUTIVE SUMMARY
The Social Protection Sector Development Program (SPSDP) was designed and implemented in response to socioeconomic distress caused by the 1997 Asian economic crisis. The SPSDP combined two loans: $100 million for Loan 1622-INO–the policy component (the Program) and $200 million for Loan 1623-INO (the Project). The hardships caused by the crisis, exacerbated by serious drought in many parts of the country, led to widespread unemployment and falling incomes. The Government was faced with the prospect of rapidly growing numbers of people falling into poverty, and a reversal of social development progress achieved during the preceding two decades. Combined with the severely constrained government budget, the impact of the crisis had the potential to make access to basic social services difficult for the poor and vulnerable groups. The main purpose of the SPSDP was to reduce impoverishment caused by the 1997 Asian economic crisis, while introducing sector reforms to strengthen social services delivery in anticipation of decentralization. The Asian Development Bank (ADB) provided support to government policies aimed at (i) maintaining access of the poor to social services; (ii) maintaining quality; (iii) continuing decentralization of social services management; and (iv) strengthening the efficiency, transparency, and accountability of management of funds in school and health centers. The project loan aimed to (i) maintain school enrollment and education quality at precrisis levels through the provision of scholarships to junior secondary school students and block grants to junior secondary and primary schools; (ii) protect the health and nutritional status of the poor, particularly mothers, infants, and children by promoting access to and quality of essential health and family planning services; and (iii) provide support to the growing number of street and neglected children by providing scholarships and supplementary feeding. Three technical assistance (TA) grants accompanied the loans: (i) Monitoring and Evaluating the SPSDP; (ii) Capacity Building for Decentralized Social Services Delivery; and (iii) Capacity Building for Planning and Evaluating Programs for Street Children.
The urgency of the situation made room for innovations to be designed, accepted, and implemented. Overall the Project succeeded in achieving its objectives. Achievements in education surpassed expected outputs. The nutrition component, due to its complexity, was less successful.
This evaluation follows the project performance evaluation report guidelines prepared by the Operations Evaluation Department. In this evaluation, the program and project loans were evaluated and rated separately; then a weighted average rating was developed to obtain an overall rating of the combined Program and Project for the SPSDP as a whole. The overall rating for the SPSDP is “successful,” based on the assessment that the SPSDP was highly relevant, effective, efficient, and likely sustainable. The SPSDP is considered highly relevant in mitigating the impact of the crisis on the most vulnerable members of Indonesian society in terms of their access to basic social services in education, health, family planning, and nutrition. The education components, in particular, drew additional and complementary funding from the World Bank and the Government, which enhanced the success of the overall SPSDP. The more complex design and less specific targets to be achieved in a limited time reduced the success of the nutrition component.
The policy actions provided support for creating an enabling environment for implementing
numerous novel project interventions designed under the SPSDP. These include (i) allocation of central government funding to local government based on the poverty index, (ii) decentralized decision making, (iii) provision of block grants to education and health service providers, (iv) direct transfers to final beneficiaries relying on the post office, and (v) establishment of independent

vi
monitoring of effectiveness of the Program and accuracy of funds transfer. These policy actions contributed to the success of the SPSDP in providing basic social services to the poor and vulnerable.
Several of the policy reforms and interventions introduced under the SPSDP are likely
sustainable. Policies introduced under the program loan have been modified and expanded, and currently underlie the Government’s development agenda. Interventions and modalities initiated under the project loan continue to the present time. Pro-poor policies, introduced under the Program, providing the poor with access to essential social services are now widely accepted, and the social sectors are receiving greater absolute and relative shares of national and regional budgets. Except for the independent monitoring unit, the other four innovations continue their focus on the poor, decentralization as an ongoing process, block grants to social service providers, and funds flow as direct transfers to beneficiaries through the post office system. The performance of ADB and the Borrower (the Government) are rated as highly satisfactory. This reflects ADB’s sensitivity to Indonesia’s desire to prevent a reversal of social development progress achieved during the preceding decades, as well as the commitment of staff at headquarters and the resident mission, to provide the necessary assistance to achieve success. The Government sustained its commitment to providing basic social services to the poor by introducing basic policy changes, including explicitly targeting the poor, and embarking on the difficult path to decentralization while creating an environment of democracy with good governance. The Ministry of Finance ensured the necessary budgetary provisions, demonstrated considerable flexibility in agreeing to rely on the post office to provide the funds flow mechanism effectively bypassing the conventional system through the State Treasury. Key officials of the National Development Planning Board (BAPPENAS) showed high commitment to the aims and innovative design features of the SPSDP. Under BAPPENAS leadership, all stakeholders were willing to cooperate, explore, and adapt to new ways of doing things ensuring SPSDP success. The three TA grants were successfully completed. While all three TAs were highly relevant and contributed to the ongoing modifications of project implementation when necessary, regrettably they are not all sustained. The unit to monitor and evaluate the SPSDP developed the Central Independent Monitoring Unit, which produced a wealth of information obtained from independent sources and provided valuable inputs that at times led to modifications of project implementation. While the efforts were highly valued at the time, the valuable information is not properly stored for future reference and lessons. In fact, government projects are not independently monitored and evaluated. The second TA to support decentralized management of social services delivery to improve efficiency and quality was also highly relevant and results are likely sustained. The third TA for street children was highly relevant at the time and acknowledged as highly successful. The open houses (shelters for street children) visited during the Operations Evaluation Mission suggest sustainability that benefited from institutional development obtained through the TA, even though the performance evaluation report for the Health and Nutrition Sector Development Program assessed the street children component as less effective because of rising numbers seeking the benefits and gender bias in program design, which was not assessed by this evaluation. Bruce Murray Director General Operations Evaluation Department


I. INTRODUCTION
A. Evaluation Purpose and Process
1. The Social Protection Sector Development Program (SPSDP)1 in Indonesia was selected as part of the annual random sample of completed programs and/or projects to be evaluated by the Operations Evaluation Department of the Asian Development Bank (ADB). The Operations Evaluation Mission (OEM)2 visited Indonesia from 12 September to 4 October 20053 to carry out activities for the program and project performance evaluation report for the SPSDP. In this evaluation, the program and project loans for the SPSDP were evaluated and rated separately. Based on the results, a weighted average rating4 was developed to obtain an overall rating for the SPSDP. The evaluation follows program/project performance evaluation report guidelines5 that require some modifications in the standard evaluation methodology used previously. In completing this report, the views of ADB’s departments and offices concerned and those of the Borrower (the Government) and Executing Agency (National Development Planning Board [BAPPENAS]) have been considered. 2. The evaluation draws upon a mix of data collection methods and sources, obtained during the OEM and thereafter. Key informant interviews were held with officials from the Perseroan Terbatas Pos (PT Pos), BAPPENAS, Ministry of Health (MOH), and Ministry of National Education (MONE), Ministry of Finance (MOF). Discussions were also held with principal development partners including the World Bank, United Nations Development Programme, United Nations Children’s Fund, Australian Agency for International Development (AusAID), British Council, United States Agency for International Development, nongovernment organizations (NGOs), and former staff of the Central Independent Monitoring Unit (CIMU) for education and health. Extensive use was made of results of various reports and monitoring and evaluation studies carried out by CIMU and the central project management unit, as well as secondary data from various survey sources, particularly the annual national socioeconomic survey (SUSENAS). 3. The program completion report (PCR) rated the SPSDP as successful, bordering on highly successful.6 The SPSDP was rated highly relevant by the PCR in responding to short-term problems caused by the economic crisis and in promoting longer term structural reforms. According to the PCR, in spite of minor initial program management problems due to the introduction of a number of innovations, the Program successfully achieved its objectives of maintaining access to basic social services (in education, health, nutrition, and family planning) to vulnerable groups during the crisis, as well as laying the ground rules for instituting reforms in
1 ADB. 1998. Report and Recommendation of the President to the Board of Directors on Proposed Loans and
Technical Assistance Grants to the Republic of Indonesia for the Social Protection Sector Development Program. Manila (Loans 1622/1623-INO and TAs 3041/3042/3043-INO, for $300 million, approved on 9 July) out of which $100 million was allocated for Loan 1622-INO (policy-based program loan), and $200 million for Loan 1623-INO (project loan).
2 The Mission comprised Susan D. Tamondong, evaluation specialist (mission leader); Mayling Oey-Gardiner, social protection sector specialist (international consultant); and three national consultants: Lamtiur Tampubolon, associate researcher; Kurniati Indahsari, senior researcher; and Endang Sulastri, junior researcher. Subsequently and before being able to prepare a draft report, S. Tamondong resigned from ADB and the report was produced by M. Oey-Gardiner assisted by Operations Evaluation Department staff.
3 The completion of this report was delayed because the original evaluation specialist resigned from ADB. Completion of the report was subsequently reassigned to another staff.
4 While the components of the program loan were assumed to be of equal value, weighting of the project loan components is based on the value of actual ADB cost.
5 ADB, 2006. Operations Evaluation Department, Guidelines for Preparing Performance Evaluation Reports for Public Sector Operations. Manila.
6 ADB. 2003. Program Completion Report on Social Protection Sector Development Program in Indonesia. Manila (Loans 1622/1623-INO, for $200,000, approved on 9 July).

2
these sectors. Considering the paucity of data for proper poverty targeting at the time, the PCR considered the overall project implementation process could be described as efficient. Throughout the project implementation period, the performance report ratings were satisfactory to highly satisfactory for implementation progress, and satisfactory for the development objectives. The PCR observed that a number of innovative program interventions has been sustained. The legacy was identified as significant government funding commitments for education and health services, poverty reduction as the main development priority of the current Government, grant funding extended directly to service providers (schools and health centers) with practices of transparency and accountability exercised through local participation overseen by NGOs and the press, and nationwide establishment of district education boards and school committees with prominent civil society representation. B. Expected Results and Program Objectives
4. The SPSDP was a combination of two loans—a program loan of $100 million designed to support reforms in the provision of basic social services; and a project loan of $200 million to fund specific interventions in selected provinces7 in education, health, family planning, nutrition, and support to street children. 5. The primary objective of the SPSDP was to alleviate the socioeconomic distress caused by the 1997 Asian economic crisis, while launching sector reforms to strengthen social services delivery in anticipation of decentralization. To mitigate the adverse impacts of the Asian economic crisis, ADB provided support to government policies aimed at (i) maintaining access of the poor to social services; (ii) maintaining quality; (iii) continuing decentralization of social service management: and (iv) strengthening the efficiency, transparency, and accountability of management. The project loan aimed to (i) maintain school enrollment and education quality at precrisis levels through the provision of scholarships to junior secondary school students and block grants to junior secondary and primary schools; (ii) protect the health and nutritional status of the poor, particularly mothers, infants, and children by promoting access to and quality of essential health and family planning services; and (iii) provide support to the growing number of street and neglected children by providing scholarships and supplementary feeding. 6. Three technical assistance (TA) grants were appended to the loans:
(i) The Monitoring and Evaluating the SPSDP TA8 was designed to conduct independent and transparent monitoring and evaluation of the SPSDP. It aimed to develop a comprehensive project performance monitoring system to enable the Government and ADB to assess progress, identify constraints, and adjust delivery mechanisms to improve SPSDP efficiency; and to evaluate the effectiveness of SPSDP strategies with the intention of subsequent refinement and institutionalization.
(ii) The Capacity Building for Decentralized Social Services Delivery TA9 served as a
pilot for capacity building in decentralized social services delivery through 7 Originally, the interventions included in the project loan were for eight provinces (Central Java, Central Sulawesi,
East Nusa Tenggara, Irian Jaya (now comprising West Papua, Central Papua, and East Papua), Maluku (now comprising North Maluku and Maluku), Southeast Sulawesi, South Kalimantan, and West Nusa Tenggara. Soon after loan approval coverage of education measures was expanded to 16 provinces at the request of the Government with assistance from the World Bank. The additional eight provinces included for education were Bali, Central Kalimantan, DKI Jakarta, East Java, East Kalimantan, North Sulawesi, South Sulawesi, and West Kalimantan.
8 Footnote 1, Technical Assistance to Indonesia for Monitoring and Evaluating the Social Protection Sector Development Program, for $1,725,000 (TA 3041-INO:).
9 Footnote 1, Capacity Building for Decentralized Social Services Delivery, for $1,035,000 (TA 3042-INO).

3
consolidated and transparent budget management. Its objective was to support government efforts to decentralize management of social services delivery to improve efficiency and quality of services.
(iii) The Capacity Building for Planning and Evaluating Programs for Street Children
TA10 was to assist in developing capacity and helping the Government respond more effectively to the anticipated increasing numbers of street children during the crisis.
II. DESIGN AND IMPLEMENTATION
A. Formulation
7. The SPSDP was developed at the request of the Government for assistance in responding to the fiscal and monetary crisis that hit Indonesia (along with much of the rest of East and Southeast Asia) in the latter part of 1997. It was based on a desire by the Government, through a series of social safety net interventions, to mitigate adverse crisis impacts on food security and incomes of the poor, as well as on their access to essential social services such as education, health, and nutrition. ADB was asked to focus on education, health, family planning, and nutrition, since these areas were deemed of fundamental importance, but were not being adequately covered by other agencies. 8. ADB fielded a reconnaissance mission in February 1998 to discuss basic aims and approaches. This was followed-up by a fact-finding mission (upgraded to an appraisal mission)11 and supported by a small-scale TA12 and ADB’s continuing dialogue with the Indonesian Government. The urgency of the situation exerted pressure to mitigate the negative impact of the economic, social, and political crisis. Thus ADB streamlined processing by avoiding some of the usual steps of project preparation. In this context, no project preparatory TA was prepared. Government participation and coordination with development partners was intensive throughout. Because the SPSDP represented a response to a government initiative to address crisis impacts on the poor, extremely high ownership was achieved. 9. The purpose of the SPSDP, part of a larger ($2.8 billion) assistance program provided by ADB,13 is to mitigate adverse socioeconomic consequences of the Asian economic crisis, particularly on the poor. The hardships, caused by the crisis and exacerbated by serious droughts in many parts of the country, led to widespread unemployment, falling incomes, and social unrest. The Government was faced with the prospect of rapidly growing numbers of people falling into poverty, and a reversal of social development progress achieved during the preceding two decades. The Program aimed at preventing worsening conditions for the most vulnerable sections of the population by safeguarding their access to and quality of basic education, health, nutrition, and family planning. While the main emphasis of the investment loan was the maintenance of services in the short term, the program loan promoted policies in anticipation of decentralization, making the delivery of social services more flexible and
10 Footnote 1, Capacity Building for Planning and Evaluating Programs for Street Children, for $575,000 (TA 3043-
INO). 11 From 6 April to 4 May 1998. 12 ADB. 1998. Technical Assistance to the Republic of Indonesia for Preparing the Social Sector Development
Program. Manila (TA 3035-INO, for $150,000, approved on 17 April). 13 ADB provided five crisis support loans and associated TAs. The loans were the (i) Financial Governance Reforms:
Sector Development Program (Loan 1618-INO for $1.5 billion); (ii) SPSDP ($300 million); (iii) Health and Nutrition Sector Development Program (Loans 1675/1676-INO for $3 million); (iv) Power Sector Restructuring Program (Loan 1673-INO for $400 million); and (v) Community and Local Government Support Sector Development Program (Loans 1677/1678-INO for $320 million). This ADB assistance was, in turn, part of a large international effort by donors to support Indonesia during the Asian economic crises.

4
responsive to local demand. The policy agenda of the Program is a product of continuing dialogue between ADB and the Government, part of a long-term reform agenda that started in the mid-1990s. B. Rationale
10. For the 2 decades leading to the crisis, Indonesia made substantial social and economic progress while reducing the incidence of poverty. Between 1973 and 1996, gross domestic product grew at around 7% per annum and poverty declined from 40% to 11%. The 1997 economic crisis, compounded by the El-Nino-induced drought, threatened those achievements. Depreciation of the rupiah, high and rising inflation, rapidly expanding unemployment, and anticipated negative economic growth in 1998, were all expected to result in a significant increase in the number of people living below the poverty line. At the time the government budget was severely constrained, as prices for essential supplies such as medicines and instructional materials were rising. As a result, the Government was expected to be forced to reduce its support for basic social services and many poor Indonesians would be unable to afford the dwindling available supplies. 11. Even relatively short-term interruptions in the provision of basic social services were feared to have significant economic costs in the longer term. The impact of the crisis on the poor and vulnerable was seen as likely to be long-lasting. The Government’s strategy was to reach vulnerable groups and maintain delivery of essential social services in collaboration with aid agencies. The strategy involved measures to bypass a number of units and levels of the bureaucracy ensuring direct and expeditious support to providers and beneficiaries. This strategy presented opportunities to accelerate incremental reforms in the education, health, family planning, and nutrition subsectors. To maintain access and quality of social services, well-focused and targeted project support was needed, supplemented by a program of policies designed to make systematic reforms in social services delivery. ADB also provided needed TA support as the Government lacked the necessary expertise in key areas of monitoring, evaluation, and capacity building. The SPSDP targeted about two thirds of the country’s poor. It constituted a key element of ADB’s interim (1998–1999) operational strategy for Indonesia, which supported financial sector restructuring while providing a social safety net. C. Cost, Financing, and Executing Arrangements
12. ADB approved the SPSDP on 9 July 1998. The loan comprised a program component for $100 million and an investment (project) component for $200 million. The sector development program modality was believed to be the most appropriate because it could simultaneously support and accelerate policy and institutional reforms in the provision of basic social services, while funding specific activities to support their implementation with supplementary TAs addressing specific aspects of associated capacity building. MOF was the Executing Agency for the program component, and BAPPENAS the Executing Agency for the project component. 13. At appraisal, the total cost was estimated at $433.33 million, of which ADB was to finance all of the program costs of $100 million; and $200 million of the estimated $333.33 million project cost. The remainder of the project cost, $133.33 million or 40% of the total was to come from government counterpart funds. In fact, government contributions were even higher. The Government provided $165.36 million or 47% of total project expenditures of $352.88 million equivalent, while $12.48 million of unutilized funds were canceled on loan closing on 20 November 2001.

5
14. The $100 million program loan was disbursed in two tranches of $50 million each, the first at loan effectiveness (14 July 1998) and the second on 18 February 2000. Excluding interest during construction ($18.55 million), the majority of funds (about $146.5 million minus the cancellation of $12.5 million) for the project loan were channeled through an imprest account (special account held in Bank Indonesia). D. Application of Counterpart Funds
15. The Government complied with all the loan covenants, including the requirement to make available funds, facilities, services, land, and other resources, in addition to the loan proceeds for carrying out the Project and for the operation and maintenance of project facilities. The local currency proceeds of the program loan were transferred by Bank Indonesia to the Government as envisaged at appraisal. At program formulation, transfers were proposed to be made through a government-owned commercial bank, Bank Rakyat Indonesia, but the bank did not accept the proposed arrangements of waiving transfer fees. As the Project intended to make direct transfers to beneficiaries, who numbered in the millions, for block grants to schools and health centers and scholarships to individual students, such transfer costs were deemed untenable. Instead, PT Pos was approached, as it was already distributing small amounts of funds (such as pension funds) nationwide. PT Pos was prepared to provide the service without charging transfer or delivery fees in return for holding funds at a national average of three overnights. MOF and PT Pos signed an agreement to channel the funds given the extensive network of regional and local outlets of the post office. E. Procurement, Construction, and Scheduling
16. The Project did not involve any significant construction. Two major procurements were for contraceptives (28.36 million vials of injectables and disposable syringes procured under international competitive bidding [ICB], and blended infant foods: 738.5 tons procured under local competitive bidding and 2,215 tons procured under ICB).14 Procurement of contraceptives using ICB proceeded as planned, in part due to the extensive experience in this area of the National Family Planning Coordinating Board (BKKBN). Lack of MOH experience with ICB processing and/or staff for blended food procurement caused considerable delays, which resulted in ADB agreeing to allow for a smaller portion to be acquired locally (using local competitive bidding) in the interests of faster processing time to accelerate implementation. F. Design Changes
17. The only major change in scope during implementation resulted from a request by the Government to expand coverage of the Scholarships and Grants Program from the original 8 to 16 provinces.15 While this necessitated some reallocation of loan proceeds to cover the increased scope, it did not have a significant impact on performance of other programs. Unallocated funds and savings due to initial overestimation of the allocation for school block grants and delays in procurement for blended infant food were more than enough to make up the difference. Even with this, ADB was also able to approve purchase of additional contraceptives and additional services (a polio campaign) at health centers (Basic Data and Appendix 1).
14 Food for supplementary feeding programs for older infants and pregnant women was procured through local food
preparation using block grants. 15 This was part of the overall effort of the Government to mobilize a coordinated aid agency-funded national
scholarships and grants program from FY1999.

6
G. Outputs
18. ADB required 25 policy priorities as conditions prior to the release of the two-tranche program loan. Of these, 20 were completed and complied with prior to the release of the first tranche and another 5 policies and 15 subconditions were fulfilled prior to the release of the second and final tranche. Of the 5 conditions not fulfilled at the time of the first tranche release,16 only 1 was a major condition for the release of the second tranche—development of an incentive program for schools to maintain enrollment.17 The status of compliance of these conditions is summarized in Appendix 2. The OEM confirmed the continuation of the policy actions. 19. The program loan supported government efforts in implementing incremental reforms supportive of ongoing initiatives to improve access to, quality of, and efficiency of basic social services. In education, the Program succeeded in initiating provision of public support for general and religious public and private schools. Today the Government provides free basic education for all students attending public and private schools, which receive fixed amounts per student as school/student operating costs (BOS for Biaya Operasional Sekolah/Siswa).18 In both absolute and relative terms, funding for education in the budget continues to rise, moving to the 20% demanded by law (No. 20, 2004). School-based management (Manajemen Berbasis Sekolah) is systematized (even though not universally effective), and integrated school budgets and expenditures (RAPBS) are currently standard practice as they are a national requirement. In health and family planning, the current policy in public funding protection for the poor is to allocate earmarked funding to community health centers and insurance coverage for class 3 hospitals through health insurance (ASKES, Asuransi Kesehatan). Due to delays in the health and family planning and nutrition components during the SPSDP, other policy reforms, particularly those dealing with capacity building, were integrated into the follow-up Health and Nutrition Sector Development Program (HNSDP).19 20. Overall, the Project succeeded in achieving its objectives and achievements in education, sometimes exceeding expected outputs (Appendix 3):
(i) Education. This component produced extraordinary results. Block grants reached three times more primary schools than intended (from 40,000 to 120,000), and eight times more than the target for junior secondary schools (target 2,700, reached 21,000). The actual number of scholarships to junior high school students reached twice the yearly target (from 480,000 to 1 million). Even though this expansion was made possible due to doubling and even tripling of the exchange rate between the time of budgeting, loan fact finding, and loan approval, it was also due to the approval and willingness of ADB to
16 Given the intensity of the turmoil at the time (known as kristal for total crisis) when the state covered needed
replenishment to provide social services to the growing number of poor, the fact that most of the conditions were fulfilled even at the time of the first tranche release (14 July 1998) should be considered an achievement, even more impressive, they were achieved in record time of slightly over 3 months from initial fact-finding (6 April 1998).
17 The other four conditions were (i) empower schools by giving them authority to plan and manage integrated budgets, (ii) increase transparency in budgeting, (iii) develop school management capacity, and (iv) maintain priority allocation of resources to basic health services. Compliance with the first two conditions was resolved through issuance of decrees, the third condition was awaiting completion of training model and materials; and the fourth was fulfilled by the FY2000 budget.
18 However, the media continues to report on schools collecting a variety of fees (Sekolah Tak Keberatan Raperda Pungutan [Schools do not object to draft local rules on fee collection] in Suara Pembaruan 7 August 2006).
19 ADB. 1999. Report and Recommendation of the President to the Board of Directors on Proposed Loans and Technical Assistance Grants to the Republic of Indonesia for the Health and Nutrition Sector Development Program. Manila (Loans 1675/1676-INO and TAs 3175/3176-INO, approved on 25 March, for $300 million), out of which $100 million was allocated for Loan 1675-INO (policy-based program loan) and $200 million for Loan 1676-INO (project loan).

7
accommodate the Government’s request to expand the program from 8 to 16 provinces. While the program for street children did not reach similarly impressive numbers (targeted 8,600 and 7,500 scholarships for general and vocational training and reached 9,200 and 7,500 respectively), the success of the component is better expressed in terms of 94% completion and 20% found jobs, as well as 116 children returning home.
(ii) Health and family planning. The Project resulted in increased access of the
poor to essential primary health services, antenatal care for high-risk pregnant women, and access to family planning services. Primary health services were to be provided to health cardholders and reached 74% of 5.3 million in FY1999 and 93% of 5.2 million poor families in FY2000, with 2.9 average visit rates per year to health center (puskesmas) recipients of block grants. About 75% to 94% of targeted expectant mothers from poor families are estimated to have received medical checkups, and birthing assistance by medical personnel rose from 54% in 1997, to 60% in 1999, and 70% as of December 2000. The program procured and distributed to all provinces 28 million cycles of injectable contraceptives; use among the poor increased from 31.5% in 1998 to 33.8% in 2000.
(iii) Nutrition. This was a difficult component to administer. Inexperience and
bureaucratic delays during very difficult times may have contributed to below expected achievements. Complementary feeding for infants 6–11 months reached 70% of the target in FY1999 and 63% in FY2000, supplementary feeding for 1–2 year-old children reached 78% in FY1999 and 59% in FY2000, while among malnourished pregnant and breastfeeding mothers the figures were 52% in FY1999 and 73% in FY2000. The third item, reestablishment of a nutrition surveillance system was postponed to the follow-up HNSDP.
(iv) Managed health care scheme. This pilot scheme in selected districts, which
was strongly supported by MOH but attracted little public support, was judged by the PCR as not particularly successful. This pilot has been overtaken by the massive subsidized health insurance scheme for the poor under the health insurance program.
(v) Public awareness campaign. Two separate campaigns were developed for
education and health. While the education campaign was successful in averting dropouts due to inability to pay or prevented by parents, the health and nutrition campaign was slow to start and was subsequently combined with the HNSDP.
H. Consultants
21. The SPSDP engaged two individual national consultants each for 6 person-months from January to June 2000 to (i) revitalize food and nutrition surveillance under MOH, and (ii) design training with Ministry of Social Affairs (MOSA) and NGOs involved with street children.20 The three TAs appended to the loans (para. 6) had a total of 260 person-months of international and national consulting input. The Monitoring and Evaluating the SPSDP TA provided 24 international and 60 national person-months of consultant inputs; the services were all assessed as satisfactorily. This TA produced a wealth of information obtained through independent sources. This information served as the basis for inputs that sometimes led to modifications in project implementation. While the efforts and outputs were highly valued by a number of 20 In late 1999, the status of MOSA was downgraded and it became the National Social Welfare Agency under the
Coordinating Ministry of People’s Welfare and Poverty Reduction. For a short period in 2000, it was under the Ministry of Health. In 2001, its status as a ministry was reinstated and it is now known again as MOSA.
8
stakeholders interviewed by the OEM, the records are not properly stored for future reference and lessons learned. Due to space limitations and absence of archiving requirement, this valuable data source will be disposed of in due course. This will be a loss especially in light of government projects not being independently monitored and evaluated. The Capacity Building for Decentralized Social Services Delivery TA provided (i) 14 person-months for two international consultants to lead overall program implementation and evaluation, and assess the policy implications of consolidated school budget management; and (ii) 126 person-months for eight national consultants to design training programs and manuals, conduct the training and orientation workshops, and supervise the evaluation. The TA was rated successful by the OEM in laying the ground rules for decentralization of the education sector. In at least one successful district, integrated education budgeting is said to continue being implemented. This success can be attributed to intensive facilitation under the TA. Unless intensively facilitated, in general the political economy is not conducive to asking only one service within a local government structure, in this case education, to practice efficient budgeting when others do not. Not surprisingly, no indications of further dissemination of the model are available. The Capacity Building for Planning and Evaluating Programs for Street Children TA provided (i) 4 person-months of two international consultants responsible for providing inputs for social policies aimed at children in difficult circumstances, and for program evaluation and support for design of surveys and evaluations; and (ii) 32 person-months of seven national consultants responsible for supervising implementation of a social mapping survey and evaluation study. The TA is rated highly successful by the OEM in guiding and informing the development and implementation of the larger strategy for street children under the SPSDP and HNSDP. The open houses (shelters for street children) visited during the OEM suggest sustainability. Management of these open houses acknowledges the institutional developments obtained through the TA, enabling them to identify and tap other sponsors and continue their care and assistance for street children. I. Loan Covenants
22. The PCR reported full compliance to loan covenants as of loan completion. The OEM agrees with these findings.
III. PERFORMANCE ASSESSMENT
A. Overall Assessment
23. Even though it was formulated in a very short time and it incorporated a number of major and forward-looking innovations in terms of modality and design, the SPSDP rated highly relevant, effective, efficient, and likely sustainable. Overall SPSDP is rated successful. The associated TAs are all rated highly relevant, effective, efficient, and likely sustainable; and thus an overall rating of successful in each case. The successes that can be claimed by the SPSDP and associated TAs are due to the innovativeness, and especially commitment and ownership of all stakeholders.
1. Relevance
24. Both the program and project loans are rated highly relevant. They were consistent with ADB lending strategies at the onset of the crisis that were geared to mitigating adverse social impacts of the crisis and protecting the substantial progress made in key education and health outcomes in the immediate precrisis period, particularly among the poor and other vulnerable groups. They were also consistent with government objectives to provide a comprehensive set of social safety net interventions that to minimize adverse impacts on the Asian economic crises incomes and access to basic education and health services among the poor.

9
25. The modalities were highly relevant. The program loan was needed to help protect overall education and health expenditures (as a proportion of the budget) when severe fiscal constraints were imposed by exchange rate fluctuations and adherence to the relatively rigid requirements of the International Monetary Fund. Equally important, the program loan supported a reform agenda aimed at improving the overall focus of sector programming on the needs and conditions of the poor and on moving to a more decentralized and locally responsive pattern of service delivery. The Project was also highly relevant in that it sought to address both key demand- and supply-side constraints induced by the crisis through direct support to poor beneficiaries via scholarships and health cards providing free access to basic health services, block grants to basic education and health service institutions, and provision of essential supplies to protect against declines in service delivery to the poor. 26. The exceptional relevance is also shown by the fact that, in distributing the fuel subsidies,21 the Government adopted some innovative features introduced during the SPSDP, like the allocation of funds based on poverty estimates, greater decentralization of decision making in selection of potential beneficiaries by local committees, allocation of block grants to schools, reliance on the post office to deliver assistance directly to beneficiaries, and the need for monitoring. Relevance was maintained during implementation through Intensive communication between ADB and the Government, and frequent mission visits (eight review missions in 2 years), which allowed for needed adjustments when the original designs were shown to be less effective. The extraordinary successes in the education component can be attributed to the relative simplicity of design with clear targets; early establishment of the management unit in MOEC; mobilization of substantial additional resources from the government budget and loan funds from the World Bank to make it a nationwide program;22 and the successful socialization campaign with assistance from the AusAID and United Nations Children’s Fund, known as Aku Anak Sekolah (I Am a School Kid).23 Even though not necessarily fully attributable to the SPSDP, the major objective of the initiative to prevent rising dropouts was successful. In fact, dropout rates at primary and junior secondary declined from the start of the SPSDP to decentralization in 2001, even among children in the poorest quintile of households.
2. Effectiveness
a. Policies
27. Overall the SPSDP is rated effective. The policy actions were effective in creating an enabling environment for implementing numerous novel project interventions. 28. The SPSDP initiated pro-poor public policies providing the poor with access to essential social services of education, health and family planning, and nutrition. A breakthrough in education was the equal provision of public funding for students attending public and private schools, and MONE and Ministry of Religious Affairs (MORA) schools.24 Another first time initiative was providing attention to street and neglected children to get them back to school and to find them jobs. Even though not perfect, the health cards became identity cards for access to
21 In 2001, the Government introduced a fuel subsidy reduction compensation program (known as PKPS BBM) for
education and health programs for the poor. 22 Additional Government and World Bank funding for the primary and junior secondary schools Scholarships and
Grants Program was allocated to expand the program to the remaining 11 of 27 provinces at the time, and Government funding was also made available for senior secondary schools in all 27 provinces.
23 A collaborative effort of the Government of Indonesia, the World Bank, the Asian Development Bank and UNICEF, the back to school campaign provides scholarships for students in primary and secondary schools and 130,000 block grants for schools to help maintain enrolment and teaching quality.
24 Today MORA school students demand nondiscriminatory assistance.

10
basic health services, and can be claimed as a precursor to current cards.25 The SPSDP introduced the block-grant mechanism extended to schools and health service providers, as well as very basic disbursement mechanisms. Even though Indonesia had precursors to direct transfers to beneficiary units,26 the SPSDP novelty comes from reliance on the post office (rather than more common financial institutions such as banks)27 to deliver financial assistance directly to beneficiaries.28
b. Scholarships and Grants, and Street Children Programs
29. The Scholarships and Grants Program exceeded expectations, especially in light of a fear instilled by mostly exaggerated estimates prepared at the time.29 Not only did the program prevent an increase in dropouts, increasingly enrollment continued to rise as parents did not withhold children from going to school (scholarships) and schools did not reject children who did not pay their fees (block grants).30 Part of the scholarships ended up as school funds in the form of a variety of fees. Despite the loss of real income due to uncontrolled inflation, most schools were able to remain open and operational. Considering that in real terms school revenues declined, quality must have suffered but not dramatically, for even before the crisis basic education funding was limited.31 The situation would have been far worse without access to the scholarships and grants. 30. In spite of the complexity and novelty introduced by the SPSDP, and the problems encountered in the field, CIMU has this to say: “The general picture for 1998/99 was that the Scholarships and Grants Program worked well: Targeting of schools and students was conducted according to the rules.” Almost a million junior secondary students received scholarships in each of FY1999 (973,377 students) and FY2000 (971,491 students); in FY1999, 64,413 primary schools and 10,766 junior secondary schools received block grants, as did 62,796 primary schools and 10,493 junior secondary schools in FY2000.32 31. The street and neglected children component was effectively carried out distributing funds to NGOs to manage orphanages and 10 open houses to reach out to street children in 25 This is an identification card for direct cash transfer from fuel subsidy compensation. 26 First introduced by a BAPPENAS-implemented program, the IDT (Inpres Desa Tertinggal, or less developed/poor
villages). 27 The Government relies on the post office to distribute current direct cash transfers to the poor known as BLT
(Bantuan Langsung Tunai). 28 This procedure results in reducing the length of the chain and consequent transactions costs. 29 Until mid-1999, doomsday predictions were common, based on earlier experiences when in 1986/87 the
Indonesian economy took a downturn prompted by a slump in oil prices and drought. The education sector was hard hit. As public expenditures for the sector declined so did enrollments (World Bank.1998. Education in Indonesia: From Crisis to Recovery. Report 16369-IND. Washington, DC): Education Sector Unit, East Asia and Pacific Regional Office, World Bank; Mason, Andrew D. 1995. Schooling Decisions, Basic Education and the Poor in Rural Java, UMI Dissertation Services, Ann Arbor, Michigan; and Jones, Gavin. 2000. A Study of the Impact of the Scholarships and Grants Program, draft). Enrollments were predicted to decline from 78% to 54% or a drop of 30% (Popele, Jessica, Sudarno Sumarto, and Lant Pritchett. 1999. Social Impacts of the Indonesian Crisis: New Data and Policy Implications. A SMERU report: draft), implying an increase of every third child to drop out from school. In 1998 the minister of education claimed a potential decline in junior secondary enrollment from 72% to 58% as a result of the crisis (Jones 2000).
30 At the time of SPSDP implementation, Indonesia was suffering from the crisis and still in its infancy of reforms, fighting what was known as anti-KKN (anti-corruption, -collusion, and -nepotism) toward improved governance. Hence, the emphasis was on ensuring funds flows to final beneficiaries, eliminating intermediaries while assuming proper use of funds by block-grant recipients. Demands for good governance practices of accountability and transparency were only developed thereafter. Even today, when schools are receiving significant amounts of grants initially extended as compensation for reduced fuel subsidies and from FY2007 adopted as public policy to achieve 9-years basic education for all, no system is yet in place in all schools to fulfill requirements of good governance practices where school principals are demanded public accountability and transparency.
31 Clark, David, et al. 1998. Financing of Education in Indonesia. Comparative Education Research. Manila: ADB. 32 Government of Indonesia. 2000. SPSDP Project Completion Report.

11
seven cities. This component benefited greatly from valuable guidance provided by the TA identifying who and where the street and neglected children were. The component, which provided street children with scholarships, vocational training, supplementary feeding, and operating funds for open houses and social workers, exceeded the number of scholarship recipients anticipated.33 It also provided an opportunity for several thousand children to receive vocational training in the open houses. Almost all completed the training and about one third found employment. Social workers succeeded in motivating a number of street children to rejoin their families. However, the severity of the socioeconomic situation causing poverty to rise in combination with the fluidity of street and neglected children34 could have increased rather than decreased the number of street children. The OEM believes that even if the number of street children in fact increased, that phenomenon cannot be attributed to the component, which was of rather modest size. 32. Even though specific direct impacts of each of the program inputs—scholarships, block grants, and policy reforms—cannot be distinguished, the significant achievements attest to its success. The program was designed in light of fears of withdrawals from school due to economic hardships as experienced during the mid-1980s when oil price rises were accompanied by a dip in enrollment. The scholarships reduced the financial burden of schooling on parents,35 and the block grants to schools removed an important cause for rejecting students unable to pay school fees. This was helped by a nonfinancial incentive created by a high profile and popular public awareness multimedia campaign: I Am a Student. 33. The education component also benefited from strong government leadership and coordinated support of other aid agencies. ADB’s initial design for the education sector was adopted by the World Bank.36 It was the united efforts of these two major lenders that resulted in a single national program of scholarships and operating grants to schools and massive support for the reform agenda. It also resulted in economies of scale. While ADB funded independent monitoring for the whole program, the World Bank utilized trust funds to assist with a dedicated implementation unit in MOEC and a nationwide training program. It was the combined support of these two banks with the Government’s efforts to mitigate the effects of the crisis that helped leverage additional assistance from bilateral and international sources from Australia, Japan, United Nations Children’s Fund, European Union, and the Netherlands.
33 The program allocated 8,600 scholarships while 2,193 street children and 7,007 orphans received scholarships
under the program. 34 Fluidity of street people, children, and adults makes counting an impossible effort. In Indonesian large cities, for
instance, population numbers can rise suddenly during difficult times, like during the crisis, or in anticipation of “good times” prior to celebrations when Moslems are to help the poor.
35 This program has been lauded as one of the success stories in delivery of financial support to target groups. Based on data from 100 villages collected by BPS in August of 1997 and 1998, the Indonesian Family Life Survey2+ of Rand and Lembaga Demografi (Frankenberg, Elizabeth et al. 1999. Health, Education and the Economic Crisis in Indonesia, paper prepared for the 1999 Population Association of America meetings, New York), and a special school survey conducted in October 1998 (Filmer, Deon et al. 1998. The Impact of Indonesia’s Economic Crisis on Basic Education: Findings from a Survey of Schools. Indonesia: Ministry of Education and Culture), Popele, Sumarto, and Pritchett (1999) concluded that even though not as extreme, enrollment did drop more in the order of 4–5 percentage points. As more data become available, however, the very gloomy predictions of the effects of the crisis on education obviously did not materialize. More recent data indicate that school-age children did not drop out in droves. Instead, attendance ratios, which continued to rise during the 1990s stabilized during the height of the crisis to rise again toward the end of the century (Insan Hitawasana Sejahtera. 2000. Database of Social Indicators; and Jones, Gavin. 2000. A Study of the Impact of the Scholarships and Grants Program, draft), reflecting a situation of life going on.
36 The World Bank was able to mobilize sufficient resources to cover the provinces not covered by ADB by restructuring six ongoing loans. The combination of the World Bank resources with those of the Government enabled the program to be extended for 5 years. The Government funds extended the scope of the program to include scholarships for 6% of primary school children, scholarships for senior secondary school students, and block grants for senior secondary schools. ADB’s initial cost calculations were based on US dollar unit costs. The sharp depreciation of the rupiah allowed increased coverage of the ADB support from an original 8 to 16 provinces.

12
c. Health, Family Planning, and Nutrition
34. The design of the health, family planning, and nutrition components of the SPSDP was effective for reaching the target beneficiaries and objectives to maintain access to essential health care services for vulnerable groups. Block grants and consumables provided to community health centers ensured provision of free basic health care services.37 Under the component, block grants were provided to village midwives attached to health centers. They often used these funds to cover transport costs thereby serving as an effective incentive for them to increase and improve their outreach services extending contacts with pregnant women, particularly in remote areas. This was a significant achievement, and may well have contributed to movement away from reliance on traditional birth attendants to medical personnel, even among women belonging to the poorest quintile. 35. The health, nutrition, and family planning components were complex with less specific targets. This component required wide range of inputs and interventions as well as multiple delivery mechanisms. Mothers and infants requiring health, nutrition, and family planning services are more difficult to identify than youth of specific ages. In spite of considerable interagency discussions, this component did not attract interest or additional funding from other aid agencies.38 The component suffered from a slow start with implementation units established in MOH and National Family Planning Coordinating Board only during the second year of the component under the HNSDP; this is reflected in the improved performance during year 2. The nutrition component experienced delays in the release and transfer of funds. The potential beneficiaries suffered from irregularity and insufficient quantities of food supply and a less than stipulated duration of the program. The less than satisfactory outcome of the managed health care scheme,39 which the PCR claims had strong MOH support but attracted little public support, should come as no surprise. The project document does not include any clear design but a rather idealistic concept of risk-sharing between consumers and providers without detailing the necessary underlying changes in related institutions. The concept continues being discussed as ideal to provide health services for the poor under decentralization and globalization, while warning about weak law enforcement.40 Actual protection for the poor is currently provided at community health centers and insurance coverage for class 3 inpatient hospitalization through health insurance. 36. Even though more difficult to attribute to direct SPSDP contributions, at least at the macro level, outcome indicators suggest that the objectives of the SPSDP to prevent deterioration of mother and child health conditions among the poor during the crisis were attained. Life expectancy continues to rise and infant mortality declined. The health program, which provided block grants to community health centers and extended health cards to the poor to obtain free health care services, did improve over time. However, utilization of health services declined over time. Provision of block grants to health centers and incentives to village midwives to reach out to pregnant women contributed to increasing reliance on prenatal, birth, and
37 The Indonesian Family Life Survey study (Strauss, J. et al. 2002. Indonesian Living Standards Three Years after
the Crisis: Evidence from the Indonesia Family Life Survey. Michigan: Michigan State University) and CIMU found that the component managed to maintain access of the poor to basic health services.
38 While interest was sought from the European Union, a number of United Nations agencies (Food and Agriculture Organization, United Nations Children’s Fund, and United Nation Population Fund), bilateral sources (principally AusAID, Japan International Cooperation Agency, and United States Agency for International Development), collaboration was far weaker than in education.
39 Such a scheme is based on a contract between consumers and providers whereby the providers receive a lump sum per person registered with the scheme and guarantees the provision of a package of health services. If a consumer does not need the services, the lump sum remains with the providers who thus have an incentive to maintain the health of the consumer (footnote 1).
40 http://desentralisasi-kesehatan.info/doc/ Sistem, Pembiayaan dan Peningkatan Mutu.Pdf.
13
antenatal services. The SPSDP may have contributed to an increasing share of births attended by modern medical personnel. While health card distribution improved over time, utilization of health services by cardholders declined slightly, as confirmed by independent data sources (Appendix 5, para. 10; and figures A5.7 to A5.9). Irrespective of whether they visited health services providers or not, the overall health condition of the Indonesian population did not deteriorate during the crisis. As Knowles and Marzolf say, even though the health program was not perfectly targeted, maintenance of health service utilization rates and health outcomes among the poor is in and by itself an impressive achievement.41 37. The component to maintain poor women’s access to family planning services, particularly injectables, showed positive outcomes. Married women increasingly use modern contraceptives (rising from 50% in 1991, to 57% in 1997, to 60% in 2002/03). Reliance on injectables provided under the SPSDP is rising (from 12% to 28% for 1991–2002/03) and contraceptive user rates among the poorest quintile remained stable at between 50% and 55% (Appendix 5, para. 13; and figures A5.11 and A5.12). The SPSDP achieved its objectives of maintaining contraceptive services to the poor. 38. Despite implementation hurdles, the nutrition component may have contributed to lowering malnutrition prevalence among children, even though prevalence rates rose again after the SPSDP. The rise in malnutrition prevalence after 2001 is attributed to discontinuation of the supplementary feeding provided under the SPSDP.
3. Efficiency
39. The SPSDP was efficient, from design to implementation and closure. Fact finding took less than 1 month (6 April–4 May 1998), loan negotiations 2 days (11–12 June 1998), and Board approval to actual loan effectiveness took less than 1 week (9–14 July 1998).42 No loan extension was required, even though the closing date in the Loan Agreement specified 31 January 2001, final disbursement occurred on 3 July 2001 and the actual closing date was 20 November 2001. 40. In the absence of experience and relevant data for proper targeting the specified beneficiaries, the achievements attest to efficient delivery of inputs. Reliance on schools and local health workers (village midwives) in beneficiary targeting for scholarships and health card distribution was generally successful. Even though the process remained somewhat arbitrary throughout (selection guidelines were provided but could, in practice, not be enforced), evaluation studies as well as secondary data from SUSENAS indicate that a significant majority of benefits did accrue to the poor and near poor, and that leakages to better-off beneficiaries were relatively small.43 41. Another success of the SPSDP lies in the strong commitment and appreciation for coordination of a large number of government implementing agencies supported by external resources, particularly for the education component. This positive appreciation is in the context of the time, size of the Project (including expansion of several components from different resources), the number of components, and complexity of the project design. Due to the novelty of numerous initiatives under the SPSDP, no lessons were available from earlier projects on how to manage and administer a program of this size and complexity. In addition, time was another important constraint. As no detailed implementation rules and training of local 41 Knowles, James C., and James R. Marzolf. (no date). Health Financing for the Poor in Indonesia, paper prepared
for Regional Study on Pro-poor Health Financing. Washington, D.C.: World Bank. 42 The Loan Agreement was not signed until 7 October 1998. 43 This was certainly the case in comparison to some of the other social safety net programs such as distribution of
subsidized rice and public works.

14
implementation agencies could be developed prior to project implementation, the process was more learning by doing. Project implementation did improve during the second year.
4. Sustainability
42. Both the Program and Project are assessed as likely sustainable. Policies introduced under the program loan have been enhanced and expanded. Interventions and modalities initiated under the Project continue. Pro-poor policies providing access for the poor to essential social services introduced under the program loan are so widely accepted that they became political campaign platforms. For 2007, poverty reduction by expanding access to basic social services is set as the first development priority of the Government,44 which is undertaking a pro-poor budgeting exercise.45 The social sectors are receiving far greater absolute amounts and relative shares in national and regional/local budgets.46 Continuing SPSDP initiatives include (i) allocation of central government funding to local governments based on the poverty index, (ii) decentralization of decision making, (iii) provision of block grants to education and health services providers, and (iv) direct transfers to final beneficiaries via the post office. The latter two were adopted for distributing the fuel subsidy reduction compensation program (PKPS BBM) for education, while the direct transfers to final beneficiaries through the post office system was adopted for the direct cash transfer program to the poor, starting 1 October 2005. 43. In the field of education, the Government has expanded public support not just for the poor but to free 9 years of basic education for all, irrespective of whether they attend public, private, secular, or religious schools. Some of the initiatives introduced under the SPSDP are maintained. The education subsidy, known as BOS (Biaya Operasional Sekolah or school operating costs), compensates schools at Rp248,000 per primary school student for 28,649,545 students, and at Rp371,000 per junior secondary school student for 10,858,615 students. In 2006 the total allocation was Rp11.13 trillion. This program combines both the block grants and scholarships into one package allocated to schools. Under the program, all schools are given public subsidies to provide educational services and do not collect fees from students. Given the great variation in school quality and financial strength, however, not all schools were pleased with this program and the requirements for acceptance of the subsidy, i.e., they are prohibited from collecting fees from students although the latter could not be fully enforced. A rapid assessment of the SPSDP and the SPSDP PCR noted that scholarships often went to support school operations.47 The program is institution-oriented in that schools are given allocations based on the number of attending students, and thus does not include a policy to reach out to children who have dropped out and are more likely to be poor. The BOS program is universal compared with the targeting of the poor by SPSDP. 44. The health sector initiatives were also sustained, initially through the succeeding ADB-funded HNSDP followed by increased government commitment to the health and well-being of the poor, through increasing budgetary allocation.48 A recently completed evaluation assessment of the HNSDP confirms sustainability of the initiatives taken under the SPSDP to
44 As detailed in the 2007 Rencana Kerja Pemerintah (Government Work Plan). 45 One such example is the Governance Reform Support Project funded by the Canadian International Development
Agency. 46 Initially as fuel subsidy compensation, but increasingly as direct budgetary allocation as demanded by civil society
and achieved in an amendment to the Constitution. 47 Findings by Social Monitoring and Early Response Unit (SMERU). 2003. Pengamatan Cepat SMERU tentang
Permasalahan Pendidikan dan Program JPS, Beasiswa dan DBO di Empat Propinsi, Kasus di Kabupaten Pontianak, Kabupaten Tangerang, Kabupaten Sleman, dan Kabupaten Lombok Timur. {City}, and also acknowledged in the ADB PCR.
48 Since decentralization in 2001, the MOH budget rose as a share of the total national budget from 1.22% in 2001 to 2.55% in 2006, and is increasing as demanded by the amendment to the Constitution.

15
ensure access to quality basic health services to the poor, as the health cards and block grants continue to operate.49 B. Other Assessments
1. Impact and Outcome
a. Education and Health
45. School dropout rates, particularly among youth belonging to the poorest quintile, the target of the SPSDP, declined during the crisis: from 2.5% in 1998 to 1.7% in 2001 for elementary schools and from 1.8% in 1998 to 1.5% in 2001 for junior secondary (Appendix 5, para. 2, Figure A5.2). 46. Enrollment ratios were either maintained or rose, reflecting the rising value attached to education. Given that the SPSDP did not provide scholarships for primary school students, relatively constant total net enrollment ratios50 of around 92%–93%, while rising among the poorest quintile from 90% to 92% during the duration of the SPSDP, were an achievement, and were likely contributed to by the program. The block grants provided to primary schools prevented them from refusing children wanting to attend school even when they were not able to pay the fees. The scholarships and block grants for junior secondary schools show positive macro impacts as total net enrollment rose from 57% to 60%, and among the poorest quintile from 40% to 46% between 1998 and 2001, a significant achievement under very difficult economic conditions (Appendix 5, para. 3, and Figure A5.3). 47. The scholarship program specified at least equal access for girls, which could well have contributed to maintenance of the already, albeit still only slightly, higher enrollment rates among girls compared with boys, even among the poorest quintile. Thus, contrary to popular belief, even among the poorest quintile, enrolment rates of Indonesian girls already exceed that for boys at both primary and junior secondary. Net enrollment among primary school ages rose for boys from 89.9% in 1998 to 91.8% in 2001, for girls from 90.1% to 92.7%; and at junior secondary the rise for boys was from 38.8% to 44.7% and for girls from 41.2% to 47.2%. The gender gap is widening in favor of girls. As the use of net enrollment, which measures age and school level consistency, is indicative of academic performance, the higher rates for girls reflect better academic performance among girls than boys. This is supported by lower dropout rates among girls than boys belonging to the same poorest quintile—the primary school dropout rate in 1998 for boys was 2.7% and for girls 2.3%, by 2001 this was 2.0% for boys and 1.4% for girls. The junior secondary dropout rate was 2.3% for boys and 2.3% for girls in 1998, and 1.8% for boys and 1.4% for girls in 2001. More serious research on the issue is required. For ADB, there is a need to avoid stereotypical policies adopted in response to worldwide gender-based calls for action, as spelled out in the Millennium Development Goals. 48. For health indicators, life expectancy rose from 63.2 years in 1996, to 64.4 in 1999, and 66.2 in 2001. Infant mortality declined from 46 to 35 per 1,000 live births between 1995 and 2002 (Appendix 5, Figure A5.4). With regard to health cards, first introduced by the SPSDP and
49 ADB. 2006. Program Performance Evaluation Report on Health and Nutrition Sector Development Program in
Indonesia. Manila. 50 The net enrollment ratio is defined as the ratio between the number of students of relevant ages over the
population of relevant school ages. For example, the primary school net enrollment ratio is the ratio of primary school students aged 7–12 years over the population aged 7–12 years.

16
continued through the HNSDP and beyond, reports51 claim high health-card ownership by the poor. On the other hand, independent data collection sources (Biro Pusat Statistik [BPS], SUSENAS) show that for 2002–2004, some of the health cards were not owned by the poor. The poorest quintile held about 32% and the second poorest quintile another 24%; the remaining 44% were held by the non-poor, and the richest quintile held about 11%–10% (Appendix 5, para. 9 and Figure A5.5). Even though measured in terms of different criteria, those considered to belong to the lowest two categories of the National Family Planning Coordinating Board welfare groups are equivalent to the lowest 40% of the BPS welfare scale. A CIMU survey of health center records in 2001 noted that 92% of poor families had health cards, while based on households only 54% of health cards were held by the poor.52 The latter is rather similar to the SUSENAS results for the following 2 years. While the SPSDP provided assistance to health centers, national figures show that visit and contact rates to health centers53 by the poorest quintile of household members declined since the crisis. In 1997, 6.0% of the poorest quintile households visited health centers, in 2000 this was only 3.5%, and 2004 5%. Contact rates for the sick reached 27% in 1997, then declined until the lowest level of 15% in 2002; in 2004 the rate was 19% (Appendix 5, para. 10 and Figure A5.6). 49. The program paid special attention to mother and child health. However, the earlier tendency of rising visit and contact rates to modern health facilities/personnel by children under 5 years of the poorest quintile declined after the crisis from its height in 1997 (20% visit rate and 60% contact rate) to its lowest rate in 2002 (14% visit rate and 43% contact rate) to rise in 2004 (18% visit rate and 52% contact rate) (Appendix 5, figures A5.7 and A5.8). The safe motherhood program, which provides incentives for village midwives to reach out to pregnant women, can claim to have contributed to rising proportions of births attended by medical personnel (from 32% in 1991, 43% in 1997, to 55% in 2002 and 2003), while declining reliance on traditional birth attendants (from 64% in 1991, 54% in 1997, to 32% in 2002/03). This trend was also experienced among the poorest quintile, from 19% in 1993, 32% in 1997, to 43% in 2004 (Appendix 5, para. 12 and Figure A5.9). 50. For contraception, the SPSDP contributed to continuous rising user rates from 50% in 1991, 57% in 1997, to 60% in 2002/03. Reliance on injectables, supported by the SPSDP, rose from 12% in 1991, to 21% in 1997, to 28% in 2002/03. The injectables made available under the SPSDP seem to have strengthened a trend in preference of this type of contraceptive. Reliance on the pill and intrauterine device declined. Pill users declined from 15% in 1991 to 13% in 2002/03, and intrauterine device users dropped to half from 13% to 6% for the same years. The SPSDP, which focused on the poor, contributed to at least maintaining contraceptive user rates during the crisis at about 52%–53% and rising to 55% in 2004 (Appendix 5, para. 13 and figures A5.10 and A5.11). 51. Malnutrition prevalence among infants declined during the crisis from 1998 to 2000. Nutrition deficiency (< –2 standard deviations) declined from 29.5% in 1998 to 26.4% in 1999, and to 24.6% in 2000. Malnutrition (< –3 standard deviations) declined from 10.5% in 1998 to 8.1% in 1999, and to 7.5% in 2000. However, prevalence rose again after 2001, concurrent with
51 Department of Community Nutrition and Family Resources, Faculty of Agriculture, Bogor Agricultural University.
2003. Evaluation Study of the Health and Nutrition Sector Development Program. Manila recorded 89.3% (based on data from the National Secretariat of the Social Safety Net Program in Health (2003), but based on puskesmas data, the average is about 87.7%. The ADB PCR states more than 80% of poor families received health cards.
52 ADB. 2002. National Survey Final Report. Manila (11 April, TA 3175-INO, CIMU for the HNSDP). (www.cimuhealth.or.id)
53 Visit rates are measured as the percentage of all people who visit medical services or personnel, while contact rates are measured in terms of the percent of people who complain of ill health during the week preceding the survey and contact medical services or personnel.

17
the completion of the supplementary food delivery and implementation of decentralization (Appendix 5, para. 14 and Table A5).
b. Impact on Institutions
52. Institutional development and other impacts were highly significant. The SPSDP promoted innovations such as block grant funding, direct fund flows, decentralized decision making, nongovernment participation, and independent monitoring. It also helped to elevate poverty reduction and open and accountable governance to the forefront of policy. The SPSDP was the trigger for institutionalizing further pro-poor policy reforms. Indonesia has completed a poverty reduction strategy paper.54 BAPPENAS was restructured and appointed a deputy for poverty, employment and microcredit with one of the directors assigned to dealing with poverty. 53. The SPSDP promoted decentralized management in education, while also supporting health, nutrition, and family planning components, which helped prepare for more thorough devolved management in later years. Decentralized management of the health, nutrition, and family planning components received greater support by the HNSDP. It introduced an unprecedented amount of decentralized decision making. Although the work done on a related TA55 could have served as the basis on which more efficient models for social services management could be built, over time political dynamics prevented implementation of the model on a wider scale.
c. Socioeconomic Impact
54. The crisis brought poverty reduction to the center of the policy agenda and the SPSDP helped to demonstrate that something could be done about it. The SPSDP helped establish the principle of positive discrimination or affirmative action in favor of the poor. This principle is now widely accepted in the funding formula for decentralized allocations from the center to districts. Poverty reduction is a major priority development agenda with expansion of access of the poor to basic infrastructure. 55. Even though prior to the economic crisis, the stated social policies were directed to reducing poverty and extending access to basic social services, few practical measures were taken to implement these policies. The SPSDP was a breakthrough, the first to explicitly reach the poor. Assuming that the crisis affected the poor the most, the SPSDP was designed to directly provide essential services that favor the poor. Despite problems in identifying target populations and occasional anomalies in the selection of beneficiaries, most of the benefits provided under the SPSDP did reach the poor and vulnerable members of society. Access to education and basic health provision was maintained for the poor.
d. Environmental Impact
56. The SPSDP did not have any environmental impact. As no construction was carried out under the SPSDP, it had no intervention that directly affected the environment nor did any adverse social impacts resulting from resettlement.
54 Republik Indonesia, Komite Penanggulangan Kemiskinan. 2005. SNPK, Strategi Nasional penanggulangan
Kemiskinan. Japarta (September). 55 ADB. 1998. Technical Assistance to the Republic of Indonesia for Capacity Building for Decentralized Social
Services Delivery. Manila.

18
2. Asian Development Bank Performance
57. ADB performance is rated highly satisfactory. The much larger $2.8 billion package to mitigate the adverse consequences of the Asian economic crisis on the poor, which includes this SPSDP and follow-up HNSDP, reflects ADB’s sensitivity to a client country’s desire to prevent a reversal of social development progress made over preceding decades. The Program was designed and implemented in record time, with the introduction of numerous novel interventions. This required strong cooperation with, and support from, Indonesian government officials. This was achieved through frequent missions, eight supervisory missions in 30 months, resulting in 149 recommendations initiating follow-up actions beyond those specified in the policy matrix covenants. The Government, was appreciative of this intensive project supervision and frequent communication:
“The ADB staff always professionally initiated the interchanges concerning the various issues identified during project supervision. They demonstrated superior ability to understand intricate nuances of the Indonesian work culture, even as they proactively tried to insure the success of the project. They were respectful and after pointing out problems, left the solutions to be solved by the Government using its own decision-making process.”(footnote 32)
58. Despite the hard work and mutual cooperation and respect of all the stakeholders, a number of bureaucratic hurdles were difficult to overcome. A major problem in project implementation was delays in replenishing the imprest account. Since education was given priority (because of the academic year), the health sector components suffered the consequences. Hence delays were suffered by mothers who did not receive their allowed 3 months of supplemental food, poor children with interrupted food supplements, and the poor who could not utilize health services.
3. Borrower Performance
59. The performance of the Government and Executing Agency was highly satisfactory, particularly in light of the economic, fiscal, and sociopolitical turmoil occurring in the country. Success of the SPSDP was in large part due to the Government’s sustained commitment to providing basic social services to the poor. It was through the SPSDP that the Government introduced basic policy changes, including explicitly targeting the poor for basic social services, and embarking on the difficult path to democracy with good governance. This meant a role for civil society in decision making, transparency, and coping with accountability, while devolving budgetary and decision-making responsibilities to local governments and parliaments. 60. The Borrower ensured the necessary budgetary provision thereby preventing the collapse of education and health services, particularly those serving the poor. Against normal practice, MOF demonstrated considerable flexibility when signing a memorandum of agreement with PT Pos agreeing to a fund-flow mechanism that bypassed its conventional public expenditure system through the State Treasury. The division of MOF in charge of disbursement was cooperative throughout SPSDP implementation and amenable to changes and modifications when needed. 61. BAPPENAS played a crucial role in developing the SPSDP. Key officials in BAPPENAS showed great commitment to the aims and innovative design features of the SPSDP, allowing design completion in record time of less than 1 month for overall preparation. With no experience and no relevant lessons from past programs or projects, the novel initiatives introduced under the SPSDP and the demand for different implementation organization structure were bound to complicate implementation. The crisis ensured all stakeholders

19
cooperated and were willing to explore and adapt new ways of doing things, thereby ensuring SPSDP success. 62. An important achievement to be noted is the Government’s commitment to the Project as reflected in the higher share of its contributions to overall project funding. Instead of a 40% or $133.33 million of $333.33 million agreed during appraisal, the Government actually contributed 47% or $165.36 million of $352.88 million in total project costs.
4. Technical Assistance
a. TA for Monitoring and Evaluating the SPSDP
63. The purpose of the TA, at an estimated cost of $1,725,000, was to develop a comprehensive project performance monitoring system. It is rated as successful. This enabled the Government and ADB to continuously assess progress, identify constraints, and adjust delivery mechanisms to improve SPSDP efficiency, and to evaluate the effectiveness of SPSDP strategies with the intention of subsequent refinement and institutionalization. 64. The TA was executed by the British Council selected by ADB through ICB to provide the necessary consulting services. Commencing in April 1999, the British Council together with NGO partners established CIMU, based in MOEC56 with monitoring units in all provinces and reporting to the National Review Board chaired by BAPPENAS. CIMU provided highly relevant and unprecedented independent monitoring of a government program. This helped to improve transparency and reduce leakage, mis-targeting and corruption. 65. The wealth of documentation from surveys and case studies that systematically charts the progress of the SPSDP in its monthly and quarterly reports was effective in providing a vital safeguard through much-needed information and feedback to program management both at the center and in the field. 66. The monitoring and evaluation activities carried out under the TA were done in a highly efficient manner, providing timely feedback during project implementation. This allowed modification of implementation practices when necessary, thereby contributing to success of the overall SPSDP. 67. Irrespective of the TA’s successes, which led to its extension from the initial 18 months to 3.25 years with cofinancing from AusAID, the TA remained a project housed in MONE. As a project, the activities and the institution of CIMU are unlikely to be sustained. While the strength and value of CIMU are well recognized among the bureaucracy and other stakeholders, due to the nature of projects, there is no recognizable impact on institutional development, not even in MONE, where the project was housed.57 Even those closely related to the project have been assigned to other projects with different rules and regulations. Moreover, the CIMU’s 15th quarterly report (January 2003) noted the following when it was winding down its activities and the oil subsidy program took over the Scholarships and Grants Program:
It is now apparent that decentralized funding arrangements have not [author’s emphasis] empowered most districts to raise the level of non-salary expenditure reaching schools. There are concerns over the efficacy of targeting of the oil
56 MOEC became the Ministry of National Education (MONE) in 2000. 57 Over time, the CIMU’s extensive documentation, the wealth of information and lessons identified, will be
increasingly difficult to obtain as MONE’s policy reallocates office space to other projects. Regrettably, MONE has no tradition of archiving documents for future research and reference. OED is exploring whether it could archive this database.

20
subsidy program, over its effectiveness in tackling problems of access and quality, and over the adequacy of safeguards against leakage. The aim of the program appears more related to distribution of funds than to their impact.
68. Given the strength of the implementation design of the monitoring, it is unfortunate that the project is not sustained. The processes and procedures, including organization and management, developed under the CIMU, independent performance monitoring system have not been institutionalized. The successes of the monitoring were appreciated by those implementing it, but they were not publicized by the Government or ADB. The positive lessons have not been identified and disseminated.
b. TA for Capacity Building for Decentralized Social Services Delivery
69. The purpose of the TA, costing $1,035,000, was to support the government’s efforts to decentralize management of social services delivery to improve efficiency and quality. The TA is rated highly relevant, effective, efficient, likely sustainable, and thus overall successful. The TA was well formulated to generate information rapidly to be used for replicating interventions in several districts and training programs. The ADB task managers provided valuable guidance to consultants and MONE through frequent missions. The Indonesia Resident Mission provided valuable assistance in solving issues arising during TA implementation. The TA made significant contributions to (i) informed policy decisions in the decentralized education sector; (ii) development and testing of resource allocations to schools by district authorities, which were later adopted by Decentralized Basic Education Project (DBEP);58 and (iii) establishment of district education boards and school committees, and development of school-based management approaches. 70. The TA was highly relevant for it was tasked with developing funding and organization mechanisms to facilitate the provision of basic social services in line with ongoing implementation of the decentralization law in January of 2001. 71. The TA was effective as it focused on the management of education. It made three significant contributions: (i) provided a clear commentary on the complex and often confusing policy developments, and provided inputs into important policy decisions within the education sector; (ii) developed and tried practical methods for district financing of schools together with associated capacity-building measures; and (iii) made major contributions to the debates about district education boards and school committees to the development of policies promoting school-based management. 72. The TA was efficiently conducted. It succeeded in testing the objectives in willing and less eager local governments to arrive at an accepted simple model of consolidated school budgeting. 73. The TA produced practical models for development under DBEP in West Nusatenggara and Bali. The results are likely sustained and practiced in other districts of the country. The TA initially contributed to institutional development through its inputs into policy decisions within the education sector, and to ongoing and continuing debates about district education boards and school committees, and policies promoting school-based management. However, the dynamics of the decentralization process are not conducive to overall institutionalization of the model.
58 Loan No. 1863-INO: Decentralized Basic Education Project approved on 29 November 2001 for $100 million.

21
c. TA for Capacity Building for Planning and Evaluating Programs for Street Children.
74. The aim of the TA, valued at $575,000, was to help the Government respond more effectively to the anticipated increase in the number of street children during the crisis. The TA is rated highly relevant, highly effective, highly efficient, and likely sustainable, thus the overall rating is highly successful. The TA benefited from valuable guidance from the headquarters’ task manager to the consultants and MOSA through frequent reviews and quarterly review missions of the SPSDP. The Indonesia Resident Mission dealt with issues that arose during TA implementation. The choice of a local academic institution with an experienced social science unit and adequate capacity contributed to the success of the TA, which played an important role in guiding and informing the development and implementation of a larger strategy for street children under the SPSDP and HNSDP. The TA also provided a comprehensive approach involving the community, taking into account the special needs of girl street children. Even though the Government no longer prioritizes the use of loans for street children programs, many NGOs are now able to raise their own funds for their activities. 75. The Social Development Institute of Atma Jaya University assigned to implement this TA produced highly relevant information on (i) the situation of street children in 12 major cities in Indonesia, (ii) an evaluation of the open houses, and (iii) recommendations on how to take care of children in need of special protection. 76. The TA was highly effective in reaching its objectives, particularly through the outcome of its social mapping of street children, spelling out and establishing the concept of open houses, and providing detailed policy recommendations on how to take care of children in need of protection. The TA completion report rated this TA as highly successful for its essential role in guiding and informing the development and implementation of the larger strategy for street children in the SPSDP and HNSDP. However, the HNSDP PPER rated this component as less effective. 77. The assignment was carried out in a highly efficient manner, accepted by MOSA and participating NGOs working with street and neglected children. Committed stakeholders acknowledged significant and timely benefits of the TA and were continuing to make use of the lessons under the TA at time of the OEM field work. 78. Outputs of the TA are likely to be sustained. The OEM visited open houses around Jakarta, where social mapping to estimate the needs of street children continues to be practiced as earlier developed under the TA. Vocational training developed under the TA is also continuing and has been further developed to cover a greater variety of training needs of recruited street children. 79. The TA succeeded in setting the foundations for continuing institutional development for a number of NGOs managing open houses around the greater Jakarta Metropolitan area that participated under the TA. These NGOs operate independent of MOSA, successfully mobilizing financial support from international and domestic aid agencies based on proposals spelling out programs to monitor the development of street children under their care.
IV. ISSUES, LESSONS, AND FOLLOW-UP ACTIONS
A. Issues
80. While the extension of block grants was a successful innovation, insufficient directives were available for the use of these funds and hence they lack transparency and accountability.

22
This is currently a problem as the Government continues this innovation in distributing fuel compensation subsidies to schools to provide free basic education for all. Block grants to schools are extended to public and private schools, as well as to MONE and MORA schools. The block grants to schools to cover operating expenses and direct and indirect student expenses or scholarships constitute far larger amounts than made available under the SPSDP. Yet schools are still allowed to collect a variety of fees from students on the grounds that operating expenses for quality education still exceed the block grants. No legal provisions and sanctions have been developed for the use of these block grants to either public or private schools. Neither are there rules or regulations as to whether the foundations owning private schools are allowed to collect and retain the funds or not, even though religious private schools usually cross-subsidize between students. The continuous supply-side orientation without outreach requirements for schools will remain detrimental for the poor who for financial reasons are forced to drop out. 81. A number of macro outcome health indicators show continuous improvements, including during the crisis. The SPSDP and the follow-up HNSDP provided block grants to health centers to extend outreach services by village midwives and referrals to health cardholders focusing on mother and child services. A convincing achievement is the rise in births attended by doctors and midwives, particularly among the poorest quintile. On the other hand, data on the use of health centers by poor families or households are conflicting. While health centers claim more than 90% utilization rates by poor families, independent survey data by BPS through the annual SUSENAS and a household survey for the independent monitor CIMU recorded only around 55% of health cardholders are poor, belonging to the lowest 40%. In addition, visit and contact rates by under 5-year olds declined during the crisis. This raises the question of the effectiveness of health centers to provide services for the poor as they do not generally actively provide outreach to the community. A concern is that the current health insurance scheme for the poor does not incorporate the successes of the outreach program by village midwives. In addition, debilitating diseases often suffered by the poor, such as tuberculosis and malaria, are not attended to in health programs aimed at the poor. 82. Even though the nutrition component of the SPSDP experienced several difficulties during implementation, such as the difficulty of placing orders and later problems resulting from delayed replenishments of funds by ADB, the supplementary feeding program for infants, children, and pregnant mothers succeeded in reducing malnutrition prevalence among infants. Claims have been made that discontinuation of the program combined with decentralization in 2001 contributed to rising malnutrition prevalence among infants. Even though the design of a future urban nutrition project by ADB funding has been completed, more speedy interventions are required. 83. The street and neglected children component recorded successes in providing financial assistance and TA for formal education and training with the help of social workers and other staff in open houses or drop-in centers established by NGOs. Some of these centers were established because of availability of financial assistance. Centers where the leadership is not able to continue finding alternative sources of funds are not sustainable yet widespread poverty means the need for these centers remains while no continuation of the program is available. 84. The striking difference in the government’s financial commitment to the education sector and the combined health, nutrition, and family planning sector raises questions about the composition of the SPSDP. In the education sector, the total project financial commitments rose from $128.83 million at appraisal to an actual $211.86 million or an increase of $83.03 million. The government’s share rose from $39.55 million to $112.27 million or an increase of $72.72 million and the ADB share rose from $39.28 million to $99.59 million or an increase of $10.31 million (Appendix 1). At appraisal the health, nutrition, and family planning sector was estimated

23
to require a total of $132.94 million. The Project actually spent $113.66 million. Of this total, ADB’s share increased by $0.63 million, while the government’s share declined by $19.91 million. The much higher financial commitment by the Government for the education component of the SPSDP may be attributed to design, implementation preparedness, and commitment of the relevant stakeholders. The health sector suffered from complexity of design, slow implementation preparation, and during implementation a follow-up program became available, i.e., the HNSDP. If so, in hindsight, the wisdom of the SPSDP could well be called into question. Should the SPSDP have continued as a two-sector investment, both very complicated, and charted unknown territory at a time of fundamental sociopolitical turmoil and changes? Or, should the two sectors have been separated into different loans? As a consequence of the combination, the overall SPSDP rating suffers. If separated then at least the education project would have been rated highly successful. However, the overall SPSDP is now rated successful due to the weaker components in health, nutrition, and family planning. 85. The Indonesian Government, particularly BAPPENAS, made an attempt to publicize the successes of the SPSDP through its publication, Social Safety Net, Providing Hope to Indonesia’s Underprivileged in 2004, with financial assistance from ADB and AusAID. However, only limited numbers were printed and no public launching or publicity was provided. B. Lessons
86. The urgency of the situation, when the economic crisis turned into a total crisis including a regime change and rapidly spreading poverty, created an enabling environment and allowed the introduction of novel policies and implementation practices. Those promoted under the SPSDP include
(i) a poverty focus to mitigate adverse socioeconomic consequences of the economic crisis on the poor in public policy;
(ii) decentralized decision making in selecting beneficiaries by multisector district and local coordinating committees with community participation;
(iii) block grants to schools, health centers, and village midwives supplemented with full authority to plan and utilize the funding according to their respective needs;
(iv) direct transfer of funds to beneficiaries through the post office system ensuring rapid transfer of funds to end users in a way that avoided leakages associated with the normal channels; and
(v) program safeguards through information dissemination and program socialization; establishment of operating complaint resolution units; and
(vi) establishment of independent monitoring units to ensure transparency and accountability of the entire activity, from selection of beneficiaries, including funding allocation and disbursement, up to program management.
87. These policies were introduced for the first time with strong support from various agencies, institutions, and individuals; all willing to cooperate and work hard toward a common goal of avoiding loss of access to basic social services by the poor. The crisis conditions created a willingness to explore and be challenged, and take the necessary risks of going beyond the call of duty and common practice. The stakeholders were willing to introduce novel policies and practices, and to seek cooperation from horizontally and vertically related implementing agencies as required under decentralization, instead of earlier practices of issuing decrees to obtain compliance from other agencies. Because of the total economic, political, and social crisis, it was not the time to take a “business as usual” approach. 88. An important lesson is to avoid overly optimistic assumptions on the speed of bureaucracies to react even under crisis conditions. The beneficiaries of the complementary and

24
supplementary feeding program suffered from discontinuation and/or interruptions in their program arising from delays in procurement, which in turn was caused by delays in replenishment of the imprest account. The project design assumed only 2 months for fund release, distribution, and replenishment; while in fact the process took 9 months to complete. These delays were contributed by all major institutions involved in the SPSDP: BAPPENAS, MOF, MOH, MOSA, PT Pos, and ADB. Delays were, for instance, caused by incomplete administration at the beneficiary level. Beneficiaries were not always aware that they wererequired to prepare and provide reports. Such initial delays created a chain reaction of delays at later stages and finally delays in replenishment of the imprest account. 89. Success is no guarantee of sustainability. Although successful, the and highly valued independent monitoring processes and procedures of project implementation developed under CIMU were not sustained. This suggests that projects should be designed to provide the possibility of sustaining those parts or components that are widely valued by its stakeholders. 90. The crisis situation allowed for fast-track processing, avoiding project preparatory TA preparation in favor of a small-scale TA. Given these prevailing circumstances, it should not be surprising that there was a less than complete attention to all details prior to approval. However, this was compensated for by a strong project administration efforts. 91. In regard to the scholarship component, the Project applied a stereotypical gender requirement, ensuring equal distribution between boys and girls on the assumption that without such affirmative action in favor of girls, they will be prevented from attending school. The reality is, however, that girls are already more likely than boys to be attending school at the right level for their age (as measured in terms of net enrollment ratios) and the gender gap is widening in favor of the girls. 92. Whether the successes achieved under the SPSDP can be replicated in today’s Indonesia is questionable. The SPSDP was designed, executed, and completed under a still highly centralized regime right before decentralization took effect in January 2001. Decentralization has resulted in fundamental changes in the structure of power relations between central and local governments and between the executive and legislative branches of government. The strength of the SPSDP lies in the commitment of the numerous stakeholders in charge of the overall project from design to implementation. In the end, program success is highly dependent on leadership. Since some of the achievements can be attributed to the successes of the independent monitoring unit, in the case of the SPSDP as a separate TA, future social sector programs could benefit from a similar independent implementation monitoring unit. As the data collected under this component are regrettably not stored and may even be disposed of, a way of archiving such valuable information for future reference should be included in future designs. C. Follow-Up Actions
93. No follow-up actions are recommended as the education sector has been superseded by an amendment to the Constitution requiring an allocation of 20% of the national and local budgets to education, and the health sector components have been followed up by the HNSDP. 94. While the successes of the monitoring and evaluation TA carried out under CIMU could not have been anticipated at the start, the system needs to recognize and possibly modify the project design allowing for institutionalization and thus sustainability instead of complete closure and consequent disposal of valuable information and data, the basis for lessons on implementation monitoring and evaluation. The Government, with ADB assistance, if required,

25
should secure all CIMU-generated data and to make this publicly available via the internet. Files should be safely archived for future use. 95. Stereotypical gender project designs with respect to affirmative action in education should be avoided. This suggestion is made in regard to the requirement of affirmative action favoring girls in the distribution of scholarships for primary and junior secondary, when girls were already doing better than boys and have been for some time. Project designers should be aware that gender imbalance can be the reverse of what is normally expected. In Indonesia, case, a study on gender in education is needed to identify why boys are increasingly being left behind in schools.

26 A
ppendix 1
COST BREAKDOWN BY PROJECT COMPONENT ($ million)
Appraisal Actual
Total Project Cost ADB Financing Government Financing ADB Gov’t
Component Foreign
Exchange Local Cost
Total Cost
Foreign Exchange
Local Cost
Total Cost
Foreign Exchange
Local Cost
Total Cost
Foreign Exchange
Local Cost Total Local
Cost Total Cost
A. Base Costs 1. Education
Block Grant for
Primary and Junior Secondary Schools
14.00 67.56 81.56 14.00 32.68 46.68 0.00 34.88 34.88 12.05 28.11 40.16 30.40 70.56
Scholarships for
Junior Secondary Students
0.00 45.07 45.07 0.00 40.60 40.60 0.00 4.47 4.47 0.00 56.88 56.88 78.63 135.51
Urban
Street/Working Children
0.20 2.00 2.20 0.20 1.80 2.00 0.00 0.20 0.20 0.25 2.29 2.55 3.24 5.79
Subtotal (A1) 14.20 114.63 128.83 14.20 75.08 89.28 0.00 39.55 39.55 12.30 87.29 99.59 112.27 211.86
2. Health
Development of Managed Care
0.02 0.40 0.42 0.02 0.18 0.20 0.00 0.22 0.22 0.03 0.24 0.27 17.03 17.30
Block Grants for Health Center
3.32 34.60 37.92 3.32 9.95 13.27 0.00 24.65 24.65 3.14 9.43 12.58 14.80 27.38
Safe Motherhood
(health center and village midwives)
2.74 15.42 18.16 2.74 8.23 10.97 0.00 7.19 7.19 2.82 8.47 11.29 3.70 14.99
Subtotal (A2) 6.08 50.42 56.50 6.08 18.36 24.44 0.00 32.06 32.06 5.99 18.14 24.14 35.53 59.67
3. Nutrition
Nutrition
Surveillance System
0.24 2.27 2.51 0.24 2.02 2.26 0.00 0.25 0.25 0.23 2.08 2.31 0.51 2.82
Infant Feeding 1.76 4.77 6.53 1.76 4.12 5.88 0.00 0.65 0.65 1.13 2.64 3.77 8.82 12.59
Supplementary Feeding (children under 3 and pregnant women)
5.86 19.38 25.24 5.86 13.67 19.53 0.00 5.71 5.71 5.89 13.74 19.63 0.00 19.63
Primary School Feeding Program
0.00 26.56 26.56 0.00 0.00 0.00 0.00 26.56 26.56 0.00 0.00 0.00 0.00 0.00
Subtotal (A3) 7.86 52.98 60.84 7.86 19.81 27.67 0.00 33.17 33.17 7.25 18.46 25.71 9.33 35.04

Appendix 1 27
Appraisal Actual Total Project Cost ADB Financing Government Financing ADB Gov’t
Component Foreign
Exchange Local Cost
Total Cost
Foreign Exchange
Local Cost
Total Cost
Foreign Exchange
Local Cost
Total Cost
Foreign Exchange
Local Cost Total Local
Cost Total Cost
4. Family Planning
Supply of Injectable
Contraceptives 14.05 1.55 15.60 14.05 0.00 14.05 0.00 1.55 1.55 16.94 0.00 16.94 2.01 18.95
Subtotal (A4) 14.05 1.55 15.60 14.05 0.00 14.05 0.00 1.55 1.55 16.94 0.00 16.94 2.01 18.95
5. Implementation Social Awareness, and Project Implementation and Monitoring
0.38 11.44 11.82 0.38 3.44 3.82 0.00 8.00 8.00 0.23 2.36 2.59 6.22 8.81
Subtotal (5) 0.38 11.44 11.82 0.38 3.44 3.82 0.00 8.00 8.00 0.23 2.36 2.59 6.22 8.81 6. Taxes and Duties 0.00 2.34 2.34 0.00 0.00 0.00 0.00 2.34 2.34 0.00 0.00 0.00 0.00 0.00 Subtotal (A) 42.57 233.36 275.93 42.57 116.69 159.26 0.00 116.67 116.67 42.72 126.25 168.97 165.36 334.33
B. Contingencies
Physical Contingencies
2.91 16.73 19.64 2.91 8.07 10.98 0.00 8.66 8.66 0.00 0.00 0.00 0.00
Price Escalation 2.97 16.24 19.21 2.97 8.24 11.21 0.00 8.00 8.00 0.00 0.00 0.00 0.00 Subtotal (B) 5.88 32.97 38.85 5.88 16.31 22.19 0.00 16.66 16.66 0.00 0.00 0.00 0.00 0.00
C. Interest/Other Charges during Implementation
18.55 0.00 18.55 18.55 0.00 18.55 0.00 0.00 0.00 18.55 0.00 18.55 18.55
Total Project Cost 67.00 266.33 333.33 67.00 133.00 200.00 0.00 133.33 133.33 61.27 126.25 187.52 165.36 352.88 ADB = Asian Development Bank, Gov’t = Government. Source: Operations Evaluation Mission.

28 A
ppendix 2
UPDATE ON THE POLICY MATRIX
Policy Priorities
Conditions Fulfilled by Loan
Effectiveness (14 Jul 1998) for First Tranche Release
Conditions Fulfilled by 15 Feb 2000 for Second and Last Tranche Release
Current Status at Program Completion
Review Mission (Nov 2002) Status as of PPER 2006
A. Education
1. Maintain Education Participation Rates
a. Extend scholarship program for poor students and improve targeting.
• The Ministry of Education and Culture (MOEC) and Ministry of Religious Affairs (MORA) authorized districts/subdistricts to approve allocation of scholarships for poor students to schools, and school scholarship communities to select individual beneficiaries.
• MOEC and MORA extended coverage of junior secondary scholarships allowing students beginning their studies under the Social Protection Sector Development Program (SPSDP) to complete 3 years of junior secondary education.
• MOEC and MORA adopted
a formula linking amount of scholarship to cost of attending school.
• The Government arranged
necessary budget resources enabling scholars beginning studies under the SPSDP to complete junior secondary education.
• Collaboration with the Government and the World Bank allowed the scholarships program to be extended for 5 years.
• In spite of decentralization (Law No. 22) implemented since 2001, when local governments allocated less to schools than previously received from the central Government before decentralization causing rising education costs to parents, enrollments continued to rise, especially among the poorest quintile.
• The share for education is
to increase in both national and local budgets to 20% over and above salaries (Law No. 20, 2004). This goal is hoped to be reached by 2009.
• In the meantime, earlier
scholarships have been replaced by block grants to all schools (public, private, secular, and religious) allowing all children free education starting in 2005.

Appendix 2 29
Policy Priorities
Conditions Fulfilled by Loan
Effectiveness (14 Jul 1998) for First Tranche Release
Conditions Fulfilled by 15 Feb 2000 for Second and Last Tranche Release
Current Status at Program Completion
Review Mission (Nov 2002) Status as of PPER 2006
b. Reduce costs to poor students.
• MOEC and MORA allowed individual schools to decide whether students must purchase uniforms, and if required, to purchase uniforms by the most economical means available.
• The reduction of school fees and the waiving of the requirement for students to wear uniforms lifted some of the cost barriers to continuation in school, but the private costs of education remain high.
• Poverty is one of the variables in the formula to distribute the General Allocation Fund to local governments.
• Basic education is now free in Indonesia. Starting in January 2006, the BOS (Biaya Operasi Siswa, student operating costs) is made available to all primary and junior secondary schools—public, private, secular, and religious—under MOEC and MORA) to provide free education.
• Schools are given Rp19,500
per primary school student/month and Rp27,000 per junior secondary school student/month (If schools were collecting less than this allocation, they can keep the full amount. If, however, they were already charging higher fees, they are supposed to only collect the difference between the fee and the allocation).

30 A
ppendix 2
Policy Priorities
Conditions Fulfilled by Loan
Effectiveness (14 Jul 1998) for First Tranche Release
Conditions Fulfilled by 15 Feb 2000 for Second and Last Tranche Release
Current Status at Program Completion
Review Mission (Nov 2002) Status as of PPER 2006
c. Remove barriers to enrollment for poor students.
• MOEC and MORA directors general circular waived the primary school leaving examination as a requirement for entry into junior secondary school in 1998/99 and 1999/00, and authorized primary school principals to give students who were unable to take the examination a letter of recommendation for entry into junior secondary school where the students’ performance merits this.
• Regrettably, at the end of academic year 2005/06, the Government reinstated the requirement to pass the national final examination (Ujian Nasional) at the end of the cycle as a requirement to continue to the next stage.
d. Develop an incentive program for schools to maintain enrollment.
• MOEC, MORA, and Ministry of Home Affairs (MOHA) issued directors general circular establishing an incentive program to reward schools that reduce their dropout rates by an agreed percentage.
• Funds were budgeted for
2000/01 to test and evaluate the scheme in selected districts (kabupatens) with high dropout rates.
• Schools maintained enrollment through block grants provided to them.
• The provision of BOS to all schools is a guarantee for schools to maintain and even increase enrollment as the overall value given to a school is student based.
• Enrollment rates continue to rise especially for the poor; for the poorest quintile primary net enrollment ratios rose from 90% in 1998 to 92% in 2004 and forjunior secondary from 40% in 1998 to 50% in 2004.

Appendix 2 31
Policy Priorities
Conditions Fulfilled by Loan
Effectiveness (14 Jul 1998) for First Tranche Release
Conditions Fulfilled by 15 Feb 2000 for Second and Last Tranche Release
Current Status at Program Completion
Review Mission (Nov 2002) Status as of PPER 2006
2. Maintain Quality of Education
a. Maintain basic education budget.
• The Government maintained overall development budget allocations to education as a share of the national development budget for FY1999 at least at the same level as the revised FY1998 budget.
• The Government
maintained share of basic education operating budget in the FY1999 education budgets in comparison with the revised FY1998 level.
• The Government maintained overall development budget allocations to education as a share of national development budget for FY2000 at least at the same level as the FY1999 budget as revised in June 1998.
• The Government maintained share of basic education operating budget in the FY2000 education budget in comparison with the FY1999 level (as revised in June 1998).
• The Government maintained the budget devoted to education in nominal terms, although rising prices reduced education expenditure in real terms.
• The education budget (in absolute and relative terms) has been increased significantly since this SPSDP.
• The share for education is
to increase in both national and local budgets to 20% over and above salaries (Law No. 20, 2004). After extensive demonstrations by the teachers union, implementation of this law has the support of Parliament.
• While the current
Government hopes to achieve this by 2009, there are doubts that this goal canbe reached in time.
• The current discourse by
the DPD (Dewan Perwakilan Daerah, the senate) is to revise the law to follow the 1945 Constitution, which states that the overall education budget should reach 20%, i.e., inclusive of salaries.

32 A
ppendix 2
Policy Priorities
Conditions Fulfilled by Loan
Effectiveness (14 Jul 1998) for First Tranche Release
Conditions Fulfilled by 15 Feb 2000 for Second and Last Tranche Release
Current Status at Program Completion
Review Mission (Nov 2002) Status as of PPER 2006
b. Increase resource allocation to schools in poor communities.
• The Government established a working group that developed funding allocation mechanisms for a greater share of resources to schools in poor communities based on an objective measure of poverty.
• The Government issued the necessary administrative orders that established a funding allocation mechanism linking central government resource allocation to schools with a district poverty index based on objective criteria starting from school year 2000/01.
• The principle of prioritizing expenditure in favor of poorer communities in resource allocation has now been established. government programs now routinely allocate more resources to the poorer areas. Following decentralization, the allocation of the annual recurrent budget is now worked out against a formula favorable to poorer districts.
• With the universal BOS allocation, particularly schools in poor communities have suddenly received resources (January 2006) to levels never experienced before, resulting in a different concern of moral hazard or misuse of funds by school administration.
• A recent government intervention (late 2005) to improve the quality of Indonesian education is the introduction of a new directorate general in the Ministry of National Education: Quality Improvement of Teachers and Education Personnel. The priority of this directorate general is to improve the quality of teachers, their competency, welfare, and geographic distribution.
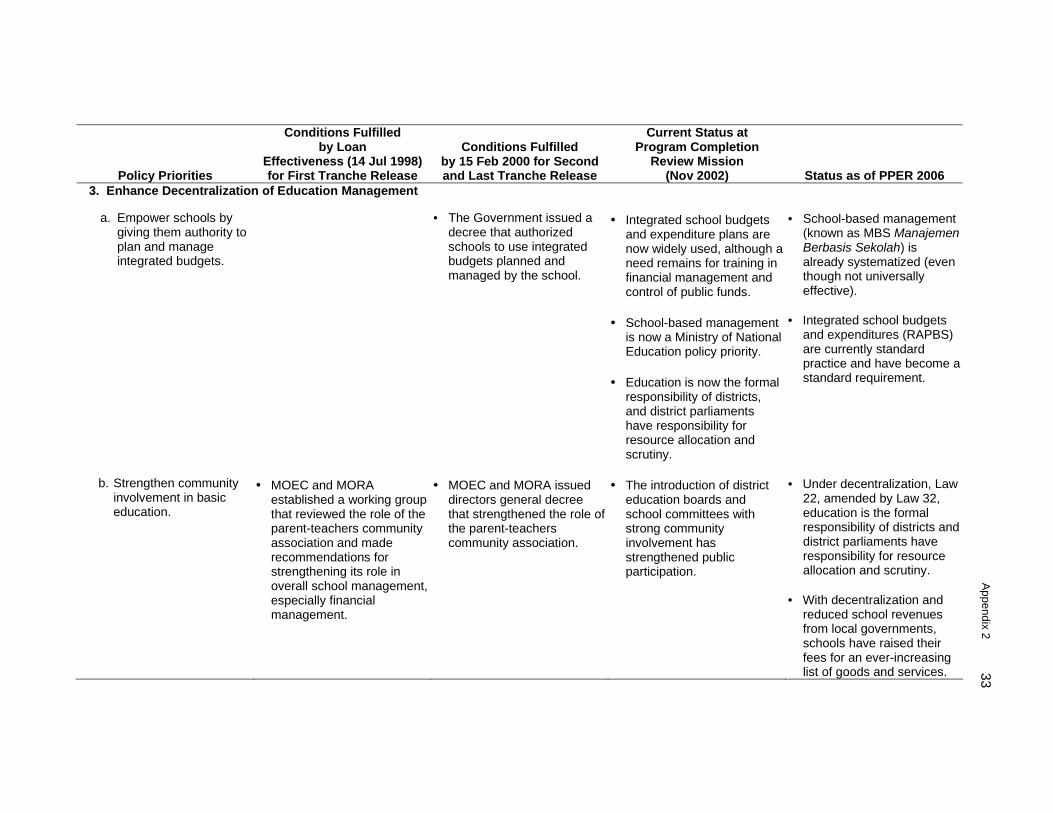
Appendix 2 33
Policy Priorities
Conditions Fulfilled by Loan
Effectiveness (14 Jul 1998) for First Tranche Release
Conditions Fulfilled by 15 Feb 2000 for Second and Last Tranche Release
Current Status at Program Completion
Review Mission (Nov 2002) Status as of PPER 2006
3. Enhance Decentralization of Education Management
a. Empower schools by giving them authority to plan and manage integrated budgets.
• The Government issued a decree that authorized schools to use integrated budgets planned and managed by the school.
• Integrated school budgets and expenditure plans are now widely used, although a need remains for training in financial management and control of public funds.
• School-based management
is now a Ministry of National Education policy priority.
• Education is now the formal
responsibility of districts, and district parliaments have responsibility for resource allocation and scrutiny.
• School-based management (known as MBS Manajemen Berbasis Sekolah) is already systematized (even though not universally effective).
• Integrated school budgets
and expenditures (RAPBS) are currently standard practice and have become a standard requirement.
b. Strengthen community involvement in basic education.
• MOEC and MORA established a working group that reviewed the role of the parent-teachers community association and made recommendations for strengthening its role in overall school management, especially financial management.
• MOEC and MORA issued directors general decree that strengthened the role of the parent-teachers community association.
• The introduction of district education boards and school committees with strong community involvement has strengthened public participation.
• Under decentralization, Law 22, amended by Law 32, education is the formal responsibility of districts and district parliaments have responsibility for resource allocation and scrutiny.
• With decentralization and
reduced school revenues from local governments, schools have raised their fees for an ever-increasing list of goods and services.

34 A
ppendix 2
Policy Priorities
Conditions Fulfilled by Loan
Effectiveness (14 Jul 1998) for First Tranche Release
Conditions Fulfilled by 15 Feb 2000 for Second and Last Tranche Release
Current Status at Program Completion
Review Mission (Nov 2002) Status as of PPER 2006
• District education boards
and school committees established with Minister of National Education Decree No. 044/U, 2002, involving civil society but needs empowerment vis-à-vis school principals given imbalances between supply and demand.
c. Increase transparency in
budgeting.
• MOEC, MORA, and MOHA issued directors general decree requiring the parent-teachers community association to endorse the integrated school budget and monitor its implementation.
• While school committees are still often dominated by school staff (principals and/or teachers), the media and increasing numbers of nongovernment organizations interested in education often serve as watchdogs of education expenditures, especially with the recent vast increases.
d. Establish block grant
funding mechanism to strengthen school control on its resources.
• The Government established a legal and administrative framework for disbursing block grants under the SPSDP directly to schools through the nearest commercial banks or other appropriate channels.
• The Government adopted a policy statement that introduced a consolidated block grant system providing nonsalary costs and compensating schools with limited potential for raising revenues.
• Block grant funding is now the accepted method of financing schools’ nonsalary expenditure. Considerable barriers still exist to devolving responsibility for staffing deployment and wage bills to schools.
• The BOS is distributed to schools as block grants.
• Block grant funding is now
the accepted method of financing school nonsalary expenditures. This mechanism is maintained in distribution of oil

Appendix 2 35
Policy Priorities
Conditions Fulfilled by Loan
Effectiveness (14 Jul 1998) for First Tranche Release
Conditions Fulfilled by 15 Feb 2000 for Second and Last Tranche Release
Current Status at Program Completion
Review Mission (Nov 2002) Status as of PPER 2006
• The Government prepared
necessary instructions and regulations that made block grant funding the principal means of providing central government funds to primary and junior secondary schools (excluding teachers’ salaries, new construction, and major equipment).
• MOEC and MORA
completed design of a monitoring system to determine whether resources are reaching schools on a timely basis and whether these resources are used effectively to enhance quality, and budget funds to test the monitoring system in selected districts in SY2000/01.
subsidies, in 2005 known as BOS (school operating assistance) but in 2006 to referred to as student operating costs (biaya operasi siswa
e. Develop school management capacity.
• MOEC, MORA, and MOHA completed development and evaluation of a model and materials for training school principals in integrated budget planning and management.
• Responsibility for staffing deployment and wage bills to schools remains with the Government.
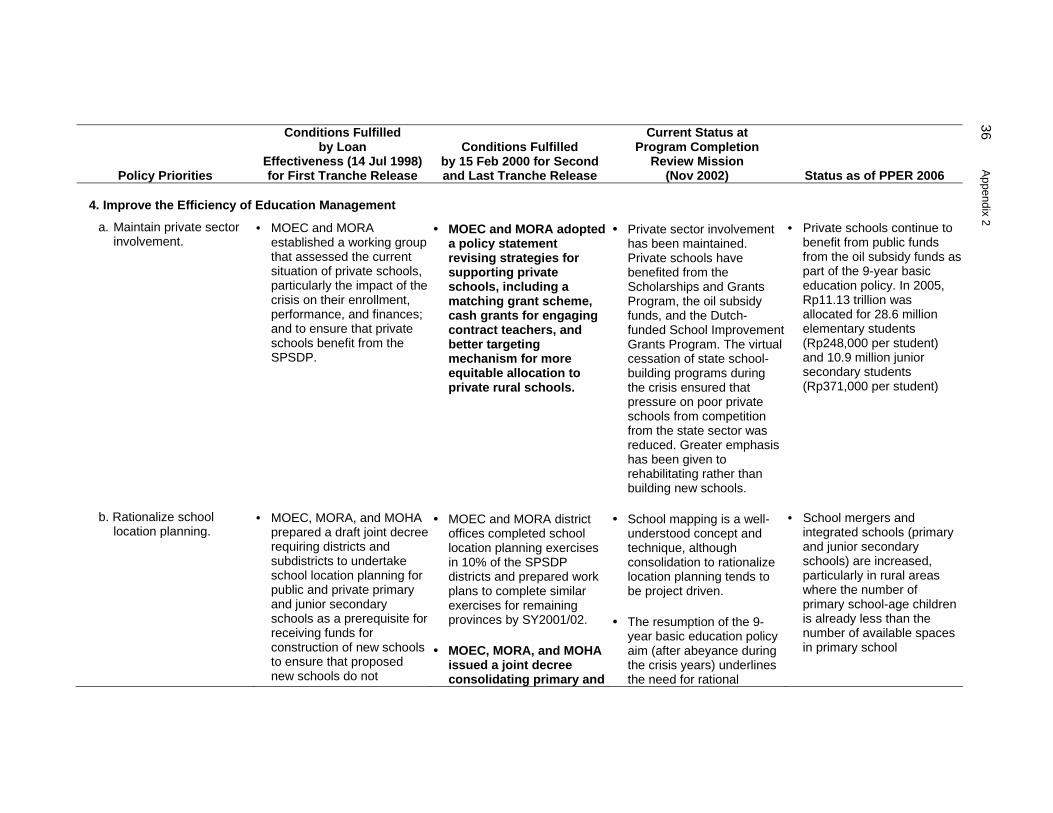
36 A
ppendix 2
Policy Priorities
Conditions Fulfilled by Loan
Effectiveness (14 Jul 1998) for First Tranche Release
Conditions Fulfilled by 15 Feb 2000 for Second and Last Tranche Release
Current Status at Program Completion
Review Mission (Nov 2002) Status as of PPER 2006
4. Improve the Efficiency of Education Management
a. Maintain private sector involvement.
• MOEC and MORA established a working group that assessed the current situation of private schools, particularly the impact of the crisis on their enrollment, performance, and finances; and to ensure that private schools benefit from the SPSDP.
• MOEC and MORA adopted a policy statement revising strategies for supporting private schools, including a matching grant scheme, cash grants for engaging contract teachers, and better targeting mechanism for more equitable allocation to private rural schools.
• Private sector involvement has been maintained. Private schools have benefited from the Scholarships and Grants Program, the oil subsidy funds, and the Dutch-funded School Improvement Grants Program. The virtual cessation of state school-building programs during the crisis ensured that pressure on poor private schools from competition from the state sector was reduced. Greater emphasis has been given to rehabilitating rather than building new schools.
• Private schools continue to benefit from public funds from the oil subsidy funds as part of the 9-year basic education policy. In 2005, Rp11.13 trillion was allocated for 28.6 million elementary students (Rp248,000 per student) and 10.9 million junior secondary students (Rp371,000 per student)
b. Rationalize school location planning.
• MOEC, MORA, and MOHA prepared a draft joint decree requiring districts and subdistricts to undertake school location planning for public and private primary and junior secondary schools as a prerequisite for receiving funds for construction of new schools to ensure that proposed new schools do not
• MOEC and MORA district offices completed school location planning exercises in 10% of the SPSDP districts and prepared work plans to complete similar exercises for remaining provinces by SY2001/02.
• MOEC, MORA, and MOHA issued a joint decree consolidating primary and
• School mapping is a well-understood concept and technique, although consolidation to rationalize location planning tends to be project driven.
• The resumption of the 9-year basic education policy aim (after abeyance during the crisis years) underlines the need for rational
• School mergers and integrated schools (primary and junior secondary schools) are increased, particularly in rural areas where the number of primary school-age children is already less than the number of available spaces in primary school

Appendix 2 37
Policy Priorities
Conditions Fulfilled by Loan
Effectiveness (14 Jul 1998) for First Tranche Release
Conditions Fulfilled by 15 Feb 2000 for Second and Last Tranche Release
Current Status at Program Completion
Review Mission (Nov 2002) Status as of PPER 2006
compete for enrollment with existing (especially with private) schools.
junior secondary schools with overlapping catchments by SY2000/01.
planning.
B. Health (including Family Planning and Nutrition) 1. Maintain Access of Vulnerable Groups
a. Facilitate access of the poor to essential health and family planning services.
• The Government identified the poor requiring the provision of free health services (including family planning).
• The Ministry of Health (MOH) issued a secretary general’s decree defining a basic package of health services (including family planning services) that must be universally accessible, and formulated a financing plan for the package of services based on the beneficiaries’ ability to pay.
• The Safety Net Program for Health, developed under the SPSDP, is ongoing (financed through the Health and Nutrition Sector Development Program [HNSDP]).
• The HNSDP loan closed on 31 Dec 2002.
• The Government developed a mechanism linking part of its subsidies to the number of poor in the health center area.
• MOH issued a secretary general’s decree institutionalizing the linkage between part of the government subsidies and the number of poor in the health center area.
• The Government reduced subsidies for fuel. Part of the savings is now used to support the safety net program (now being financed partly from the government’s own resources).
• The fuel tax compensation scheme is as follows: 2002: Rp2.85 trillion; 2003: Rp4.43 trillion;
• Starting 2005 PT ASKES (a state company to provide free health care to the poor) was assigned to provide for 36.1 million poor
• In 2005, the budget for the health sector Rp9 trillion and support for safety net program was Rp3.8 trillion.

38 A
ppendix 2
Policy Priorities
Conditions Fulfilled by Loan
Effectiveness (14 Jul 1998) for First Tranche Release
Conditions Fulfilled by 15 Feb 2000 for Second and Last Tranche Release
Current Status at Program Completion
Review Mission (Nov 2002) Status as of PPER 2006
• BPS is responsible for conducting a poverty census; all those identified as poor will be given a card (currently estimated at 15.5 million households or 60 million people) who according to latest estimates are to be given cash transfers of Rp100,000/month/family from the fuel subsidy for increasing fuel prices (distributed either Oct or Nov 2005) This is known as BLT (Bantuan Langsung Tunai, lit. direct cash assistance) or SLT (Subsidi Langsung Tunai, direct cash subsidy). This is distributed quarterly.
• • MOH defined a minimum standard benefit package to be provided by local health services, as required under the regulations for decentralization.
• New Asian Development Bank (ADB) projects supporting decentralization (Decentralized Health Services I approved in

Appendix 2 39
Policy Priorities
Conditions Fulfilled by Loan
Effectiveness (14 Jul 1998) for First Tranche Release
Conditions Fulfilled by 15 Feb 2000 for Second and Last Tranche Release
Current Status at Program Completion
Review Mission (Nov 2002) Status as of PPER 2006
November 2000, and Decentralized Health Services II under preparation) require local governments to prepare a local scheme to protect access to health services for the poor.
• MOH is finalizing a draft social health insurance law that will guarantee financing of essential services (including essential hospital care) to the population, particularly the poor.
• Law 40, 2004 (National Insurance Scheme)
b. Develop proactive activities targeting the poor.
• MOH issued instructions to health centers and village midwives in the 8 health SPSDP provinces to develop an outreach plan for the poor in the areas. The plan included (i) the list of poor families in the midwife’s area; (ii) the number of pregnant women and children under 3 years of age among these poor families; and (iii) the number of home visits to these families planned for the first 3 months of the SPSDP.
• MOH developed a detailed financing plan covering expansion of the village midwives’ outreach activities all over the country and ensuring sufficient budget allocation for FY2000.
• MOH ensured that funding for the outreach activities of the village midwives was linked to village midwives’ quarterly activity plans and their implementation.
• The program of outreach health services by the village midwives initiated under the SPSDP has proven very successful. Funds are guaranteed until the end of 2003. With decentralization, local governments will have to take over financing of these programs. Advocacy campaigns and policy dialogue under ADB’s new health sector projects are continuously lobbying local governments to continue the outreach programs.
• The budget to protect people comes from central Government.
• All public sector personnel, including village midwives remain the responsibility of the central Government.
• Operating funds, like the block grants for health outreach by village midwives, become the responsibility of local governments and thus not universally implemented.

40 A
ppendix 2
Policy Priorities
Conditions Fulfilled by Loan
Effectiveness (14 Jul 1998) for First Tranche Release
Conditions Fulfilled by 15 Feb 2000 for Second and Last Tranche Release
Current Status at Program Completion
Review Mission (Nov 2002) Status as of PPER 2006
• Health constitutes about 8% of the development budget. The share of foreign assistance declined from 52.5% in 2000 to 21.7% in 2004 (Source: BAPPENAS).
• Safeguarding continues, with added training, and coverage of essential drugs and vaccine increased.
c. Ensure priority in budget allocations to health services and facilities most used by the poor.
• The Government ensured budget provisions for FY1999 for operating costs of health centers and subcenters (including medicines and consumables) are at least at the same level as in the revised FY1998 budget.
• The Government ensured budget provisions for FY2000 for operating costs of health centers and subcenters (including medicines and consumables) are at least at the same levels as in the FY1999 budget (as revised in June 1998).
• Financing of primary health care activities has been guaranteed with the HNSDP. The new health sector projects supporting decentralization (funded by ADB, World Bank, and other development partners) give priority to financing primary health care and those services
• National Insurance Scheme, Law No. 40, 2004, allocates Rp4,000/person to ASKES and Rp1,000 to health centers (estimated Rp2.3 trillion) for free access to either health centers or class 3 hospitals.
d. Better identify and target vulnerable groups at risk from malnutrition.
• The Government reestablished the intersector committee for the nutrition surveillance system and completed the appointment of the committee members based
• MOHA issued instructions requiring provincial and district committees of the nutrition surveillance system to submit quarterly reports.
• This was one of the objectives of the ADB-financed Family Health and Nutrition Project (to be completed at the end of 2003). Lessons from this project will be implemented
• The extreme poor (fakir miskin) in the poverty census conducted by BPS are defined as those earning less than Rp120,000 (national average).

Appendix 2 41
Policy Priorities
Conditions Fulfilled by Loan
Effectiveness (14 Jul 1998) for First Tranche Release
Conditions Fulfilled by 15 Feb 2000 for Second and Last Tranche Release
Current Status at Program Completion
Review Mission (Nov 2002) Status as of PPER 2006
on their functions in the various sectors.
or developed under the just approved technical assistance (TA) on public health and nutrition. Recommendations of this TA will be implemented in ADB’s decentralized health services projects, and advocated nationally.
2. Maintain Quality of Essential Health/Family Planning/Nutrition Services
a. Maintain level of funding.
• The Government maintained development budget allocations to health, family planning, and nutrition as a share of the national budget for FY1999 at the same level as in the revised FY1998 budget.
• The Government maintained development budget allocations to health family planning and nutrition (MOH and National Family Planning Coordinating Board) as a share of the national budget for FY2000 at least at the same level as the FY1999 budget (as revised in June 1998).
• Development budget allocations to health and in particular to basic health services were maintained for the HNSDP. The access to health services by the poor was maintained and expanded under the HNSDP. At the end of the HNSDP some money will be available from the reduction in fuel subsidies to continue the access to health services by the poor for a limited period. There are plans to include all the poor in a health insurance system, known as ASKES, with the premium being paid for by the Government or incorporating them all into the managed health care system locally, which
• Decentralization means that local governments and parliaments have the authority to determine budgetary allocations with the consequence of no nationally standardized financing packages.
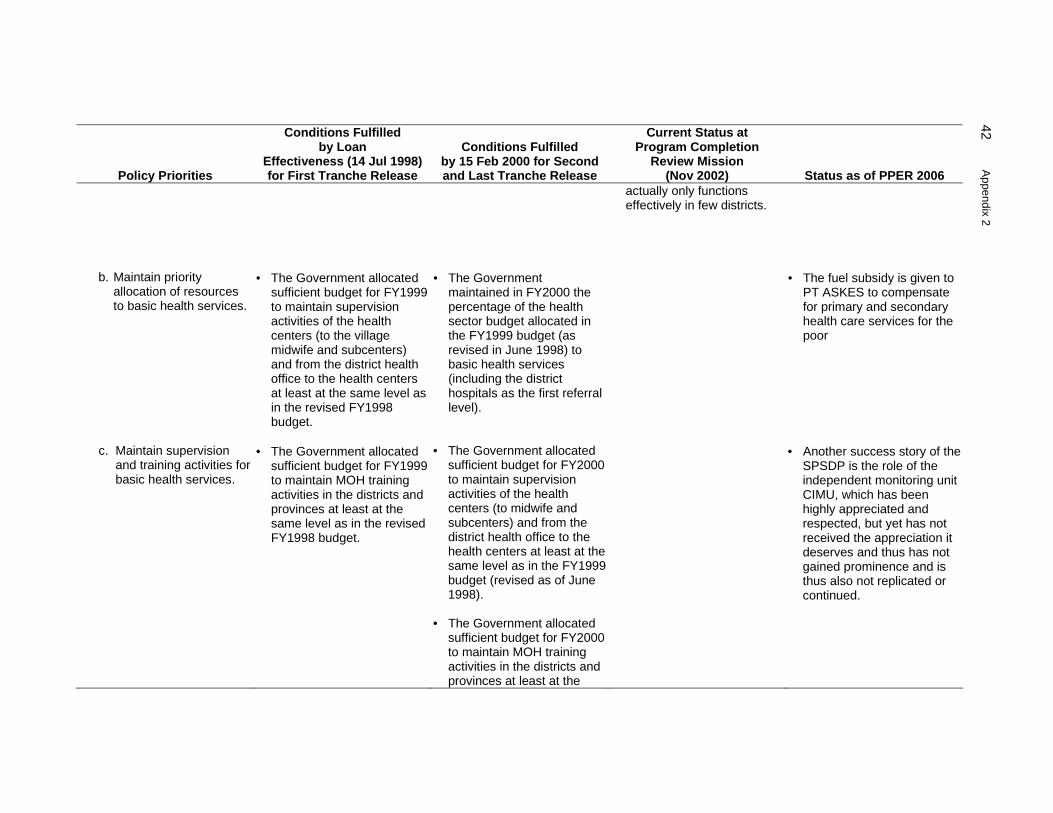
42 A
ppendix 2
Policy Priorities
Conditions Fulfilled by Loan
Effectiveness (14 Jul 1998) for First Tranche Release
Conditions Fulfilled by 15 Feb 2000 for Second and Last Tranche Release
Current Status at Program Completion
Review Mission (Nov 2002) Status as of PPER 2006
actually only functions effectively in few districts.
b. Maintain priority allocation of resources to basic health services.
• The Government allocated sufficient budget for FY1999 to maintain supervision activities of the health centers (to the village midwife and subcenters) and from the district health office to the health centers at least at the same level as in the revised FY1998 budget.
• The Government maintained in FY2000 the percentage of the health sector budget allocated in the FY1999 budget (as revised in June 1998) to basic health services (including the district hospitals as the first referral level).
• The fuel subsidy is given to PT ASKES to compensate for primary and secondary health care services for the poor
c. Maintain supervision and training activities for basic health services.
• The Government allocated sufficient budget for FY1999 to maintain MOH training activities in the districts and provinces at least at the same level as in the revised FY1998 budget.
• The Government allocated sufficient budget for FY2000 to maintain supervision activities of the health centers (to midwife and subcenters) and from the district health office to the health centers at least at the same level as in the FY1999 budget (revised as of June 1998).
• The Government allocated sufficient budget for FY2000 to maintain MOH training activities in the districts and provinces at least at the
• Another success story of the SPSDP is the role of the independent monitoring unit CIMU, which has been highly appreciated and respected, but yet has not received the appreciation it deserves and thus has not gained prominence and is thus also not replicated or continued.

Appendix 2 43
Policy Priorities
Conditions Fulfilled by Loan
Effectiveness (14 Jul 1998) for First Tranche Release
Conditions Fulfilled by 15 Feb 2000 for Second and Last Tranche Release
Current Status at Program Completion
Review Mission (Nov 2002) Status as of PPER 2006
same level as in the revised FY1999 budget (as revised in June 1998).
d. Maintain family planning program for the poor.
• The Government maintained access to free family planning services (including the contraceptives for the poor).
• The Government formulated a medium-term (5–7 years) plan to maintain access to free family planning services (including contraceptives) for the poor.
• The outreach program for midwives proved to be one of the most successful components, as it enhanced their status in the community and made people aware of their presence and capabilities. More women were encouraged to come for ante- and postnatal care and seek out village midwives for delivery.
• Throughout the SPSDP and
HNSDP, the Government ensured priority to health services and facilities most used by the poor. However the situation remains unclear under decentralization with the powers over spending the health budget transferred to the districts.
• Regrettably, this very successful midwives outreach program has not been sufficiently promoted thus not widely known and is now disbanded in favor of the health insurance through PT ASKES
• The National Family
Planning Board (BKKBN) was decentralized. No family planning field workersremain. Local government must now allocate for family planning. If in the past contraceptive distribution and use was one of the most equitable, the future is not clear.
3. Enhance Decentralization
a. Delegate further • MOH adopted integrated • MOH completed revision of Block grants are now an • At least this block grant

44 A
ppendix 2
Policy Priorities
Conditions Fulfilled by Loan
Effectiveness (14 Jul 1998) for First Tranche Release
Conditions Fulfilled by 15 Feb 2000 for Second and Last Tranche Release
Current Status at Program Completion
Review Mission (Nov 2002) Status as of PPER 2006
authority to local levels for planning and resource allocation in the health sector.
health planning and budgeting for primary health care for all districts.
• The Ministry of Finance
established specific block grant mechanisms providing funds directly to the operational level (midwives and health centers) in the Program provinces.
the integrated health planning and budgeting system streamlining the administrative constraints, and adopting a timetable for implementation of the streamlined system.
• The Government
established a legal and administrative framework for the block grant mechanism that became the principal means of financing health centers.
• MOH developed an
appropriate implementation schedule that better delegated to individual districts the responsibility of managing health services and improving their quality and efficiency.
established way of financing the health centers and this is likely to continue under decentralization. Integrated health budget planning is in the process of being adopted for primary health care in the districts.
concept has prevailed and continued in government-funded distribution of financial resources to health centers.
b. Decentralize human resources management.
• MOH initiated strategic review of the structure and staffing, and redefined as necessary the roles and responsibilities of central, provincial, district, and health center levels to accommodate and support the decentralization
• MOH formulated a medium-term (5–7 years) plan for decentralization of human resources management, capacity building, systems development, and staff training and redeployment.
• The implementation schedule for decentralization initially suffered from bureaucratic inertia and resulted in few districts being adequately prepared for the responsibility of managing health services, improving
• On the other hand, all ‘civil servants, including health workers, continue to be part of a centralized personnel system, paid by the central Government.

Appendix 2 45
Policy Priorities
Conditions Fulfilled by Loan
Effectiveness (14 Jul 1998) for First Tranche Release
Conditions Fulfilled by 15 Feb 2000 for Second and Last Tranche Release
Current Status at Program Completion
Review Mission (Nov 2002) Status as of PPER 2006
process. their quality or efficiency, and setting priorities. Despite advance planning, the establishment of a decentralization unit in MOH and initiatives such as courses for strategic management at the MOH Training Center, the process has run into problems. These result to a large extent from the lack of skills at the district level, exacerbated by some districts not accepting the transfer of skilled staff from the province unless they originated in the district. In most districts, capacity building of human resources in the health sector is only now beginning to receive attention. The lack of a rigorous policy on redeployment has resulted in overstaffing in some districts and provinces where the MOH representative offices have been amalgamated with the provincial and district health offices.

46 A
ppendix 2
Policy Priorities
Conditions Fulfilled by Loan
Effectiveness (14 Jul 1998) for First Tranche Release
Conditions Fulfilled by 15 Feb 2000 for Second and Last Tranche Release
Current Status at Program Completion
Review Mission (Nov 2002) Status as of PPER 2006
4. Improve Efficiency and Mobilize New Resources
a. Strengthen responsibility and accountability of local managers.
• MOHA confirmed that units swadana hospitals are exempted from transferring the revenues to local government.
• MOHA issued instruction to local governments to permit all district hospitals to retain their revenues and to authorize use of such revenue for hospital operational costs.
• The Government
established plans and mechanisms to gradually reduce subsidies to units swadana hospitals.
• MOH undertook a
feasibility study of the swadana management concept at the health center level.
User fees and other income from health centers and other health services can provide a major source of income for local districts. Local districts can be reluctant to allow the use of such income directly by health centers.
Steps are being taken to enhance requirements for health center managers to account for block grant usage.
• Little evidence can be found of a reduction in subsidy to hospitals with units swadana to date. All staff salaries of health professionals are still paid centrally.
b. Develop and implement a managed care scheme.
• The Government established a steering committee that supervised implementation of managed care in selected districts, with representatives from the National Development
• MOH prepared a detailed implementation plan, province by province, for implementing a managed care scheme, with special attention to poor families and participation of the
• The managed health scheme had little take-up in the community.
• Committees were formed as stated in selected districts and the managed health

Appendix 2 47
Policy Priorities
Conditions Fulfilled by Loan
Effectiveness (14 Jul 1998) for First Tranche Release
Conditions Fulfilled by 15 Feb 2000 for Second and Last Tranche Release
Current Status at Program Completion
Review Mission (Nov 2002) Status as of PPER 2006
Planning Board, MOH, academics, private sector, and nongovernment organizations.
• MOH adopted an
implementation plan that developed managed care in selected districts with clear identification of the administrative requirements.
private sector. • MOH established a working
group to define and facilitate private sector involvement in managed care.
scheme administrative workers (Bapels) established. However, lack of public awareness of the need for insurance coupled with free care for the poor under the SPSDP made for low uptake. No detailed province-by-province implementation plan was produced.
BOS = school/student operational cost; MOEC = Ministry of Education and Culture; MOHA = Ministry of Home Affairs; MORA = Ministry of Religious Affairs; PPER = Project/Program Performance Evaluation Report; SPSDP = Social Protection Sector Development Program; SY = school year. Notes: (i) Conditions in boldface were conditions for the release of the second tranche of the program loan.
(ii) Unit swadana are public health facilities that meet specific criteria of financial performance and staff composition, and are mandated to be financially self-sufficient. In accordance with the concept of lembaga swadana or self-reliance, units swadana have greater autonomy in planning and managing their own revenues and expenditures.
Source: Operations Evaluation Mission.

48 A
ppendix 3
PROGRAM PERFORMANCE AGAINST THE PROGRAM FRAMEWORK Goals: (i) Mitigate the impact of the crisis on the most vulnerable groups in terms of their access to basic social services (education, health
and family planning, and nutrition). (ii) Implement incremental reforms supportive of ongoing initiatives to improve the access to, quality of, and efficiency of basic social
services.
Objectives/Policies Project/TA Inputs Achievements (PCR) Achievements (PPER)
A. Protect Access of Vulnerable Groups to Essential Social Services
1. Education • Expand provision of junior
secondary scholarships for needy students.
• Develop school-level incentives to reduce dropouts.
• Remove barriers to enrollment.
• Provision of junior secondary scholarships
• Public awareness campaign • Components targeting street
children • Collection of information through
TA for improved targeting • Social mapping, evaluation, staff
training through TA for street children
• Over 1.9 million annual scholarships were successfully delivered
• Awareness campaign conducted largely managed by World Bank with AusAID and United Nations Children’s Fund
• Street children received scholarships for general education and vocational courses and supplementary food
• Street children TA successfully completed by Atma Jaya University
• 974,377 and 971,491 junior secondary school students received scholarships in FY1999 and FY2000
• An education campaign was successfully completed and had a significant impact on schools maintaining access even for those with limited ability to pay
• 2,193 street children received scholarships: 535 completed elementary school, 368 completed junior secondary school, and 70 completed senior secondary school
• 7,500 children in open houses too old to continue formal basic education given vocational training: 7,333 (98%) completed training and 2,328 (32%) found employment
• 116 street children rejoined their families due to success of social workers in giving children motivation.

Appendix 3 49
Objectives/Policies Project/TA Inputs Achievements (PCR) Achievements (PPER)
• 120 orphanages received assistance and 7,007 orphans received scholarships: 805 completed elementary school, 600 completed junior secondary, and 200 completed senior secondary (Government PCR)
2. Health and Family Planning
• Facilitate access to essential health and family planning services for the poor.
• Ensure health providers undertake
outreach activities targeting the poor.
• Free access to a basic package of health and family planning services for the most vulnerable groups
• Public awareness campaign • Collection of information through
TA for improved targeting • Development and provision of
funding mechanisms for improved outreach activities
• Replenishment of medical kits for midwives in targeted villages
• Health card system is operating • Public awareness targets were not
achieved • Public awareness campaign
undertaken in follow-on Health and Nutrition Sector Development Program (HNSDP)
• Grants to midwives provided incentives for outreach activities
• In 1998/99 about 74% of 5.3 million poor families possessed health cards; 70% utilized the services offered under the program; in 1999/00 the comparable figures were 93% of 5.2 million poor families had cards, 51.5% used the services
• Visits to health facilities numbered 7.3 million or on average 2.93 times per family (Government PCR)
3. Nutrition
• Develop a nutrition program to mitigate impact of the crisis on the most vulnerable groups.
• Complementary feeding program for infants 6–12 months old
• Subsidies to improve nutrition for children 1–3 years old and pregnant women from poor families
• Complementary feeding was carried out but disrupted because of delays in procurement
• Supplementary feeding was partly successful
• 1998/99: 69.8% of targeted 6–11 month-old infants; 78.2% of 12–23 month-old targeted children, and 51.8% of malnourished pregnant women got supplementary food
• 1999/00: 63% of 6–11 month-old infants, 59% of 12–23 month-old children, and 73% of malnourished pregnant women received supplementary food; in addition, 511% of 24–59 month-old children received supplementary food (Government-PCR)

50 A
ppendix 3
Objectives/Policies Project/TA Inputs Achievements (PCR) Achievements (PPER)
B. Maintain Delivery of Basic Social Services
1. Education
• Maintain level of funding. • Establish funding mechanism to
support schools directly.
• Block grants to primary and junior secondary schools
• Subsidy prevented a massive decrease in schools’ real incomes, therefore enabling them to continue spending on operations
• Direct funding mechanism through the post office worked well
• 64,413 primary schools received block grants in FY1999 and 62,796 in FY2000
• 10,766 junior secondary schools received block grants in FY1999 and 10,493 in FY2000
• SUSENAS 1998–2000 showed a decrease in the prevalence of severe protein energy malnutrition among children under 5 years, 10.5% in 1998, and about 8.1% in 1999
2. Health and Family Planning
• Maintain level of funding. • Establish a funding mechanism to
support health centers directly. • Support safe motherhood services. • Maintain family planning program.
• Block grants to health centers • Contraceptive supply • Block grants to village midwives for
outreach services
• Access to health provision for the poor was maintained
• Contraceptives were distributed nationwide
• Midwives were given incentives for outreach work
• According to the Central Independent Monitoring Unit (CIMU) for health, absorption of block grant funds by health centers was more than 90%
• 89% of poor families had health cards for free primary health services, but the utilization rate was only 52% of targeted families in 1999 and 47.8% in 2000 (CIMU)
• 1998/99 achievements: - of the targets, obstetric services
were given to 73.3% of pregnant women, 59.7% to parturition mothers, and 67.9% to postparturition mothers
- 6.6% of pregnant mothers were referred to hospitals

Appendix 3 51
Objectives/Policies Project/TA Inputs Achievements (PCR) Achievements (PPER)
• 1999/00 achievements: - 81.4% of pregnant women,
71.6% of parturition mothers, and 85.0% of postparturition mothers
- 9.2% of pregnant mothers were referred to hospitals; 47% by village midwives and 53% by health centers
• % deliveries by medical personnel rose from 53.6% in 1997 to 60.2% in 1999 and 71.6% as of December 2000
• A total of 28 million injectable contraceptives and disposable syringes with needles were procured and distributed to all provinces of the country
• In 1998, 31.5% of poor families used injectable contraceptives, and in 2000, 33.8% of the poor were family planning practitioners, and significant shifts to injectables from other modern methods (Government PCR).
• Rising trends in contraception use were maintained: - % currently married women
using contraception rose from 49.7% in 1991, to 54.7% in 1994, to 57.4% in 1997, and 60.3% in 2002
- Reliance on injectables also continued to rise from 12%, to 15%, to 21%, and 28% for the

52 A
ppendix 3
Objectives/Policies Project/TA Inputs Achievements (PCR) Achievements (PPER)
same years (BAPPENAS, AusAID, ADB 2004)
3. Nutrition
• Strengthen the nutrition surveillance system for better needs assessment.
• Maintain level of funding.
• Training activities and basic equipment for the nutrition surveillance system
• National surveillance system was revitalized
• Capacity building in processing and validation of nutrition surveillance system data resulting from monitoring of nutritional status and nutrient consumption
• Monitoring and supervision • Nutrition surveillance system
software dissemination producing nutritional status maps for all districts in selected province (79 high-risk districts were identified) (Government PCR and BAPPENAS, AusAID, ADB 2004)
C. Maintain Quality of Basic Social Services
1. Education
• Develop and adopt a formula for allocating resources based on an objective measure of poverty.
• Block grants to schools to purchase instructional materials
• Evaluation of block grant scheme
• Principle of discriminating in favor of poor areas and schools was established, e.g., through the funding formula for decentralized funds
• Grant funding for schools was established
• Moves were made toward school-based management and integrated school budgets
• Formula-based funding distribution and allocation in which poverty weighted significantly (Government PCR)
• The SPSDP pioneered block grants to schools, which is sustained, and today the basis for distributing school operating finances (BOS)
• The SPSDP pioneered the establishment of school committees, involving parents and the community in school-based management

Appendix 3 53
Objectives/Policies Project/TA Inputs Achievements (PCR) Achievements (PPER)
2. Health and Family Planning
• Maintain supervision activities of the health concerns through maintenance of the budget.
• Sustain training of health sector personnel.
• No evidence of a dramatic decline in the quality of health services provision
• The Project maintained access to basic health services by the poor (BAPPENAS, AusAID, ADB (2004):
- Verified by Strauss et all (2002)
using the Indonesian family life survey
- CIMU found that the Project managed to maintain health center functions in basic health for 10%–18% of the poor visiting the centers
- Improvements reported for obstetric services included prenatal service, natal assistance, and postnatal services for the poor: 75%–94% of expecting mothers from poor families received pregnancy medical checkups, and 60% improvement in delivery assistance, which exceeded services to non-poor (CIMU)
3. Nutrition
• Maintain budget allocation. • Provision of training • Monitoring system
• Surveillance system reestablished
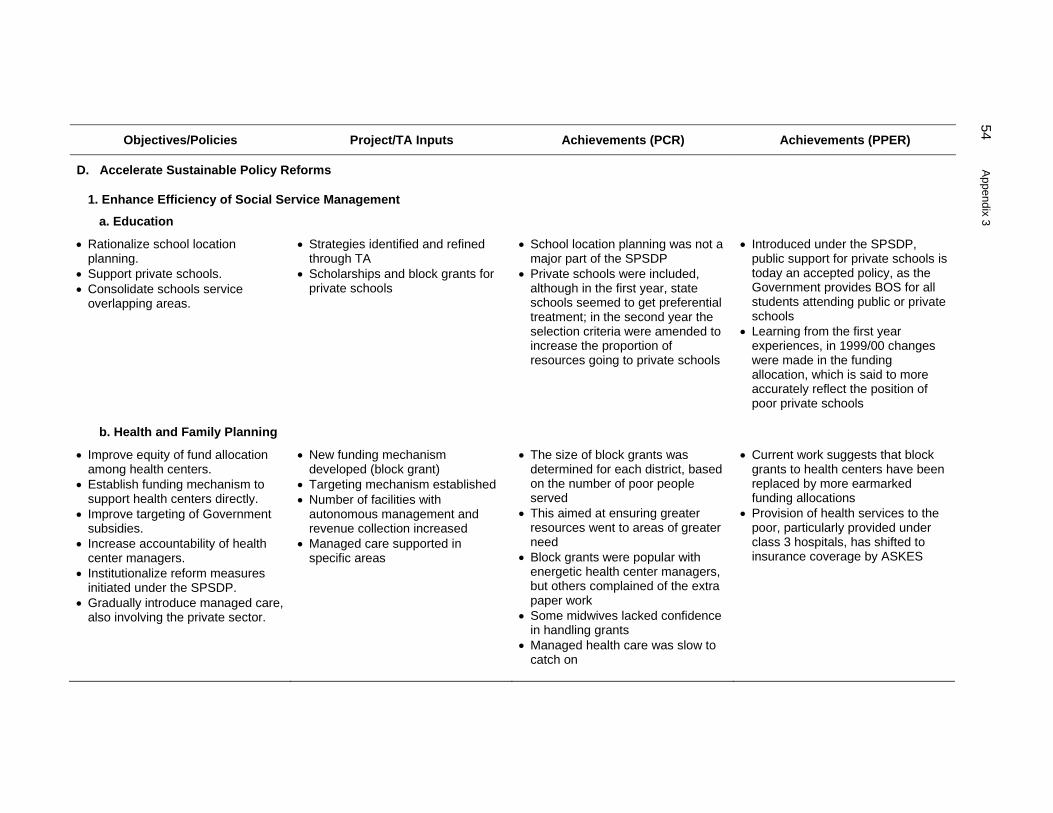
54 A
ppendix 3
Objectives/Policies Project/TA Inputs Achievements (PCR) Achievements (PPER)
D. Accelerate Sustainable Policy Reforms
1. Enhance Efficiency of Social Service Management
a. Education
• Rationalize school location planning.
• Support private schools. • Consolidate schools service
overlapping areas.
• Strategies identified and refined through TA
• Scholarships and block grants for private schools
• School location planning was not a major part of the SPSDP
• Private schools were included, although in the first year, state schools seemed to get preferential treatment; in the second year the selection criteria were amended to increase the proportion of resources going to private schools
• Introduced under the SPSDP, public support for private schools is today an accepted policy, as the Government provides BOS for all students attending public or private schools
• Learning from the first year experiences, in 1999/00 changes were made in the funding allocation, which is said to more accurately reflect the position of poor private schools
b. Health and Family Planning
• Improve equity of fund allocation among health centers.
• Establish funding mechanism to support health centers directly.
• Improve targeting of Government subsidies.
• Increase accountability of health center managers.
• Institutionalize reform measures initiated under the SPSDP.
• Gradually introduce managed care, also involving the private sector.
• New funding mechanism developed (block grant)
• Targeting mechanism established • Number of facilities with
autonomous management and revenue collection increased
• Managed care supported in specific areas
• The size of block grants was determined for each district, based on the number of poor people served
• This aimed at ensuring greater resources went to areas of greater need
• Block grants were popular with energetic health center managers, but others complained of the extra paper work
• Some midwives lacked confidence in handling grants
• Managed health care was slow to catch on
• Current work suggests that block grants to health centers have been replaced by more earmarked funding allocations
• Provision of health services to the poor, particularly provided under class 3 hospitals, has shifted to insurance coverage by ASKES

Appendix 3 55
Objectives/Policies Project/TA Inputs Achievements (PCR) Achievements (PPER)
c. Nutrition
• Institutionalize reform measure initiated under the SPSDP
• Strategies identified and refined through TA
• TA did not happen • Confirmed
2. Decentralize Management
a. Education
• Strengthen the role of the parent-teachers association.
• Enhance local decision making regarding the use of funds.
• Delegate full authority in financial management through consolidated budgeting.
• Capacity building in planning and management for consolidated budgeting
• Evaluation of capacity-building program through TA
• Training modules developed through TA
• Monitoring of beneficiary targeting
• Decentralized social services delivery TA began in late 2000 and successfully established budgetary procedures, training models, and materials
• How widely accepted the budgetary procedures produced under Decentralized Social Services Delivery serve as the basis for school based management is not known
• With decentralization, fundamental changes of budgetary practices cannot be sustained when practiced by only one sector
b. Health and Family Planning
• Undertake strategic review of health system organization and structure.
• Progressively delegate authority to local levels, including decisions regarding the use of funds.
• Capacity building in planning and management
• Adoption of integrated health planning and budgeting for all districts
• Little capacity building was undertaken during the SPSDP
• Integrated health planning and budgeting was developed later under the HNSDP
• Confirmed • Confirmed
c. Nutrition
• Enhance local capacity to plan/manage use of funds.
• Capacity building in planning and management for local nutrition surveillance committees
• Training provided later under the HNSDP
• Confirmed
ADB = Asian Development Bank, AusAID = Australian Agency for International Development, BAPPENAS = National Development Planning Board, BOS = school/student operating costs, PCR = program completion report, SPSDP = Social Protection Sector Development Program, TA = Technical Assistance. Source: Operations Evaluation Mission.

56 Appendix 4
ASSESSMENT OF OVERALL PROGRAM PERFORMANCE A. Program Loan
Table A4.1: Maintain Access of the Poor to Social Services
Criterion Weight Assessment Rating Value Weighted Rating Relevance 20% Highly relevant 3 0.6 Effectiveness 30% Highly effective 3 0.9 Efficiency 30% Efficient 2 0.6 Sustainability 20% Most likely 3 0.6 Overall Rating Highly successful 2.7
Source: Operations Evaluation Mission.
Table A4.2: Maintain Quality
Criterion Weight Assessment Rating Value Weighted Rating Relevance 20% Highly relevant 3 0.6 Effectiveness 30% Highly effective 3 0.9 Efficiency 30% Efficient 2 0.6 Sustainability 20% Most likely 3 0.6 Overall Rating Successful 2.7
Source: Operations Evaluation Mission.
Table A4.3: Continue Decentralization of Social Services Management
Criterion Weight Assessment Rating Value Weighted Rating Relevance 20% Highly relevant 3 0.6 Effectiveness 30% Effective 2 0.6 Efficiency 30% Efficient 2 0.6 Sustainability 20% Likely 2 0.4 Overall Rating Successful 2.2
Source: Operations Evaluation Mission.
Table A4.4: Strengthen the Efficiency, Transparency, and Accountability of Management
Criterion Weight Assessment Rating Value Weighted Rating
Relevance 20% Highly relevant 3 0.6 Effectiveness 30% Effective 2 0.6 Efficiency 30% Efficient 2 0.6 Sustainability 20% Likely 2 0.4 Overall Rating Successful 2.2
Source: Operations Evaluation Mission.

Appendix 4 57
B. Project Loan1
Table A4.5: Scholarships for Junior Secondary School Students
Criterion Weight Assessment Rating Value Weighted Rating Relevance 20% Highly relevant 3 0.6 Effectiveness 30% Highly effective 3 0.9 Efficiency 30% Highly efficient 3 0.9 Sustainability 20% Most likely 3 0.6 Overall Rating Highly successful 3.0
Source: Operations Evaluation Mission.
Table A4.6: Block Grants to Junior Secondary and Primary Schools
Criterion Weight Assessment Rating Value Weighted Rating Relevance 20% Highly relevant 3 0.6 Effectiveness 30% Highly effective 3 0.9 Efficiency 30% Highly efficient 3 0.9 Sustainability 20% Most likely 3 0.6 Overall Rating Highly successful 3.0
Source: Operations Evaluation Mission.
Table A4.7: Support for Street Children
Criterion Weight Assessment Rating Value Weighted Rating Relevance 20% Relevant 3 0.6 Effectiveness 30% Highly effective 3 0.9 Efficiency 30% Efficient 2 0.6 Sustainability 20% Likely 2 0.4 Overall Rating Successful 2.5
Source: Operations Evaluation Mission.
Table A4.8: Block Grants to Health Centers
Criterion Weight Assessment Rating Value Weighted Rating Relevance 20% Highly Relevant 3 0.6 Effectiveness 30% Effective 2 0.6 Efficiency 30% Efficient 2 0.6 Sustainability 20% Less Likely 1 0.2 Overall Rating Successful 2.0
Source: Operations Evaluation Mission.
Table A4.9: Pilot-Managed Health Care Scheme
Criterion Weight Assessment Rating Value Weighted Rating Relevance 20% Partly relevant 1 0.2 Effectiveness 30% Ineffective 0 0 Efficiency 30% Inefficient 0 0 Sustainability 20% Unlikely 0 0 Overall Rating Unsuccessful 0.2
Source: Operations Evaluation Mission.
1 Additional weighting has been introduced against the value of a particular project component.

58 Appendix 4
Table A4.10: Strengthening Maternal Health Care
Criterion Weight Assessment Rating Value Weighted Rating
Relevance 20% Highly relevant 3 0.6 Effectiveness 30% Effective 2 0.6 Efficiency 30% Efficient 2 0.6 Sustainability 20% Less likely 1 0.2 Overall Rating Successful 2
Source: Operations Evaluation Mission.
Table A4.11: Injectable Contraceptives and Disposable Syringes
Criterion Weight Assessment Rating Value Weighted Rating Relevance 20% Highly relevant 3 0.6 Effectiveness 30% Effective 2 0.6 Efficiency 30% Efficient 2 0.6 Sustainability 20% Likely 2 0.4 Overall Rating Highly successful 2.2
Source: Operations Evaluation Mission.
Table A4.12: Complementary Feeding for Infants
Criterion Weight Assessment Rating Value Weighted Rating Relevance 20% Highly relevant 3 0.6 Effectiveness 30% Less effective 1 0.3 Efficiency 30% Less efficient 1 0.3 Sustainability 20% Less Likely 1 0.2 Overall Rating Partly successful 1.4
Source: Operations Evaluation Mission.
Table A4.13: Supplementary Feeding for Young Children and Pregnant Women
Criterion Weight Assessment Rating Value Weighted Rating Relevance 20% Highly relevant 3 0.6 Effectiveness 30% Less effective 1 0.3 Efficiency 30% Less efficient 1 0.3 Sustainability 20% Less likely 1 0.2 Overall Rating Partly successful 1.4
Source: Operations Evaluation Mission.
Table A4.14: Nutrition Surveillance System
Criterion Weight Assessment Rating Value Weighted Rating Relevance 20% Relevant 2 0.4 Effectiveness 30% Less effective 1 0.3 Efficiency 30% Less efficient 1 0.3 Sustainability 20% Likely 2 0.4 Overall Rating Partly successful 1.4
Source: Operations Evaluation Mission.
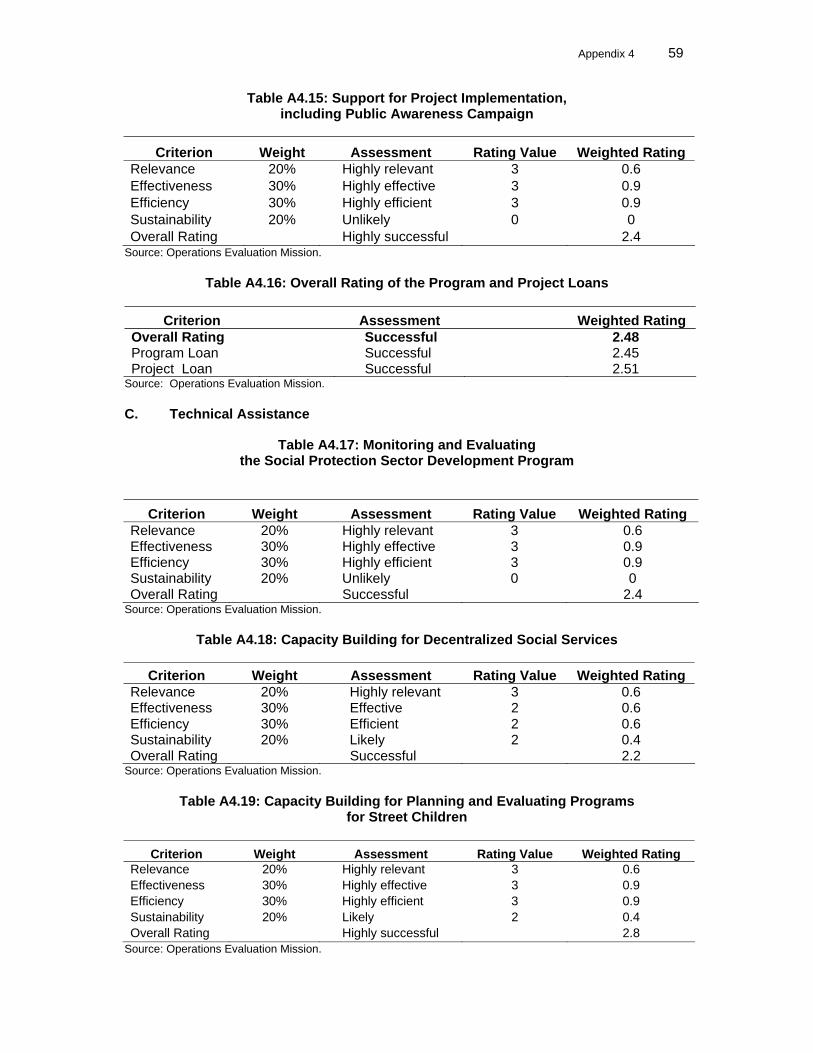
Appendix 4 59
Table A4.15: Support for Project Implementation, including Public Awareness Campaign
Criterion Weight Assessment Rating Value Weighted Rating Relevance 20% Highly relevant 3 0.6 Effectiveness 30% Highly effective 3 0.9 Efficiency 30% Highly efficient 3 0.9 Sustainability 20% Unlikely 0 0 Overall Rating Highly successful 2.4
Source: Operations Evaluation Mission.
Table A4.16: Overall Rating of the Program and Project Loans
Criterion Assessment Weighted Rating Overall Rating Successful 2.48 Program Loan Successful 2.45 Project Loan Successful 2.51
Source: Operations Evaluation Mission. C. Technical Assistance
Table A4.17: Monitoring and Evaluating the Social Protection Sector Development Program
Criterion Weight Assessment Rating Value Weighted Rating
Relevance 20% Highly relevant 3 0.6 Effectiveness 30% Highly effective 3 0.9 Efficiency 30% Highly efficient 3 0.9 Sustainability 20% Unlikely 0 0 Overall Rating Successful 2.4
Source: Operations Evaluation Mission.
Table A4.18: Capacity Building for Decentralized Social Services
Criterion Weight Assessment Rating Value Weighted Rating Relevance 20% Highly relevant 3 0.6 Effectiveness 30% Effective 2 0.6 Efficiency 30% Efficient 2 0.6 Sustainability 20% Likely 2 0.4 Overall Rating Successful 2.2
Source: Operations Evaluation Mission.
Table A4.19: Capacity Building for Planning and Evaluating Programs for Street Children
Criterion Weight Assessment Rating Value Weighted Rating
Relevance 20% Highly relevant 3 0.6 Effectiveness 30% Highly effective 3 0.9 Efficiency 30% Highly efficient 3 0.9 Sustainability 20% Likely 2 0.4 Overall Rating Highly successful 2.8
Source: Operations Evaluation Mission.

60 Appendix 5
SOCIAL DEVELOPMENT IMPACT 1. Poverty. The poverty index rose sharply during the crisis (1999 base) from 14.7% in 1997 to its peak in 1999 when the index reached 23.5% and the number of people living below the poverty line reached 48 million. Since then, both the incidence and the number of poor slowly declined reaching 16.6% in 2004 and 34 million. The sharp rise in the incidence of poverty was the challenge addressed by the Social Protection Sector Development Program (SPSDP) aimed at mitigating the worst consequences of restricting access to education and health services to the poor in particular.
Figure A5.1: Poverty Index and Number of Poor People
17.614.7
19.9
23.5
18.9 18.4 17.6 17.4 16.634.2
29.1
39.8
48.0
37.2 37.0 35.7 37.3 36.1
0.0
5.0
10.0
15.0
20.0
25.0
1996 1997 1998 1999 2000 2001 2002 2003 2004-
10.0
20.0
30.0
40.0
50.0
60.0
Poverty Index (%) No Poor (m)
No. PoorPoverty Index
Sources: Biro Pusat Statistik (BPS) poverty estimates for individuals. 2. Education. The short-term impacts of the SPSDP show improvements in macro outcome indicators, as 82% of the scholarships reached the poor (1999 SUSENAS). One indicator is the dropout rate. Even among children belonging to the poorest quintiles, dropout rates at elementary and junior secondary, the targets of the SPSDP, declined during the height of the crisis years, the life of the SPSDP. Dropout rates among elementary students declined from 2.5% in 1998 to 1.7% in 2001, and among junior secondary from 1.8% to 1.5% (Biro Pusat Statistik [BPS], SUSENAS series). At these low levels, slight limitations can cause these rates to oscillate as observed for the initial years of decentralization, when social services provision became the responsibility of local governments and funding declined with the lifting of the block grants to schools and provision of scholarships to the poor. Dropout rates among the poorest quintile of students rose slightly and then declined again as funding for education services for the poor became available from fuel subsidy reduction compensation.

Appendix 5 61
Figure A5.2: Primary and Junior Secondary School Dropout Rates for the Total, Poorest and Richest Quintiles
JSS = junior secondary school, PS = primary school. Source: Special tabulations by Insan Hitawasana Sejahtera based on BPS SUSENAS series.
3. Enrollments at both primary and junior secondary remained fairly stable during the crisis and have increased after decentralization, not just for the rich but also for the poor. Primary school net enrollment1 for the poorest quintile continued to rise from 90% in 1998 to 92% in 2004, and junior secondary increased from 40% to 50% for the same years (BPS, SUSENAS series). These trends reflect rising recognition of the value of education for the lives of children. Increasingly parents are willing to invest in their children’s education.
Figure A5.3: Primary and Junior Secondary Net Enrollment Rates for the Total and Poorest Quintiles
Source: Special tabulations by Insan Hitawasana Sejahtera based on BPS SUSENAS series.
1 Net enrollment rate refers to the percentage of students attending a particular level of schooling over the relevant
school-age population.
Primary School Net Enrollment Rate
85.0
90.0
95.0
100.0
1993 1995 1997 1999 2001 2003
Q5-RichestTotalQ1-Poorest
0.0
20.0
40.0
60.0
80.0
100.0
1993 1995 1997 1999 2001 2003
Q5-RichestTotal Q1-Poorest
Junior Secondary Net Enrollment Rate
PS Dropout Rates
0.0
1.0
2.0
3.0
4.0
1993 1995 1997 1999 2001 2003
Q5-RichestTotal Q1-Poorest
JSS Dropout Rates
0.0
0.5
1.0
1.5
2.0
1993 1995 1997 1999 2001 2003
Q5-RichestTotalQ1-Poorest

62 Appendix 5
4. These national trends are generally followed in the provinces selected for the SPSDP, which is part of a nationwide program with funding from the World Bank and the Indonesian Government. The Scholarships and Grants Program mitigated the adverse socioeconomic consequences of the crisis on the poor in those provinces, as generally net enrollments continued to rise over the period of the crisis and beyond. 5. However, qualitative evidence of how well scholarship beneficiaries did in terms of their educational performance is not available as no rules or regulations require schools to maintain administrative records in a standard format to be passed on to higher levels. This is confirmed by a study done for the Central Independent Monitoring Unit (CIMU).2 6. In spite of the complexity and new approaches introduced by the SPSDP, and the problems encountered in the field, CIMU noted: “The general picture for 1998/99 was that the Scholarships and Grants Program worked well: Targeting of schools and students was conducted according to the rules. Almost a million junior secondary students received scholarships in fiscal 1999 (974,377 students) and 2000 (971,491 students), and 64,413 and 62,796 primary schools, and 10,766 and 10,493 junior secondary schools received block grants in each of fiscal years 1999 and 2000. 3 7. The scholarship program in particular specified attention to girls, which appears to have contributed to maintenance of the already, albeit still slightly, higher net enrollment rates among girls compared with boys, even among the poorest quintile. Contrary to popular belief, even among Indonesian feminists of a gender preference in access to schooling, even in the poorest households, girls have already outdone boys at both primary and junior secondary.
Figure A5.4: Infant Mortality in Indonesia
142
112
75 70 6857
46 4735
0
20
40
60
80
100
120
140
160
1967 1982 1989 1995 2000
Dea
ths
per 1
,000
live
birt
hs
Calendar year
Note: These are the only reliable infant mortality estimates. Sources: Statistics Indonesia, National Family Planning Coordinating Board, Ministry of
Health, ORC Macro (2003), Indonesia Demographic and Health Survey 2002-2003 (Figure 10.2: 110, based on 1971 Census, 1980 Census, 1987 National Indonesia Contraceptive Prevalence Survey, 1990 Census, 1991 Indonesia Demographic and Health Survey (IDHS) , 1994 IDHS, 1997 Census, 2000 Census, 2002-2003 IDHS.
2 Central Independent Monitoring Unit. 2000. Sixth Quarterly (Final) Report. Jakarta. 3 Asian Development Bank. 2003. Program Completion Report on the Social Protection Sector Development
Program. Manila. Appendix 2.
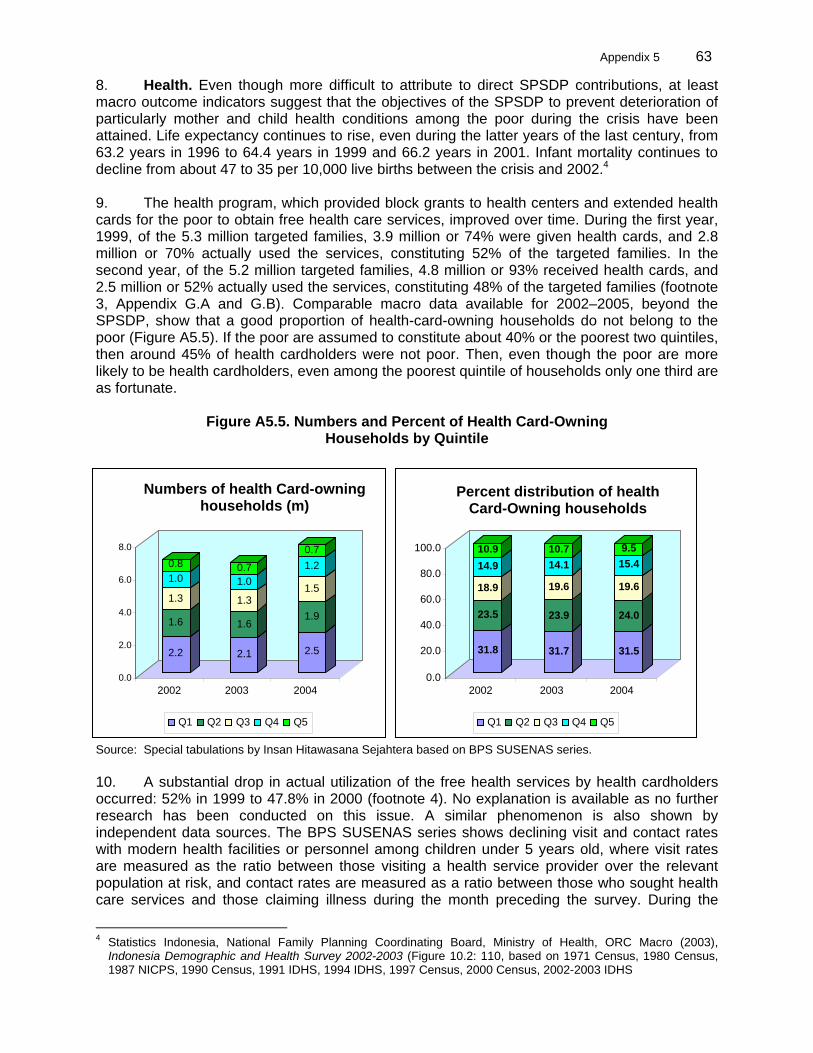
Appendix 5 63
8. Health. Even though more difficult to attribute to direct SPSDP contributions, at least macro outcome indicators suggest that the objectives of the SPSDP to prevent deterioration of particularly mother and child health conditions among the poor during the crisis have been attained. Life expectancy continues to rise, even during the latter years of the last century, from 63.2 years in 1996 to 64.4 years in 1999 and 66.2 years in 2001. Infant mortality continues to decline from about 47 to 35 per 10,000 live births between the crisis and 2002.4 9. The health program, which provided block grants to health centers and extended health cards for the poor to obtain free health care services, improved over time. During the first year, 1999, of the 5.3 million targeted families, 3.9 million or 74% were given health cards, and 2.8 million or 70% actually used the services, constituting 52% of the targeted families. In the second year, of the 5.2 million targeted families, 4.8 million or 93% received health cards, and 2.5 million or 52% actually used the services, constituting 48% of the targeted families (footnote 3, Appendix G.A and G.B). Comparable macro data available for 2002–2005, beyond the SPSDP, show that a good proportion of health-card-owning households do not belong to the poor (Figure A5.5). If the poor are assumed to constitute about 40% or the poorest two quintiles, then around 45% of health cardholders were not poor. Then, even though the poor are more likely to be health cardholders, even among the poorest quintile of households only one third are as fortunate.
Figure A5.5. Numbers and Percent of Health Card-Owning Households by Quintile
Source: Special tabulations by Insan Hitawasana Sejahtera based on BPS SUSENAS series. 10. A substantial drop in actual utilization of the free health services by health cardholders occurred: 52% in 1999 to 47.8% in 2000 (footnote 4). No explanation is available as no further research has been conducted on this issue. A similar phenomenon is also shown by independent data sources. The BPS SUSENAS series shows declining visit and contact rates with modern health facilities or personnel among children under 5 years old, where visit rates are measured as the ratio between those visiting a health service provider over the relevant population at risk, and contact rates are measured as a ratio between those who sought health care services and those claiming illness during the month preceding the survey. During the
4 Statistics Indonesia, National Family Planning Coordinating Board, Ministry of Health, ORC Macro (2003),
Indonesia Demographic and Health Survey 2002-2003 (Figure 10.2: 110, based on 1971 Census, 1980 Census, 1987 NICPS, 1990 Census, 1991 IDHS, 1994 IDHS, 1997 Census, 2000 Census, 2002-2003 IDHS
31.8
23.5
18.9
14.910.9
31.7
23.9
19.6
14.110.7
31.5
24.0
19.6 15.4 9.5
0.0
20.0
40.0
60.0
80.0
100.0
2002 2003 2004
Percent distribution of health Card-Owning households
Q1 Q2 Q3 Q4 Q5
2.2
1.6 1.3 1.0 0.8
2.1
1.6 1.3 1.0 0.7
2.5
1.9
1.5 1.2 0.7
0.0
2.0
4.0
6.0
8.0
2002 2003 2004
Numbers of health Card-owninghouseholds (m)
Q1 Q2 Q3 Q4 Q5

64 Appendix 5
years of the crisis, these rates declined for all children during the crisis years, and even declined for the richest quintile for the same years. Again the reasons remain unclear as no research has been attempted to explain this phenomenon.
Figure A5.6. Visit and Contact Rates to Health Services by the Poorest
and Richest Quintiles
Q1-Poorest - Visit Rates to Health Services
0.0
5.0
10.0
15.0
20.0
1993
1994
1995
1996
1997
1998
1999
2000
2001
2002
2003
2004
Public hospital Health centerPrivate hospital DoctorClinic Paramedic
Q5-Richest - Visit Rates to Health Services
0.0
5.0
10.0
15.0
20.0
1993
1994
1995
1996
1997
1998
1999
2000
2001
2002
2003
2004
Public hospital Health centerPrivate hospital DoctorClinic Paramedic
Q1-Poorest - Contact Rates with Health Services
0.0
10.0
20.0
30.0
40.0
50.0
60.0
70.0
1993
1994
1995
1996
1997
1998
1999
2000
2001
2002
2003
2004
Public Hospital Health Center
Private Hospital Doctor's Private Practice
Clinic Paramedics Private Practice
Q5-Richest - Contact Rates with Health Services
0.0
10.0
20.0
30.0
40.0
50.0
60.0
70.0
1993
1994
1995
1996
1997
1998
1999
2000
2001
2002
2003
2004
Public Hospital Health Center
Private Hospital Doctor's Private Practice
Clinic Paramedics Private Practice
Notes: Visit rates are measured as a percentage of all people who visit a health center, while contact rates are measured in terms of people who claim to have been ill and then visited a health service.
Source: Special tabulations by Insan Hitawasana Sejahtera based on BPS SUSEAS series.

Appendix 5 65
Figure A5.7: Visit and Contact Rates to Modern Health Facilities/Personnel by Children Under 5 Years of the Total, Poorest, and Richest Quintiles
Visit rate to modern health facilities/personnel by children
under 5 years
0.0
10.0
20.0
30.0
40.0
50.0
1993
1994
1995
1996
1997
1998
1999
2000
2001
2002
2003
2004
Q5-RichestTotalQ1-Poorest
Contact rate to modern health facilities/personnel by children
under 5 years
0.0
20.0
40.0
60.0
80.0
1993
1994
1995
1996
1997
1998
1999
2000
2001
2002
2003
2004
Q5-RichestTotalQ1-Poorest
Notes: Visit rates are measured as a percentage of all people who visit a health center, while contact rates are measured in terms of people who claim to have been ill and then visited a health service. Modern health facilities/personnel consist of public hospital, health center, private hospital, doctor, clinic, and paramedic.
Source: Special tabulations by Insan Hitawasana Sejahtera based on BPS SUSENAS series.
Figure A5.8: Visit and Contact Rates to Modern Health Facilities/Personnel by Total, Poorest, and Richest Quintiles
Visit rates to modern health facilities/personnel
0.0
5.0
10.0
15.0
20.0
1993
1994
1995
1996
1997
1998
1999
2000
2001
2002
2003
2004
Q5-RichestTotalQ1-Poorest
Contact rates to modern health facilities/personnel
0.0
20.0
40.0
60.0
80.0
1993
1994
1995
1996
1997
1998
1999
2000
2001
2002
2003
2004
Q5-RichestTotalQ1-Poorest
Notes: Visit rates are measured as a percentage of all people who visit a health center, while contact rates are measured in terms of people who claim to have been ill and then visited a health service. Modern health facilities/personnel consist of public hospital, health center, private hospital, doctor, clinic, and paramedics.
Source: Special tabulations by Insan Hitawasana Sejahtera based on BPS SUSENAS series.

66 Appendix 5
11. As such, this decline cannot be attributed to availability of health cards for the poor as according to the independent source and for years beyond the SPSDP, 55% of the health cards were held by the poor (BPS SUSENAS series for 2002–2004). Whether they visited health providers or not, the overall health condition of the Indonesian population did not deteriorate during the crisis. Moreover, as Knowles and Marzolf say, even though the health program was certainly not perfectly targeted, maintenance of health service utilization rates and health outcomes among the poor is in and by itself an impressive achievement.5 12. Mother and Child Health Assistance. Provision of block grants to health centers and incentives to village midwives to reach out to pregnant women appears to have contributed to rising reliance on prenatal, birth, and antenatal services as measured by the 1994 and 1997 demographic and health survey and 2001 special survey on the social safety net program. Prenatal services rose from 87.5% to 96.3%, birth services by medical personnel rose from 5.5% to 74.1%, and frequency of antenatal services increased significantly.6 On the other hand, the demographic and health surveys recorded declining percentages of births attended by traditional birth attendants; they halved over a decade from 64% in 1991 to 32% in 2002–2003.7 Women increasingly seek modern health services, including births attended by doctors or midwives, rising during the same period from 32% to 55%. Similar trends are also recorded by the BPS SUSENAS series, modern medical personnel attend an increasing proportion of births. Among the poorest quintile, the proportion of births attended by modern medical personnel rose from 19% in 1993, continuously rising to 40% in 2000, and by 2004 reaching 43%. In the mean time for the richest quintile the rise was slower, from 82% in 1993 to 91% in 2004, with the remaining likely due to distance from modern facilities. This trend, to increasingly rely on modern medical services with birth attendance, is also a function of rising education, including among poor mothers. 13. The component to maintain poor people’s access to family planning services, particularly injectables, also shows positive outcomes. The demographic and health survey records continuous rises in current use of modern contraception among married women, from 50% in 1991 to 57% at the time of the crisis, and by 2002/03 already 60%. Provision of injectables under the SPSDP records continuous rises from 12% to 28% during the same period.8 Consistent with the objective of the SPSDP, to maintain contraceptive services to the poor, macro national results show that during the crisis period before decentralization, at least contraceptive user rates among the poorest quintile remained stable (BPS, SUSENAS series).
5 Knowles, James C. and James R. Marzolf. 2003. Health Financing for the Poor in Indonesia, paper prepared for
the Regional Study on Pro-poor Health Financing, The World Bank, Washington, DC. 6 BAPPENAS, AusAID, and ADB, 2004, Figures 2-3, p.29 7 Statistics Indonesia, National Family Planning Coordinating Board, Ministry of Health, and ORC Macro, Indonesia
Demographic and Health Survey 2002–2003. 8 Statistics Indonesia, National Family Planning Coordinating Board, Ministry of Health, and ORC Macro (2003),
Indonesia Demographic and Health Survey 2002–2003.

Appendix 5 67
Figure A5.9: Trends in Delivery Assistance and Percent Births Attended by Modern Medical Personnel
Trends in Delivery Assistance
6460
54
323237
43
55
0
10
20
30
40
50
60
70
1991 1994 1997 2002-03
Traditional birth attendant Doctor or midw ife
% Births attended by modern medical personnel
0
20
40
60
80
100
1993
1994
1995
1996
1997
1998
1999
2000
2001
2002
2003
2004
Q5-RichestTotalQ1-Poorest
Source: Statistics Indonesia, National Family Planning Coordinating Board, Ministry of Health, and ORC Macro, Indonesia Demographic and Health Survey 2002–2003.
Notes: Modern medical personnel include doctors, midwives, and paramedics.
Sources: Special tabulations by IHS based on BPS SUSENAS series
Figure A5.10: Contraception Use
Percent currently married women using contraception
49.754.7
57.460.3
0
10
20
30
40
50
60
70
1991 1994 1997 2002-03
Trends in current use of contraception
1513 12
17
10
1515
8
21
13
6
28
0
5
10
15
20
25
30
Pill IUD Injectables
1991 1994 1997 2002-03
Source: Statistics Indonesia, National Family Planning Coordinating Board, Ministry of Health, and ORC Macro (2003), Indonesia Demographic and Health Survey 2002–2003.

68 Appendix 5
Figure A5.11: Modern Contraceptive Use Rate
Modern contraceptive use rate
5253 54 53
55 55 54 53 53 53 5456
4950
5150
53 52 53 53 52 5254
55
40
45
50
55
60
1993
1994
1995
1996
1997
1998
1999
2000
2001
2002
2003
2004
Total Q1-Poorest
Source: Special tabulations by Insan Hitawasana Sejahtera based on BPS SUSENAS series
14. Nutrition. As poor nutrition has been recognized to exist in Indonesia, particularly in the arid areas of Eastern Indonesia where frequent harvest failures are a way of life and people then depend on the palm. Even in Java, known for its irrigated rice fields, poor people live in the mountains often having to rely on cassava. The crisis was feared to exacerbate the situation. The SPSDP nutrition program may well have contributed to lowering malnutrition prevalence among children. Prevalence of moderate malnutrition (< –2 standard deviations) declined from 29.5% in 1998 to a low of 24.6% in 2001 to rise again thereafter to 26.1% in 2001, 27.3% in 2002, and 27.5% in 2003. Severe malnutrition declined from 10.5% in 1998 to the lowest rate to 6.3% in 2001, to also rise to 8.0% in 2002 and 8.3% in 2003. The rise in malnutrition prevalence after 2001 is attributed to discontinuation of the supplementary feeding program.
Table A5: Malnutrition Prevalence among Infants, 1998–2003 (%) (weight for age < –2 standard deviations and < –3 standard deviations)
Nutrition Status 1989 1992 1998 1999 2000 2001 2002 2003
<–2 standard deviations (nutrition deficiency) 37.5 35.5 29.5 26.4 24.6 26.1 27.3 27.5
<–3 standard deviations (malnutrition) 6.3 7.2 10.5 8.1 7.5 6.3 8.0 8.3
Source: Republic of Indonesia, Asian Development Bank.2004. Social Safety Net (JPS): Providing Hope to Indonesians Underprivileged. Table 10, p. 63.
15. Policy. At the policy level, the SPSDP initiatives have contributed to focusing concerns for the poor and provision of social services such as education. Civil society continues to demand the promised allocation of at least 20% of the national and local budgets above and beyond salaries for education (as stated in Law No. 20 of 2003 on the National Education System). One of the consequences is reflected in the 2005 fuel subsidy known as PKPS BBM (Program Kompensasi Pengurangan Subsidi Bahan Bakar Minyak, or Oil Subsidy Decrease Compensation Program), which provides subsidies for education, health, and rural infrastructure, and cash transfers to the poor (the latter to compensate for fuel price rises to be introduced in October 2005).

Appendix 5 69
16. As part of the education policy on compulsory basic education introduced in 1994 (Inpres, Special Presidential Instruction, No. 1, 1994), the education subsidy from the Fuel Tax Compensation Scheme is to provide free basic education for all (6 years primary and 3 years junior secondary for public as well as private and Ministry of National Education [MONE] and Ministry of Religious Affairs [MORA] schools). The current education subsidy is known as BOS (Biaya Operasional Sekolah, or school operating costs) compensates schools Rp248,000 per primary school student for 28,649,545 students, and Rp371,000 per junior secondary school student for 10,858,615 students, for a total of Rp11.13 trillion (Kompas 17 May 2005). With the provision of free education for all, the purpose of this program is to lift financial deterrents to attend school among the poor, thereby expecting the poor, especially those who have either already left the system or not yet entered the system, to attend school locally. 17. The system of delivery follows the model designed and introduced under the SPSDP for direct transfers to beneficiaries, i.e., schools and villages through the post office. The Bank Rakyat Indonesia (BRI), which refused to participate in the SPSDP, is an active partner in the much larger scale cash transfers directly to beneficiaries, providing registered and poor cardholders with Rp100,000 per month for 12 months, the first tranche was distributed in October 2005. 18. Fuel subsidy compensation for health in the amount of Rp3.6 trillion (Suara Pembaruan, 7 Sep 2005) is provided to PT Askes, a state company, which is to provide free health care for the poor (minister of health decree 1202, 2005). The Government guarantees free health services at health centers (puskesmas) and referrals for out-patient and class 3 in-patient care. Unlike the traditional supply-side model of relying on public hospitals for (economic) catastrophic health programs, which are beset with failures, especially for the poor and other excluded groups, the Indonesian health card system has been named a good example of public provision that provides some insurance for all.9 19. Targeting. With no information available on the actual target group most severely affected by the crisis, the SPSDP introduced the notion of devolving this responsibility of selecting eligible beneficiaries to local committees, supposedly consisting of equal numbers of representatives from Government and civil society. While not perfect, this very difficult task was done reasonably well as indicated by the macro outcome indicators. 20. According to the rules, targeting of poor beneficiaries for the health program was the responsibility of village teams, established by the village head, consisting of village officials, family planning field workers, village midwives (or appointed health center staff, community leaders, PKK members, and other nongovernment organizations, with equal representation from Government and the community. The list of poor families is then sent to the local health center, and then forwarded to the district/municipal health service. It serves as the basis for funding allocation for the health centers and village midwifes. The poor families on the list are eligible to receive a health card (kartu sehat), (introduced under the SPSDP) from the health centers and countersigned by the village head, which is valid for 1 year only. Health card owners are eligible for free health services under the program.10 21. Such a system is always subject to problems. Recording/writing of names on lists, which are then transferred to cards, are often subject to mistakes, and as a result can then be 9 World Bank. 2006. World Development Report 2006. Washington, DC, p. 12. 10 Pedoman Pelaksanaan Program Jaring Pengaman Sosial Bidang Kesehatan JPS-BK, Departemen Kesehatan RI,
Agustus, Tahun 1999). The poor were supposed to coincide with those identified by the BKKBN system as belonging to the bottom two poorest categories of Prasejahtera and Sejahtera I (pre-prosperous and prosperous I) (interview with Cecile Gregory, 30 September 2006).

70 Appendix 5
misused; economists refer to this as moral hazard. Then, since the health center issues the health cards, and the health center is more likely located in a subdistrict, the villagers living great distances from their nearest health center may not be informed that the cards are actually already available, and when not collected may well be distributed to others of the health center distributor’s liking. Hence, even with names and addresses submitted during registration, no guarantee can be given that those on the list will actually be the beneficiaries or users of these health cards. 22. Even though not coinciding with the SPSDP and the follow-up HNSDP, data collected in SUSENAS 2002–2004 suggests leakages of these health cards, as measured in terms of the shares of health cards not owned by the poorest households. As ownership of these health cards allows for free basic health services in health centers and referred hospitals for major health services, they are valued not just by the poor, the target of the program. Since the health cards are designed under the SPSDP, and continued under the HNSDP, which ended in 2003, the SUSENAS results show that the beneficiaries of these health cards extend well beyond the poor—all benefiting from free health services. Assuming that the poor constitute the bottom 40% of households, the data suggest that about 55% of health cards are held by poor households. 23. A study of a health center in Depok West Java11 found the health cadres identified and listed the poor to be allocated health cards; these people often visit the health center where the cards are assigned. The role of the village head is only to countersign the list, while all other administration is handled by the head of the health center. This study concluded that the low use of health cards by the poor (less than 50% of health cardholders used the service during the year) is affected by the relative distance of an assigned health center to the residence of the cardholder. In other words, health cardholders are not free to choose the health center from which they can obtain free health care. Often the distance was too great for the poor to benefit from this free service as transport costs may well exceed the cost of services, which can be obtained for a fee from a closer health service. Conditions of a particular assigned health center also determine the choice of health services provider, irrespective of the fees. In sum, even the poor with access to health cards make rational choices driven by overall costs and quality of service. Another minor problem could also have arisen from inconsistency in timing between targeting and disbursement of funds. An example given by Toto Purwanto, of CIMU Education, concerns pregnancies delivered before funding was disbursed to a particular health center. 24. By design, the education component of the SPSDP takes a supply-side approach, focusing on provider institutions rather than potential beneficiaries. Hence the method of allocating scholarships was only available to children who were at school. Thus, those who had already dropped out, who were often those from the poorest groups, were excluded. In addition, students from poor families graduating from primary school who were considering transferring to junior secondary school had no assurance that once enrolled they would receive financial assistance. Others claim that this is attributed to poor government management of the program; preparations were started late resulting in scholarships being available several months after the beginning of the school year and thus selection was from among children who were still enrolled in school. In the meantime, little attempt was made to reach students who had already dropped out or who did not make the transition between levels.12 25. Beneficiary Selection Procedures. The instructions specify that district, subdistrict, and school selection committees be established. These committees are to consist of equal representation from Government and civil society. Selection criteria for scholarship recipients 11 Yuniar, Rosy. 2004. Faktor-faktor yang Mempengaruhi Perilaku Keluarga Miskin dalam Memanfaatkan Kartu sehat
PKPS-BBM-BidKes, di Puskesmas Baktijaya, Depok Tahun 2004, undergraduate thesis at the Faculty of Social and Political Science, University of Indonesia. Jakarta.
12 CIMU report to the National Review Board, September 1999.

Appendix 5 71
include (i) belong to either pre-welfare or welfare 1 categories on the BKKBN (national family planning) list; (ii) attend grades 4–6 of elementary or grades 1–3 of either junior or senior secondary; (iii) recently dropped out or threatened to drop out for financial reasons; and (iv) not currently receiving another scholarship. About half the scholarships are to go to girls; and priority is given to children living farther from school, and to orphans. Whereas district/municipality committees determine the number of scholarship recipients per secondary school, subdistrict committees decide on the number of scholarship recipients per primary school. School committees receive the allotted number of scholarships and select the actual recipient. 26. The general picture for 1998/99 was that the Scholarships and Grants Program worked well: Targeting of schools and students was conducted according to the rules. A very large number of scholarships and grants were successfully delivered and recipients received the intended amounts. A relatively small amount of the funds allocated “leaked” from the program. On the other hand, CIMU noted that the composition of scholarships and grants program committees fell well short of the target of 50% representation from civil society. The proportion for district committees was typically 25%. The performance of district committees in allocating scholarships and grants to appropriate secondary schools and subdistricts was mediocre, partly due to the paucity of the data used.13 27. Coordination. The Board’s concern about possible difficulties faced in coordination of numerous local institutions in 16 provinces separated by long geographic distances; and the complexity of implementation arrangements, which were complex, broad in scope, and involved a number of international funding agencies, were handled in the field as implementation was continuously being monitored and adjustments made when necessary. The government completion report (footnote 3) acknowledges problems of coordination. To overcome this problem the central Government appealed to local governments to improve coordination. Besides, the project secretariat would allocate funds for studies to find out how to improve district coordination, which was then followed up by modifications. Moreover, Asian Development Bank (ADB) supervision through frequent missions was very helpful to SPSDP implementation. During these trips the missions often conducted field visits as part of project monitoring and problem solving. 28. Timeliness. The SPSDP was formulated in a record-breaking 12 weeks from preparation to approval. At times, however, implementation arrangements suffered some delays due to its complexity. Accounting for expenditures also caused bottlenecks. Yet, while the Project was generally implemented as scheduled, some variation between the time for planned disbursement and actual disbursement did occur, as on occasion insufficient funds were available in the imprest account to allow disbursement according to the schedule. The problem stemmed from inconsistency in the time planned (3 months) and actual time to replenish the account (6 months). While initially the Government responded by supplying bridging funds, over time limitations in general government revenues prevented the Government from continuing such adjustments.14 ADB review missions visited regularly, usually every other month. The missions usually had to solve problems faced by Jaring Pengaman Sosial (JPS) implementers,
13 Summary of report to the National Review Board, September 1999, first year, and report to the National Review
Board: March 2000 and final report. 14 On the other hand, the issue with noninclusion of those who had already dropped out can partly be attributed to
timeliness of receiving the money. While the academic year starts in July, the first tranche for scholarships and block grants was only distributed in August 1998. In the original schedule, scholarships and block grants were distributed quarterly or four times within a year, 25 % each. However, actually, scholarships and block grants were distributed like this: August 1998, Rp123,028,960,000; September 1999 Rp21,378,660,000; January 1999, Rp101,435,120,000; April 1999, Rp153,685,100,000 ; May 1999, Rp6,212,640,000; October 1999, Rp200,360,920,000 ; and March 2000, Rp200,360,920,000.

72 Appendix 5
mainly in finance. In addition they directly observed project implementation in the field and helped identify solutions when problems arose. 29. Since the SPSDP was urgent assistance, almost half of the loan package ($300 million) ended up as direct support.15 One of the SPSDP innovations was to rely on the postal service to remit money directly to millions of beneficiaries throughout the country, including the SPSDP provinces (for education other provinces were funded by the World Bank and the Government). From all accounts, reliance on the centralized postal system, rather than the conventional system through local state disbursement offices, has been far more efficient. Besides being more efficient in time, the postal system was also financially more efficient. For instance, compared with the banking system, the postal system did not demand transfer costs, which would have been significant given the program design to remit money directly to beneficiaries, all together numbering several millions. The conventional disbursement system is a larger bureaucracy and thus more costly for beneficiaries. 30. Even though the system of remittance delivery to final beneficiaries was novel and bypassed several levels of government, often the source of leakages, the system could not completely eliminate interventions by government officials who were required to sign off on requests for disbursements. Of course no system is foolproof against leakages, but leakages can be reduced, and happened with the role of the independent monitor and of civil society, particularly the press, which has gained great freedom and is currently one of the freest at least in the Asia-Pacific region. Hence, leakages were identified, but as CIMU reports, “…generally, a relatively small amount of the funds allocated ‘leaked’ from the Program.16 31. A very important lesson learned from this innovation of direct transfers to final beneficiaries and having CIMU and the accompanying Complaints Resolution Unit, is that improvements in reducing corruption have been made. Even more important is that the institution of an independent monitoring and complaints resolution unit are only effective when problems and/or complaints are resolved. In other words, establishment of an independent monitoring unit, whether truly independent or quasi independent, can only be effective when findings of improper implementation are being acted upon. 32. Monitoring and Reporting. This responsibility was satisfactorily carried out by CIMU. Those interviewed on the education component, Scholarships and Grants Program, are all satisfied with the monitoring activities conducted by the independent (of government) CIMU, which conducted serious monitoring and activated an operating complaints resolution unit. The reporting mechanism provided proper feedback affecting policy changes and decision making as reflected by frequent missions and the numerous changes in implementation reflected in the number of loan covenants. 33. Capacity Building. The SPSDP is acknowledged to have made a significant contribution to capacity building. The Government has adopted some of the innovations for the distribution of the fuel tax compensation funds. While outputs should be monitored by the respective line ministries, Indonesia has the benefit of a national statistical office, which annually conducts socioeconomic surveys and intermittent specialized surveys on demand. These surveys can serve as the basis for measuring outcome indicators to monitor overall progress by the sector ministries and by the poor.
15 Direct support was direct payments to beneficiaries such as block grants/scholarship given directly to schools,
funds given to health centers for the procurement of contraceptives and blended food, and financial support to village midwives.
16 CIMU report to the National Review Board, September 1999.

Appendix 5 73
34. Even though no countervailing exercise can be conducted for this assignment because the program became a national program with funding from the Government and the World Bank and hence no control group is available, the importance of the SPSDP is that poverty gained priority for the Government and the Government has to deal with poverty and provide social services for the poor.