Embed Size (px)
Citation preview
Performance Highlights For the Financial Year ended 31-March-2015
Sl. No.
Areas of Presentation Slide No.
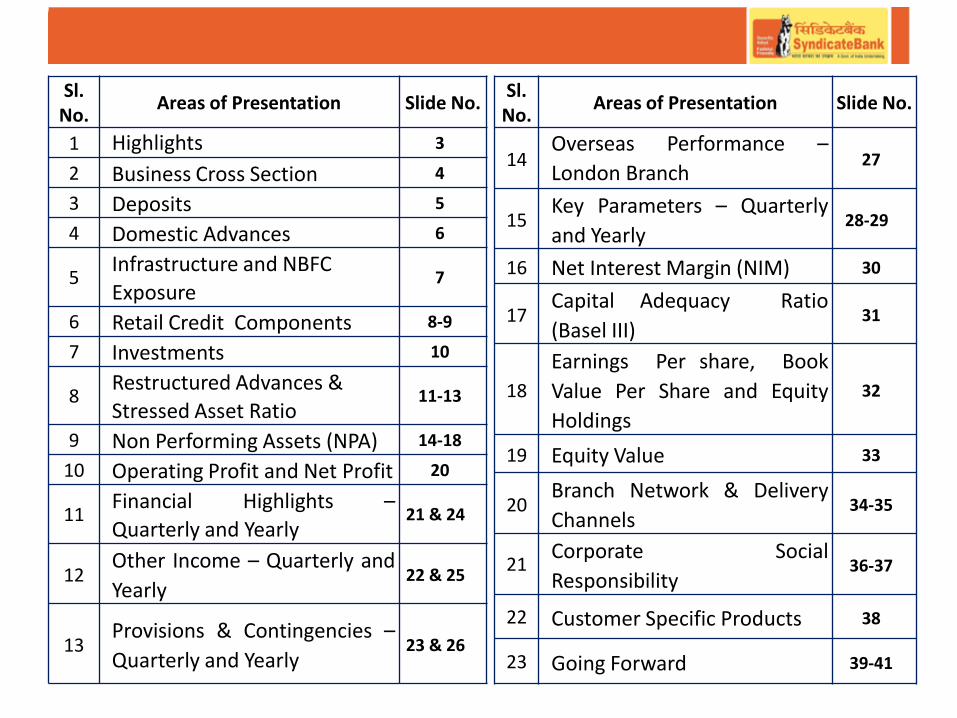
1 Highlights 3
2 Business Cross Section 4
3 Deposits 5
4 Domestic Advances 6
5 Infrastructure and NBFC
Exposure 7
6 Retail Credit Components 8-9
7 Investments 10
8 Restructured Advances &
Stressed Asset Ratio 11-13
9 Non Performing Assets (NPA) 14-18
10 Operating Profit and Net Profit 20
11 Financial Highlights –
Quarterly and Yearly 21 & 24
12 Other Income – Quarterly and
Yearly 22 & 25
13 Provisions & Contingencies –
Quarterly and Yearly 23 & 26
Sl. No.
Areas of Presentation Slide No.
14 Overseas Performance –
London Branch 27
15 Key Parameters – Quarterly
and Yearly 28-29
16 Net Interest Margin (NIM) 30
17 Capital Adequacy Ratio
(Basel III) 31
18
Earnings Per share, Book
Value Per Share and Equity
Holdings
32
19 Equity Value 33
20 Branch Network & Delivery
Channels 34-35
21 Corporate Social
Responsibility 36-37
22 Customer Specific Products 38
23 Going Forward 39-41
Capital
Margin
Other Income
Profit
Business
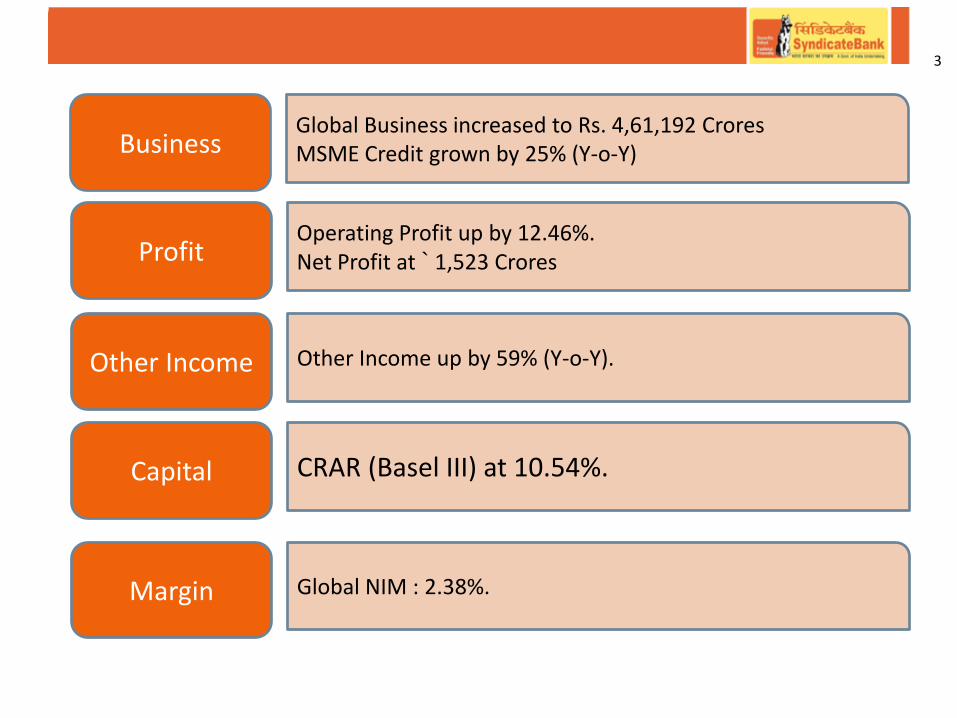
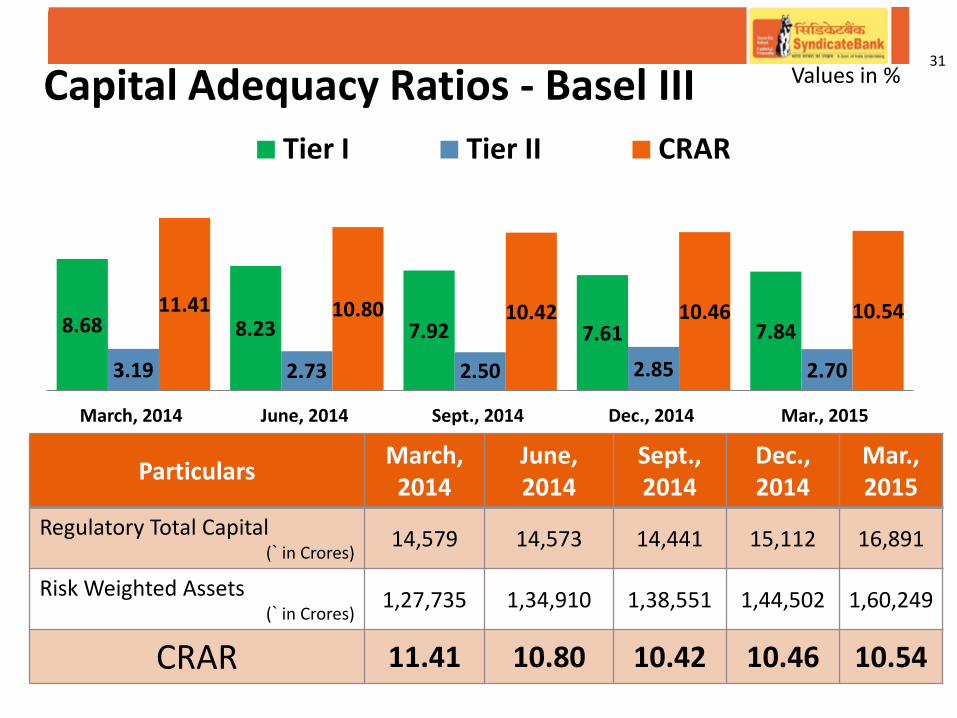
CRAR (Basel III) at 10.54%.
Global NIM : 2.38%.
Global Business increased to Rs. 4,61,192 Crores MSME Credit grown by 25% (Y-o-Y)
Operating Profit up by 12.46%. Net Profit at ` 1,523 Crores
Other Income up by 59% (Y-o-Y).
3
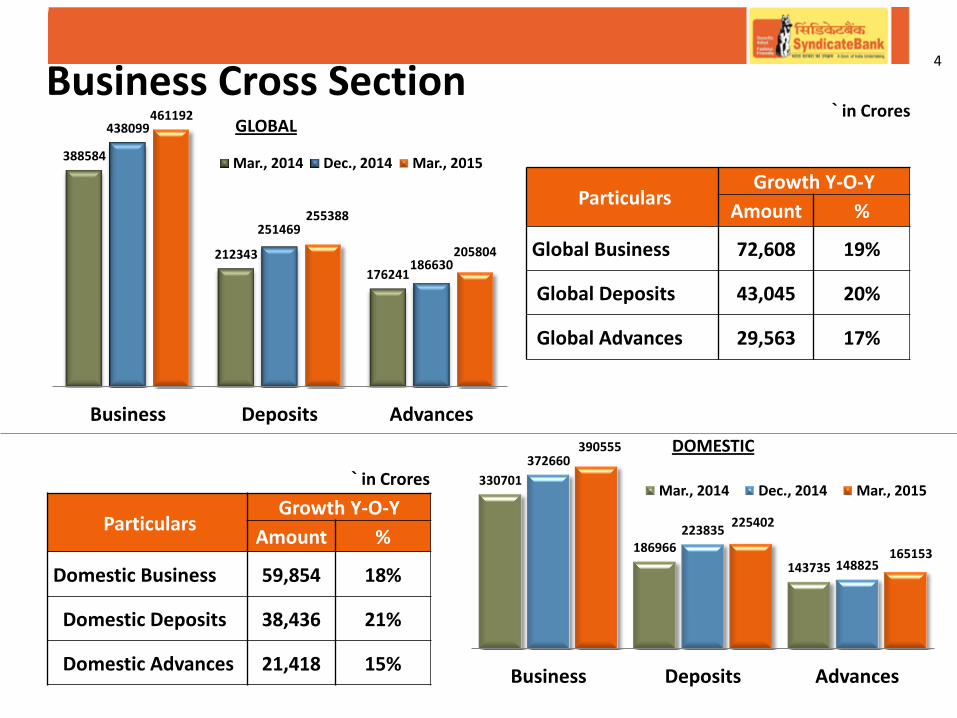
` in Crores
388584
212343
176241
438099
251469
186630
461192
255388
205804
Business Deposits Advances
Mar., 2014 Dec., 2014 Mar., 2015
330701
186966
143735
372660
223835
148825
390555
225402
165153
Business Deposits Advances
Mar., 2014 Dec., 2014 Mar., 2015
GLOBAL
DOMESTIC
Particulars Growth Y-O-Y
Amount %
Global Business 72,608 19%
Global Deposits 43,045 20%
Global Advances 29,563 17%
Particulars Growth Y-O-Y
Amount %
Domestic Business 59,854 18%
Domestic Deposits 38,436 21%
Domestic Advances 21,418 15%
Business Cross Section 4
` in Crores
`. in Crores 55998
13968
42030
62508
17983
44525
63713
17246
46467
Total CASA Current Savings
Mar., 2014 Dec., 2014 Mar., 2015
Particulars March, 2014 December, 2014 March, 2015 Y-O-Y
Growth %
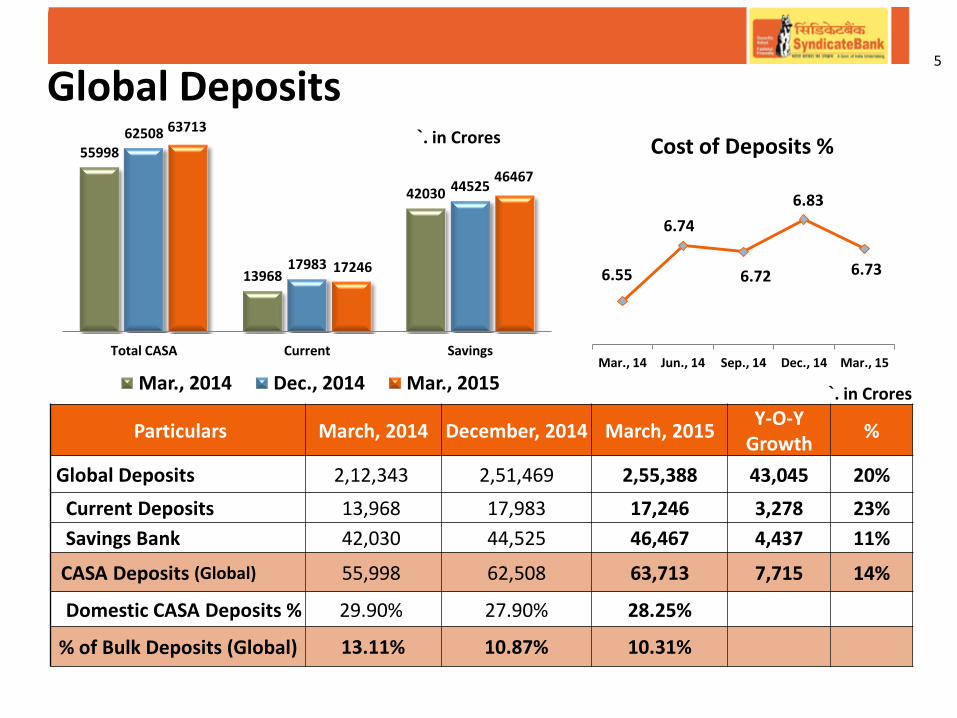
Global Deposits 2,12,343 2,51,469 2,55,388 43,045 20%
Current Deposits 13,968 17,983 17,246 3,278 23%
Savings Bank 42,030 44,525 46,467 4,437 11%
CASA Deposits (Global) 55,998 62,508 63,713 7,715 14%
Domestic CASA Deposits % 29.90% 27.90% 28.25%
% of Bulk Deposits (Global) 13.11% 10.87% 10.31%
`. in Crores
6.55
6.74
6.72
6.83
6.73
Mar., 14 Jun., 14 Sep., 14 Dec., 14 Mar., 15
Cost of Deposits %
Global Deposits 5
Domestic Advances
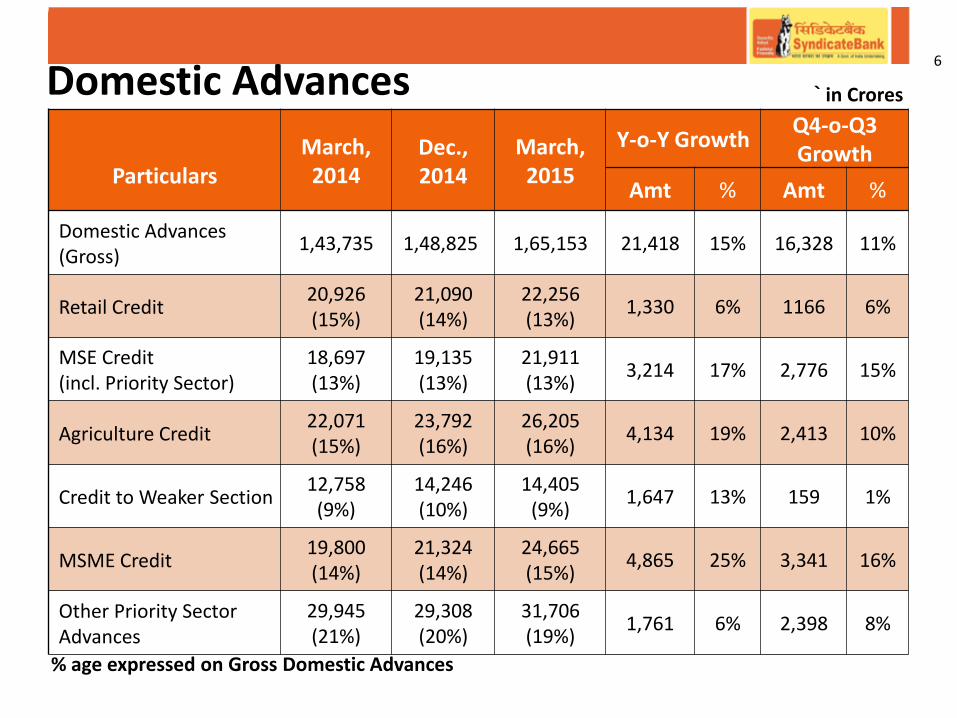
% age expressed on Gross Domestic Advances
Particulars
March, 2014
Dec., 2014
March, 2015
Y-o-Y Growth Q4-o-Q3 Growth
Amt % Amt %
Domestic Advances (Gross)
1,43,735 1,48,825 1,65,153 21,418 15% 16,328 11%
Retail Credit 20,926 (15%)
21,090 (14%)
22,256 (13%)
1,330 6% 1166 6%
MSE Credit (incl. Priority Sector)
18,697 (13%)
19,135 (13%)
21,911 (13%)
3,214 17% 2,776 15%
Agriculture Credit 22,071 (15%)
23,792 (16%)
26,205 (16%)
4,134 19% 2,413 10%
Credit to Weaker Section 12,758
(9%) 14,246 (10%)
14,405 (9%)
1,647 13% 159 1%
MSME Credit 19,800 (14%)
21,324 (14%)
24,665 (15%)
4,865 25% 3,341 16%
Other Priority Sector Advances
29,945 (21%)
29,308 (20%)
31,706 (19%)
1,761 6% 2,398 8%
` in Crores
6
Infrastructure and NBFC Exposure 7
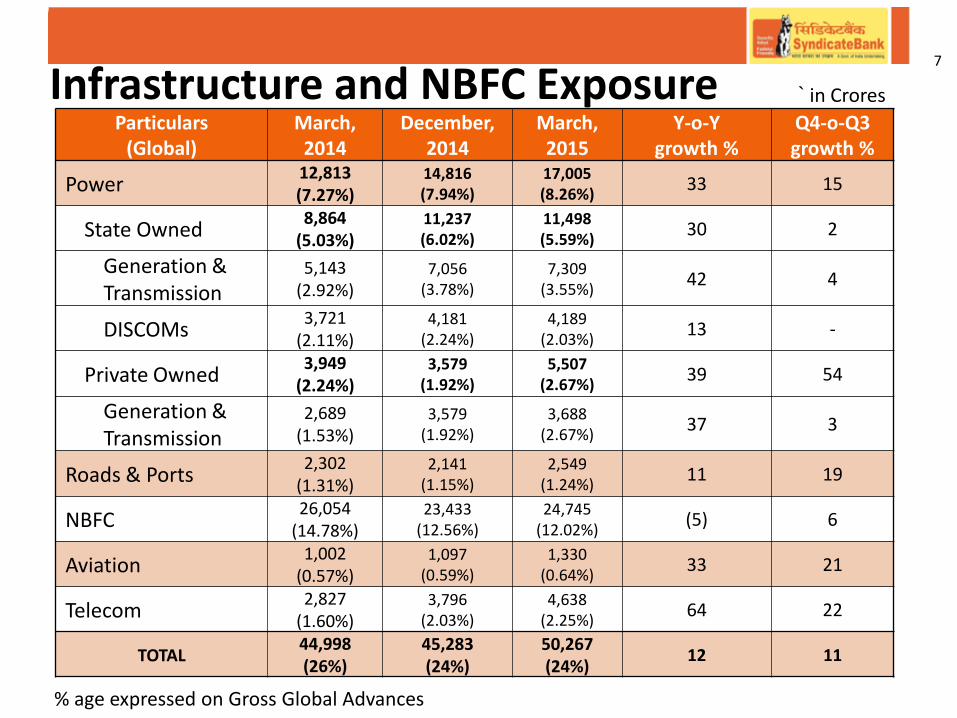
% age expressed on Gross Global Advances
Particulars (Global)
March, 2014
December, 2014
March, 2015
Y-o-Y growth %
Q4-o-Q3 growth %
Power 12,813 (7.27%)
14,816 (7.94%)
17,005 (8.26%)
33 15
State Owned 8,864
(5.03%) 11,237 (6.02%)
11,498 (5.59%)
30 2
Generation & Transmission
5,143 (2.92%)
7,056 (3.78%)
7,309 (3.55%)
42 4
DISCOMs 3,721
(2.11%) 4,181
(2.24%) 4,189
(2.03%) 13 -
Private Owned 3,949
(2.24%) 3,579
(1.92%) 5,507
(2.67%) 39 54
Generation & Transmission
2,689 (1.53%)
3,579 (1.92%)
3,688 (2.67%)
37 3
Roads & Ports 2,302
(1.31%) 2,141
(1.15%) 2,549
(1.24%) 11 19
NBFC 26,054
(14.78%) 23,433
(12.56%) 24,745
(12.02%) (5) 6
Aviation 1,002
(0.57%) 1,097
(0.59%) 1,330
(0.64%) 33 21
Telecom 2,827
(1.60%) 3,796
(2.03%) 4,638
(2.25%) 64 22
TOTAL 44,998 (26%)
45,283 (24%)
50,267 (24%)
12 11
` in Crores
Particulars
March, 2014
Dec., 2014
March, 2015
Growth Y.O.Y Growth Q4-o-Q3
Advance Advance Advance Amount % Amount %
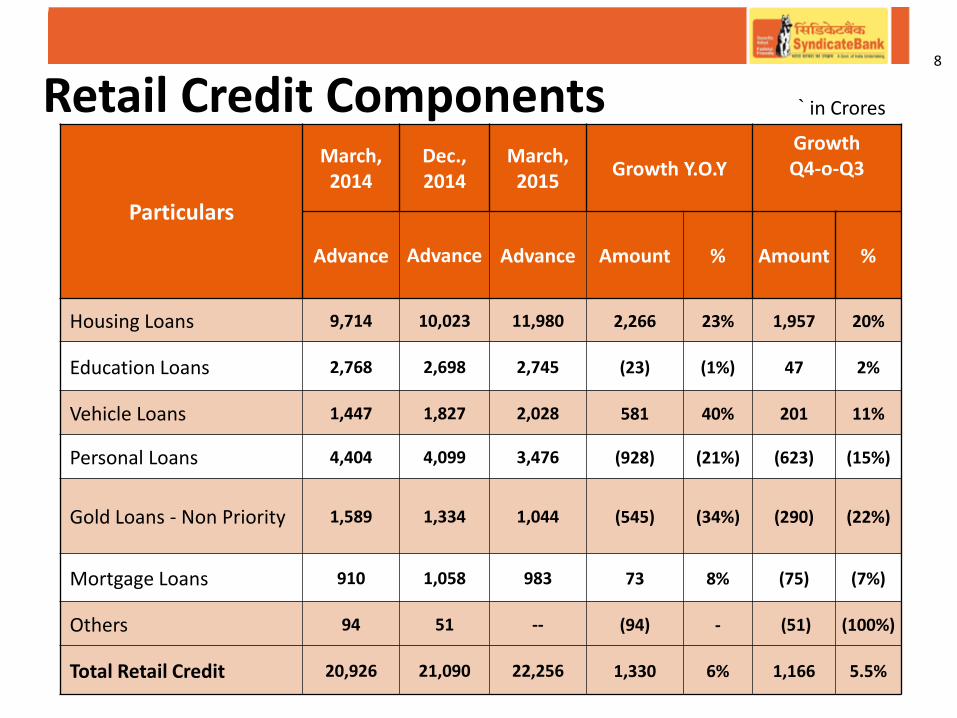
Housing Loans 9,714 10,023 11,980 2,266 23% 1,957 20%
Education Loans 2,768 2,698 2,745 (23) (1%) 47 2%
Vehicle Loans 1,447 1,827 2,028 581 40% 201 11%
Personal Loans 4,404 4,099 3,476 (928) (21%) (623) (15%)
Gold Loans - Non Priority 1,589 1,334 1,044 (545) (34%) (290) (22%)
Mortgage Loans 910 1,058 983 73 8% (75) (7%)
Others 94 51 -- (94) - (51) (100%)
Total Retail Credit 20,926 21,090 22,256 1,330 6% 1,166 5.5%
Retail Credit Components 8
` in Crores
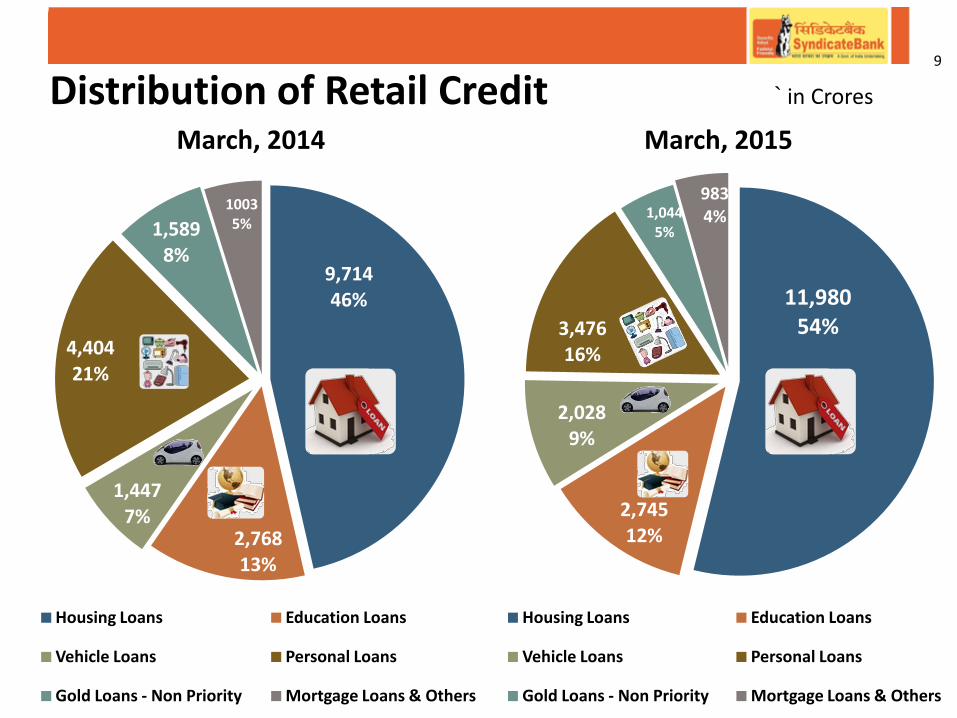
9,714 46%
2,768 13%
1,447 7%
4,404 21%
1,589 8%
1003 5%
March, 2014
Housing Loans Education Loans
Vehicle Loans Personal Loans
Gold Loans - Non Priority Mortgage Loans & Others
11,980 54%
2,745 12%
2,028 9%
3,476 16%
1,044 5%
983 4%
March, 2015
Housing Loans Education Loans
Vehicle Loans Personal Loans
Gold Loans - Non Priority Mortgage Loans & Others
` in Crores Distribution of Retail Credit 9
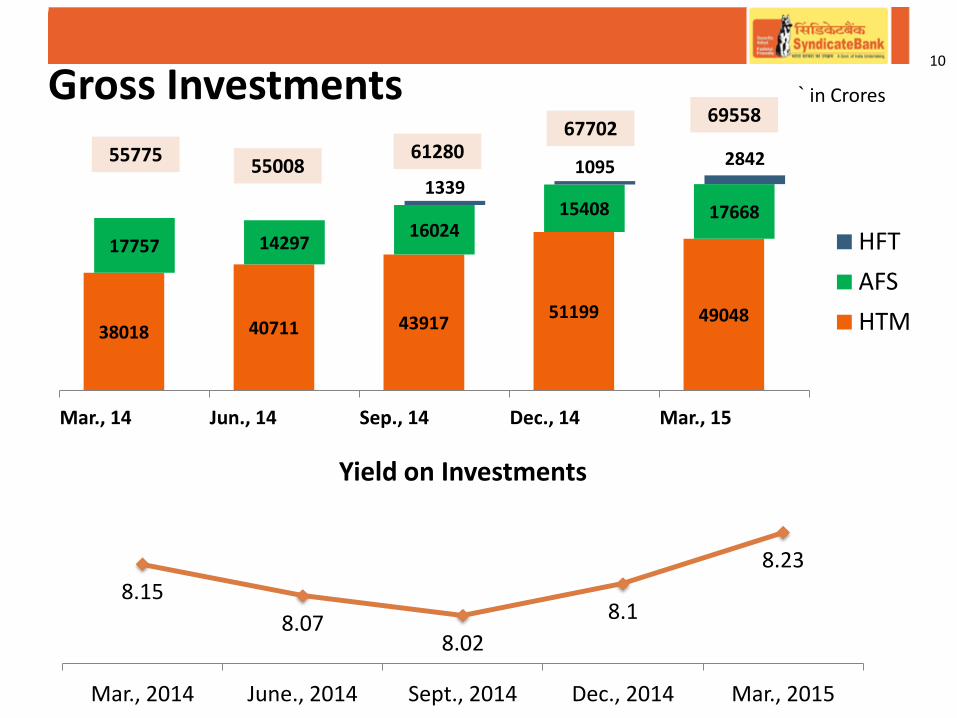
38018 40711 43917 51199 49048
17757 14297 16024
15408 17668 1339
1095 2842
Mar., 14 Jun., 14 Sep., 14 Dec., 14 Mar., 15
HFT
AFS
HTM
8.15
8.07 8.02
8.1
8.23
Mar., 2014 June., 2014 Sept., 2014 Dec., 2014 Mar., 2015
Yield on Investments
Gross Investments
55775 55008
61280 67702
69558
10
` in Crores
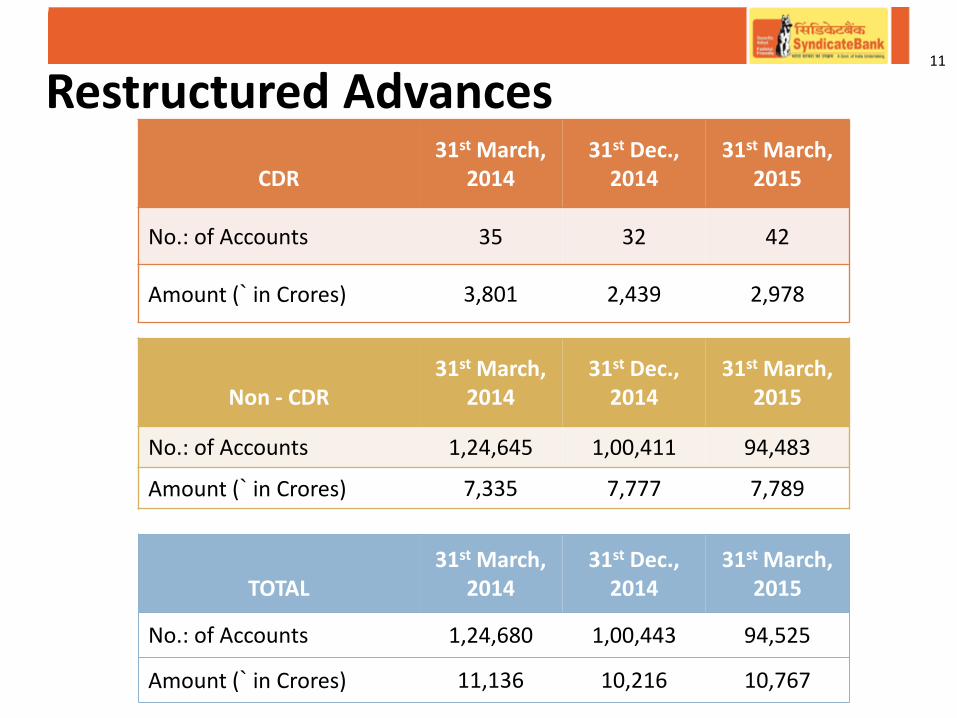
CDR
31st March, 2014
31st Dec., 2014
31st March, 2015
No.: of Accounts 35 32 42
Amount (` in Crores) 3,801 2,439 2,978
Non - CDR
31st March, 2014
31st Dec., 2014
31st March, 2015
No.: of Accounts 1,24,645 1,00,411 94,483
Amount (` in Crores) 7,335 7,777 7,789
TOTAL
31st March, 2014
31st Dec., 2014
31st March, 2015
No.: of Accounts 1,24,680 1,00,443 94,525
Amount (` in Crores) 11,136 10,216 10,767
Restructured Advances 11
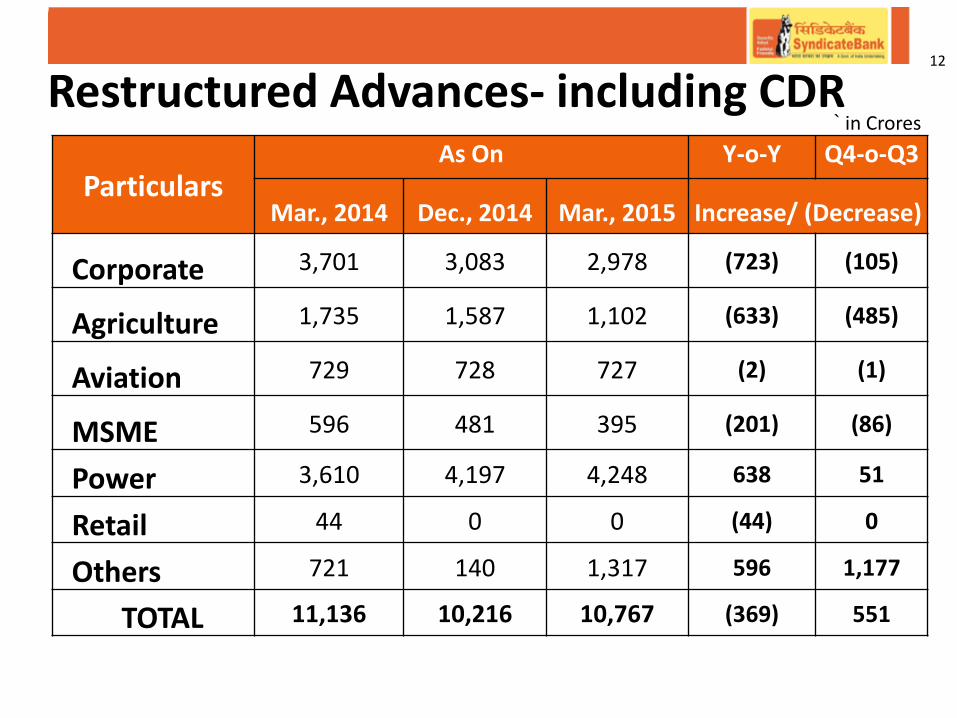
Restructured Advances- including CDR
Particulars As On Y-o-Y Q4-o-Q3
Mar., 2014 Dec., 2014 Mar., 2015 Increase/ (Decrease)
Corporate 3,701 3,083 2,978 (723) (105)
Agriculture 1,735 1,587 1,102 (633) (485)
Aviation 729 728 727 (2) (1)
MSME 596 481 395 (201) (86)
Power 3,610 4,197 4,248 638 51
Retail 44 0 0 (44) 0
Others 721 140 1,317 596 1,177
TOTAL 11,136 10,216 10,767 (369) 551
12
` in Crores
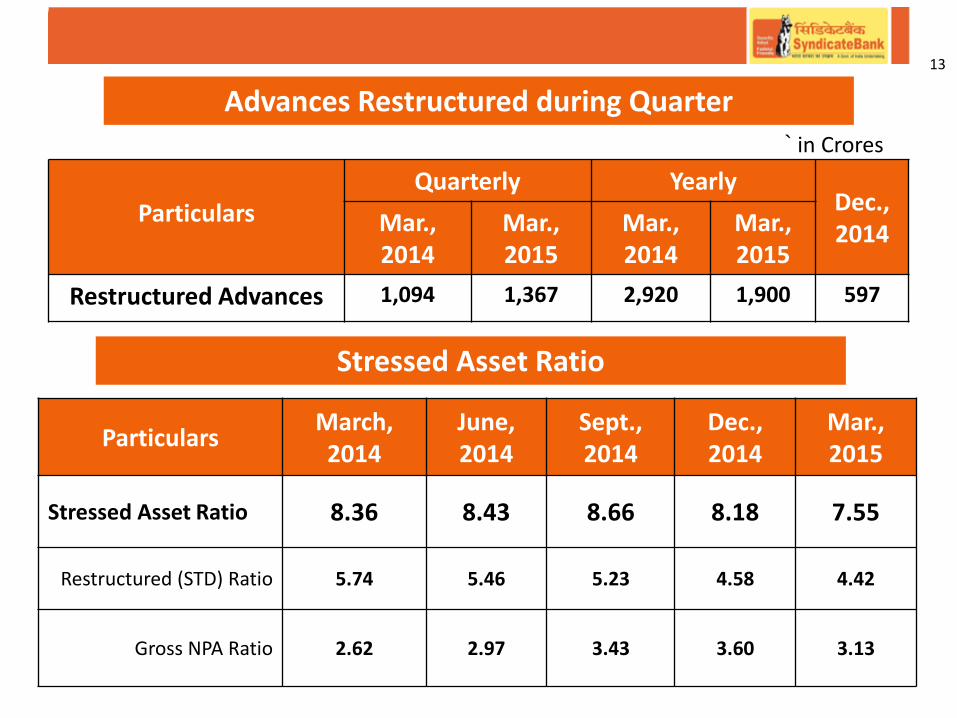
Advances Restructured during Quarter
13
Particulars March, 2014
June, 2014
Sept., 2014
Dec., 2014
Mar., 2015
Stressed Asset Ratio 8.36 8.43 8.66 8.18 7.55
Restructured (STD) Ratio 5.74 5.46 5.23 4.58 4.42
Gross NPA Ratio 2.62 2.97 3.43 3.60 3.13
Stressed Asset Ratio
Particulars
Quarterly Yearly Dec., 2014 Mar.,
2014 Mar., 2015
Mar., 2014
Mar., 2015
Restructured Advances 1,094 1,367 2,920 1,900 597
` in Crores
14
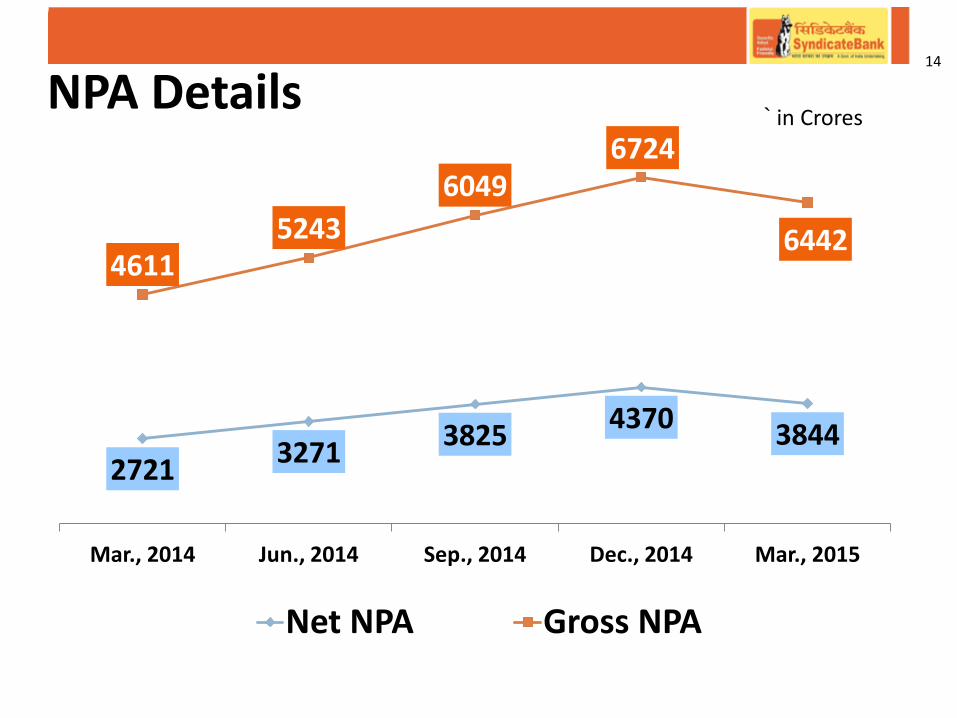
` in Crores NPA Details
2721 3271
3825 4370
3844
4611 5243
6049 6724
6442
Mar., 2014 Jun., 2014 Sep., 2014 Dec., 2014 Mar., 2015
Net NPA Gross NPA
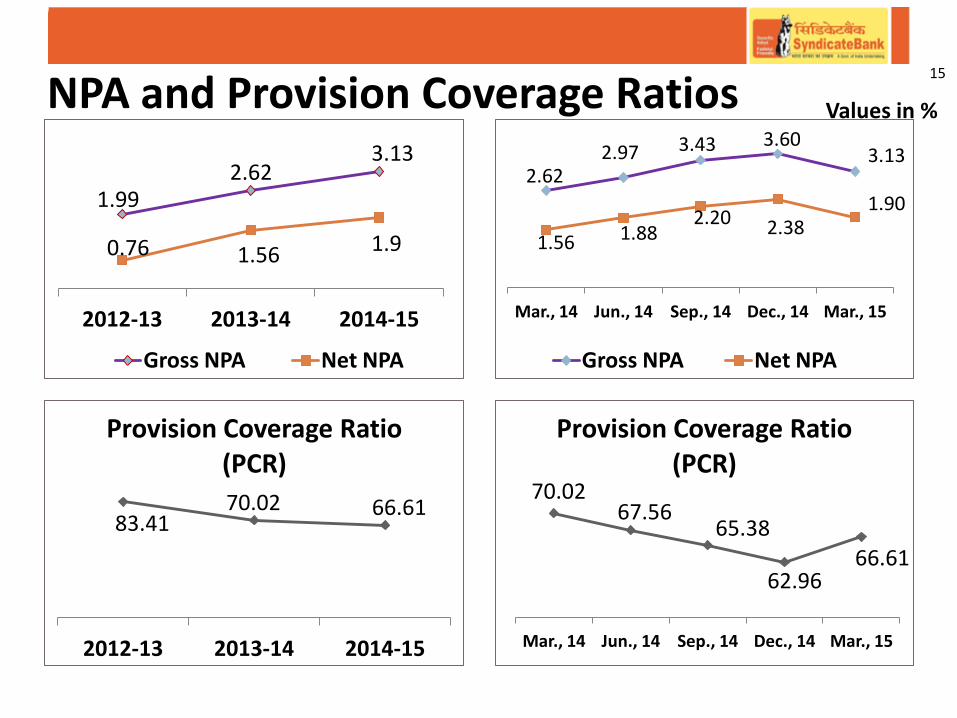
1.99 2.62
3.13
0.76 1.56 1.9
2012-13 2013-14 2014-15
Gross NPA Net NPA
2.62 2.97 3.43 3.60
3.13
1.56 1.88 2.20 2.38
1.90
Mar., 14 Jun., 14 Sep., 14 Dec., 14 Mar., 15
Gross NPA Net NPA
83.41 70.02 66.61
2012-13 2013-14 2014-15
Provision Coverage Ratio (PCR)
70.02 67.56
65.38
62.96 66.61
Mar., 14 Jun., 14 Sep., 14 Dec., 14 Mar., 15
Provision Coverage Ratio (PCR)
Values in % NPA and Provision Coverage Ratios 15
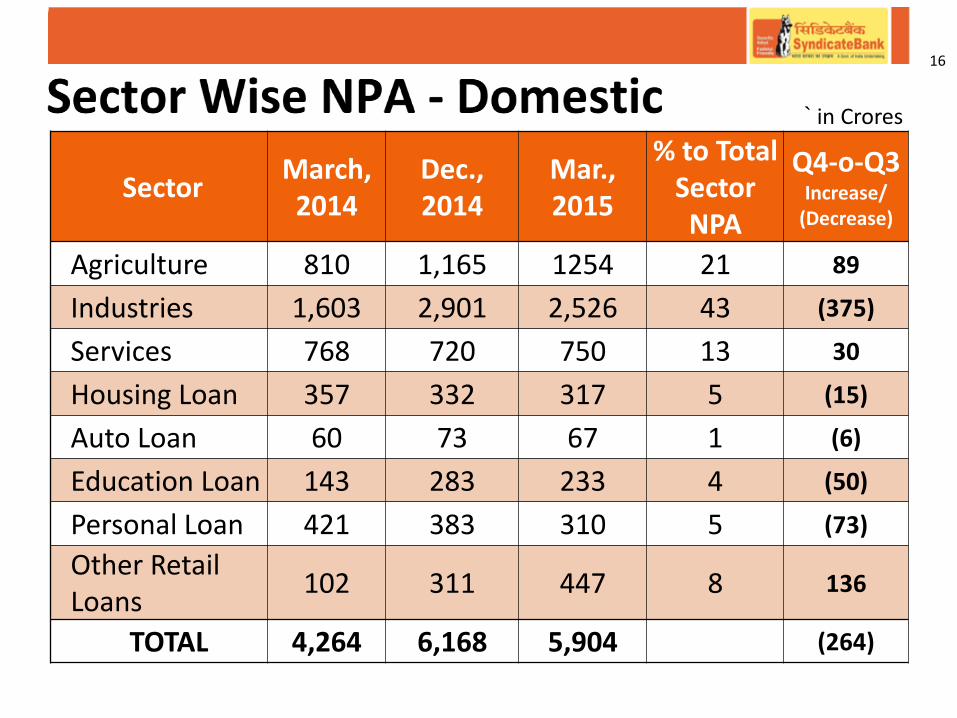
Sector March, 2014
Dec., 2014
Mar., 2015
% to Total Sector NPA
Q4-o-Q3 Increase/
(Decrease)
Agriculture 810 1,165 1254 21 89
Industries 1,603 2,901 2,526 43 (375)
Services 768 720 750 13 30
Housing Loan 357 332 317 5 (15)
Auto Loan 60 73 67 1 (6)
Education Loan 143 283 233 4 (50)
Personal Loan 421 383 310 5 (73)
Other Retail Loans
102 311 447 8 136
TOTAL 4,264 6,168 5,904 (264)
` in Crores
16
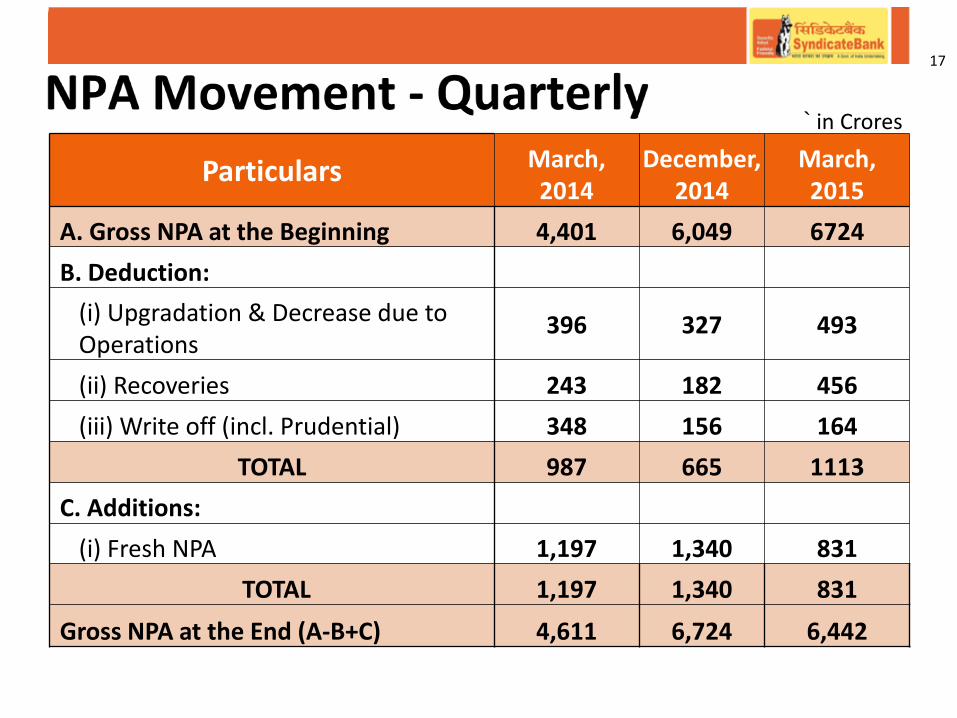
Particulars March, 2014
December, 2014
March, 2015
A. Gross NPA at the Beginning 4,401 6,049 6724
B. Deduction:
(i) Upgradation & Decrease due to Operations
396 327 493
(ii) Recoveries 243 182 456
(iii) Write off (incl. Prudential) 348 156 164
TOTAL 987 665 1113
C. Additions:
(i) Fresh NPA 1,197 1,340 831
TOTAL 1,197 1,340 831
Gross NPA at the End (A-B+C) 4,611 6,724 6,442
` in Crores
17
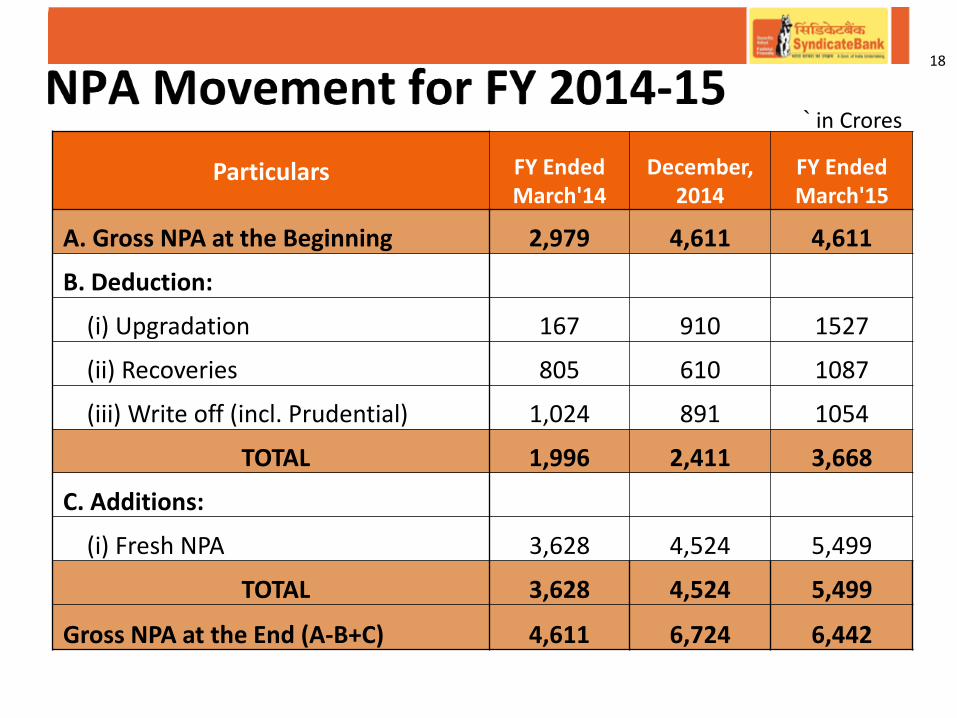
Particulars FY Ended March'14
December, 2014
FY Ended March'15
A. Gross NPA at the Beginning 2,979 4,611 4,611
B. Deduction:
(i) Upgradation 167 910 1527
(ii) Recoveries 805 610 1087
(iii) Write off (incl. Prudential) 1,024 891 1054
TOTAL 1,996 2,411 3,668
C. Additions:
(i) Fresh NPA 3,628 4,524 5,499
TOTAL 3,628 4,524 5,499
Gross NPA at the End (A-B+C) 4,611 6,724 6,442
` in Crores
18

Core Financials 19
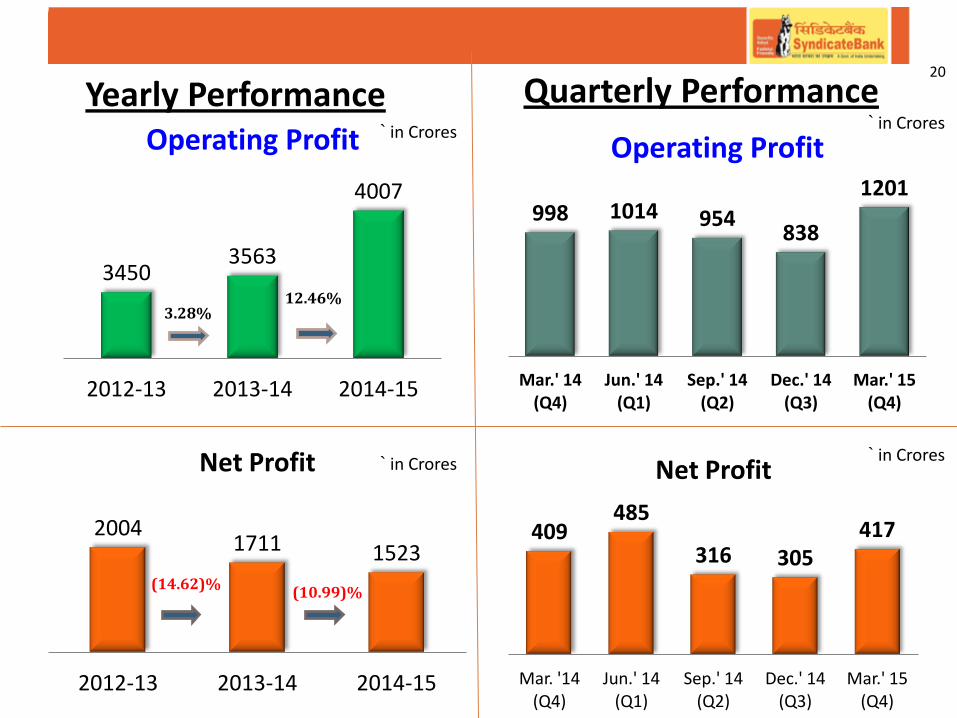
3450 3563
4007
2012-13 2013-14 2014-15
Operating Profit
3.28% 12.46%
998 1014 954 838
1201
Mar.' 14 (Q4)
Jun.' 14 (Q1)
Sep.' 14 (Q2)
Dec.' 14 (Q3)
Mar.' 15 (Q4)
Operating Profit
2004 1711 1523
2012-13 2013-14 2014-15
Net Profit
(14.62)%
409 485
316 305 417
Mar. '14 (Q4)
Jun.' 14 (Q1)
Sep.' 14 (Q2)
Dec.' 14 (Q3)
Mar.' 15 (Q4)
Net Profit
20
` in Crores Yearly Performance Quarterly Performance
` in Crores
(10.99)%
` in Crores ` in Crores
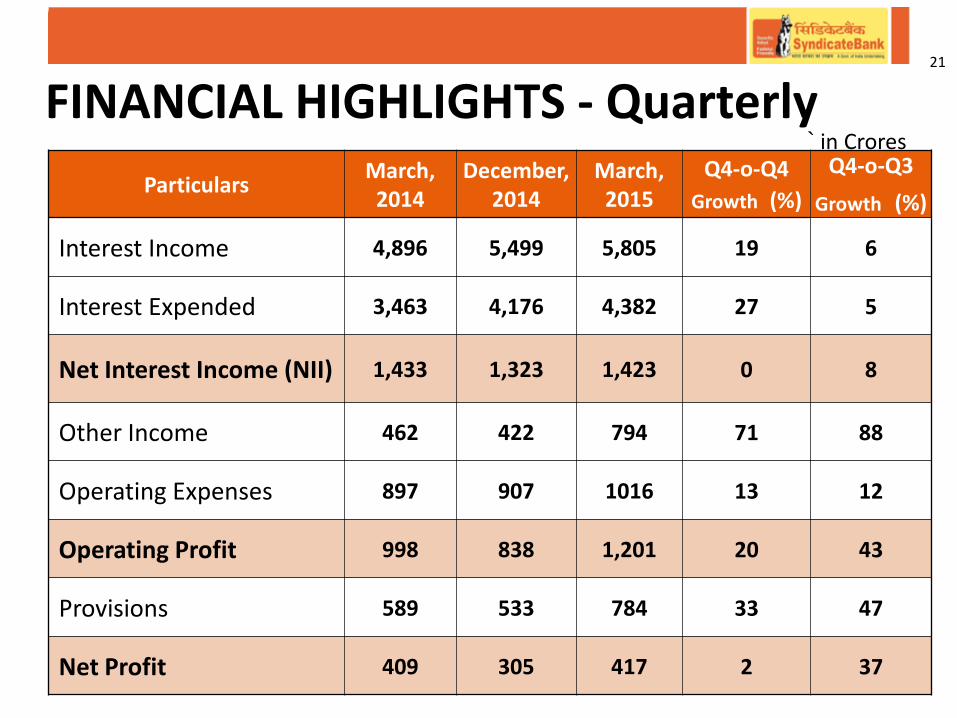
FINANCIAL HIGHLIGHTS - Quarterly 21
Particulars March,
2014 December,
2014 March,
2015
Q4-o-Q4
Growth (%)
Q4-o-Q3
Growth (%)
Interest Income 4,896 5,499 5,805 19 6
Interest Expended 3,463 4,176 4,382 27 5
Net Interest Income (NII) 1,433 1,323 1,423 0 8
Other Income 462 422 794 71 88
Operating Expenses 897 907 1016 13 12
Operating Profit 998 838 1,201 20 43
Provisions 589 533 784 33 47
Net Profit 409 305 417 2 37
` in Crores
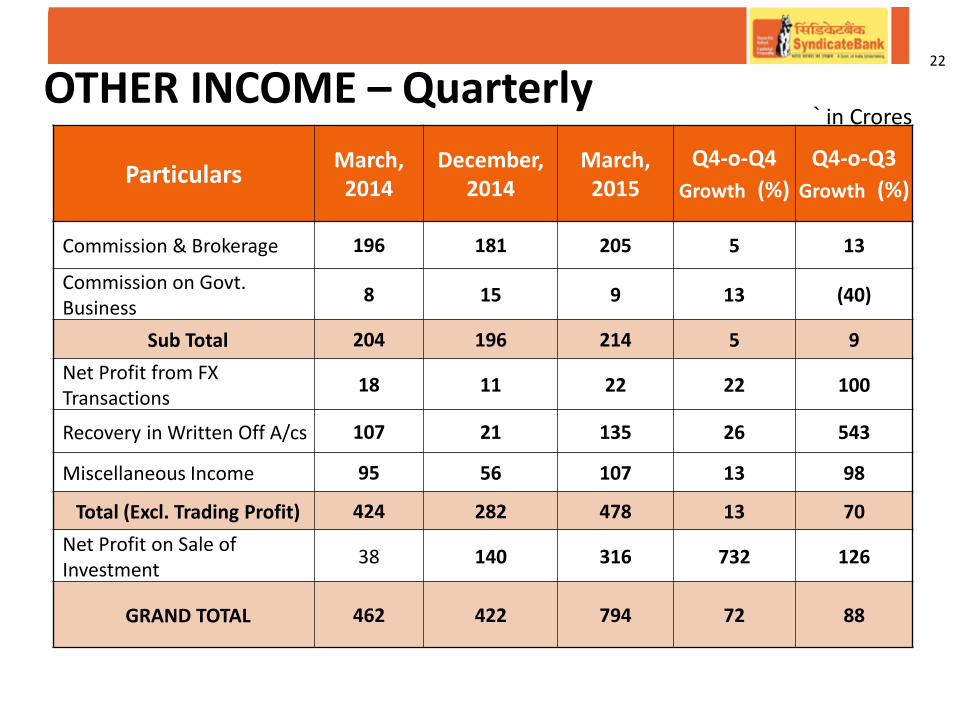
OTHER INCOME – Quarterly
Particulars March, 2014
December, 2014
March, 2015
Q4-o-Q4
Growth (%)
Q4-o-Q3
Growth (%)
Commission & Brokerage 196 181 205 5 13
Commission on Govt. Business
8 15 9 13 (40)
Sub Total 204 196 214 5 9
Net Profit from FX Transactions
18 11 22 22 100
Recovery in Written Off A/cs 107 21 135 26 543
Miscellaneous Income 95 56 107 13 98
Total (Excl. Trading Profit) 424 282 478 13 70
Net Profit on Sale of Investment
38 140 316 732 126
GRAND TOTAL 462 422 794 72 88
` in Crores
22
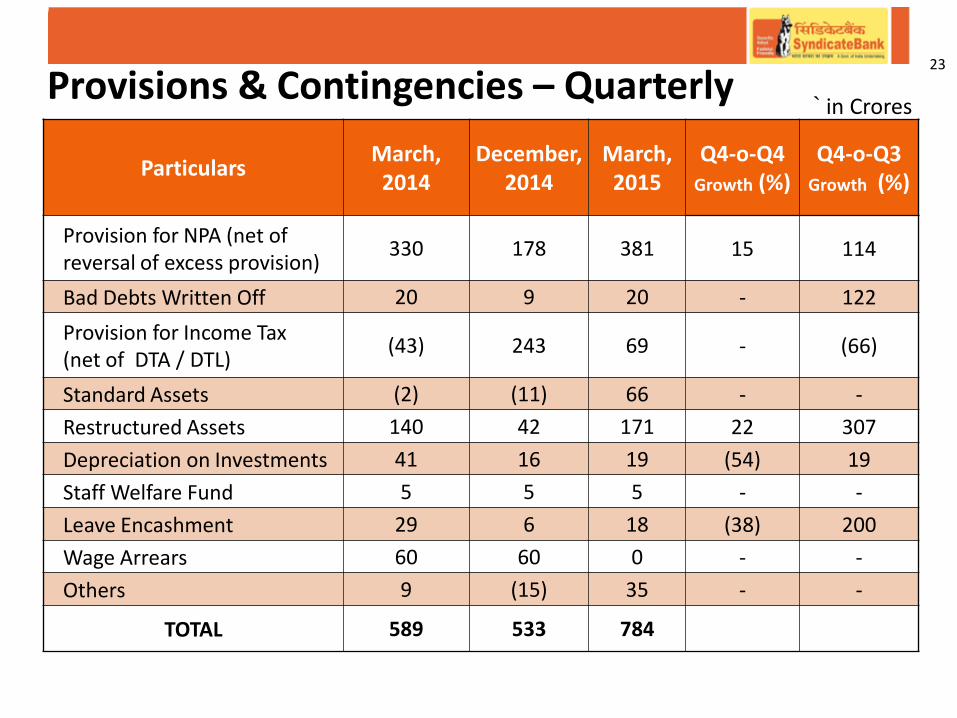
23
Provisions & Contingencies – Quarterly
Particulars March, 2014
December, 2014
March, 2015
Q4-o-Q4 Growth (%)
Q4-o-Q3 Growth (%)
Provision for NPA (net of reversal of excess provision)
330 178 381 15 114
Bad Debts Written Off 20 9 20 - 122
Provision for Income Tax (net of DTA / DTL)
(43) 243 69 - (66)
Standard Assets (2) (11) 66 - -
Restructured Assets 140 42 171 22 307
Depreciation on Investments 41 16 19 (54) 19
Staff Welfare Fund 5 5 5 - -
Leave Encashment 29 6 18 (38) 200
Wage Arrears 60 60 0 - -
Others 9 (15) 35 - -
TOTAL 589 533 784
` in Crores
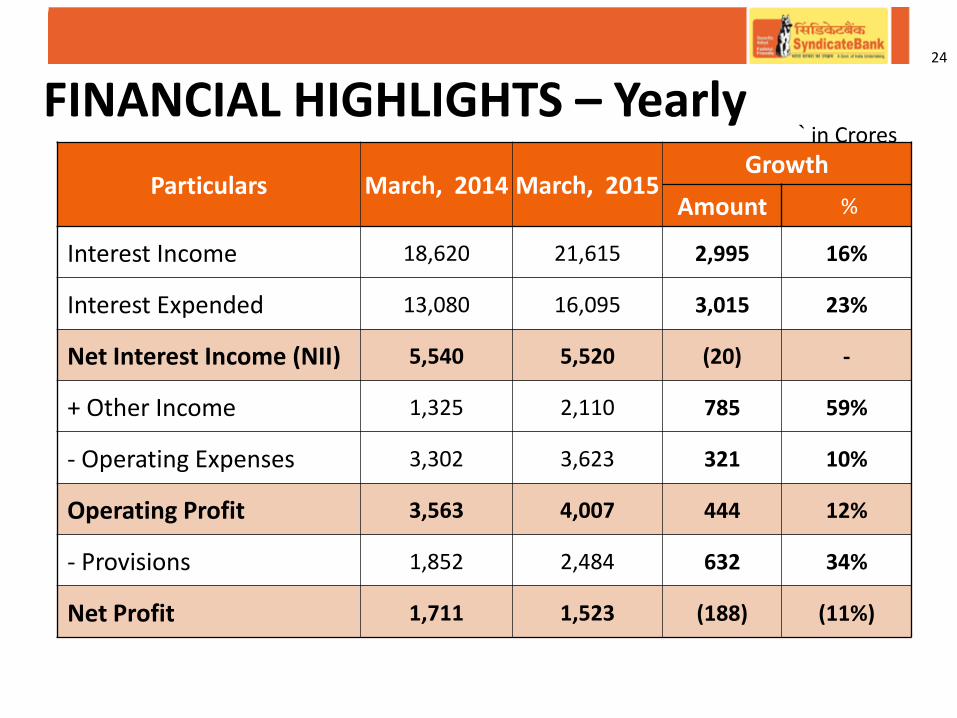
FINANCIAL HIGHLIGHTS – Yearly 24
Particulars March, 2014 March, 2015 Growth
Amount %
Interest Income 18,620 21,615 2,995 16%
Interest Expended 13,080 16,095 3,015 23%
Net Interest Income (NII) 5,540 5,520 (20) -
+ Other Income 1,325 2,110 785 59%
- Operating Expenses 3,302 3,623 321 10%
Operating Profit 3,563 4,007 444 12%
- Provisions 1,852 2,484 632 34%
Net Profit 1,711 1,523 (188) (11%)
` in Crores
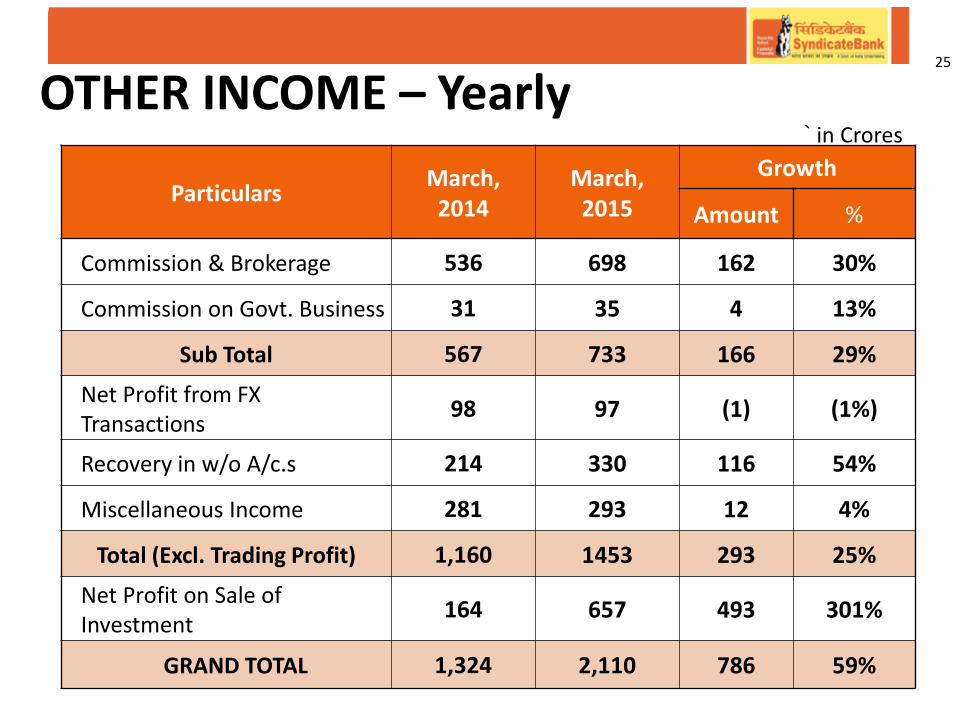
OTHER INCOME – Yearly 25
Particulars March, 2014
March, 2015
Growth
Amount %
Commission & Brokerage 536 698 162 30%
Commission on Govt. Business 31 35 4 13%
Sub Total 567 733 166 29%
Net Profit from FX Transactions
98 97 (1) (1%)
Recovery in w/o A/c.s 214 330 116 54%
Miscellaneous Income 281 293 12 4%
Total (Excl. Trading Profit) 1,160 1453 293 25%
Net Profit on Sale of Investment
164 657 493 301%
GRAND TOTAL 1,324 2,110 786 59%
` in Crores
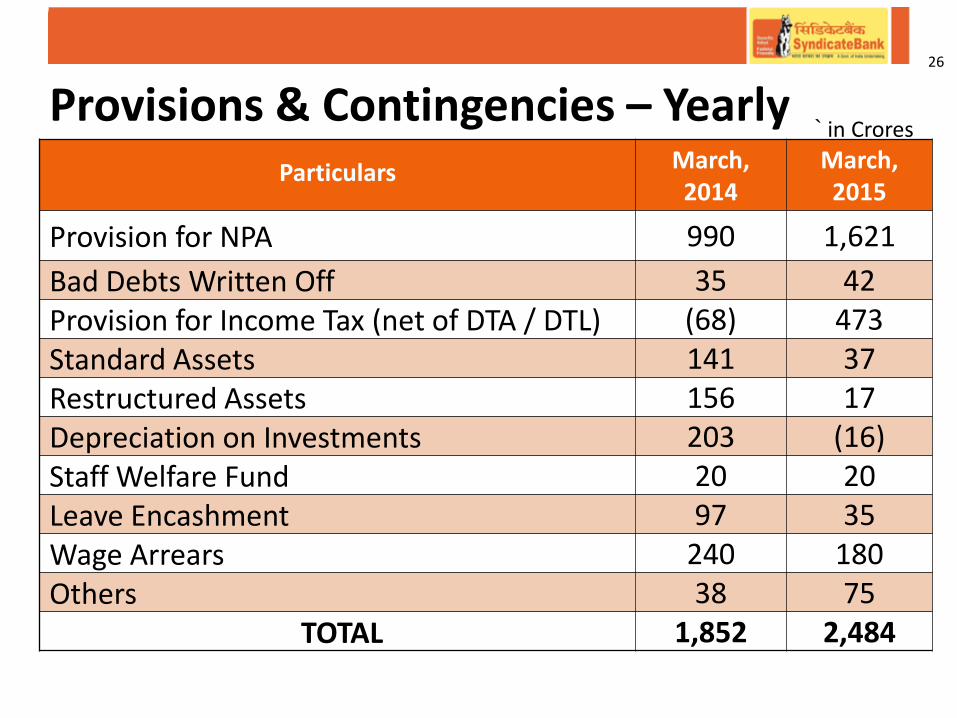
Provisions & Contingencies – Yearly 26
Particulars March, 2014
March, 2015
Provision for NPA 990 1,621
Bad Debts Written Off 35 42 Provision for Income Tax (net of DTA / DTL) (68) 473 Standard Assets 141 37 Restructured Assets 156 17 Depreciation on Investments 203 (16) Staff Welfare Fund 20 20 Leave Encashment 97 35 Wage Arrears 240 180 Others 38 75
TOTAL 1,852 2,484
` in Crores
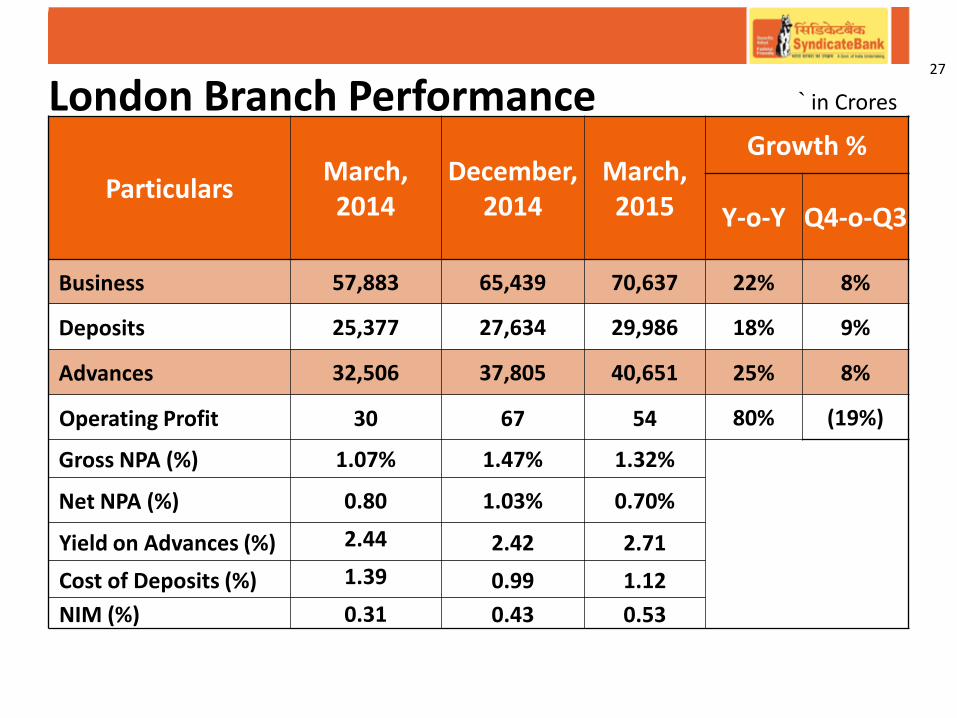
London Branch Performance 27
Particulars March, 2014
December, 2014
March, 2015
Growth %
Y-o-Y Q4-o-Q3
Business 57,883 65,439 70,637 22% 8%
Deposits 25,377 27,634 29,986 18% 9%
Advances 32,506 37,805 40,651 25% 8%
Operating Profit 30 67 54 80% (19%)
Gross NPA (%) 1.07% 1.47% 1.32%
Net NPA (%) 0.80 1.03% 0.70%
Yield on Advances (%) 2.44 2.42 2.71
Cost of Deposits (%) 1.39 0.99 1.12
NIM (%) 0.31 0.43 0.53
` in Crores
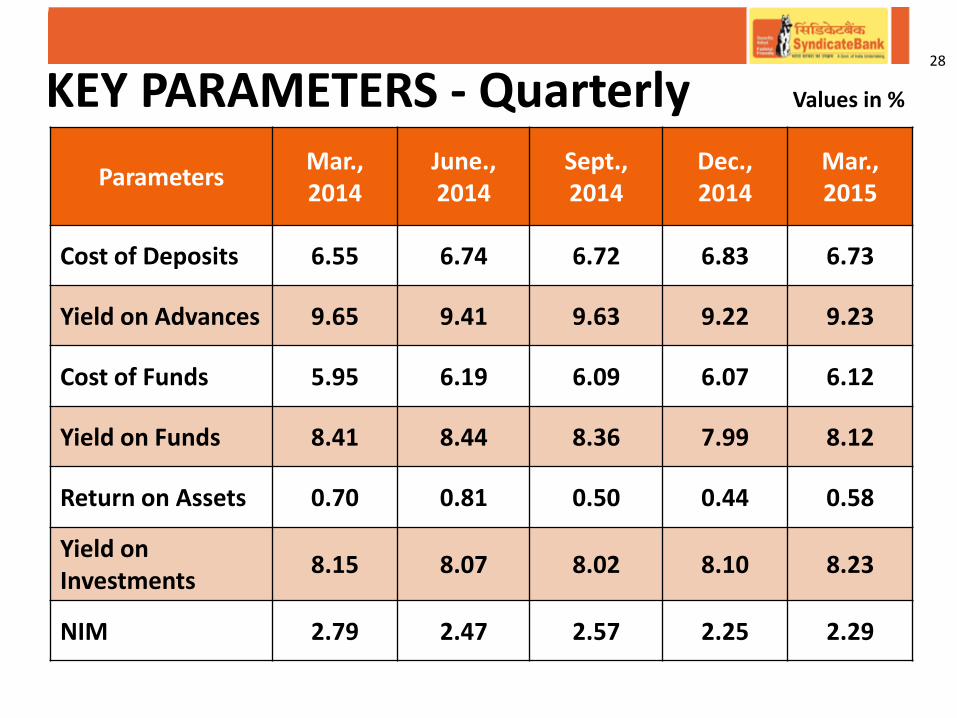
KEY PARAMETERS - Quarterly Values in %
Parameters Mar., 2014
June., 2014
Sept., 2014
Dec., 2014
Mar., 2015
Cost of Deposits 6.55 6.74 6.72 6.83 6.73
Yield on Advances 9.65 9.41 9.63 9.22 9.23
Cost of Funds 5.95 6.19 6.09 6.07 6.12
Yield on Funds 8.41 8.44 8.36 7.99 8.12
Return on Assets 0.70 0.81 0.50 0.44 0.58
Yield on Investments
8.15 8.07 8.02 8.10 8.23
NIM 2.79 2.47 2.57 2.25 2.29
28
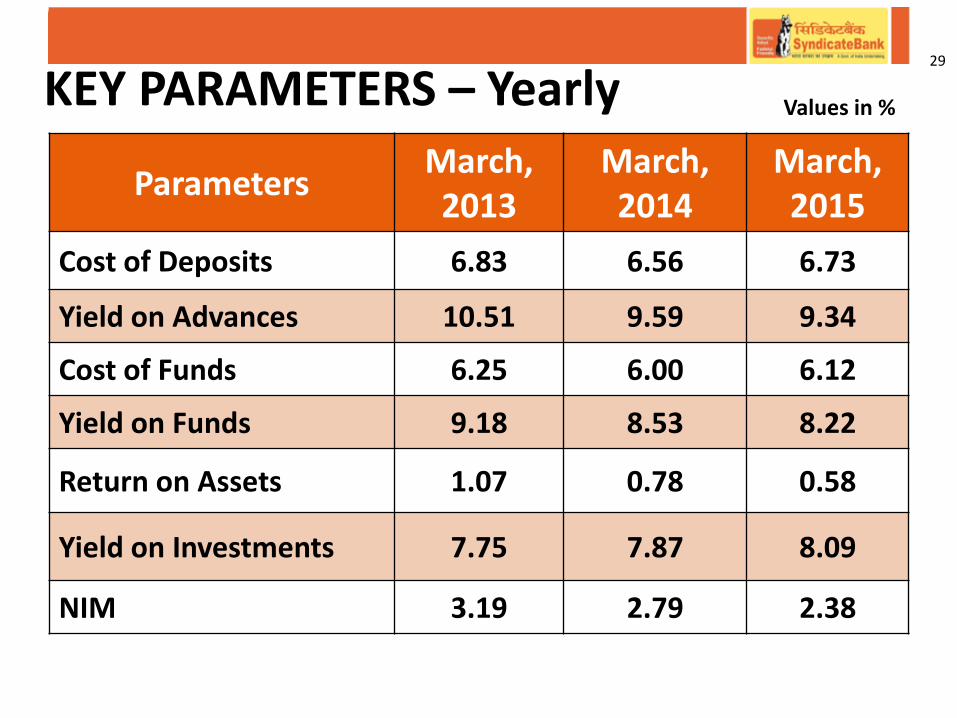
KEY PARAMETERS – Yearly Values in %
Parameters March, 2013
March, 2014
March, 2015
Cost of Deposits 6.83 6.56 6.73
Yield on Advances 10.51 9.59 9.34
Cost of Funds 6.25 6.00 6.12
Yield on Funds 9.18 8.53 8.22
Return on Assets 1.07 0.78 0.58
Yield on Investments 7.75 7.87 8.09
NIM 3.19 2.79 2.38
29
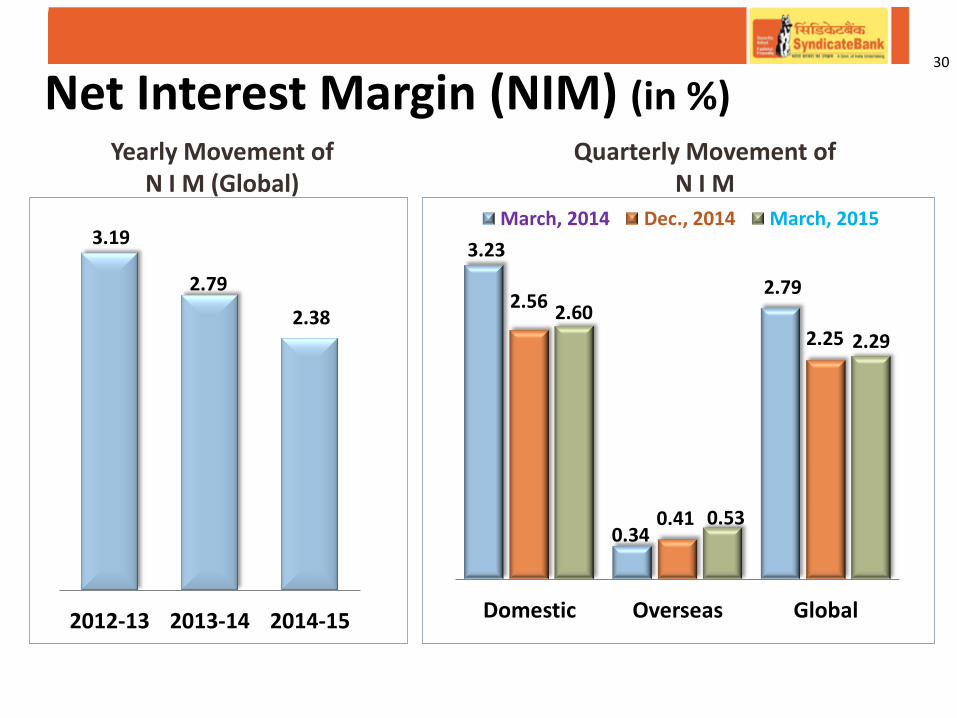
3.23
0.34
2.79 2.56
0.41
2.25 2.60
0.53
2.29
Domestic Overseas Global
March, 2014 Dec., 2014 March, 2015
Net Interest Margin (NIM) (in %) 30
3.19
2.79
2.38
2012-13 2013-14 2014-15
Yearly Movement of N I M (Global)
Quarterly Movement of N I M
Values in %
8.68 8.23 7.92 7.61 7.84
3.19 2.73 2.50 2.85 2.70
11.41 10.80 10.42 10.46 10.54
March, 2014 June, 2014 Sept., 2014 Dec., 2014 Mar., 2015
Tier I Tier II CRAR
Particulars March, 2014
June, 2014
Sept., 2014
Dec., 2014
Mar., 2015
Regulatory Total Capital (` in Crores)
14,579 14,573 14,441 15,112 16,891
Risk Weighted Assets (` in Crores)
1,27,735 1,34,910 1,38,551 1,44,502 1,60,249
CRAR 11.41 10.80 10.42 10.46 10.54
Capital Adequacy Ratios - Basel III 31
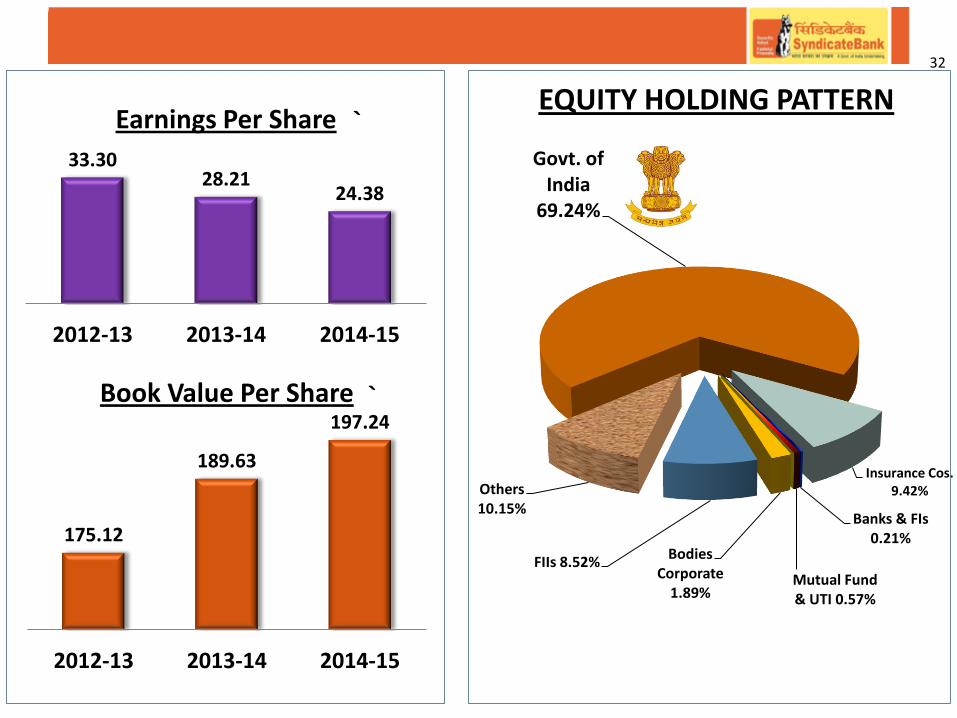
33.30 28.21
24.38
2012-13 2013-14 2014-15
Earnings Per Share
175.12
189.63
197.24
2012-13 2013-14 2014-15
Book Value Per Share
32
`
`
Govt. of India
69.24%
Insurance Cos. 9.42%
Banks & FIs 0.21%
Mutual Fund & UTI 0.57%
Bodies Corporate
1.89%
FIIs 8.52%
Others 10.15%
EQUITY HOLDING PATTERN
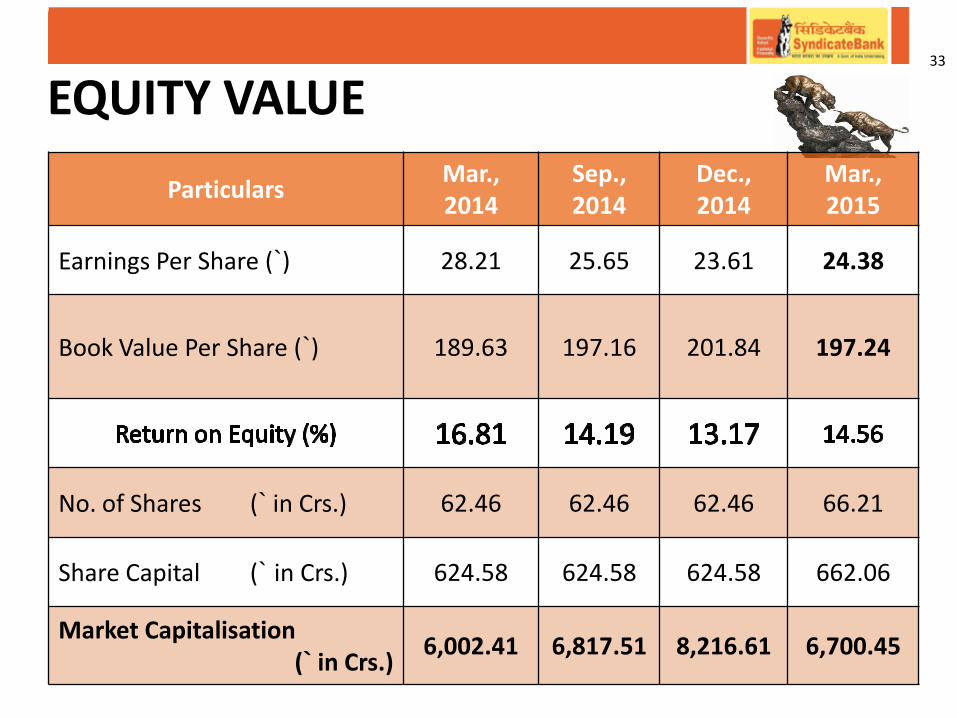
Particulars Mar., 2014
Sep., 2014
Dec., 2014
Mar., 2015
Earnings Per Share (`) 28.21 25.65 23.61 24.38
Book Value Per Share (`) 189.63 197.16 201.84 197.24
No. of Shares (` in Crs.) 62.46 62.46 62.46 66.21
Share Capital (` in Crs.) 624.58 624.58 624.58 662.06
Market Capitalisation (` in Crs.)
6,002.41 6,817.51 8,216.61 6,700.45
EQUITY VALUE 33
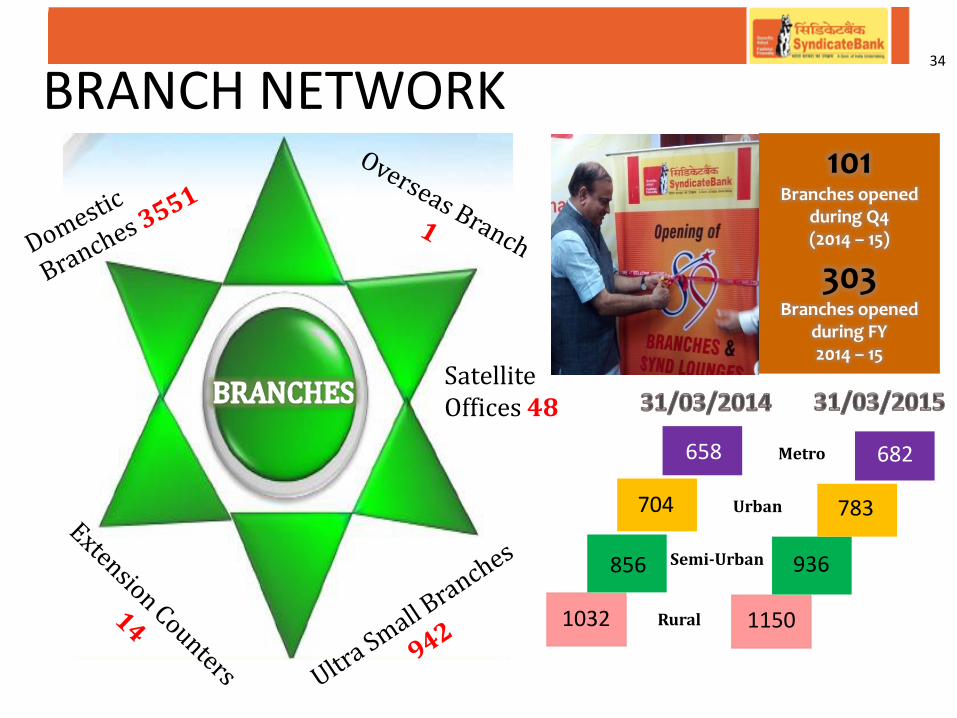
BRANCH NETWORK 101
Branches opened during Q4 (2014 – 15)
303 Branches opened
during FY 2014 – 15
Satellite Offices 48
Rural
Urban
Semi-Urban
Metro
1032
856
704
658
1150
936
783
682
34
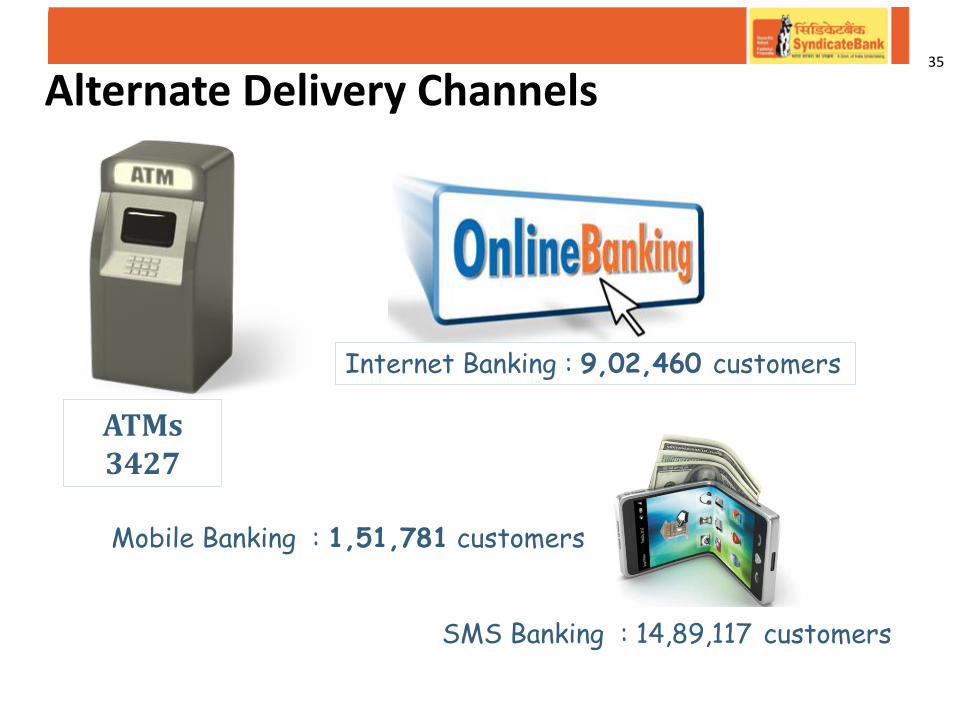
Alternate Delivery Channels
ATMs 3427
Mobile Banking : 1,51,781 customers
SMS Banking : 14,89,117 customers
35
Internet Banking : 9,02,460 customers
ACCOLADES & AWARDS SyndicateBank is one among the Five from Karnataka State in Forbes’ 2000 list of most powerful public companies
FINANCIAL INCLUSION
Bank has opened 104 lakh Basic Savings Bank Deposit Accounts (BSBDA) as on 31.03.2015.
Of which 6.06 lakh accounts were opened during the quarter ended as on 31.03.2015.
The balance outstanding in these accounts is ` 3,611.81 Crore as on 31.03.2015 (104 lakh accounts).
To promote financial literacy in the villages, 14196 financial literacy programmes were organized during the year up to 31.03.2015, in which 5.74 lakh persons were benefitted.
36
PMJDY: Bank has opened 34,96,559 no. of accounts under PMJDY with a balance of
` 505 crore as at 31.03.2015.
33,50,302 RuPay Cards have been issued under PMJDY as at 31.03.2015.
CORPORATE SOCIAL RESPONSIBILITY: During the quarter, Bank undertook various CSR activities viz. distribution of water coolers to Govt. Schools; donation to social work & charitable society for distributing rice to poor families on the eve of Republic Day; donation to society for advancement of culture & heritage; donation to temple and trust for purchasing dining tables with tools for Annasantharpane; donation towards making toilets in Government schools under Swachh Bharat Abhiyan,
donation towards rehabilitation of flood victims in Jammu & Kashmir and has also donated to support flood (Hudhud) affected in Vishakhapatnam, donation for purchase of benches and desks and construction of auditorium for the schools; donation of Ambulance to Medical colleges & Hospital, donation to corporation of the city; donation of RO Water Purifier to colleges/ Institutes, donation to special school for mentally retarded etc.
37
CUSTOMER SPECIFIC PRODUCTS
Bank has launched the following new products during the Quarter: Synd Connect: Bank has launched a new personal banking loan product “SyndConnect” to
meet the loan requirements of employees of Central /State Government Departments, reputed Public Sector Undertakings and “Fortune 500” Companies and to improve the quality of retail lending products.
Synd Delight: Bank has launched a hassle free loan product “SyndDelight” to existing
Housing Loan customers who have demonstrated satisfactory repayment record of 3 years or more to meet any genuine personal credit needs of them.
Synd Timber: Keeping in view the demand for wooden products and steady growth and
its contribution to MSME segment, Bank has launched a new tailor made product “SyndTimber” to extend credit facilities to Timber Trading, Import of Wood and Wooden products, Wood Processing Units like Sawmill, Steam Chambers, Construction of Shed etc. and for Furniture Shops. The quantum of loan which can be provided under the scheme is above Rs.10 lakh upto Rs.10 crore.
38
CORPORATE TIE UP Bank has entered into strategic tie-up with the following Corporates:-
Bank had signed a Memorandum of Understanding (MOU) with M/s SBI Life Insurance Co. Ltd. on 30th March 2015 for providing Group Life Insurance cover to Education Loan Borrowers of the Bank. Bank has a Corporate Agency tie-up with M/s TATA-AIA Life Insurance Co Ltd. on 30th March 2015 for providing Group Life Insurance cover to Housing Loan borrowers of the Bank on optional basis. Bank had signed a Memorandum of Understanding (MOU) with LIC for implementation of “Pradhan Mantri Jeevan Jyoti Bima Yojana”. In this, LIC will provide life insurance cover of Rs. 2 lakh in case of death of the insured person at nominal premium of Rs. 330 per annum.
39
CORPORATE STRATEGIES
To attract the retail investors in the pursuit of tax savings and to take the advantage of the available opportunity, Bank has recently launched a campaign titled “Save Tax – Get Relaxed” for from 1st January – 31st March, 2015. This campaign is designed to increase business of the Bank under Core term deposits, Life Insurance Policies from LIC of India, ELSS option of Mutual Funds and Mediclaim polices of the Bank. In order to have impetus for growth momentum and to explore the growth in potential branches, Bank has selected STAR branches to tap business in line with corporate vision to achieve a level of ` 10 lakh Crore businesses by 31.03.2020. All these branches will be provided good amenities at branch premises for customers. Along with this, all required publicity materials like banners, pamphlets, posters etc. would be made available to them and Product knowledge if any required shall be made available through Regional Offices to the selected branches.
40
CORPORATE STRATEGIES (cont.,) Bank had launched a special SIP campaign titled “SYND Mutual Funds –SIP Campaign” with all the nine Mutual Fund Companies, covering all the asset classes i.e. Equity, Debt and Hybrid. The objective of the campaign was to increase the penetration in Mutual Funds business and build the SIP book along with Asset under Management (AUM) for the Bank. The campaign envisaged participation by each and every branch with provision of reward and recognition of the performers. The campaign saw participation from 436 branches in 47 Regions across the country. There were 3233 SIP Folios created with a monthly SIP amount of 34.64 lakhs in various schemes.
41


![FY Ended March 2014 Full Year Results Presentation · 2018-08-10 · FY Ended March 2014 Full Year Results Presentation May 12th, 2014 SEGA SAMMY HOLDINGS INC. [Disclaimer] The contents](https://img.pdfslide.net/doc/110x75/5f02c76e7e708231d405f7de/fy-ended-march-2014-full-year-results-presentation-2018-08-10-fy-ended-march-2014.jpg)

![EBARA (6361) · December 31, 2016 Results FY Ended December 31, 2017 Results 66.0 131.9 231.5 74.3 148.2 251.9 58.6 117.4 213.8 56.7 118.9 225.7 [Reference] FY Ended December 31,](https://img.pdfslide.net/doc/110x75/5fd6026e6863d42018028baa/ebara-6361-december-31-2016-results-fy-ended-december-31-2017-results-660-1319.jpg)


![FY Ended March 2015 Full Year Results Presentation · Net Sales [] →() →() →()](https://img.pdfslide.net/doc/110x75/5f118831d64fac5ddf14fef8/fy-ended-march-2015-full-year-results-presentation-net-sales-aii-aii.jpg)