Embed Size (px)
Citation preview
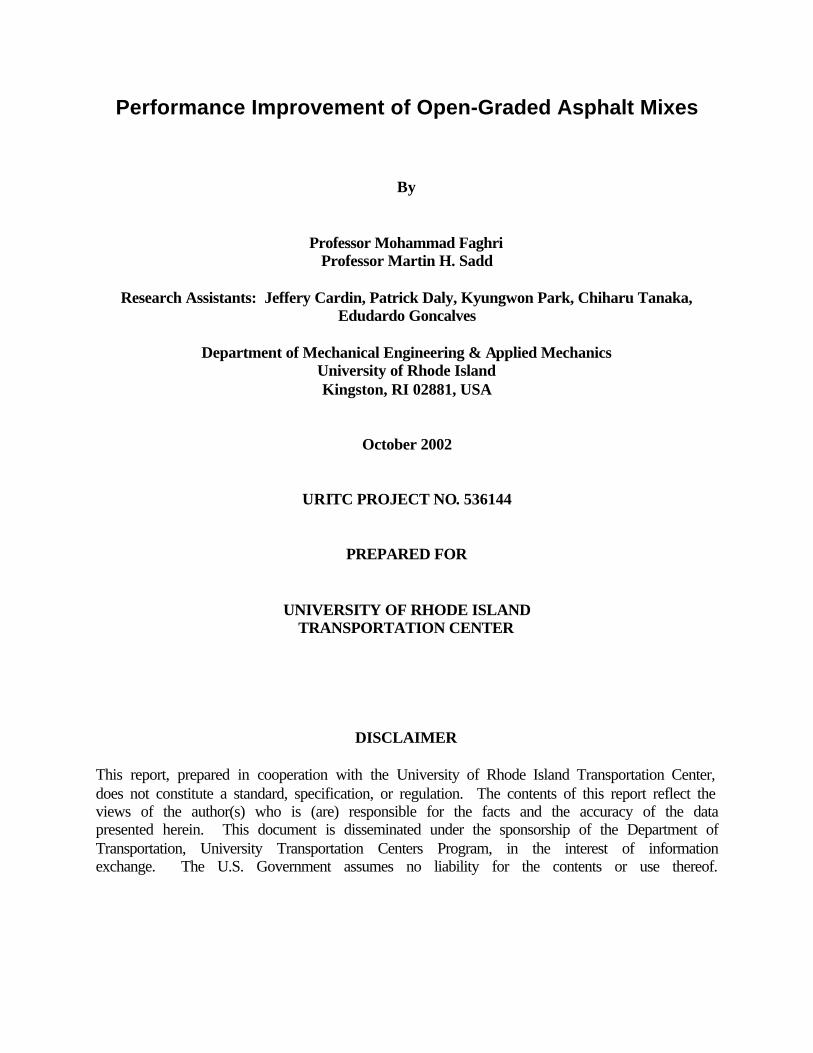
Performance Improvement of Open-Graded Asphalt Mixes
By
Professor Mohammad Faghri Professor Martin H. Sadd
Research Assistants: Jeffery Cardin, Patrick Daly, Kyungwon Park, Chiharu Tanaka,
Edudardo Goncalves
Department of Mechanical Engineering & Applied Mechanics University of Rhode Island Kingston, RI 02881, USA
October 2002
URITC PROJECT NO. 536144
PREPARED FOR
UNIVERSITY OF RHODE ISLAND TRANSPORTATION CENTER
DISCLAIMER This report, prepared in cooperation with the University of Rhode Island Transportation Center, does not constitute a standard, specification, or regulation. The contents of this report reflect the views of the author(s) who is (are) responsible for the facts and the accuracy of the data presented herein. This document is disseminated under the sponsorship of the Department of Transportation, University Transportation Centers Program, in the interest of information exchange. The U.S. Government assumes no liability for the contents or use thereof.
ii
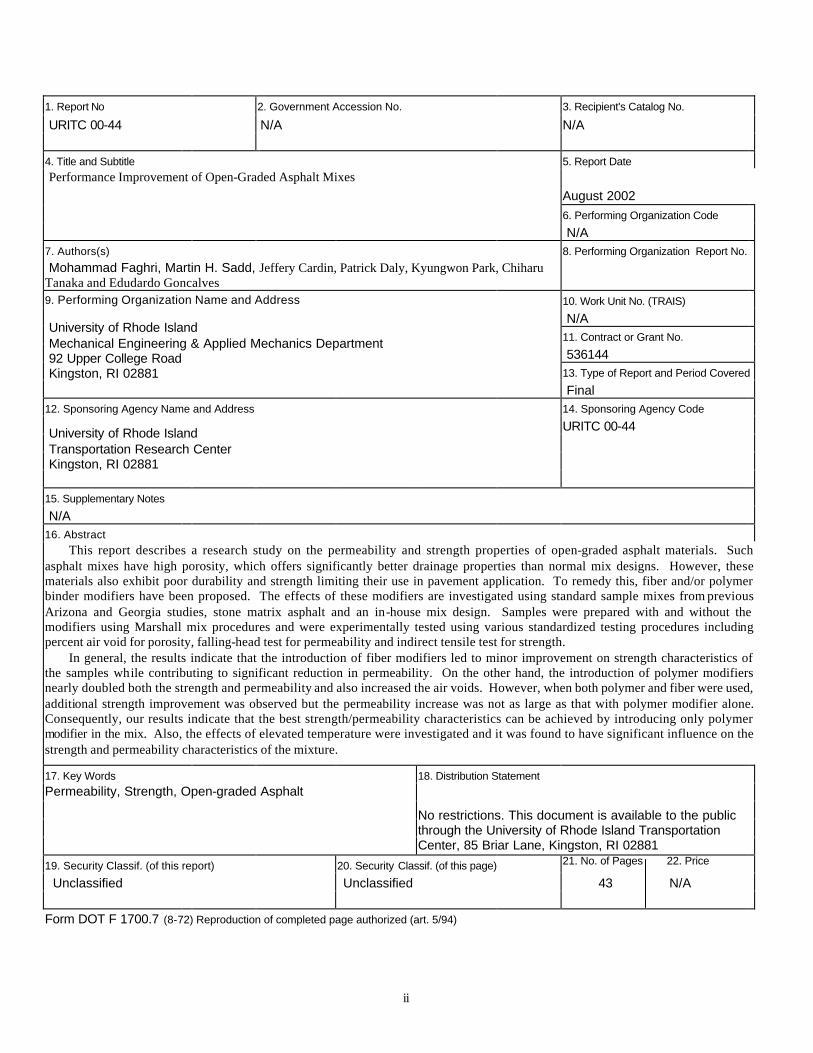
1. Report No 2. Government Accession No. 3. Recipient's Catalog No.
URITC 00-44 NN/A N/A 4. Title and Subtitle 5. Report Date
August 2002 6. Performing Organization Code
Performance Improvement of Open-Graded Asphalt Mixes
N/A 7. Authors(s) 8. Performing Organization Report No.
Mohammad Faghri, Martin H. Sadd, Jeffery Cardin, Patrick Daly, Kyungwon Park, Chiharu Tanaka and Edudardo Goncalves 9. Performing Organization Name and Address 10. Work Unit No. (TRAIS)
N/A 11. Contract or Grant No.
536144 13. Type of Report and Period Covered
University of Rhode Island Mechanical Engineering & Applied Mechanics Department 92 Upper College Road Kingston, RI 02881 Final 12. Sponsoring Agency Name and Address 14. Sponsoring Agency Code
URITC 00-44
University of Rhode Island Transportation Research Center Kingston, RI 02881 15. Supplementary Notes N/A 16. Abstract
This report describes a research study on the permeability and strength properties of open-graded asphalt materials. Such asphalt mixes have high porosity, which offers significantly better drainage properties than normal mix designs. However, these materials also exhibit poor durability and strength limiting their use in pavement application. To remedy this, fiber and/or polymer binder modifiers have been proposed. The effects of these modifiers are investigated using standard sample mixes from previous Arizona and Georgia studies, stone matrix asphalt and an in-house mix design. Samples were prepared with and without the modifiers using Marshall mix procedures and were experimentally tested using various standardized testing procedures including percent air void for porosity, falling-head test for permeability and indirect tensile test for strength.
In general, the results indicate that the introduction of fiber modifiers led to minor improvement on strength characteristics of the samples while contributing to significant reduction in permeability. On the other hand, the introduction of polymer modifiers nearly doubled both the strength and permeability and also increased the air voids. However, when both polymer and fiber were used, additional strength improvement was observed but the permeability increase was not as large as that with polymer modifier alone.Consequently, our results indicate that the best strength/permeability characteristics can be achieved by introducing only polymer modifier in the mix. Also, the effects of elevated temperature were investigated and it was found to have significant influence on the strength and permeability characteristics of the mixture.
17. Key Words 18. Distribution Statement
Permeability, Strength, Open-graded Asphalt
No restrictions. This document is available to the public through the University of Rhode Island Transportation Center, 85 Briar Lane, Kingston, RI 02881
19. Security Classif. (of this report) 20. Security Classif. (of this page) 21. No. of Pages 22. Price
Unclassified Unclassified 43 N/A Form DOT F 1700.7 (8-72) Reproduction of completed page authorized (art. 5/94)
iii
TABLE OF CONTENTS
Page
TABLE OF CONTENTS................................................................................................................ iii
Abstract ............................................................................................................................................v
1. Introduction..................................................................................................................................1
2. Scope............................................................................................................................................2
3. MIX CHARACTERISTCS..........................................................................................................4
3.1 Mix Design............................................................................................................................ 4
a) Method ................................................................................................................................ 4
b) Gradation ............................................................................................................................ 5
c) Asphalt Content .................................................................................................................. 8
d) Additives............................................................................................................................. 9
3.2 Volumetric Properties ......................................................................................................... 10
a) Bulk Specific Gravity (BSG)............................................................................................ 10
b) Theoretical Maximum Density (TMD) ............................................................................ 11
c) Voids in Total Mixture (VTM)......................................................................................... 12
3.3 Results of Volumetric Properties ........................................................................................ 12
4. PERMEABILITY STUDIES .....................................................................................................14
4.1 Theoretical Background ...................................................................................................... 14
4.2 Measurement Procedures .................................................................................................... 14
a) Falling Head Test .............................................................................................................. 15
b) Constant Head Test........................................................................................................... 16
4.3 Result of Permeability Measurement .................................................................................. 17

iv
4.4 Effects of Elevated Temperature on Permeability.............................................................. 19
4.5 Permeability/Temperature Results ...................................................................................... 20
5. STRENGTH STUDIES .............................................................................................................22
5.1 Theoretical Background ...................................................................................................... 23
5.2 IDT Measurement Procedures ............................................................................................ 24
5.3 Results of IDT Testing........................................................................................................ 25
5.4 Effects of Elevated Temperature on Strength..................................................................... 26
5.5 Strength/Temperature Result .............................................................................................. 27
6. CORRELATION OF RESULTS ...............................................................................................28
7. CONCLUSIONS........................................................................................................................30
8. Acknowledgements ....................................................................................................................31
9. REFERENCES ..........................................................................................................................32
10. APPENDICES .........................................................................................................................34
Appendix A: Mix Volumetric Property Test Data.........................................................................34
Appendix B: Permeability Coefficient Test Data ..........................................................................35
Appendix C: Indirect Strength Test Data.......................................................................................36
v
ABSTRACT
This report describes a research study on the permeability and strength properties of
open-graded asphalt materials. Such asphalt mixes have high porosity, which offers significantly
better drainage properties than normal mix designs. However, these materials also exhibit poor
durability and strength limiting their use in pavement applications. To remedy this, fiber and/or
polymer binder modifiers have been proposed. The effects of these modifiers on permeability
and strength are investigated using standard sample mixes from previous Arizona and Georgia
studies, stone matrix asphalt and an in-house mix design. Samples were prepared with and
without the modifiers using Marshall mix procedures and were experimentally tested using
various standardized testing procedures including percent air void for porosity, falling-head test
for permeability and indirect tensile test for strength.
In general, the results indicate that the introduction of cellulose fiber modifiers led to
minor improvement on strength characteristics of the samples while contributing to significant
reduction in permeability. On the other hand, the introduction of SBS polymer modifiers nearly
doubled both the strength and permeability and also increased the air voids. However, when both
polymer and fiber were used, additional strength improvement was observed but the permeability
increase was not as large as that with polymer modifier alone. Consequently, our results indicate
that the best strength/permeability characteristics can be achieved by introducing only polymer
modifier in the mix. Also, the effects of elevated temperature were investigated and it was found to
have significant influence on the strength and permeability characteristics of the mixture.
1
1. INTRODUCTION
Special asphalt pavement mixes with high degrees of porosity (open-graded mixes) offer
significantly better drainage behavior than normal pavement materials. While standard
pavements normally allow runoff only along the road surface, high porous asphalt mixes allow
for both horizontal and vertical (through pavement) drainage. Such drainage characteristics are
very appealing and would greatly increase driver’s safety by removing water more rapidly from
the driving surface thereby creating a dry driving surface even in moderate rainstorms.
Early applications of porous pavement were investigated by Thelen and Howe (1) and
Diniz (2), but these studies were generally limited to parking lots and driveways. Gemayel and
Mamlouk (3) presented a study (sponsored by the Arizona DOT), which investigated several
engineering properties of open-graded friction course (OGFC). They found that the tensile
strength and resilient modulus of open-graded mixes were about half of the value of normal
dense-graded asphalt. Furthermore, the open-graded material was extremely sensitive to
temperature. At high temperatures, these materials exhibited significant decreases in resilient
modulus and stability. This behavior is micromechanical in nature and is related to aggregate
contact behavior and to the viscosity increase of the binder material. Additional strength studies
of open-graded mixes were limited to emulsion mixtures by Hicks, et al. (4) and asphalt
stabilized aggregate bases by Majidzadeh and Elmitiny (5). Qi et al. (6) presented some new
research on the development of more durable asphalt binder through the use of polymer
modifiers. Preliminary research into drainage and flow in porous pavements was also made by
Isenring et al. (7) and Heystraeten et al. (8). A recent survey made by Kandhal and Mallick (9)
shows that the design and construction play a key role on determining the performance of open-
graded asphalt pavements. Mallick et al. (10,11) reported their results on the evaluation of the
2
performance of OGFC with different aggregate gradation and types of additives. Bolzan et al.
(12) summarized previous British studies on the performance of OGFC material. Kanitpong et
al. (13) investigated permeability of asphalt material with different aggregate gradations.
Maupin (14) studied the effects of sawing specimens for use in permeability testing, and
demonstrated that this method introduces surface effects that can modify the fluid transport.
The main challenge in designing an OGFC is determining a reasonable compromise
between permeability and strength. Currently, the literature indicates a lack of fundamental
understanding in the correlation between permeability and the strength characteristics of open-
graded asphalt mixes. This project is directed at providing additional information on this
correlation with emphasis on binder modification and its effects on performance improvement in
terms of strength and permeability. Furthermore, elevated temperature experiments will be
performed on both permeability and strength to determine the effects of temperature on these
characteristics.
2. SCOPE
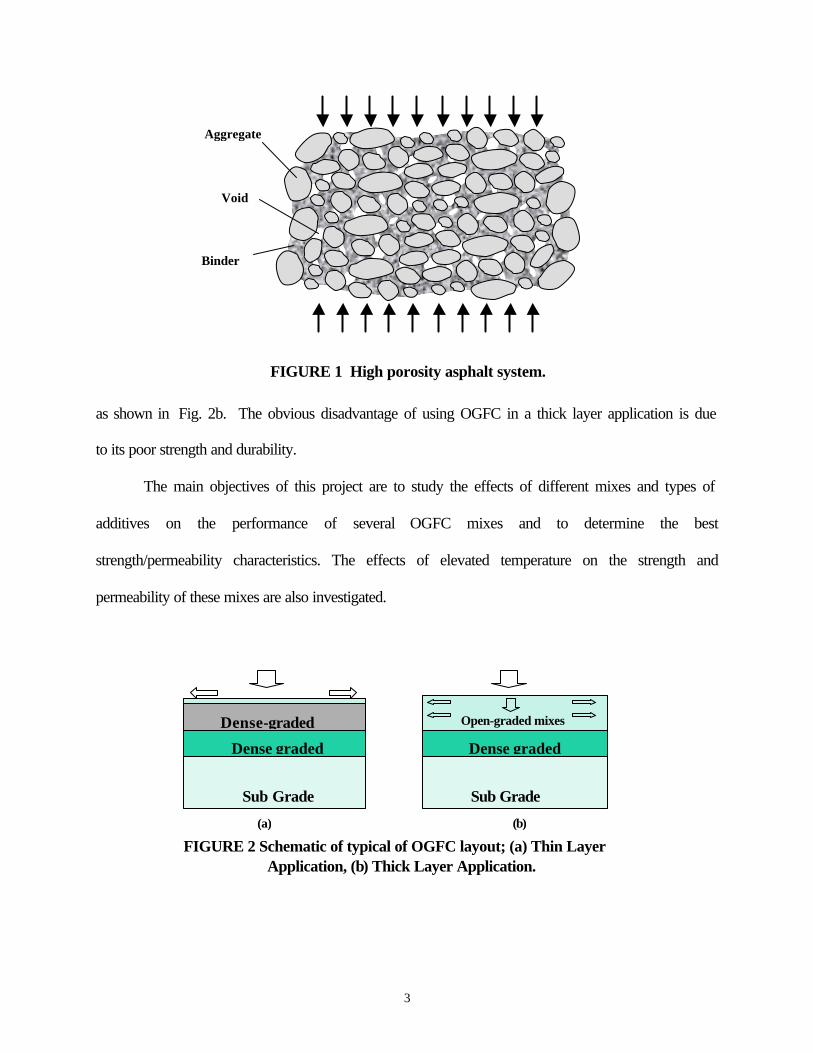
Asphalt is basically a heterogeneous cemented granular material system as shown in Fig.
1. High porosity in OGFC material is produced through appropriate volume fraction mixes of
graded particles and cement binder. Such a microstructure is not ideally suited for high stress
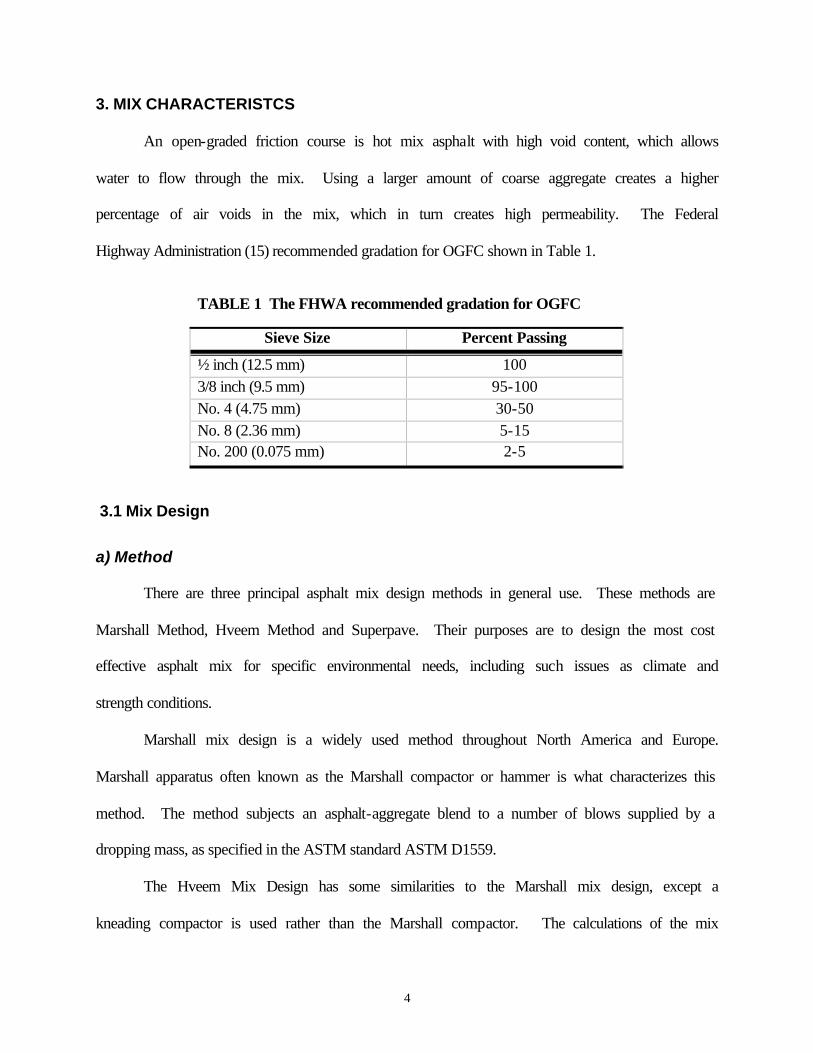
conditions required for roadway transportation systems. For this reason, most roadway uses of
open-graded mixes have been limited to a thin top layer with a typical thickness on the order of
the largest aggregate size, as depicted in Fig. 2a. While such a thin layer provides much better
friction between the tires and the road, it can only dissipate water along its coarse surface, which
may prove to be inadequate under heavy rain conditions. A thicker coarse on the other hand
would allow for greater drainage from the road surface through both vertical and horizontal flow
3
as shown in Fig. 2b. The obvious disadvantage of using OGFC in a thick layer application is due
to its poor strength and durability.
The main objectives of this project are to study the effects of different mixes and types of
additives on the performance of several OGFC mixes and to determine the best
strength/permeability characteristics. The effects of elevated temperature on the strength and
permeability of these mixes are also investigated.
FIGURE 1 High porosity asphalt system.
Aggregate
Binder
Void
FIGURE 2 Schematic of typical of OGFC layout; (a) Thin Layer Application, (b) Thick Layer Application.
(a) (b)
Sub Grade Sub Grade
Open-graded mixes
Dense graded Dense graded
Dense-graded
4
3. MIX CHARACTERISTCS
An open-graded friction course is hot mix asphalt with high void content, which allows
water to flow through the mix. Using a larger amount of coarse aggregate creates a higher
percentage of air voids in the mix, which in turn creates high permeability. The Federal
Highway Administration (15) recommended gradation for OGFC shown in Table 1.
TABLE 1 The FHWA recommended gradation for OGFC
Sieve Size Percent Passing
½ inch (12.5 mm) 100 3/8 inch (9.5 mm) 95-100 No. 4 (4.75 mm) 30-50 No. 8 (2.36 mm) 5-15 No. 200 (0.075 mm) 2-5
3.1 Mix Design
a) Method
There are three principal asphalt mix design methods in general use. These methods are
Marshall Method, Hveem Method and Superpave. Their purposes are to design the most cost
effective asphalt mix for specific environmental needs, including such issues as climate and
strength conditions.
Marshall mix design is a widely used method throughout North America and Europe.
Marshall apparatus often known as the Marshall compactor or hammer is what characterizes this
method. The method subjects an asphalt-aggregate blend to a number of blows supplied by a
dropping mass, as specified in the ASTM standard ASTM D1559.
The Hveem Mix Design has some similarities to the Marshall mix design, except a
kneading compactor is used rather than the Marshall compactor. The calculations of the mix

5
properties such as the voids in the total mixture (VTM), theoretical maximum density (TMD)
and bulk specific gravity (BSG) are the same for both methods but different testing equipment
are used.
Hveem and Marshall mix designs have been used for many decades. Both methods have
performed reasonably well in the past, but current roadway conditions and requirements created
the need for a different mix design method. A study to develop such a method to rationally
design asphalt mixtures for various environmental and loading conditions was initiated in 1988
by the Strategic Highway Research Program. This work led to new paving criteria called
Superpave, which stands for “SUperior PERforming Asphalt PAVEment”. The Superpave
design took into account asphalt binder evaluations, mix design, and mixture analysis and
aggregate size was to be chosen as part of a particular design need depending on traffic load and
environmental condition.
Because of the availability of the mix design equipment and consultation with several
faculty members at URI, samples were prepared using the Marshall mix design method. Other
mix design methods such as Superpave and their effects on permeability of OGFC are reported in
the literature, i.e. “Evaluation of Permeability of Superpave Mixes”, Final Report, Project NETC
00-2, New England Transportation Consortium, University of Connecticut, 2002.
b) Gradation
In the first phase of the research, four sample mixes were prepared with gradations
similar to those used by Mallick (10).
Sample mix A is a gradation similar to the one used by the FHWA and the other three
mix samples contain slight variations from this standard blend. The FHWA gradation has 40
percent of material passing the 4.75 mm sieve, and the coarsest of the other three gradations has
6
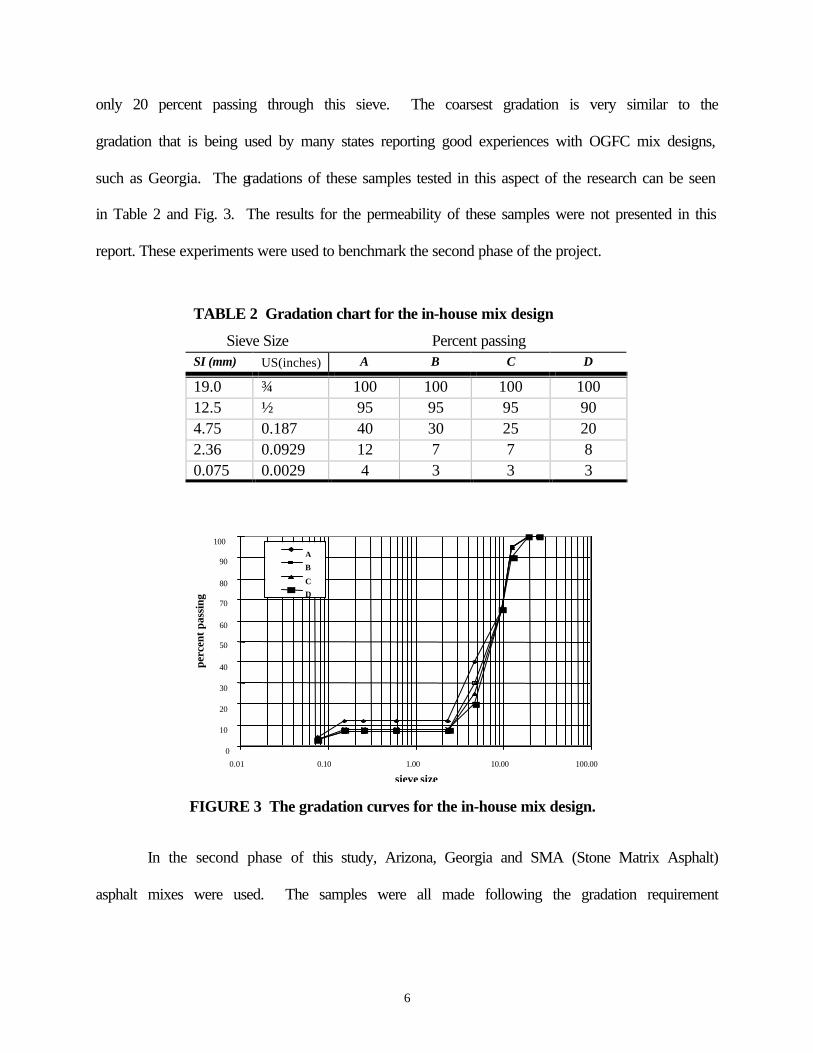
only 20 percent passing through this sieve. The coarsest gradation is very similar to the
gradation that is being used by many states reporting good experiences with OGFC mix designs,
such as Georgia. The gradations of these samples tested in this aspect of the research can be seen
in Table 2 and Fig. 3. The results for the permeability of these samples were not presented in this
report. These experiments were used to benchmark the second phase of the project.
TABLE 2 Gradation chart for the in-house mix design
Sieve Size Percent passing SI (mm) US(inches) A B C D
19.0 ¾ 100 100 100 100 12.5 ½ 95 95 95 90 4.75 0.187 40 30 25 20 2.36 0.0929 12 7 7 8 0.075 0.0029 4 3 3 3
In the second phase of this study, Arizona, Georgia and SMA (Stone Matrix Asphalt)
asphalt mixes were used. The samples were all made following the gradation requirement
FIGURE 3 The gradation curves for the in-house mix design.
0 10 20 30 40 50 60 70 80 90
100
0.01 0.10 1.00 10.00 100.00 sieve size
perc
ent p
assi
ng
A
B
C
D
7
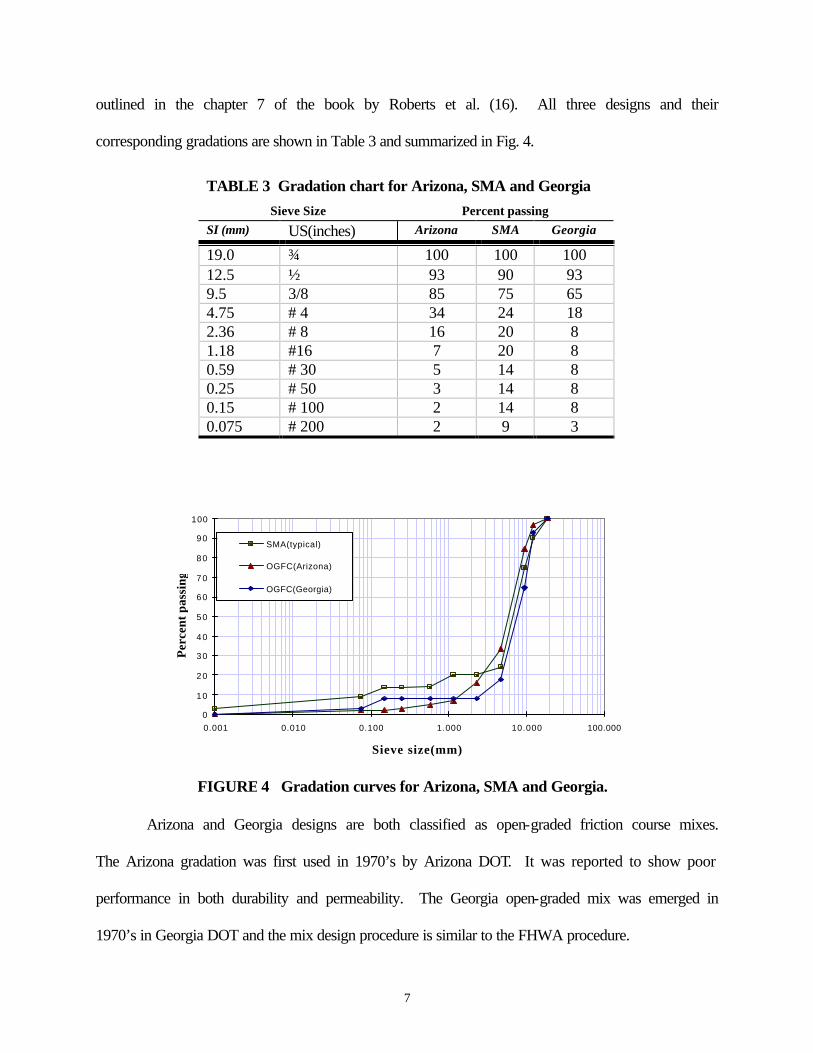
outlined in the chapter 7 of the book by Roberts et al. (16). All three designs and their
corresponding gradations are shown in Table 3 and summarized in Fig. 4.
TABLE 3 Gradation chart for Arizona, SMA and Georgia Sieve Size Percent passing
SI (mm) US(inches) Arizona SMA Georgia
19.0 ¾ 100 100 100 12.5 ½ 93 90 93 9.5 3/8 85 75 65 4.75 # 4 34 24 18 2.36 # 8 16 20 8 1.18 #16 7 20 8 0.59 # 30 5 14 8 0.25 # 50 3 14 8 0.15 # 100 2 14 8 0.075 # 200 2 9 3
Arizona and Georgia designs are both classified as open-graded friction course mixes.
The Arizona gradation was first used in 1970’s by Arizona DOT. It was reported to show poor
performance in both durability and permeability. The Georgia open-graded mix was emerged in
1970’s in Georgia DOT and the mix design procedure is similar to the FHWA procedure.
0
10
20
30
40
50
60
70
80
90
100
0.001 0.010 0.100 1.000 10.000 100.000
Sieve size(mm)
Per
cent
pas
sing
SMA(typical)
OGFC(Arizona)
OGFC(Georgia)
FIGURE 4 Gradation curves for Arizona, SMA and Georgia. mixtures.
8
SMA is not an open-graded mix, but was developed to provide a pavement with
maximum strength to prevent rutting. Although not an OGFC, SMA contains a higher portion of
coarse aggregate. For this reason, SMA samples were included in our study to provide strength
and permeability comparisons with the open-grade mixes.
c) Asphalt Content
In the early phase of the project, asphalt content was a design parameter that was
manipulated. Samples were tested at 5% and 6% to observe the effects of asphalt content on the
permeability of the specimens.
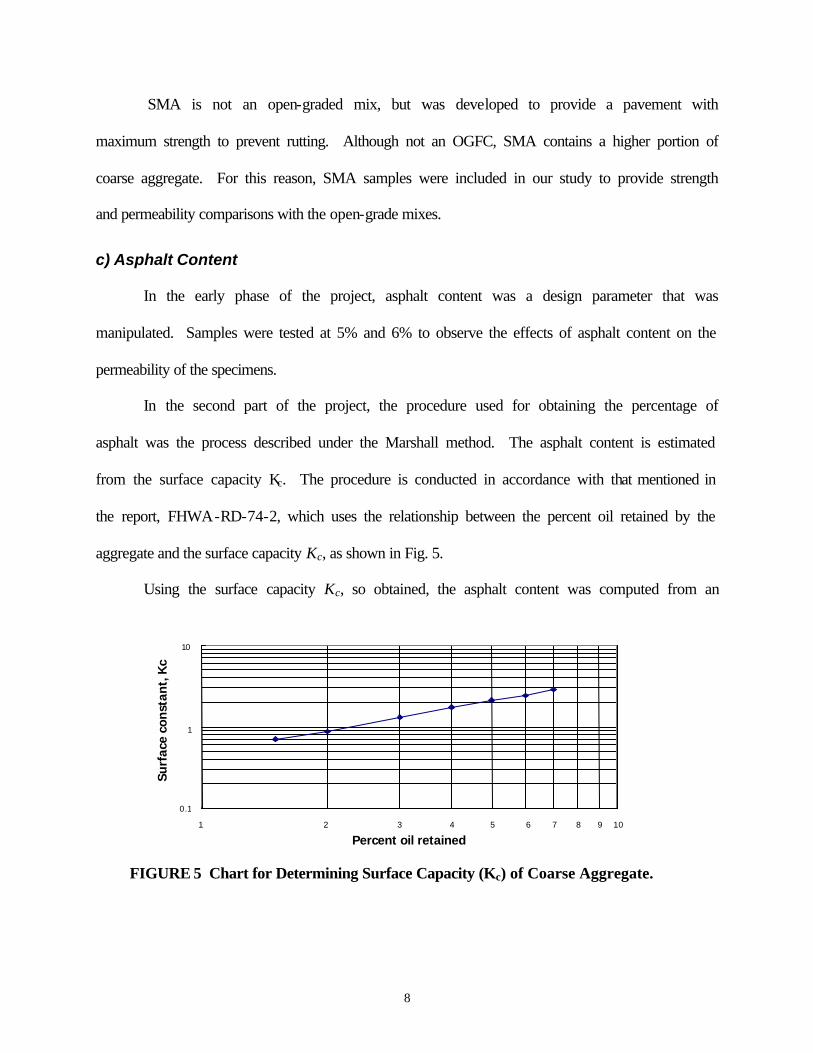
In the second part of the project, the procedure used for obtaining the percentage of
asphalt was the process described under the Marshall method. The asphalt content is estimated
from the surface capacity Kc. The procedure is conducted in accordance with that mentioned in
the report, FHWA-RD-74-2, which uses the relationship between the percent oil retained by the
aggregate and the surface capacity Kc, as shown in Fig. 5.
Using the surface capacity Kc, so obtained, the asphalt content was computed from an
FIGURE 5 Chart for Determining Surface Capacity (Kc) of Coarse Aggregate.
0.1
1
10
1 10
Percent oil retained
Surf
ace
con
stan
t, K
c
2 3 4 5 6 7 8 9
9
established simple linear relationship acquired from field experience on similarly graded
mixtures as,
2.0 *( ) 4.0 Percent Asphalt Kc= + (1)
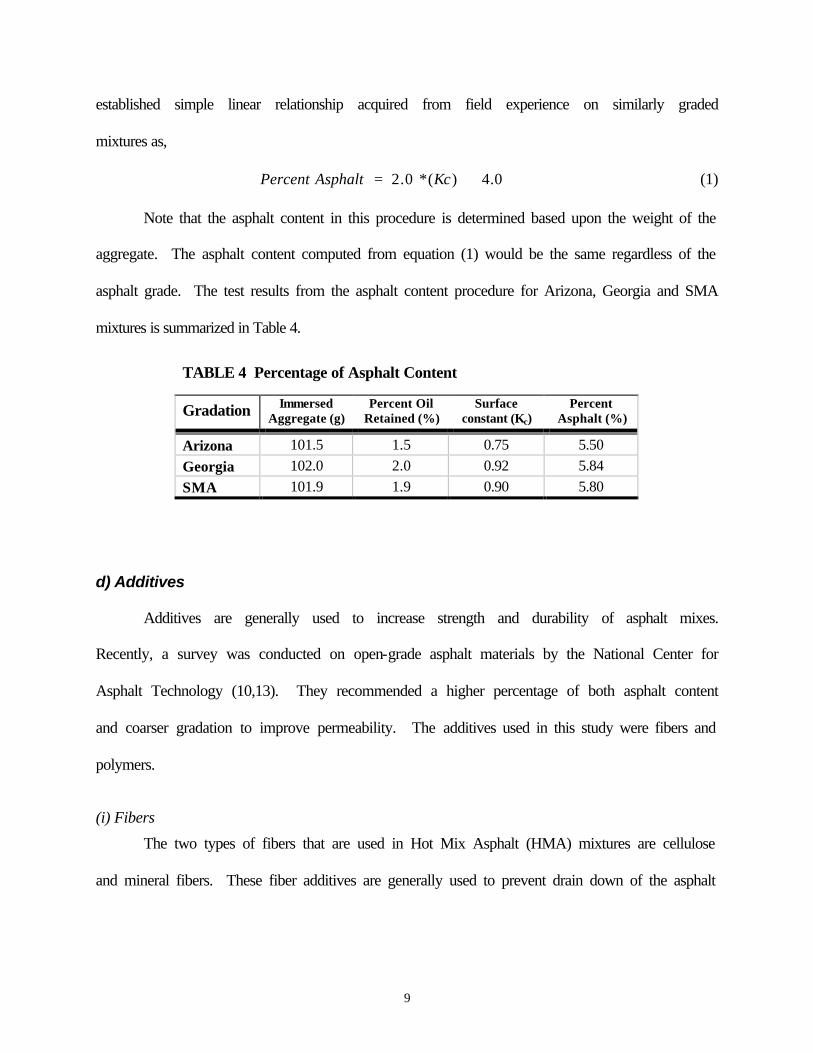
Note that the asphalt content in this procedure is determined based upon the weight of the
aggregate. The asphalt content computed from equation (1) would be the same regardless of the
asphalt grade. The test results from the asphalt content procedure for Arizona, Georgia and SMA
mixtures is summarized in Table 4.
TABLE 4 Percentage of Asphalt Content
Gradation Immersed Aggregate (g)
Percent Oil Retained (%)
Surface constant (Kc)
Percent Asphalt (%)
Arizona 101.5 1.5 0.75 5.50 Georgia 102.0 2.0 0.92 5.84 SMA 101.9 1.9 0.90 5.80
d) Additives
Additives are generally used to increase strength and durability of asphalt mixes.
Recently, a survey was conducted on open-grade asphalt materials by the National Center for
Asphalt Technology (10,13). They recommended a higher percentage of both asphalt content
and coarser gradation to improve permeability. The additives used in this study were fibers and
polymers.
(i) Fibers
The two types of fibers that are used in Hot Mix Asphalt (HMA) mixtures are cellulose
and mineral fibers. These fiber additives are generally used to prevent drain down of the asphalt
10
cement so as to maintain uniform distribution of the cement content. It also contributes to
significant reduction in permeability as will be seen from our experimental results.
(ii) Polymers
Polymers are usually used to increase the viscosity and decrease the drain down of
asphalt cement, resulting in a more consistent thickness of asphalt film. The two types of
polymers used in asphalt enhancement are elastomers and plastomers. The difference between
the two types is whether they exhibit elastic or plastic behavior during deformation. Plastomers
have a three-dimensional structure and a stiff characteristic. They add to the mix’s resistance to
deformation, but under high strains may fracture. The most commonly used elastomeric
polymers are SBR (styrene-butadiene rubber) and SBS (styrene-butadiene-styrene). These
polymers tend to also resist deformation but return to their original shape after loading and can
increase tensile strength.
CITGO brand CITGOFLEX SP asphalt PG-64 22 was the asphalt cement used in this
study. It was mixed with TECHNOCEL 1004 fiber additive, a cellulose based fiber, provided
from the Cellulose fiber factory. The polymer additive used was the CITGO brand SBS polymer
additive supplied premixed at 3 percent in the asphalt binder. The mixing and compaction
temperatures for the unmodified and modified asphalt mixes were approximately at 290 °F.
3.2 Volumetric Properties
a) Bulk Specific Gravity (BSG)
The bulk specific gravity of parafilm-coated specimens was determined in accordance
with ASTM standard test procedure D1188-96. A brief description follows.
First, the mass of the dried specimen was obtained and was designated as mass “A”. The
specimen was then coated with parafilm, by pressing and folding it over the specimen’s surface
11
filling all voids. The mass “D”of the dry coated specimen was determined in air, and this
procedure was repeated in a 25°C water bath to determine the mass designated as “E”.
Using similar weighing procedures, the apparent specific gravity of the parafilm was
calculated by first determining the specific gravity of the calibration cylinder
AlAl
Al Al
AG =
(A -B ) (2)
where AAl is the dry mass in air and BAl is the mass underwater. The specific gravity of parafilm
was then determined using the following relation
Al Al
Al Al Al Al
D -AF =
D -E - (A /G ) (3)
where DAl is the dry mass of the wrapped specimen and EAl is mass of the wrapped specimen
under water.
Finally, from equations (2) and (3) the bulk specific gravity, (Gmb), of the film-coated specimen
can be obtained as
mbA
G = D-E-(D-A)/F
(4)
b) Theoretical Maximum Density (TMD)
TMD is a hypothetical value representing a compacted specimen containing no air voids.
The theoretical maximum density of the specimen was obtained in accordance with ASTM
standard test method D2041-95, and the following equation was used
mm
s se b b
PGmm =
(P /G )+(P /G ) (5)
where Gmm is the Theoretical Maximum Density, Pmm is the total weight of the mix, Ps is the
percent weight of the aggregate in the total mix, Gse is the effective specific gravity of the

12
aggregate coated with asphalt, Pb is the percent weight of asphalt in the total mix and Gb is the
specific gravity of asphalt
c) Voids in Total Mixture (VTM)
VTM is the total volume air voids between the coated aggregate particles throughout a
compacted mixture. It is expressed as the percentage of the bulk volume of the specimen. The
voids in a compacted mixture were obtained in accordance with ASTM standard test method
D3202-94. Research has shown that the amount of air voids in a mixture affects the stability,
durability and permeability. The following equation represents the percentage of air voids in the
specimen.
VTM (%) =100(1-Gmb/Gmm) (6)
where Gmb is bulk specific gravity of the compacted mixture and Gmm is maximum theoretical
specific gravity of the mixture
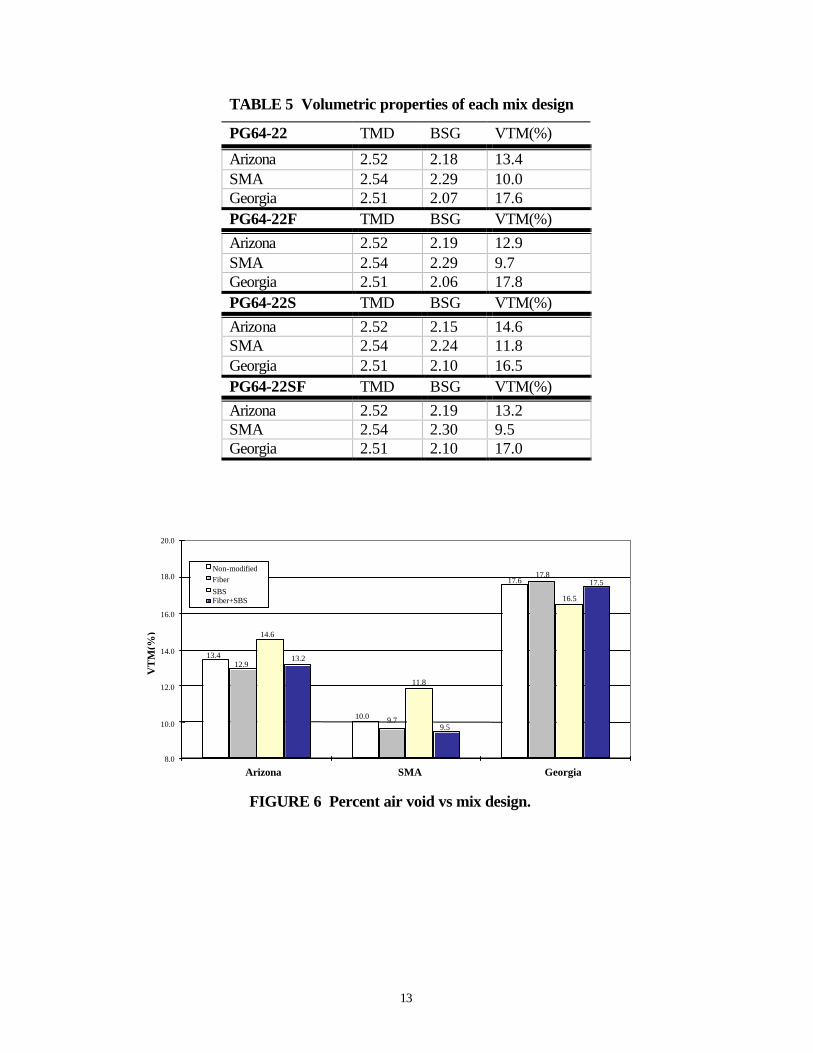
3.3 Results of Volumetric Properties
Table 5 presents the average volumetric properties determined for each mix design using
equations (4)-(6). The complete volumetric property data is given in Appendix A.
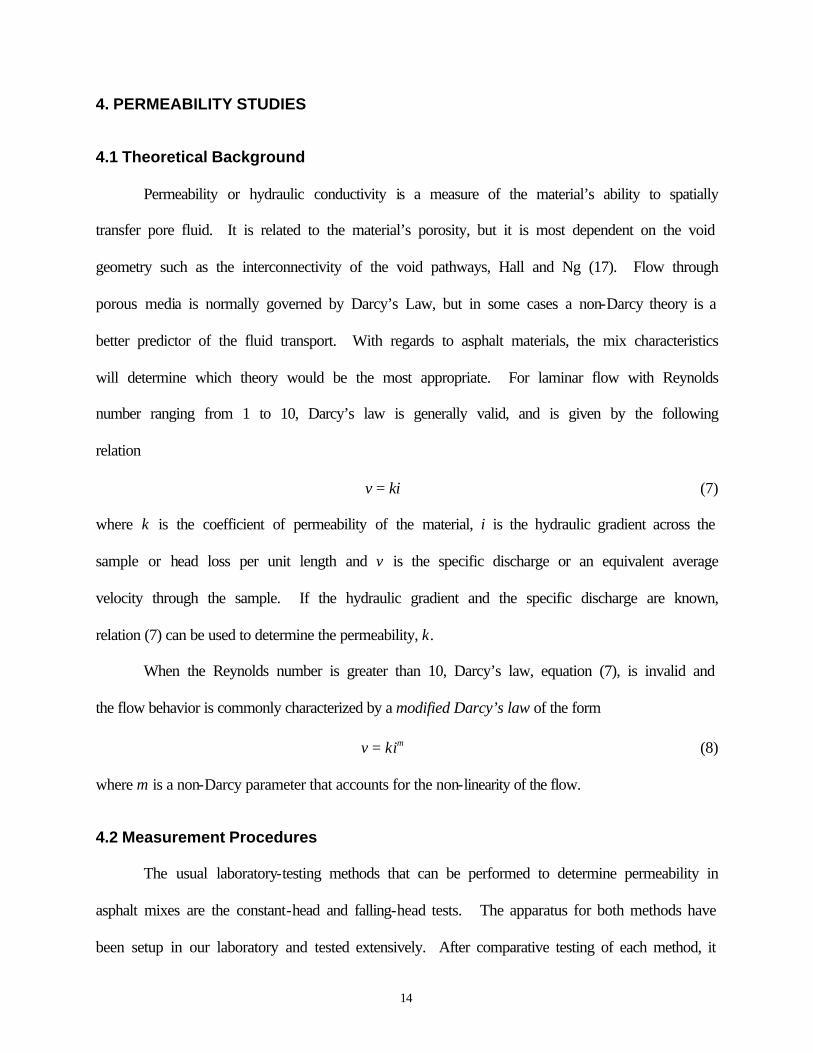
Fig. 6 summarizes the air void percent vs. mix design. As depicted in the figure, the
SMA mix exhibits the lowest overall porosity, Georgia the highest and Arizona somewhere in
between. The effects of modifiers on the asphalt characteristics are also shown here. For
Arizona and SMA mixes, the percent air voids decreases with the addition of fiber, increases
with polymer, and again decreases when both fiber and polymer are added. The Georgia mix
exhibited slightly different results.
13
TABLE 5 Volumetric properties of each mix design
PG64-22 TMD BSG VTM(%)
Arizona 2.52 2.18 13.4 SMA 2.54 2.29 10.0 Georgia 2.51 2.07 17.6 PG64-22F TMD BSG VTM(%) Arizona 2.52 2.19 12.9 SMA 2.54 2.29 9.7 Georgia 2.51 2.06 17.8 PG64-22S TMD BSG VTM(%) Arizona 2.52 2.15 14.6 SMA 2.54 2.24 11.8 Georgia 2.51 2.10 16.5 PG64-22SF TMD BSG VTM(%) Arizona 2.52 2.19 13.2 SMA 2.54 2.30 9.5 Georgia 2.51 2.10 17.0
FIGURE 6 Percent air void vs mix design.
13.4
10.0
17.6
12.9
9.7
17.8
14.6
11.8
16.5
13.2
9.5
17.5
8.0
10.0
12.0
14.0
16.0
18.0
20.0
Arizona SMA Georgia
VT
M(%
)
Non-modified Fiber SBS Fiber+SBS
14
4. PERMEABILITY STUDIES
4.1 Theoretical Background
Permeability or hydraulic conductivity is a measure of the material’s ability to spatially
transfer pore fluid. It is related to the material’s porosity, but it is most dependent on the void
geometry such as the interconnectivity of the void pathways, Hall and Ng (17). Flow through
porous media is normally governed by Darcy’s Law, but in some cases a non-Darcy theory is a
better predictor of the fluid transport. With regards to asphalt materials, the mix characteristics
will determine which theory would be the most appropriate. For laminar flow with Reynolds
number ranging from 1 to 10, Darcy’s law is generally valid, and is given by the following
relation
v ki= (7)
where k is the coefficient of permeability of the material, i is the hydraulic gradient across the
sample or head loss per unit length and v is the specific discharge or an equivalent average
velocity through the sample. If the hydraulic gradient and the specific discharge are known,
relation (7) can be used to determine the permeability, k.
When the Reynolds number is greater than 10, Darcy’s law, equation (7), is invalid and
the flow behavior is commonly characterized by a modified Darcy’s law of the form
mkiv = (8)
where m is a non-Darcy parameter that accounts for the non-linearity of the flow.
4.2 Measurement Procedures
The usual laboratory-testing methods that can be performed to determine permeability in
asphalt mixes are the constant-head and falling-head tests. The apparatus for both methods have
been setup in our laboratory and tested extensively. After comparative testing of each method, it
15
was determined that the falling-head test is more suitable for our purpose both in terms of
accuracy and ease of use. The procedures used to conduct both tests are as follows.
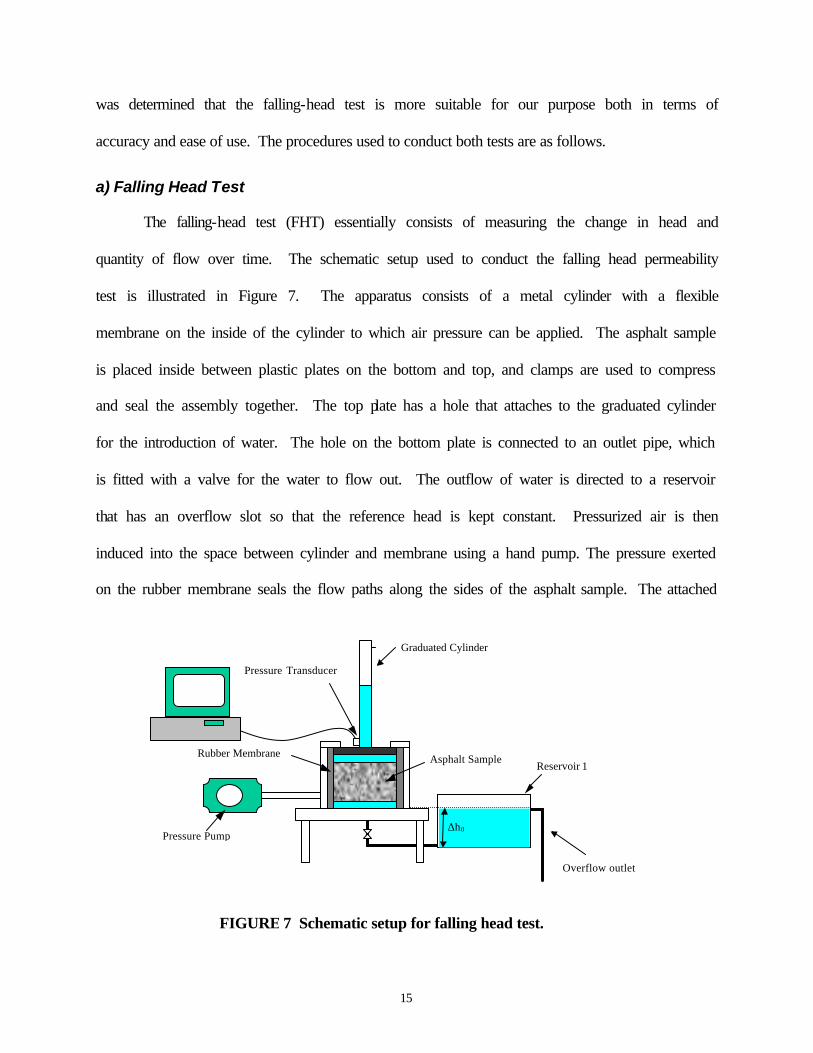
a) Falling Head Test
The falling-head test (FHT) essentially consists of measuring the change in head and
quantity of flow over time. The schematic setup used to conduct the falling head permeability
test is illustrated in Figure 7. The apparatus consists of a metal cylinder with a flexible
membrane on the inside of the cylinder to which air pressure can be applied. The asphalt sample
is placed inside between plastic plates on the bottom and top, and clamps are used to compress
and seal the assembly together. The top plate has a hole that attaches to the graduated cylinder
for the introduction of water. The hole on the bottom plate is connected to an outlet pipe, which
is fitted with a valve for the water to flow out. The outflow of water is directed to a reservoir
that has an overflow slot so that the reference head is kept constant. Pressurized air is then
induced into the space between cylinder and membrane using a hand pump. The pressure exerted
on the rubber membrane seals the flow paths along the sides of the asphalt sample. The attached
∆h0
Reservoir 1
Pressure Transducer
Pressure Pump
Asphalt Sample Rubber Membrane
Graduated Cylinder
FIGURE 7 Schematic setup for falling head test.
Overflow outlet
16
graduated cylinder is then filled with water, and the permeameter is tilted and tapped gently to
remove air bubbles.
To initiate the test, water is allowed to flow through the specimen by opening the valve
on the bottom of the permeameter. Measurement of the falling-head time history through the
sample is made with a high precision pressure transducer at the base of the cylinder. This data is
then transmitted directly to a computer equipped with LabTech data analysis software.
Regression analysis of the head vs. time gives the specific discharge velocity using the relation
dtdh
v = (9)
The permeability coefficient k, and the non-Darcy parameter m, can be determined by plotting a
log-log relation of the modified Darcy law as
imkv logloglog += (10)
where m is the slope and k is the v-intercept at i=1. Each sample was tested several times and the
results were averaged to minimize experimental errors.
b) Constant Head Test
The schematic setup used to conduct the constant head permeability test (CHT) is
illustrated in Fig. 8. As can be seen in the figure, the sample casing is the same as in the falling
head test except instead of the graduated cylinder, the inlet opening is connected to a constant
head reservoir (constant water level).
To initiate the test, the inlet valve is opened, and when an equilibrium flow condition is
established, a shallow dish collector and a computerized flow meter were used to measure and
compute the total specific discharge.
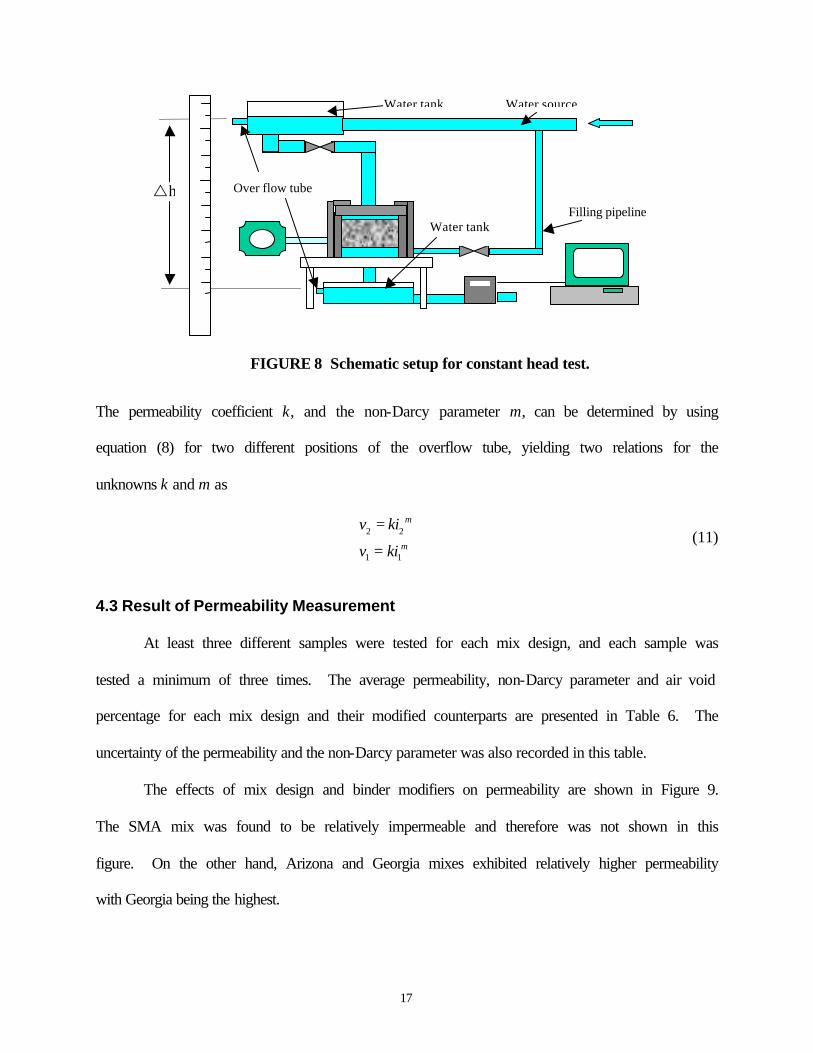
17
The permeability coefficient k, and the non-Darcy parameter m, can be determined by using
equation (8) for two different positions of the overflow tube, yielding two relations for the
unknowns k and m as
2 2
1 1
m
m
v ki
v ki
=
= (11)
4.3 Result of Permeability Measurement
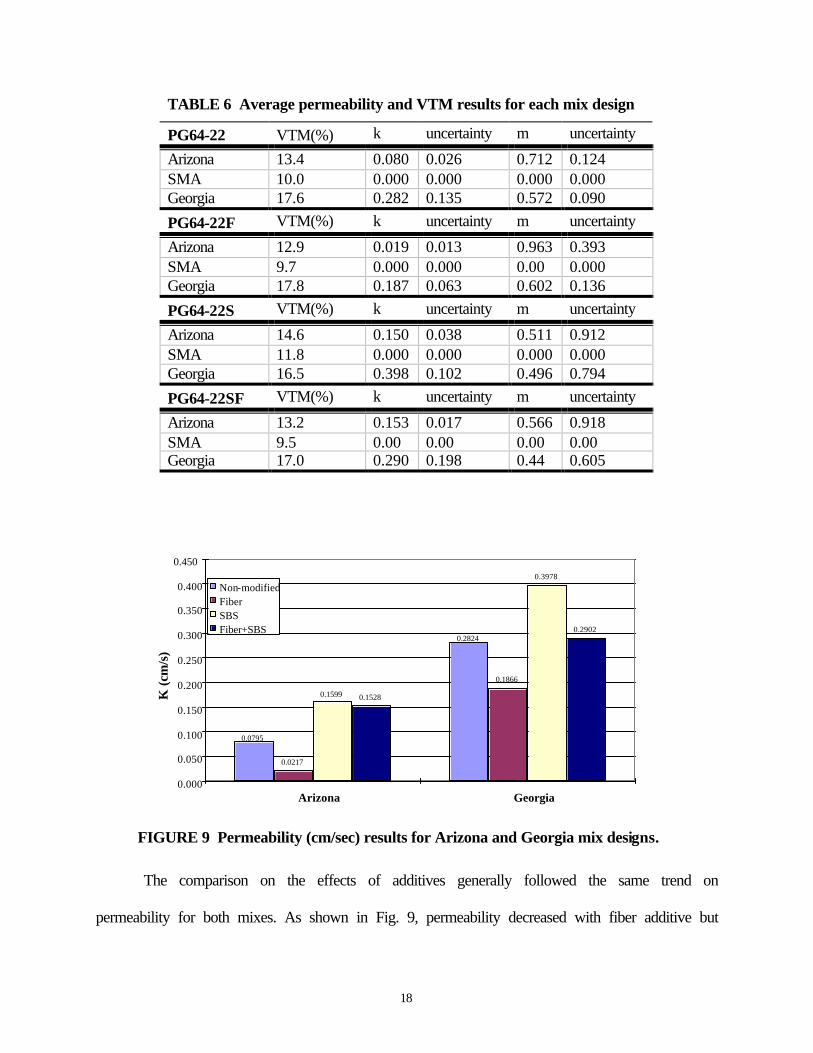
At least three different samples were tested for each mix design, and each sample was
tested a minimum of three times. The average permeability, non-Darcy parameter and air void
percentage for each mix design and their modified counterparts are presented in Table 6. The
uncertainty of the permeability and the non-Darcy parameter was also recorded in this table.
The effects of mix design and binder modifiers on permeability are shown in Figure 9.
The SMA mix was found to be relatively impermeable and therefore was not shown in this
figure. On the other hand, Arizona and Georgia mixes exhibited relatively higher permeability
with Georgia being the highest.
FIGURE 8 Schematic setup for constant head test.
rh Over flow tube
Filling pipeline
Water tank
Water tank
Water source
18
TABLE 6 Average permeability and VTM results for each mix design
PG64-22 VTM(%) k uncertainty m uncertainty
Arizona 13.4 0.080 0.026 0.712 0.124 SMA 10.0 0.000 0.000 0.000 0.000 Georgia 17.6 0.282 0.135 0.572 0.090
PG64-22F VTM(%) k uncertainty m uncertainty
Arizona 12.9 0.019 0.013 0.963 0.393 SMA 9.7 0.000 0.000 0.00 0.000 Georgia 17.8 0.187 0.063 0.602 0.136
PG64-22S VTM(%) k uncertainty m uncertainty
Arizona 14.6 0.150 0.038 0.511 0.912 SMA 11.8 0.000 0.000 0.000 0.000 Georgia 16.5 0.398 0.102 0.496 0.794
PG64-22SF VTM(%) k uncertainty m uncertainty
Arizona 13.2 0.153 0.017 0.566 0.918 SMA 9.5 0.00 0.00 0.00 0.00 Georgia 17.0 0.290 0.198 0.44 0.605
The comparison on the effects of additives generally followed the same trend on
permeability for both mixes. As shown in Fig. 9, permeability decreased with fiber additive but
FIGURE 9 Permeability (cm/sec) results for Arizona and Georgia mix designs.
0.0795
0.2824
0.0217
0.1866 0.1599
0.3978
0.1528
0.2902
0.000
0.050
0.100
0.150
0.200
0.250
0.300
0.350
0.400
0.450
Arizona Georgia
Non-modified Fiber SBS Fiber+SBS
K (
cm/s
)
19
increased with polymer (SBS) additive. When both fiber and polymer were used as modifiers,
the permeability increase due to the polymer additive was reduced by the fiber content in the
Arizona mix, but was nearly unchanged in the Georgia mix. In general, the reduction of the
permeability due to fiber additives was nearly a factor of two while the opposite was true for
polymer additives.
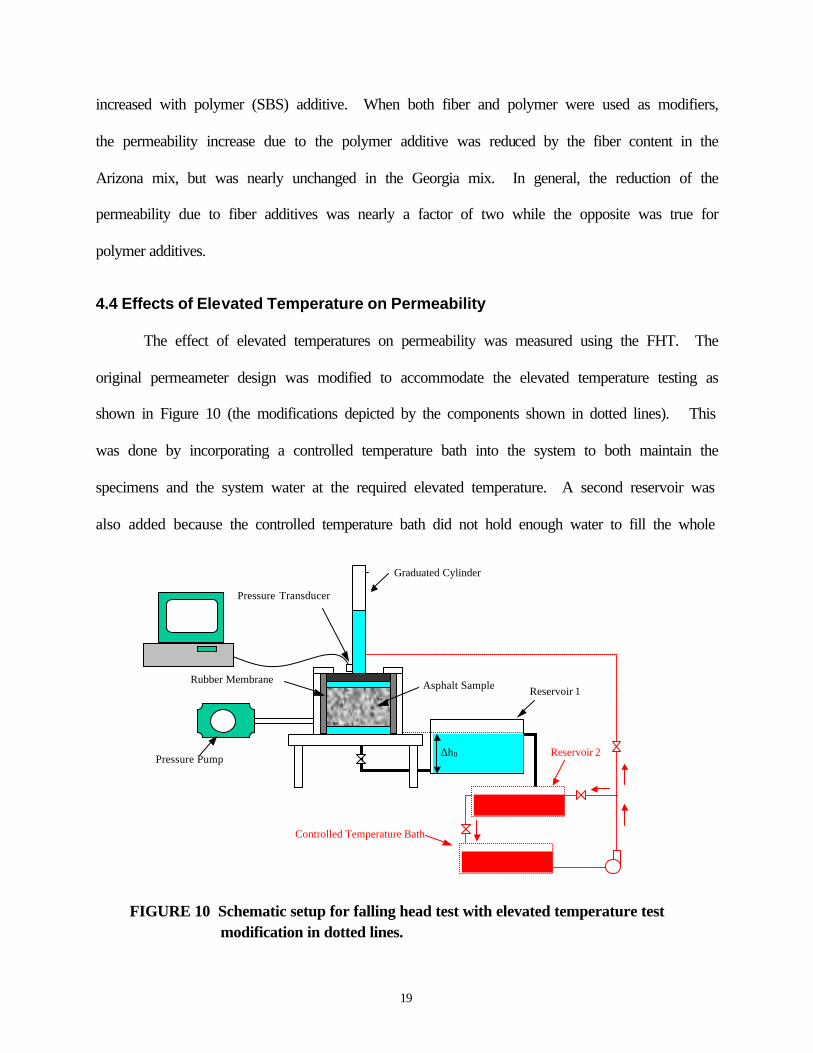
4.4 Effects of Elevated Temperature on Permeability
The effect of elevated temperatures on permeability was measured using the FHT. The
original permeameter design was modified to accommodate the elevated temperature testing as
shown in Figure 10 (the modifications depicted by the components shown in dotted lines). This
was done by incorporating a controlled temperature bath into the system to both maintain the
specimens and the system water at the required elevated temperature. A second reservoir was
also added because the controlled temperature bath did not hold enough water to fill the whole
∆h0
Reservoir 1
Pressure Transducer
Pressure Pump
Asphalt Sample Rubber Membrane
Graduated Cylinder
Controlled Temperature Bath
Reservoir 2
FIGURE 10 Schematic setup for falling head test with elevated temperature test modification in dotted lines.
20
system while housing the remaining heated samples. To maintain constant temperature between
the two reservoirs, heated water was continuously circulated between this reservoir and the
control bath.
Once the system reached the desired equilibrium temperature, the sample was removed
from the controlled bath and placed inside the permeameter. The flow from the hot water bath
was then redirected from the reservoir to the insulated graduated cylinder using a series of valves
and insulated tubing as shown in Figure 10. Once the graduated cylinder was full, the
permeability test was conducted in the same manner as previously described.
Upon completion of the test, the sample was returned to the hot water bath and the
procedure was repeated for all samples through the temperature range of 25°C to 55°C. During
the test, thermocouple probes were used to check the temperatures and/or temperature
differences throughout the system to ensure that the desired temperature was maintained. After
the completion of each test, a temperature reading was also taken on the specimen’s core, to
make certain, a significant change in temperature had not occurred.
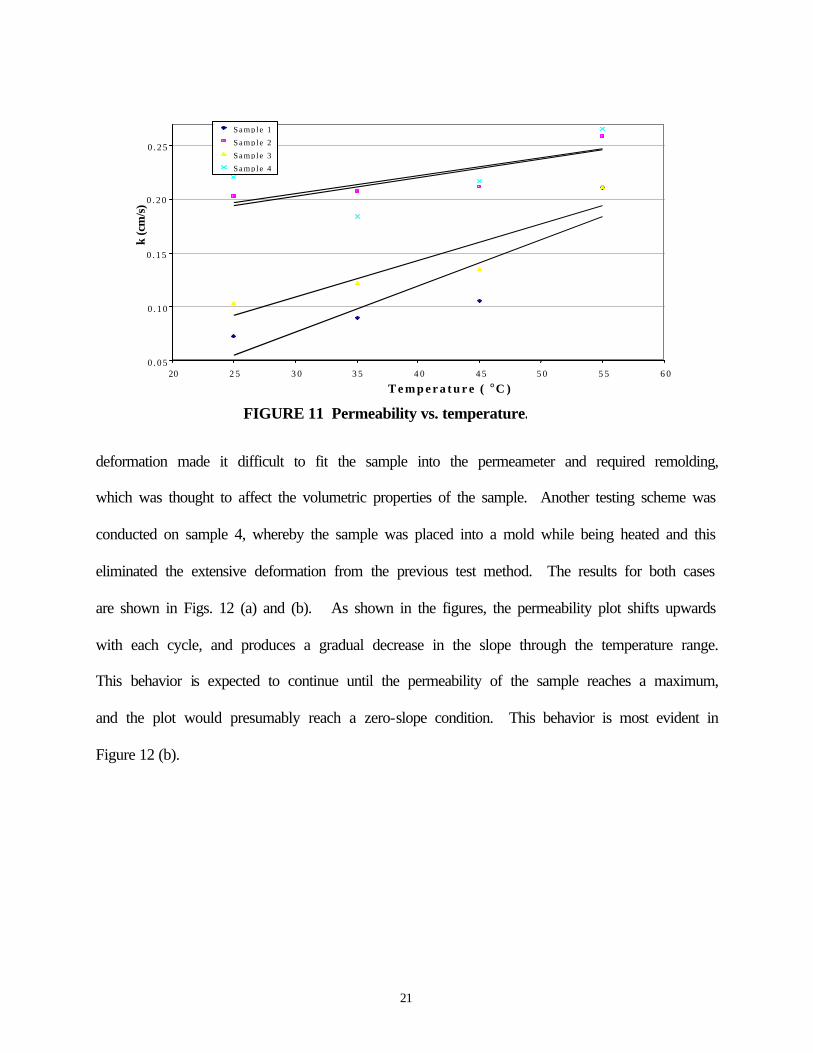
4.5 Permeability/Temperature Results
Four Georgia samples were tested for permeability through the elevated temperature
range. The results obtained from the testing are given in Figure 11. As shown, it is evident that
the sample’s permeability is proportional to its temperature. That is, as the temperature was
raised, the permeability of the samples also increased.
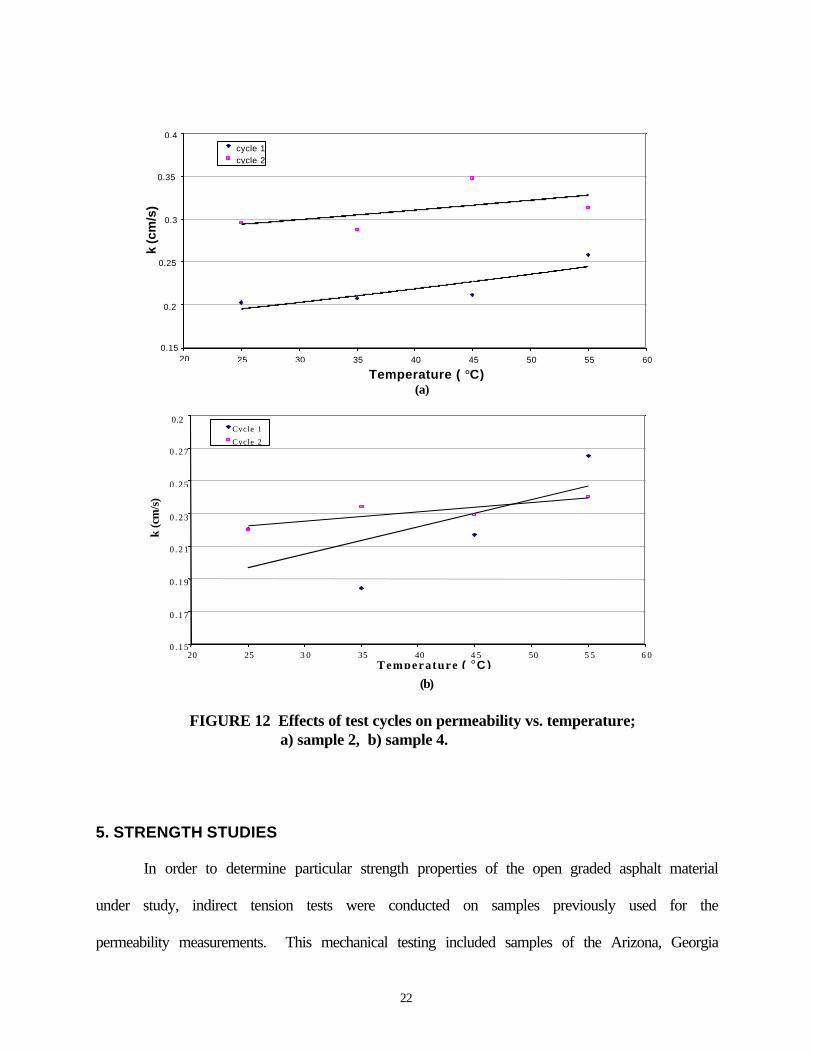
Repeated testing under elevated temperature also revealed that the permeability of the
samples was not only temperature dependant but also cycle dependent. This prompted the
investigation of thermal cycling effects. First, sample 2 was retested through the temperature
range. However, it was noted that repeated cycling lead to deformation of the sample. The
21
deformation made it difficult to fit the sample into the permeameter and required remolding,
which was thought to affect the volumetric properties of the sample. Another testing scheme was
conducted on sample 4, whereby the sample was placed into a mold while being heated and this
eliminated the extensive deformation from the previous test method. The results for both cases
are shown in Figs. 12 (a) and (b). As shown in the figures, the permeability plot shifts upwards
with each cycle, and produces a gradual decrease in the slope through the temperature range.
This behavior is expected to continue until the permeability of the sample reaches a maximum,
and the plot would presumably reach a zero-slope condition. This behavior is most evident in
Figure 12 (b).
0 . 0 5
0 . 1 0
0 . 1 5
0 . 2 0
0 . 2 5
20 2 5 3 0 3 5 4 0 4 5 5 0 5 5 6 0
T e m p e r a t u r e ( °C )
k (c
m/s
) S a m p l e 1
S a m p l e 2
S a m p l e 3
S a m p l e 4
FIGURE 11 Permeability vs. temperature.
22
5. STRENGTH STUDIES
In order to determine particular strength properties of the open graded asphalt material
under study, indirect tension tests were conducted on samples previously used for the
permeability measurements. This mechanical testing included samples of the Arizona, Georgia
0 .15
0 .17
0 .19
0 .21
0 .23
0 .25
0 .27
0.29
20 25 3 0 35 40 4 5 50 5 5 6 0 Temperature ( °C )
k (c
m/s
)
Cycle 1
Cycle 2
(b)
0.15
0.2
0.25
0.3
0.35
0.4
20 25 30 35 40 45 50 55 60
Temperature ( °C) (C)
k (c
m/s
) cycle 1 cycle 2
(a)
FIGURE 12 Effects of test cycles on permeability vs. temperature; a) sample 2, b) sample 4.
23
and SMA mixes, including material with and without additives. The goal of this testing program
was to provide correlation of the mechanical/strength properties with the permeability.
5.1 Theoretical Background
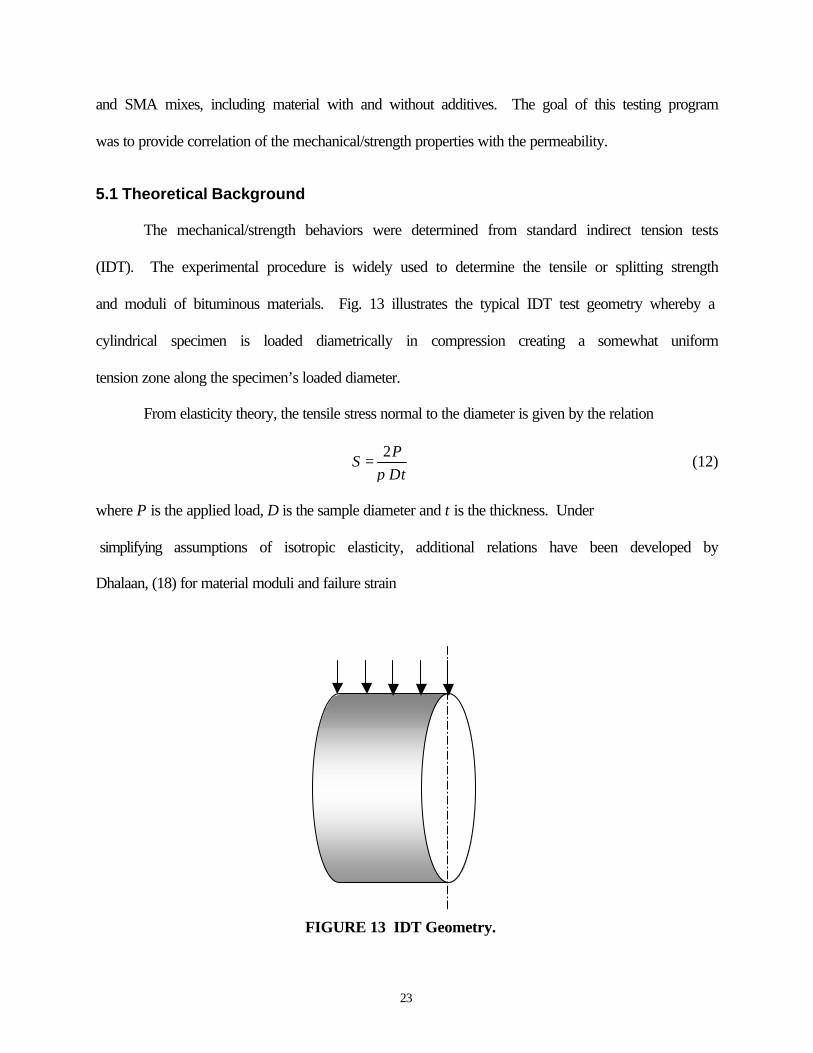
The mechanical/strength behaviors were determined from standard indirect tension tests
(IDT). The experimental procedure is widely used to determine the tensile or splitting strength
and moduli of bituminous materials. Fig. 13 illustrates the typical IDT test geometry whereby a
cylindrical specimen is loaded diametrically in compression creating a somewhat uniform
tension zone along the specimen’s loaded diameter.
From elasticity theory, the tensile stress normal to the diameter is given by the relation
2P
SDtπ
= (12)
where P is the applied load, D is the sample diameter and t is the thickness. Under
simplifying assumptions of isotropic elasticity, additional relations have been developed by
Dhalaan, (18) for material moduli and failure strain
FIGURE 13 IDT Geometry.
24
21
65
43
22
11
)(
AAAA
X
AAt
SE
BASBAS
f
h
v
v
ν−ν−
∆=ε
ν−=
++
=ν
(13)
where v is Poisson’s ratio, E is the modulus of elasticity, fε is the sample’s center-point
tensile strain at failure, Sv is the slope of the line representing vertical to horizontal sample
deformation, Sh is the slope of the line relating applied load to horizontal deformation, and Ai and
Bi are numerical factors dependent on the sample geometry given by Dhalaan, (18). Several
other tests could also be used to characterize additional mechanical properties such as rutting,
raveling or abrasion associated with aging of mixes. These tests will be conducted in the second
year of the project.
5.2 IDT Measurement Procedures
The IDT testing procedures were performed in accordance with ASTM standard test
method D4123-82. Cylindrical samples had a standard four-inch (101mm) diameter and a
thickness in the range of 2.5-2.75 inches (63-70mm). Testing was conducted on an Instron
testing machine that provided output of the vertical load and deformation. The horizontal
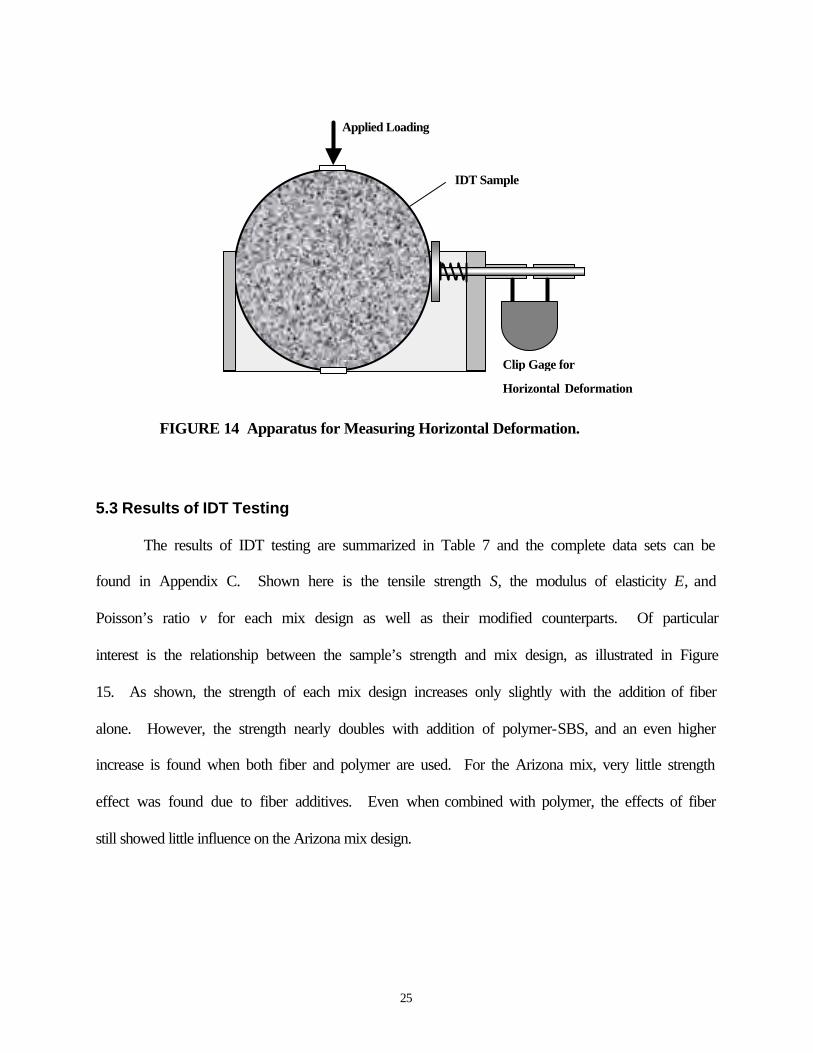
specimen deformation was measured using a special displacement fixture shown in Figure 14.
As per ASTM standards, 0.5-inch (12mm) loading strips were used on the top and bottom of the
specimen. The loading rate (head rate) was kept at 0.2 in/min (5mm/min). Within each mix
design, several samples were tested and the results were averaged.
25
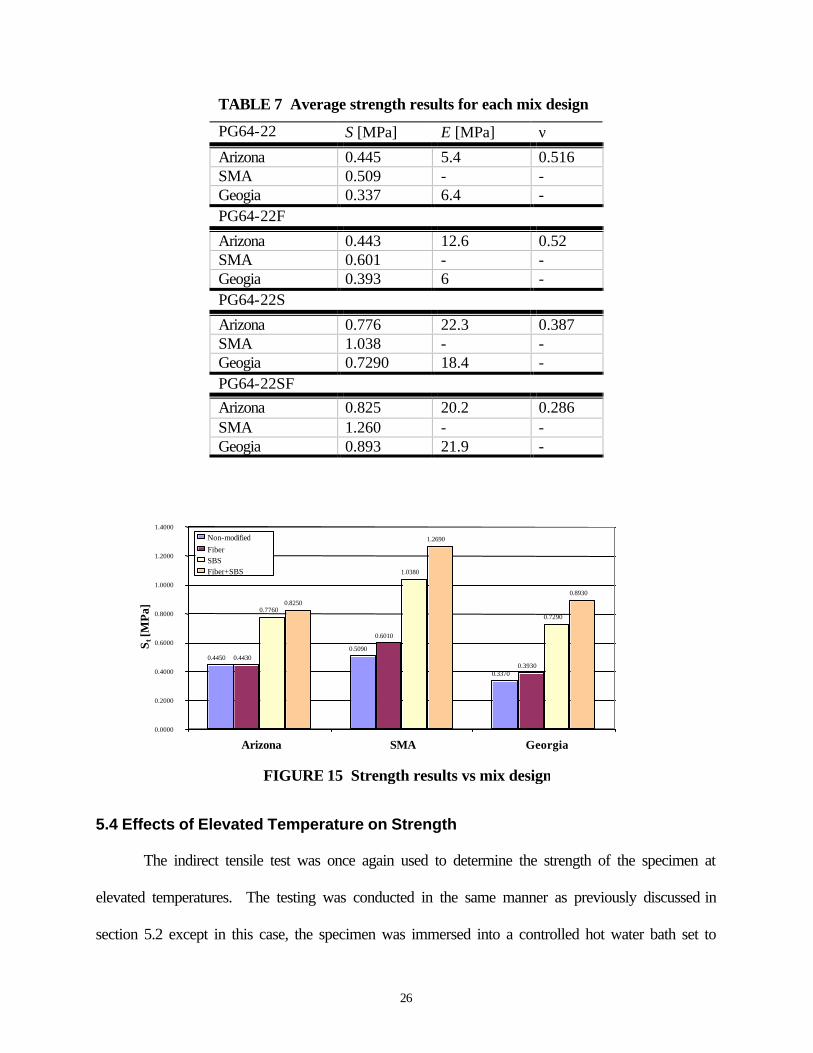
5.3 Results of IDT Testing
The results of IDT testing are summarized in Table 7 and the complete data sets can be
found in Appendix C. Shown here is the tensile strength S, the modulus of elasticity E, and
Poisson’s ratio v for each mix design as well as their modified counterparts. Of particular
interest is the relationship between the sample’s strength and mix design, as illustrated in Figure
15. As shown, the strength of each mix design increases only slightly with the addition of fiber
alone. However, the strength nearly doubles with addition of polymer-SBS, and an even higher
increase is found when both fiber and polymer are used. For the Arizona mix, very little strength
effect was found due to fiber additives. Even when combined with polymer, the effects of fiber
still showed little influence on the Arizona mix design.
FIGURE 14 Apparatus for Measuring Horizontal Deformation.
Applied Loading
Clip Gage for
Horizontal Deformation
IDT Sample
26
TABLE 7 Average strength results for each mix design
PG64-22 S [MPa] E [MPa] ν
Arizona 0.445 5.4 0.516 SMA 0.509 - - Geogia 0.337 6.4 - PG64-22F
Arizona 0.443 12.6 0.52 SMA 0.601 - - Geogia 0.393 6 - PG64-22S
Arizona 0.776 22.3 0.387 SMA 1.038 - - Geogia 0.7290 18.4 - PG64-22SF Arizona 0.825 20.2 0.286 SMA 1.260 - - Geogia 0.893 21.9 -
5.4 Effects of Elevated Temperature on Strength
The indirect tensile test was once again used to determine the strength of the specimen at
elevated temperatures. The testing was conducted in the same manner as previously discussed in
section 5.2 except in this case, the specimen was immersed into a controlled hot water bath set to
FIGURE 15 Strength results vs mix design
0.4450 0.5090
0.3370 0.4430
0.6010
0.3930
0.7760
1.0380
0.7290 0.8250
1.2690
0.8930
0.0000
0.2000
0.4000
0.6000
0.8000
1.0000
1.2000
1.4000
Arizona SMA Georgia
S t [M
Pa]
Non-modified Fiber SBS Fiber+SBS
27
a specific testing temperature prior to performing the actual strength tests. The specimen was not
placed directly into the water, but rather into a plastic bag in order to keep the sample dry. A
thermocouple was used to monitor the core sample temperature. The strength test was conducted
when the sample reached the equilibrium temperature. These tests were conducted at room
temperature (25°C), and at elevated temperatures of 35°C, 45°C and 55°C.
5.5 Strength/Temperature Result
As before, only the Georgia specimens were tested for strength properties at the elevated
temperatures. Three specimens from the same mix were tested at each temperature. Applied
load, horizontal and vertical deflections were measured and recorded. Tensile strength, modulus
of elasticity and Poisson’s ratio were the three properties of interest that were calculated. Results
of these tests are presented in Table 8. The large values of Poison’s ratio at elevated temperature
are certainly not accurate and are a likely the result of inelastic deformation of the sample.
TABLE 8 Georgia strength testing at elevated temperatures
25 ºC 1 2 3 Ave S [MPa] 0.361 0.381 0.413 0.385 E [MPa] 5.195 6.517 7.025 6.246 ν 0.485 0.149 0.410 0.348 35 ºC 1 2 3 Ave S [MPa] 0.178 0.172 0.144 0.165 E [MPa] 2.895 3.372 1.998 2.755 ν 0.972 0.945 0.571 0.829 45 ºC 1 2 3 Ave S [MPa] 0.068 0.054 0.067 0.063 E [MPa] 1.194 0.770 1.370 1.111 ν 0.933 0.572 0.676 0.727 55 ºC 1 2 3 Ave S [MPa] 0.036 0.032 0.037 0.035 E [MPa] 0.647 0.578 0.719 0.648 ν 0.844 1.259 0.667 0.923
28
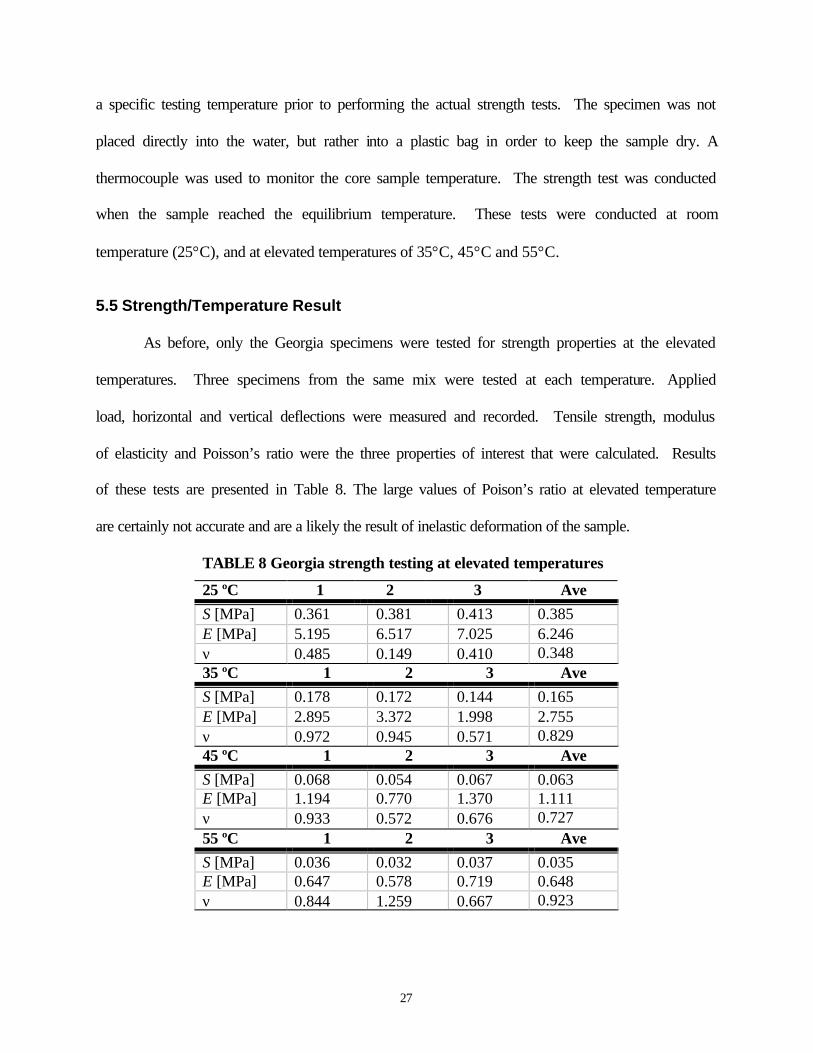
Figure 16 illustrates the effect of temperature on the average strength S taken from Table
8. As the testing temperature increased, the specimen’s strength decreased significantly. It is felt
that the pronounced strength decrease was enhanced since the material was an open graded mix.
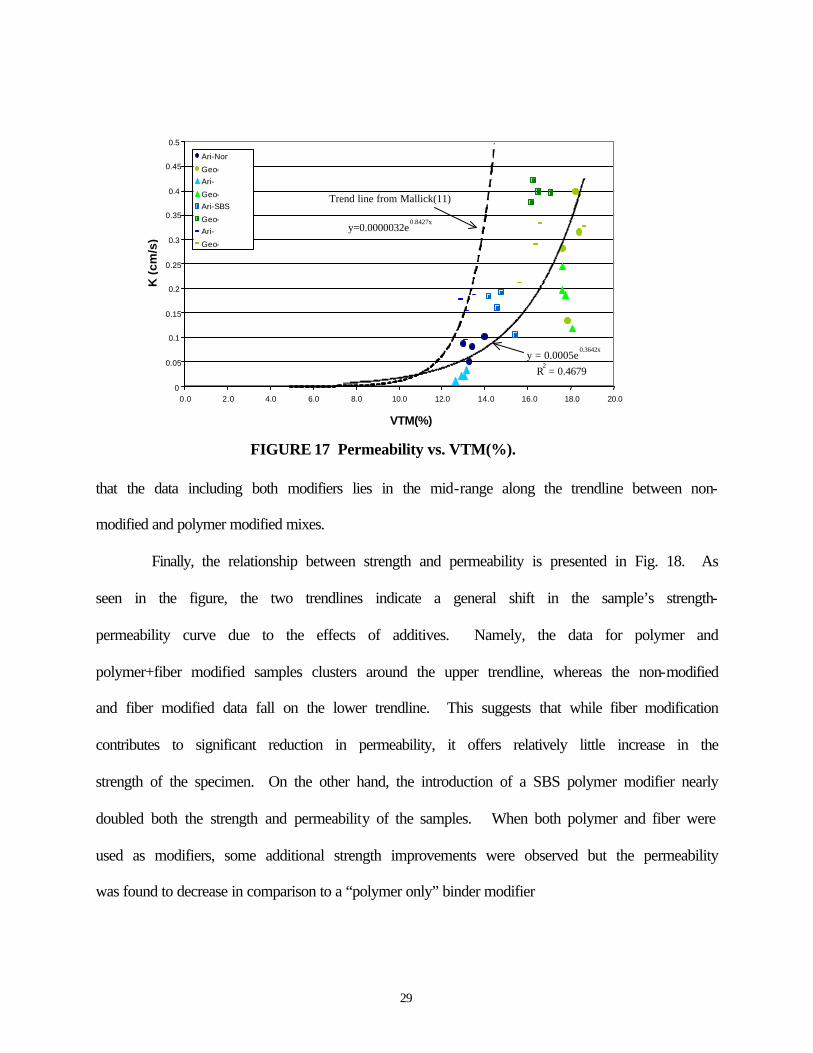
6. CORRELATION OF RESULTS
As mentioned earlier, percent air void of an asphalt mix is normally related to its
permeability. Such a relationship for our data is illustrated in Fig. 17. Also shown in this figure,
is the trendline of results given by Mallick et al (11) for dense graded mixes with no binder
modifications. There is a significant difference between the two trendlines. The data range of
Mallick’s results is between 2.0% to 10% of air void while our data covers a wider range of air
void percentage. In the range of 2.0% to 10%, the two trendlines are reasonably close. As for the
effects of binder additives, the mixes with fiber additives shows lower permeability than its non-
modified counterparts and the opposite is true for the mix samples with polymer modifiers. Note
0 . 1 6 5
0 . 0 6 3
0.035
0.385
0.000
0.050
0.100
0.150
0.200
0.250
0.300
0.350
0.400
25 35 45 55
St
(MP
a)
T e m p e r a t u r e (° C )
FIGURE 16 Average strength results for Georgia sample at elevated temperatures.
29
that the data including both modifiers lies in the mid-range along the trendline between non-
modified and polymer modified mixes.
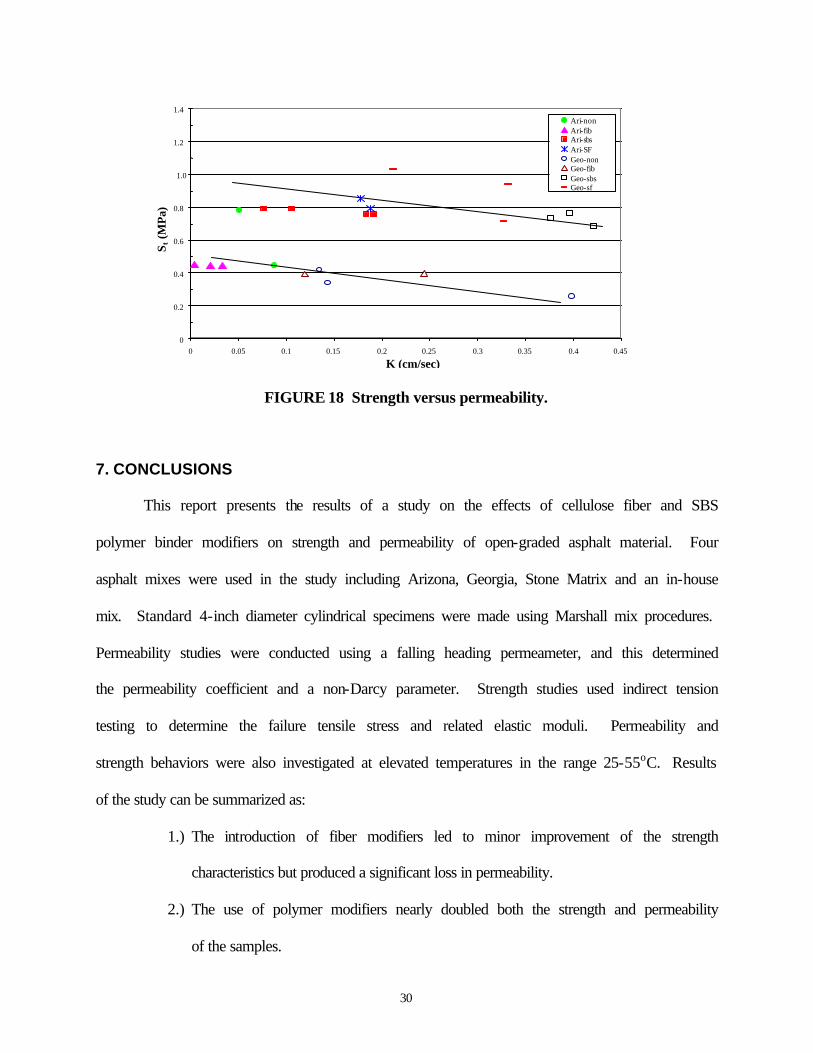
Finally, the relationship between strength and permeability is presented in Fig. 18. As
seen in the figure, the two trendlines indicate a general shift in the sample’s strength-
permeability curve due to the effects of additives. Namely, the data for polymer and
polymer+fiber modified samples clusters around the upper trendline, whereas the non-modified
and fiber modified data fall on the lower trendline. This suggests that while fiber modification
contributes to significant reduction in permeability, it offers relatively little increase in the
strength of the specimen. On the other hand, the introduction of a SBS polymer modifier nearly
doubled both the strength and permeability of the samples. When both polymer and fiber were
used as modifiers, some additional strength improvements were observed but the permeability
was found to decrease in comparison to a “polymer only” binder modifier
FIGURE 17 Permeability vs. VTM(%).
y = 0.0005e 0.3642x R 2 = 0.4679
0 0.05
0.1 0.15
0.2 0.25
0.3
0.35 0.4
0.45 0.5
0.0 2.0 4.0 6.0 8.0 10.0 12.0 14.0 16.0 18.0 20.0 VTM(%)
K (c
m/s
) Ari-Non
Geo-Non Ari-Fiber Geo-Fiber Ari-SBS
Geo-SBS Ari-SBS+Fiber Geo-SBS+Fiber
Trend line from Mallick(11)
y=0.0000032e 0.8427x
30
7. CONCLUSIONS
This report presents the results of a study on the effects of cellulose fiber and SBS
polymer binder modifiers on strength and permeability of open-graded asphalt material. Four
asphalt mixes were used in the study including Arizona, Georgia, Stone Matrix and an in-house
mix. Standard 4-inch diameter cylindrical specimens were made using Marshall mix procedures.
Permeability studies were conducted using a falling heading permeameter, and this determined
the permeability coefficient and a non-Darcy parameter. Strength studies used indirect tension
testing to determine the failure tensile stress and related elastic moduli. Permeability and
strength behaviors were also investigated at elevated temperatures in the range 25-55oC. Results
of the study can be summarized as:
1.) The introduction of fiber modifiers led to minor improvement of the strength
characteristics but produced a significant loss in permeability.
2.) The use of polymer modifiers nearly doubled both the strength and permeability
of the samples.
FIGURE 18 Strength versus permeability.
0
0.2
0.4
0.6
0.8
1.0
1.2
1.4
0 0.05 0.1 0.15 0.2 0.25 0.3 0.35 0.4 0.45
K (cm/sec)
S t (M
Pa)
Ari-non Ari-fib Ari-sbs Ari-SF Geo-non Geo-fib Geo-sbs Geo-sf
31
3.) When both polymer and fiber modifiers were used, an additional strength
improvement was observed but the permeability.
4.) The sample permeability increased with increasing temperature. This was caused
by relocation of binder material within the pores.
5.) A repeat of elevated temperature testing on the same sample showed an upward
shift in the permeability-temperature curve due to the repeated cycle. This could
have important effects on roadway surfaces in warm climates during daily cyclic
summer conditions.
6.) A significant decrease in tensile strength was found as the temperature was
increased. Of course at the higher temperatures (55oC) the material behavior is
less elastic and more viscoelastic.
7.) The best compromise for the good strength/permeability characteristics was found
by only using the polymer modifier.
8. ACKNOWLEDGEMENTS
The authors would like to acknowledge support from the University of Rhode Island
Transportation Center, Grant No. 00-44. Additional support was also provided by J.H Lynch &
Sons, Inc.
32
9. REFERENCES
1. Thelan, E. and Howe, L., (1978) Porous Pavement, The Franklin Institute Press, Philadelphia, PA.
2. Diniz, E.V., (1980) Porous Pavement: Phase I, Design and Operational Criteria. Report EPA-600/2-80-135. Environmental Protection Agency.
3. Gemayel, C.A., and Mamlouk, M.S., (1988) Characterization of Hot-Mixed Open Graded Asphalt Mixtures. Transportation Research Record 1171, pp. 184-192.
4. Hicks, R.G., Gatch, D.R., Williamson, R., and Steward, J., (1979) Open-graded Emulsion Mixes for Use as Road Surfaces. Transportation Research Record 702, TRB, National Research Council, Washington D.C., pp. 64-72.
5. Majidzadeh, K. and Elmitiny, R., (1981) Development and Implementation of Pavement Drainage Design Guideline in Ohio. Report FHWA/OH-81/007. Ohio Department of Transportation, Columbus.
6. Qi, X. and Sebaaly P.E., (1995) Evaluation of Polymer- Modified Asphalt Concrete Mixtures, Journal of Materials in Civil Engineering, pp. 117-124.
7. Isenring, T., Harald, K., and Scazziga, I., (1990) Experience with Porous Asphalt in Switzerland, Transportation Research Record 1265, pp. 41-53.
8. Heystraeten, G.V. and Moraux, C., (1990) Ten Years Experience of Porous Asphalts in Belgium, Transportation Research Record 1265, pp. 34-40.
9. Kandhal, P.S. and Mallick, R.B., (1998) Open Graded Friction Course: State of the Practice, NCAT Report, No. 98-7.
10. Mallick, R. B., Kandhal, P. S., Cooley, L. A. and Watson, D. E., (2000) Design, Construction, and Performance of New-Generation Open-graded Friction Course, NCAT Report, No. 2000-01.
11. Mallick, R. B., Cooley, L. A., Teto, M. R., and Bradbury, R. L. (2001) An Evaluation of Factors Affecting Permeability of Superpave Designed Pavements, 80th TRB MeetingWashington D.C. Paper No. 01-2763
12. Bolzan, P.E., Nicholls, J.C., and Nuber, G.A., (2001) Searching for Superior Performing Porous Asphalt Wearing Courses, Proc. 80th TRB Meeting, Washington D.C.
13. Kanitpong, K., Benson, C. H. and Bahia, H. U., (2001) Hydraulic Conductivity (Permeability) of Laboratory Compacted Asphalt mixtures, Proc. 80th TRB Meeting, Washington, D.C.

33
14. Maupin, G. W., (2001) Asphalt Permeability Testing: Specimen Preparation and Testing Variability, Proc. 80th TRB Meeting, Washington, D.C.
15. Smith, R.W., Rice, J.M. and Spelman, S.R., (1974) Design of Open-Graded Asphalt Friction Courses. Report No.FHWA-RD-74-2, Federal Highway Administration.
16. Roberts, F.L., Kandhal, P.S., Brown, E.R., Lee, D. and Kennedy, T.W., (1996) Hot Mix Asphalt Materials, Mixture Design and Construction, NAPA Education Foundation, Lanlum, Maryland.
17. Hall, K.D., and Ng, H.G., (2001) Development of a Void Pathway Test for Investigating Void Interconnectivity in Compacted Hot-Mix Asphalt Concrete, Proc. 80th TRB Meeting, Washington D.C.
18. Dhalaan, M.A., (1982) Characterization and Design of Recycled Asphalt Concrete Mixtures Using Indirect Tensile Test Methods, Ph.D. Thesis, University of Texas, Austin.
34
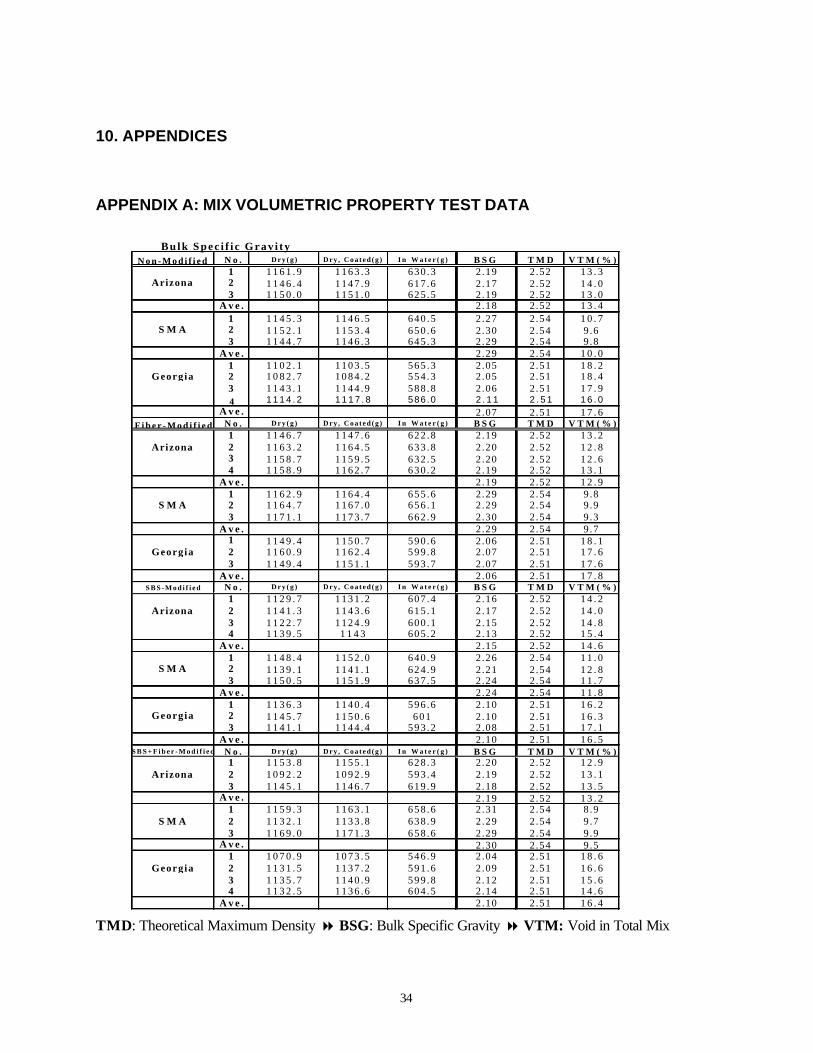
10. APPENDICES
APPENDIX A: MIX VOLUMETRIC PROPERTY TEST DATA
TMD: Theoretical Maximum Density 8 BSG: Bulk Specific Gravity 8 VTM: Void in Total Mix
B u l k S p e c i f i c G r a v i t yN o n - M o d i f i e d N o . D r y ( g ) D r y , C o a t e d ( g ) I n W a t e r ( g ) B S G T M D V T M ( % )
1 1 1 6 1 . 9 1 1 6 3 . 3 630 .3 2.19 2.52 1 3 . 3Arizona 2 1 1 4 6 . 4 1 1 4 7 . 9 617 .6 2.17 2.52 1 4 . 0
3 1 1 5 0 . 0 1 1 5 1 . 0 625 .5 2.19 2.52 1 3 . 0A v e . 2.18 2.52 1 3 . 4
1 1 1 4 5 . 3 1 1 4 6 . 5 640 .5 2.27 2.54 1 0 . 7S M A 2 1 1 5 2 . 1 1 1 5 3 . 4 650 .6 2.30 2.54 9.6
3 1 1 4 4 . 7 1 1 4 6 . 3 645 .3 2.29 2.54 9.8A v e . 2.29 2.54 1 0 . 0
1 1 1 0 2 . 1 1 1 0 3 . 5 565 .3 2.05 2.51 1 8 . 2Georgia 2 1 0 8 2 . 7 1 0 8 4 . 2 554 .3 2.05 2.51 1 8 . 4
3 1 1 4 3 . 1 1 1 4 4 . 9 588 .8 2.06 2.51 1 7 . 94 1 1 1 4 . 2 1 1 1 7 . 8 586.0 2 . 1 1 2 . 5 1 1 6 . 0
A v e . 2.07 2.51 1 7 . 6F i b e r - M o d i f i e d N o . D r y ( g ) D r y , C o a t e d ( g ) I n W a t e r ( g ) B S G T M D V T M ( % )
1 1 1 4 6 . 7 1 1 4 7 . 6 622 .8 2.19 2.52 1 3 . 2Arizona 2 1 1 6 3 . 2 1 1 6 4 . 5 633 .8 2.20 2.52 1 2 . 8
3 1 1 5 8 . 7 1 1 5 9 . 5 632 .5 2.20 2.52 1 2 . 64 1 1 5 8 . 9 1 1 6 2 . 7 630 .2 2.19 2.52 1 3 . 1
A v e . 2.19 2.52 1 2 . 91 1 1 6 2 . 9 1 1 6 4 . 4 655 .6 2.29 2.54 9.8
S M A 2 1 1 6 4 . 7 1 1 6 7 . 0 656 .1 2.29 2.54 9.93 1 1 7 1 . 1 1 1 7 3 . 7 662 .9 2.30 2.54 9.3
A v e . 2.29 2.54 9.71 1 1 4 9 . 4 1 1 5 0 . 7 590 .6 2.06 2.51 1 8 . 1
Georgia 2 1 1 6 0 . 9 1 1 6 2 . 4 599 .8 2.07 2.51 1 7 . 63 1 1 4 9 . 4 1 1 5 1 . 1 593 .7 2.07 2.51 1 7 . 6
A v e . 2.06 2.51 1 7 . 8S B S - M o d i f i e d N o . D r y ( g ) D r y , C o a t e d ( g ) I n W a t e r ( g ) B S G T M D V T M ( % )
1 1 1 2 9 . 7 1 1 3 1 . 2 607 .4 2.16 2.52 1 4 . 2Arizona 2 1 1 4 1 . 3 1 1 4 3 . 6 615 .1 2.17 2.52 1 4 . 0
3 1 1 2 2 . 7 1 1 2 4 . 9 600 .1 2.15 2.52 1 4 . 84 1 1 3 9 . 5 1 1 4 3 605 .2 2.13 2.52 1 5 . 4
A v e . 2.15 2.52 1 4 . 61 1 1 4 8 . 4 1 1 5 2 . 0 640 .9 2.26 2.54 1 1 . 0
S M A 2 1 1 3 9 . 1 1 1 4 1 . 1 624 .9 2.21 2.54 1 2 . 83 1 1 5 0 . 5 1 1 5 1 . 9 637 .5 2.24 2.54 1 1 . 7
A v e . 2.24 2.54 1 1 . 81 1 1 3 6 . 3 1 1 4 0 . 4 596 .6 2.10 2.51 1 6 . 2
Georgia 2 1 1 4 5 . 7 1 1 5 0 . 6 601 2.10 2.51 1 6 . 33 1 1 4 1 . 1 1 1 4 4 . 4 593 .2 2.08 2.51 1 7 . 1
A v e . 2.10 2.51 1 6 . 5S B S + F i b e r - M o d i f i e d N o . D r y ( g ) D r y , C o a t e d ( g ) I n W a t e r ( g ) B S G T M D V T M ( % )
1 1 1 5 3 . 8 1 1 5 5 . 1 628 .3 2.20 2.52 1 2 . 9Arizona 2 1 0 9 2 . 2 1 0 9 2 . 9 593 .4 2.19 2.52 1 3 . 1
3 1 1 4 5 . 1 1 1 4 6 . 7 619 .9 2.18 2.52 1 3 . 5A v e . 2.19 2.52 1 3 . 2
1 1 1 5 9 . 3 1 1 6 3 . 1 658 .6 2.31 2.54 8.9S M A 2 1 1 3 2 . 1 1 1 3 3 . 8 638 .9 2.29 2.54 9.7
3 1 1 6 9 . 0 1 1 7 1 . 3 658 .6 2.29 2.54 9.9A v e . 2.30 2.54 9.5
1 1 0 7 0 . 9 1 0 7 3 . 5 546 .9 2.04 2.51 1 8 . 6Georgia 2 1 1 3 1 . 5 1 1 3 7 . 2 591 .6 2.09 2.51 1 6 . 6
3 1 1 3 5 . 7 1 1 4 0 . 9 599 .8 2.12 2.51 1 5 . 64 1 1 3 2 . 5 1 1 3 6 . 6 604 .5 2.14 2.51 1 4 . 6
A v e . 2.10 2.51 1 6 . 4
35
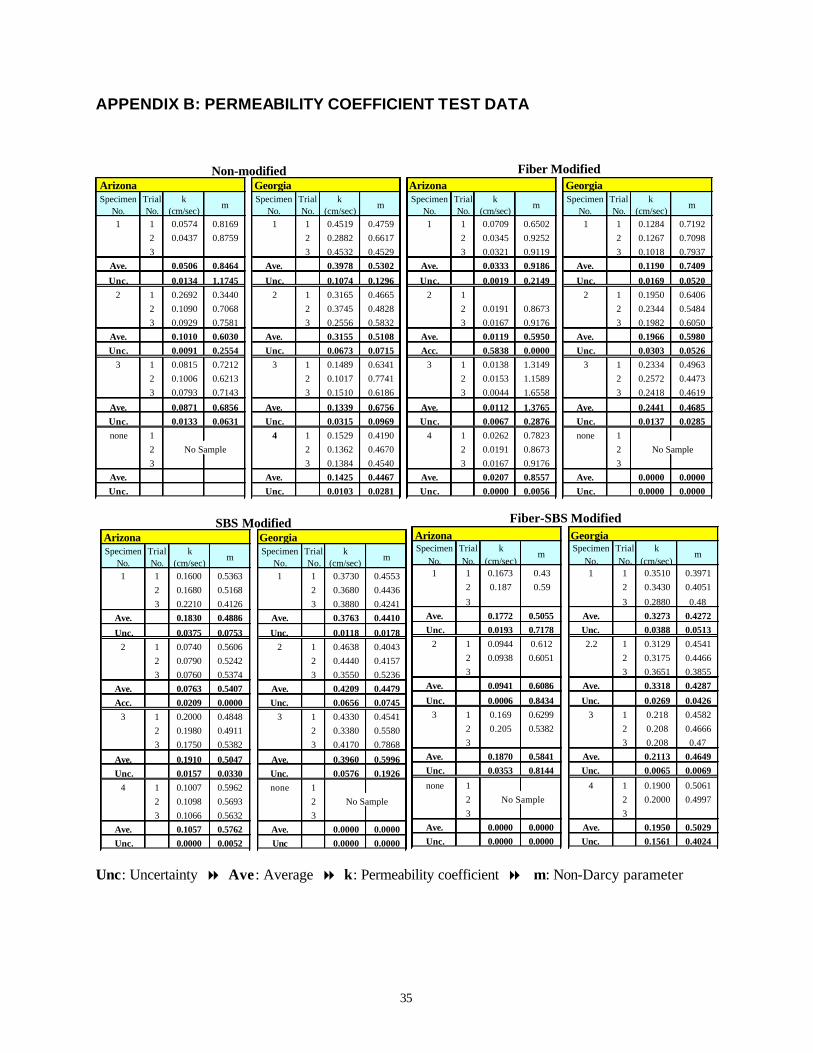
APPENDIX B: PERMEABILITY COEFFICIENT TEST DATA
Unc: Uncertainty 8 Ave : Average 8 k: Permeability coefficient 8 m: Non-Darcy parameter
Non-modifiedArizona GeorgiaSpecimen
No.Trial No.
k(cm/sec)
mSpecimen
No.Trial No.
k(cm/sec)
m
1 1 0.0574 0.8169 1 1 0.4519 0.47592 0.0437 0.8759 2 0.2882 0.66173 3 0.4532 0.4529
Ave. 0.0506 0.8464 Ave. 0.3978 0.5302
Unc. 0.0134 1.1745 Unc. 0.1074 0.12962 1 0.2692 0.3440 2 1 0.3165 0.4665
2 0.1090 0.7068 2 0.3745 0.48283 0.0929 0.7581 3 0.2556 0.5832
Ave. 0.1010 0.6030 Ave. 0.3155 0.5108Unc. 0.0091 0.2554 Unc. 0.0673 0.0715
3 1 0.0815 0.7212 3 1 0.1489 0.63412 0.1006 0.6213 2 0.1017 0.77413 0.0793 0.7143 3 0.1510 0.6186
Ave. 0.0871 0.6856 Ave. 0.1339 0.6756Unc. 0.0133 0.0631 Unc. 0.0315 0.0969none 1 4 1 0.1529 0.4190
2 No Sample 2 0.1362 0.46703 3 0.1384 0.4540
Ave. Ave. 0.1425 0.4467Unc. Unc. 0.0103 0.0281
Fiber ModifiedArizona GeorgiaSpecimen
No.Trial No.
k(cm/sec)
mSpecimen
No.Trial No.
k(cm/sec)
m
1 1 0.0709 0.6502 1 1 0.1284 0.71922 0.0345 0.9252 2 0.1267 0.70983 0.0321 0.9119 3 0.1018 0.7937
Ave. 0.0333 0.9186 Ave. 0.1190 0.7409
Unc. 0.0019 0.2149 Unc. 0.0169 0.05202 1 2 1 0.1950 0.6406
2 0.0191 0.8673 2 0.2344 0.54843 0.0167 0.9176 3 0.1982 0.6050
Ave. 0.0119 0.5950 Ave. 0.1966 0.5980Acc. 0.5838 0.0000 Unc. 0.0303 0.0526
3 1 0.0138 1.3149 3 1 0.2334 0.49632 0.0153 1.1589 2 0.2572 0.44733 0.0044 1.6558 3 0.2418 0.4619
Ave. 0.0112 1.3765 Ave. 0.2441 0.4685Unc. 0.0067 0.2876 Unc. 0.0137 0.0285
4 1 0.0262 0.7823 none 12 0.0191 0.8673 2 No Sample3 0.0167 0.9176 3
Ave. 0.0207 0.8557 Ave. 0.0000 0.0000Unc. 0.0000 0.0056 Unc. 0.0000 0.0000
SBS ModifiedArizona GeorgiaSpecimen
No.Trial No.
k(cm/sec)
mSpecimen
No.Trial No.
k(cm/sec)
m
1 1 0.1600 0.5363 1 1 0.3730 0.45532 0.1680 0.5168 2 0.3680 0.44363 0.2210 0.4126 3 0.3880 0.4241
Ave. 0.1830 0.4886 Ave. 0.3763 0.4410
Unc. 0.0375 0.0753 Unc. 0.0118 0.01782 1 0.0740 0.5606 2 1 0.4638 0.4043
2 0.0790 0.5242 2 0.4440 0.41573 0.0760 0.5374 3 0.3550 0.5236
Ave. 0.0763 0.5407 Ave. 0.4209 0.4479Acc. 0.0209 0.0000 Unc. 0.0656 0.0745
3 1 0.2000 0.4848 3 1 0.4330 0.45412 0.1980 0.4911 2 0.3380 0.55803 0.1750 0.5382 3 0.4170 0.7868
Ave. 0.1910 0.5047 Ave. 0.3960 0.5996Unc. 0.0157 0.0330 Unc. 0.0576 0.1926
4 1 0.1007 0.5962 none 12 0.1098 0.5693 2 No Sample3 0.1066 0.5632 3
Ave. 0.1057 0.5762 Ave. 0.0000 0.0000Unc. 0.0000 0.0052 Unc 0.0000 0.0000
Fiber-SBS ModifiedArizona GeorgiaSpecimen
No.Trial No.
k(cm/sec)
mSpecimen
No.Trial No.
k(cm/sec)
m
1 1 0.1673 0.43 1 1 0.3510 0.39712 0.187 0.59 2 0.3430 0.4051
3 3 0.2880 0.48Ave. 0.1772 0.5055 Ave. 0.3273 0.4272Unc. 0.0193 0.7178 Unc. 0.0388 0.0513
2 1 0.0944 0.612 2.2 1 0.3129 0.45412 0.0938 0.6051 2 0.3175 0.44663 3 0.3651 0.3855
Ave. 0.0941 0.6086 Ave. 0.3318 0.4287
Unc. 0.0006 0.8434 Unc. 0.0269 0.04263 1 0.169 0.6299 3 1 0.218 0.4582
2 0.205 0.5382 2 0.208 0.46663 3 0.208 0.47
Ave. 0.1870 0.5841 Ave. 0.2113 0.4649Unc. 0.0353 0.8144 Unc. 0.0065 0.0069
none 1 4 1 0.1900 0.50612 No Sample 2 0.2000 0.49973 3
Ave. 0.0000 0.0000 Ave. 0.1950 0.5029Unc. 0.0000 0.0000 Unc. 0.1561 0.4024
36
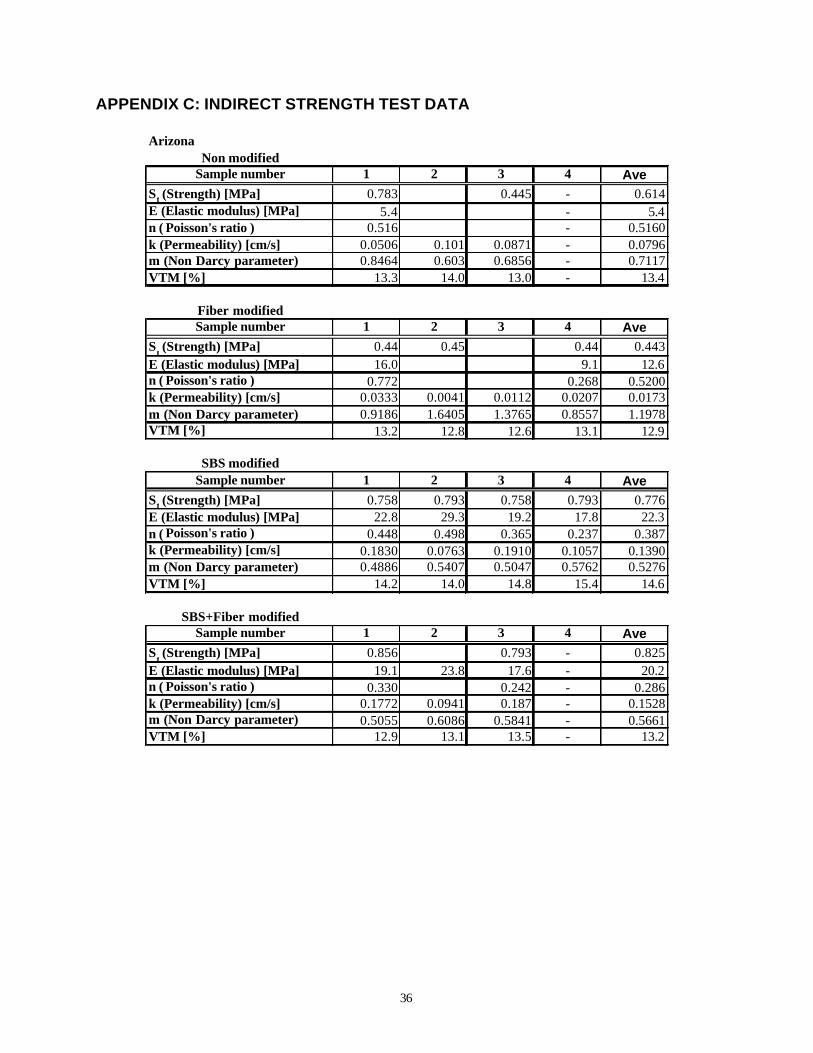
APPENDIX C: INDIRECT STRENGTH TEST DATA
Arizona Non modified
Sample number 1 2 3 4 AveSt (Strength) [MPa] 0.783 0.445 - 0.614E (Elastic modulus) [MPa] 5.4 - 5.4ν ( Poisson's ratio ) 0.516 - 0.5160k (Permeability) [cm/s] 0.0506 0.101 0.0871 - 0.0796m (Non Darcy parameter) 0.8464 0.603 0.6856 - 0.7117VTM [%] 13.3 14.0 13.0 - 13.4
Fiber modifiedSample number 1 2 3 4 Ave
St (Strength) [MPa] 0.44 0.45 0.44 0.443E (Elastic modulus) [MPa] 16.0 9.1 12.6ν ( Poisson's ratio ) 0.772 0.268 0.5200k (Permeability) [cm/s] 0.0333 0.0041 0.0112 0.0207 0.0173m (Non Darcy parameter) 0.9186 1.6405 1.3765 0.8557 1.1978VTM [%] 13.2 12.8 12.6 13.1 12.9
SBS modifiedSample number 1 2 3 4 Ave
St (Strength) [MPa] 0.758 0.793 0.758 0.793 0.776E (Elastic modulus) [MPa] 22.8 29.3 19.2 17.8 22.3ν ( Poisson's ratio ) 0.448 0.498 0.365 0.237 0.387k (Permeability) [cm/s] 0.1830 0.0763 0.1910 0.1057 0.1390m (Non Darcy parameter) 0.4886 0.5407 0.5047 0.5762 0.5276VTM [%] 14.2 14.0 14.8 15.4 14.6
SBS+Fiber modifiedSample number 1 2 3 4 Ave
St (Strength) [MPa] 0.856 0.793 - 0.825E (Elastic modulus) [MPa] 19.1 23.8 17.6 - 20.2ν ( Poisson's ratio ) 0.330 0.242 - 0.286k (Permeability) [cm/s] 0.1772 0.0941 0.187 - 0.1528m (Non Darcy parameter) 0.5055 0.6086 0.5841 - 0.5661VTM [%] 12.9 13.1 13.5 - 13.2
37
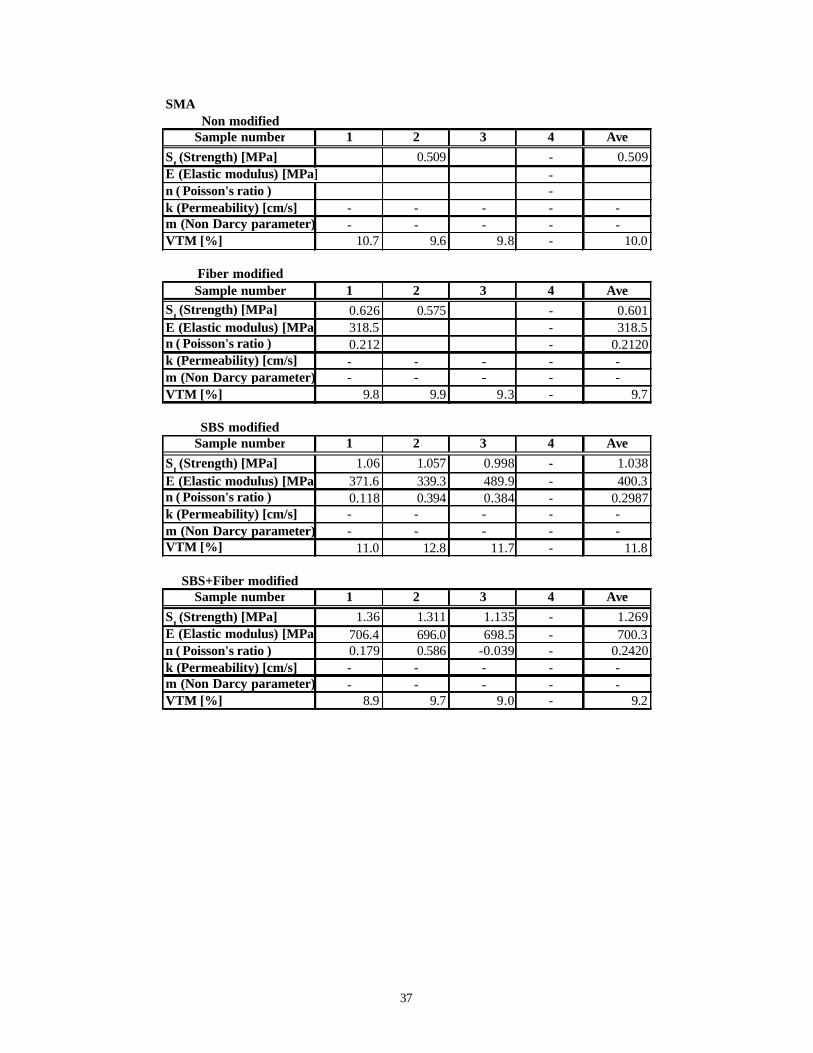
SMA Non modified
Sample number 1 2 3 4 AveSt (Strength) [MPa] 0.509 - 0.509E (Elastic modulus) [MPa] -ν ( Poisson's ratio ) -k (Permeability) [cm/s] - - - - -m (Non Darcy parameter) - - - - -VTM [%] 10.7 9.6 9.8 - 10.0
Fiber modifiedSample number 1 2 3 4 Ave
St (Strength) [MPa] 0.626 0.575 - 0.601E (Elastic modulus) [MPa] 318.5 - 318.5ν ( Poisson's ratio ) 0.212 - 0.2120k (Permeability) [cm/s] - - - - -m (Non Darcy parameter) - - - - -VTM [%] 9.8 9.9 9.3 - 9.7
SBS modifiedSample number 1 2 3 4 Ave
St (Strength) [MPa] 1.06 1.057 0.998 - 1.038E (Elastic modulus) [MPa] 371.6 339.3 489.9 - 400.3ν ( Poisson's ratio ) 0.118 0.394 0.384 - 0.2987k (Permeability) [cm/s] - - - - -m (Non Darcy parameter) - - - - -VTM [%] 11.0 12.8 11.7 - 11.8
SBS+Fiber modifiedSample number 1 2 3 4 Ave
St (Strength) [MPa] 1.36 1.311 1.135 - 1.269E (Elastic modulus) [MPa] 706.4 696.0 698.5 - 700.3ν ( Poisson's ratio ) 0.179 0.586 -0.039 - 0.2420k (Permeability) [cm/s] - - - - -m (Non Darcy parameter) - - - - -VTM [%] 8.9 9.7 9.0 - 9.2
38
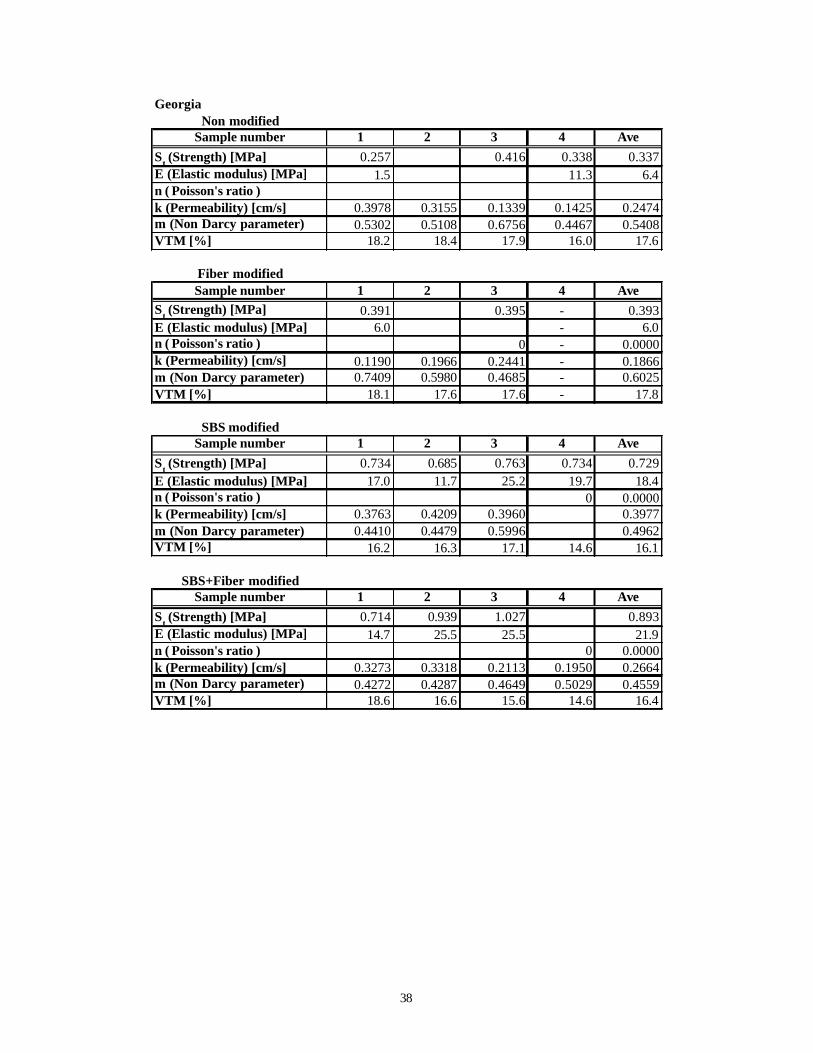
Georgia Non modified
Sample number 1 2 3 4 AveSt (Strength) [MPa] 0.257 0.416 0.338 0.337E (Elastic modulus) [MPa] 1.5 11.3 6.4ν ( Poisson's ratio )k (Permeability) [cm/s] 0.3978 0.3155 0.1339 0.1425 0.2474m (Non Darcy parameter) 0.5302 0.5108 0.6756 0.4467 0.5408VTM [%] 18.2 18.4 17.9 16.0 17.6
Fiber modifiedSample number 1 2 3 4 Ave
St (Strength) [MPa] 0.391 0.395 - 0.393E (Elastic modulus) [MPa] 6.0 - 6.0ν ( Poisson's ratio ) 0 - 0.0000k (Permeability) [cm/s] 0.1190 0.1966 0.2441 - 0.1866m (Non Darcy parameter) 0.7409 0.5980 0.4685 - 0.6025VTM [%] 18.1 17.6 17.6 - 17.8
SBS modifiedSample number 1 2 3 4 Ave
St (Strength) [MPa] 0.734 0.685 0.763 0.734 0.729E (Elastic modulus) [MPa] 17.0 11.7 25.2 19.7 18.4ν ( Poisson's ratio ) 0 0.0000k (Permeability) [cm/s] 0.3763 0.4209 0.3960 0.3977m (Non Darcy parameter) 0.4410 0.4479 0.5996 0.4962VTM [%] 16.2 16.3 17.1 14.6 16.1
SBS+Fiber modifiedSample number 1 2 3 4 Ave
St (Strength) [MPa] 0.714 0.939 1.027 0.893E (Elastic modulus) [MPa] 14.7 25.5 25.5 21.9ν ( Poisson's ratio ) 0 0.0000k (Permeability) [cm/s] 0.3273 0.3318 0.2113 0.1950 0.2664m (Non Darcy parameter) 0.4272 0.4287 0.4649 0.5029 0.4559VTM [%] 18.6 16.6 15.6 14.6 16.4