Embed Size (px)
Citation preview

health.wa.gov.au
Performance Management Policy 2016-2017 (Formerly known as the annual Performance Management Framework)
Supers
eded
by: M
P 0055
/17
01 Ju
ly 20
17

ii Performance Management Policy 2016-17
© Department of Health, State of Western Australia (2016). Copyright to this material is vested in the State of Western Australia unless otherwise indicated. Apart from any fair dealing for the purposes of private study, research, criticism or review, as permitted under the provisions of the Copyright Act 1968, no part may be reproduced or re-used for any purposes whatsoever without written permission of the State of Western Australia. Important Disclaimer: All information and content in this Material is provided in good faith by the WA Department of Health, and is based on sources believed to be reliable and accurate at the time of development. The State of Western Australia, the WA Department of Health and their respective officers, employees and agents, do not accept legal liability or responsibility for the Material, or any consequences arising from its use. Owner: Department of Health, Western Australia
Contact: Performance Directorate
Approved by: Director General
Approval Date: 1 June 2016
Current Version: 4.5
Mandatory Policy Number:
MP 0037/16
http://www.health.wa.gov.au/circularsnew/circular.cfm?Circ_ID=13344
Links to: Performance Policy Framework
http://ww2.health.wa.gov.au/Our-performance/
Version Date Author Comments
4.0 1 June 2016 Anthony Jones & Jake Nelson Endorsed by the Director General
4.1 9 June 2016 Anthony Jones Updated to reflect minor changes to Schedule 1.
4.2 8 August 2016 Anthony Jones Updated to include Mandatory Policy Number.
4.3 8 November 2016
Anthony Jones Updated Schedule 1 to reflect suspended performance indicators.
4.4 12 December 2016
Anthony Jones Updated Schedule 1 to reflect the 2017 hand hygiene target and the new elective services indicators.
4.5 13 February 2016
Anthony Jones Schedules 2 and 3 included. Updated Schedule 1 to include P4-2 and update P4-1 target.
Supers
eded
by: M
P 0055
/17
01 Ju
ly 20
17
iii Performance Management Policy 2016-17
Contents Contents .................................................................................................................................... iii Acronyms ................................................................................................................................... v
Context ....................................................................................................................................... vi 1 Introduction ......................................................................................................................... 1
1.1 Aim, Purpose and Scope ................................................................................................ 1
1.2 PMP Strategic Directions ................................................................................................ 2
2 Policy Drivers ...................................................................................................................... 5
2.1 WA Health Strategic Intent 2015-2020 ............................................................................ 5
2.2 WA Health Reform Program 2015-2020 ......................................................................... 5
2.3 State Government Goal .................................................................................................. 6
2.4 National Health Reform ................................................................................................... 6
2.5 Mental Health Commission ............................................................................................. 6
2.6 Public Health ................................................................................................................... 7
2.7 WA Aboriginal Health and Wellbeing Framework 2015–2030 ........................................ 7
2.8 Clinical Governance and Safety and Quality ................................................................... 8
3 Elements of the PMP ........................................................................................................ 10
3.1 Service Agreements ...................................................................................................... 10
4 Governance Arrangements .............................................................................................. 12
4.1 Role, Functions and Powers of the Director General .................................................... 13
4.2 Role, Functions and Powers of Health Service Providers ............................................. 13
5 Performance Reporting, Monitoring and Evaluation ..................................................... 15
5.1 Performance Reporting ................................................................................................. 15
5.2 Performance Indicator Targets ..................................................................................... 15
5.3 Performance Indicator Thresholds ................................................................................ 16
5.4 Performance Monitoring and Evaluation ....................................................................... 16
6 Performance Management ............................................................................................... 17
6.1 Components of Performance Management .................................................................. 17
6.2 Intervention Model ........................................................................................................ 17
6.3 Actions arising from Performance Assessments ........................................................... 18
Schedule 1 Health Service Performance Report (HSPR) 2016-17: Performance Indicator Targets, Target Source, and Thresholds ............................................................................... 23
Schedule 2 Health Support Services Performance Report (HSSPR) 2016-17: Performance Indicator Targets, Target Source, and Thresholds ............................................................... 37
Schedule 3 Interim Quadriplegic Centre Performance Report (QCPR) 2016-17: Performance Indicator Targets, Target Source, and Thresholds ........................................ 39
Appendix A ............................................................................................................................... 40
Supers
eded
by: M
P 0055
/17
01 Ju
ly 20
17
iv Performance Management Policy 2016-17
Principles of Performance Management Processes within the PMP ...................................... 40
Glossary .................................................................................................................................... 41
References ................................................................................................................................ 44
Supers
eded
by: M
P 0055
/17
01 Ju
ly 20
17

v Performance Management Policy 2016-17
Acronyms ABF/M Activity-Based Funding/Management
CAHS Child and Adolescent Health Service
CE Chief Executive
DEC Department Executive Committee
EMHS East Metropolitan Health Service
HSPR Health Service Performance Report
HSSPR Health Support Services Performance Report
ICT Information Communication and Technology
LARU Licensing and Accreditation Regulatory Unit
MHC Mental Health Commission
NHRA National Health Reform Agreement
NMHS North Metropolitan Health Service
PMF Performance Management Framework
PMP Performance Management Policy
QCPR Quadriplegic Centre Performance Report
SA Service Agreement
SMHS South Metropolitan Health Service
WACHS WA Country Health Service
YTD Year to Date
Supers
eded
by: M
P 0055
/17
01 Ju
ly 20
17

vi Performance Management Policy 2016-17
Context WA Health’s vision is clear – to deliver a safe, high quality sustainable health system. New legislation, the Health Services Act 2016, mandates that the Director General of the Department of Health is the System Manager and Health Service Providers (North Metropolitan, South Metropolitan, WA Country, Child and Adolescent, and East Metropolitan Health Services) be established as separate board-governed statutory authorities legally accountable for the delivery of hospital and health services for their local communities. The Act also establishes Health Support Services (HSS) as a Chief Executive-governed Health Service Provider statutory authority, which is accountable for the delivery of support services.
The devolved governance model introduced as a part of the WA Health Reform Program 2015-2020 aims to improve the integration and sustainability of the WA health system by empowering Health Service Providers to be more responsive to the health needs of their local communities. The WA Health Reform Program 2015-2020 importantly, is an integrated suite of work aligned to the critical enablers identified in the WA Health Strategic Intent 2015-20. As detailed in the Strategic Intent, our strategic priorities continue to focus and emphasise a continuum of care.
Furthermore, with the introduction of new legislation, binding systemwide policy frameworks provide the Director General of the Department of Health with a mechanism to manage the system at a strategic level. Policy frameworks replace Operational Directives (OD) and Information Circulars (IC). These Policy Frameworks are legal instruments within the Health Services Act 2016 and reflect the strategic role of the System Manger.
The Performance Management Policy 2016-17 (PMP) is supported by the newly introduced Performance Policy Framework. The PMP was formerly known as the Performance Management Framework (PMF) and has been renamed in a bid to minimise confusion with the introduction of the overarching WA health system Policy Frameworks. Consequently, the PMP reflects these changes and provides an opportunity to better drive performance through a greater focus on monitoring and analysing performance, incentivising good performance and addressing poor performance through tiered intervention and support, where required. Effective performance management is a continual process of reviewing, observing and communicating with staff and key stakeholders to provide constructive and actionable feedback about their performance.
The PMP is the WA health system’s performance management component of the Service Agreement between the Department of Health, led by the Director General as the System Manager and each Health Service Provider. Performance indicators outlined in the PMP support, guide and track progress - providing feedback to Health Service Providers to inform and improve health service delivery, and promote accountability and transparency.
The monthly performance reporting components of the PMP provide targeted and timely information and analysis, and show overall Health Service Provider performance against targets and thresholds. When there are performance concerns, effective performance management puts in place agreed strategies to address these concerns and to improve performance to required standards.
The PMP, based on a performance management cycle has matured, since its introduction in 2010-11, to become a systemwide performance management policy framework, unified with and strengthened by State and National health reform agendas and other key policy drivers. Many elements underpin the delivery of essential health services and though not always visible, are vital to our WA health system performance.
Supers
eded
by: M
P 0055
/17
01 Ju
ly 20
17
1 Performance Management Policy 2016-17
1 Introduction The Performance Management Policy (PMP) 2016-17 takes into account the new devolved governance model, the result of new legislation, the Health Services Act 2016, introduced on 1 July 2016. The changes to the governance of the WA health system enable greater accountability and decision-making closer to service delivery and patient care. Benefits for our patients, workforce and the community include improved accountability and transparency, more responsive, flexible and innovative health services, greater assurance of safety and quality of health services, and a more sustainable health system.
The Department of Health, led by the Director General as the System Manager, monitors and assesses the performance of the WA health system, mandated by the PMP and the binding policy frameworks. Based on a performance management cycle, the PMP comprises performance reporting, performance monitoring and evaluation, and performance management. Designed specifically for such purposes, the PMP promotes a systematic, coordinated and integrated performance management for the WA health system. The PMP ensures:
• clear accountabilities, interventions and escalation plans including mechanisms for remediation when performance does not meet expected standards
• the annual PMP aligns with Service Agreements, Performance Agreements, the Operational Plan and Strategic Intent
• performance reporting is available to support performance management requirements
• the use of a common toolset and business rules to support consistent results in performance monitoring
• the skilled workforce understands the data and analysis with a strong focus on performance
• the oversight, monitoring and promotion of improvements in the safety and quality of health services.
1.1 Aim, Purpose and Scope The PMP is informed by the WA Health Strategic Intent 2015-20, the National Health Reform Agenda, and the WA Health Reform Program and other key policy drivers. The PMP aims to support WA Health’s vision to deliver a safe, high quality, sustainable health system for all Western Australians.
The PMP provides the WA health system with a common set of performance objectives across the WA health system. All the performance indicators in the PMP 2016-17 are aligned to the four priorities and seven enablers detailed in the WA Health Strategic Intent 2015-20. Each performance indicator is an integral part of WA health system’s performance management cycle. The performance indicators and targets that form the PMP are listed in Schedules 1, 2 and 3. The PMP provides the WA health system with a transparent reporting, monitoring, evaluation and intervention framework to drive improvement and achieve better outcomes.
The PMP enables Health Service Providers within the WA health system to address the challenges facing health services and at the same time identify performance improvement
Supers
eded
by: M
P 0055
/17
01 Ju
ly 20
17

2 Performance Management Policy 2016-17
opportunities. Moreover, the PMP helps facilitate a cultural transformation within the health system that empowers not only leadership teams but also every member of staff to work collaboratively towards achieving better value healthcare for all Western Australians.
Figure 1 describes the fundamental principles that underpin the performance management process and contribution to the realisation of the aim of the PMP. Appendix A shows how the principles align to the key PMP attributes.
Figure 1: Principles of Performance Management Processes
Transparency Clear and agreed performance targets and thresholds and well-defined intervention processes to address poor performance.
Accountability Clearly defined roles and responsibilities to deliver health services at agreed standards and volumes.
Recognition Recognition and reward for performance that is sustained and outstanding.
Consistency Consistency with National and State health service delivery objectives, priorities and outcomes.
Integration A balanced approach that has clear linkages to clinical planning, budget, activity, and safety and quality priorities.
Service improvement focus
A strong focus on mechanisms to enhance service delivery and health care outcomes.
Escalation process Well-defined escalation processes and recovery pathways for performance concerns.
1.2 PMP Strategic Directions The Performance Management Strategic Directions 2014-15 and Beyond Consultation Framework recommended strategic directions for future Performance Management Policies. The six key strategic directions endorsed were:
• consolidate State and National based policy alignments
• enhance performance measurements
• expand public disclosure of performance
• improve performance reporting
• strengthen performance management
• foster workforce engagement.
Accordingly, the PMP 2016-17 aligns closely to State and National strategic priorities. Furthermore, the WA Health Funding Policy and Guidelines 2016-17 informs stakeholders how governing policy frameworks and service delivery planning influence WA Health budget settings and funding allocations for 2016-17. These guidelines act also as a reference tool and underpin the Service Agreements signed between the Director General as the System Manager and each Health Service Provider at the beginning of the financial year.
Supers
eded
by: M
P 0055
/17
01 Ju
ly 20
17

3 Performance Management Policy 2016-17
The PMP 2016-17 is strategically linked to the Service Agreements. The performance management component of the Service Agreements is undertaken as prescribed in the PMP 2016-17. The PMP 2016-17 is the key policy within the Performance Policy Framework and includes the performance management and intervention processes as well as the performance reporting, monitoring and evaluation processes. The performance indicators, targets and thresholds which support the delivery of the Service Agreement operational targets are also listed in the PMP 2016-17 as a part of the Health Service Performance Report 2016-17 (Schedule 1), the Interim Quadriplegic Centre Performance Report 2016-7 (Schedule 2) and the Interim Health Support Services Performance Report 2016-17 (Schedule 3). The Health Service Provider Chief Executive (CE) Performance Agreements are also aligned to the Performance Management Policy and the performance indicators and targets within the policy. Figure 2 provides a schematic representation of the strategic linkages of the Service Agreement and the CE Performance Agreements to the key elements of the Performance Policy Framework, which includes the PMP 2016-17.
Figure 2: Performance Policy Framework Strategic Linkages
Beyond the first year implementation of the Health Services Act 2016, it is imperative that the ongoing appropriateness and effectiveness of the performance indicators, targets and thresholds in the PMP continue to be evaluated and reviewed. This will ensure the continued relevance of the performance standards in the delivery of the Service Agreement operational targets and the effectiveness of the Chief Executive Performance Agreements to achieve key priorities.
Health Service Provider Service Agreements (Established in accordance with Part 5 of the Health Services Act 2016)
Performance Policy Framework (Established in accordance with Sections 26 and 27 of the Health Services Act 2016)
Performance Management Policy (A mandatory policy which includes intervention processes)
Performance Monitoring, Reporting and Evaluation (Includes performance indicators, targets & thresholds)
Health Service Performance
Report
Interim Quadriplegic Centre Performance
Report
Interim Health Support Services
Performance Report
Health Service Provider Chief Executive Performance Agreements (Established in accordance with Section 114 of the Health Services Act 2016)
Supers
eded
by: M
P 0055
/17
01 Ju
ly 20
17

4 Performance Management Policy 2016-17
Although the Department of Health is the System Manager, it is also critically important that the System Manager is accountable and responsive to the Health Service Providers.
To enable greater understanding of the PMP 2016-17, reading other Department of Health documents will assist, including:
• Report on Consultation Draft Performance Management Policy 2016-17
• Performance Management Strategic Directions 2014-15 and Beyond Consultation Framework
• The Role of Analysis within the Performance Management Framework
• Workforce Engagement within a Performance Management Framework Setting
• Leadership within a Performance Management Framework Setting
• Health Service Performance Report 2015-16 Methodology and Process
• Annual Performance Management Policy- Outcome Statements for HSPR Performance Indicators 2016-17
• Data Quality Statements
• Indicator Data Definitions
• Developing Performance Indicators – Information Package
• WA Health Strategic Intent 2015-2020
• WA Health Reform 2015-2020
• WA Health Funding and Purchasing Policy Guidelines 2016-17.
All published performance-related documents are available from the Performance Directorate intranet: http://intranet.health.wa.gov.au/performance/home/ and the Department of Health’s internet: http://ww2.health.wa.gov.au/Our-performance.
Supers
eded
by: M
P 0055
/17
01 Ju
ly 20
17

5 Performance Management Policy 2016-17
2 Policy Drivers Aligned to the WA Health Strategic Intent 2015-20, the PMP 2016-17 is consistent with the WA health system’s strategic priorities and policy frameworks. The PMP also takes into account other relevant WA Government policies and priorities, and intergovernmental healthcare agreements between the State and Commonwealth Governments.
Figure 3 shows the position of the PMP within the policy cycle and the linkages to the State and National policy agendas.
Figure 3: The Performance Management policy cycle
2.1 WA Health Strategic Intent 2015-2020 At a State level, the WA health system’s strategic intent is to deliver a safe, high quality, sustainable health system for all Western Australians. This responsibility cascades down through the values and core policy drivers that impacts health service delivery, effectiveness and efficiency.
2.2 WA Health Reform Program 2015-2020 The WA Health Reform Program 2015-2020 is an integrated program of work aligned to the critical enablers identified in WA Health’s Strategic Intent. The program focuses on the building blocks that underpin the delivery of better health, better care and better value through:
• Improved accountability to the community o Strong governance foundations with clear delineation of roles and responsibilities
will enable stronger system decision-making, operation and risk management.
• More responsive, flexible and innovative health services to the community
Priorities National State
WA health system policy
frameworks
WA health system performance
outcomes
Policy agenda National State
Supers
eded
by: M
P 0055
/17
01 Ju
ly 20
17

6 Performance Management Policy 2016-17
o Greater authority and innovation in health services in meeting the needs of local communities, including greater local decision-making and strengthened partnerships.
• Greater transparency and assurance of safety and quality of health services o Robust systemwide policy and standards, aligned to national and international
evidence-based best practice to assure the quality and safety of health services.
• A more sustainable health system o Strengthened financial management and business intelligence so that resources
are allocated fairly and used efficiently to deliver the best health outcomes.
2.3 State Government Goal In addition to these, the State Government specifies in the Western Australian State Government Budget Papers published by the Department of Treasury, a State Government Goal and two desired outcomes with regard to the health of Western Australians.
Higher-level policy objectives outlined above and the suite of services and programs provided as a result influences the funding arrangements of the WA health system.
2.4 National Health Reform In performing or exercising any function or power under the Health Sevices Act 2016, the Minister for Health and Health Service Providers must according to the National Health Reform Act 2011, have regard to the National Health Reform Agreement.
The effect of the National Health Reform Agreement ensures that the PMP continues to maintain policy based alignments for priority areas identified and funded at a national level.
2.5 Mental Health Commission The Mental Health Commission (MHC) was established in 2010 in conjunction with the creation of a dedicated Ministerial portfolio for mental health. The MHC, as WA’s primary purchaser of mental health services, is responsible for strategic policy, planning, purchasing and monitoring of mental health services. In addition, the MHC seeks to raise public awareness of mental wellbeing and promote the social inclusion of people with mental health difficulties and/or mental illness. The Western Australian Mental Health, Alcohol and Other Drug Services Plan 2015-2025 was developed by the MHC and Drug and Alcohol Office, with support from the
Government Goal Greater focus on achieving results in key service delivery areas for the benefit of all Western Australians.
Desired Outcomes Restoration of patients’ health, provision of maternity care to women and
newborns, and support for patients and families during terminal illness
Enhanced health and well-being of Western Australians through health promotion, illness and injury prevention and appropriate continuing care.
Supers
eded
by: M
P 0055
/17
01 Ju
ly 20
17
7 Performance Management Policy 2016-17
Department of Health. The plan provides a blueprint for the investment required in mental health, alcohol and other drug services until 2025.
2.6 Public Health Public health aims to promote good health, prevent disease, manage risk (natural and man-made) and prolong life. The main focus of public health is to maximise health and wellbeing by promoting societal, environmental and individual behaviour change via a range of mechanisms from community education through to evidence-based policy and legislation. It necessitates a wide range of partnerships across and beyond government. To drive health improvement across the community, the public health workforce gathers and analyses data about the population as a whole, and in particular vulnerable and disadvantaged groups. It is a major contributor to the steady increase in life expectancy in Western Australia. Public health complements and works with clinical care to mitigate the demand for health services.
It is recognised that gaps in public health performance indicators exist within the current Health Service Performance Report. A review is underway to identify and develop appropriate performance indicators to address these gaps. Once developed and endorsed, by the Department Executive Committee, additional public health performance indicators will be included in the Health Service Performance Report.
2.7 WA Aboriginal Health and Wellbeing Framework 2015–2030 The Aboriginal1 Health Policy Directorate within WA Health is responsible for providing high-level strategic policy and planning advice to drive long-term improvements in Aboriginal health for all Aboriginal people living in Western Australia.
The WA Aboriginal Health and Wellbeing Framework 2015–2030 launched in March 2015, identifies key guiding principles, strategic directions and priority areas for the next 15 years, to improve the health and wellbeing of Aboriginal people in Western Australia. The release of the WA Health Strategic Intent 2015-2020 acknowledges Aboriginal health as a priority area strongly aligned to the WA Aboriginal Health and Wellbeing Framework 2015–2030.
The framework has been developed for Aboriginal people by Aboriginal people and was informed by an extensive consultation program. It has a strong focus on prevention and acknowledges culture as a key determinant of health. The six high-level strategic directions within the framework have been developed to support and guide evidence-based best practice, the re-empowerment of Aboriginal people, and a service system in which the health and wellbeing of Aboriginal people is everybody’s business. The framework’s six strategic directions are:
• promote good health across the life course • prevention and early intervention • a culturally respectful and non-discriminatory health system • a strong, skilled and growing Aboriginal health workforce • individual, family and community wellbeing • equitable and timely access to the best quality and safe care.
1 Within Western Australia, the term Aboriginal is used in preference to Aboriginal and Torres Strait Islander, in recognition that Aboriginal people are the original inhabitants of Western Australia. No disrespect is intended to our Torres Strait Islander colleagues and community.
Supers
eded
by: M
P 0055
/17
01 Ju
ly 20
17
8 Performance Management Policy 2016-17
In 2015, the Aboriginal Health Policy Directorate also launched a mandatory Aboriginal Cultural eLearning course for all employees to assist with delivery of culturally secure health services that will lead to improved health outcomes for Aboriginal people in WA.
2.8 Clinical Governance and Safety and Quality Clinical governance is defined as:
“…A system through which organisations are accountable for continuously improving the quality of their services and safeguarding high standards of care. This is achieved by creating an environment in which there is transparent responsibility and accountability for maintaining standards and by allowing excellence in clinical care to flourish...”2
The outcome of implementation of a system of clinical governance is a health service where: the protection of patients is the highest priority; patients are provided with appropriate, effective care and treated with dignity and respect; and staff operate within a positive workplace culture of openness, transparency, participation and innovation.
The 2015 review of maternity services at Djerriwarrh Health Service highlighted the adverse patient outcomes that could result if clinical governance processes and structures are not appropriate, or consistently applied.
Clinical Governance Policy Framework The Clinical Governance, Safety and Quality Policy Framework has been created in order to ensure that WA Health Service Providers have appropriate, and consistently applied, clinical governance structures required in order to be best-placed to provide safe, high quality care.
The Policy Framework replaces the previous suite of Clinical Governance Framework documents, and strengthens the requirements for clinical governance structures and processes under the powers provided to Policy Frameworks under the Health Services Act 2016. The policy framework consists of four principles:
1. Care is consumer and carer centred 2. Care is driven by information 3. We are organised for safety 4. We are led for high performance.
The Department of Health, led by the Director General as the System Manager, needs to be assured that the Clinical Governance, Safety and Quality Policy Framework is implemented within each Health Service Provider and that the System Manager’s and Health Service Providers’ monitoring of patient safety and quality is comprehensive and appropriately prioritised.
Safety and Quality in Performance Reporting WA Health’s performance reporting reflects their strong commitment to safety and quality in order to achieve better health outcomes with the inclusion of a number of safety and quality indicators, such as infection, mortality and readmission rates.
2 Scally G, Donaldson LJ. (1998). The NHS's 50 anniversary. Clinical governance and the drive for quality improvement in the new NHS in England. BMJ. Vol. 317, No.7150, p61-5.
Supers
eded
by: M
P 0055
/17
01 Ju
ly 20
17

9 Performance Management Policy 2016-17
These and other safety and quality indicators are selected to ensure the effectiveness of patient safety and quality practices that are in place as well as provide a measure of Health Service Providers’ performance. The system manager may require further safety and quality reporting and auditing to ensure that patient safety and quality is not compromised as efficiency measures are implemented across the health system.
Licensing and Accreditation Regulatory Unit WA Health’s Licensing and Accreditation Regulatory Unit (LARU) is the appointed Regulator for the Australian Health Service Safety and Quality Accreditation (AHSSQA) Scheme in WA. All pubic and private hospitals, and private day hospitals (Class A) are required to engage an accrediting agency, registered with the Australian Commission on Safety and Quality in Health Care, to undertake their accreditation assessment against the National Safety and Quality Health Service (NSQHS) Standards. LARU is responsible for regulating the AHSSQA Scheme in WA.
Performance-based Premium Payments Program The WA health system is continually investigating approaches to maintaining and improving the safety and quality of the clinical care that our services provide. This is particularly pertinent within the context of Activity-Based Funding/Management.
An incentive program designed to improve the quality and safety of care provided in a number of priority clinical areas has been running for a number of years: the Performance-based Premium Payments Program.
The Program was piloted in 2012-13 and it is anticipated that it will continue in 2016-17 with the following payments:
• Fragility Hip Fracture Treatment • Stroke Model of Care • Acute Myocardial Infarction
The Program is designed to:
• Recognise and reward services which provide a very high level of best evidence-based care
• Reimburse service providers for any additional costs and tasks associated with participation in the scheme, including data collection and submission.
Clinical areas have been, and will continue to be, selected for inclusion in the Program using the following criteria:
• A strong evidence base and clinical consensus on the characteristics of evidence-based best practice
• High impact, i.e. variation in practice, gap between best evidence and current practice, high volumes or significant impact on outcomes
• Availability and quality of data.
Details of the 2016-2017 Performance-based Premium Payments Program will be available at http://intranet.health.wa.gov.au/osqh/premiumpayments/.
Supers
eded
by: M
P 0055
/17
01 Ju
ly 20
17
10 Performance Management Policy 2016-17
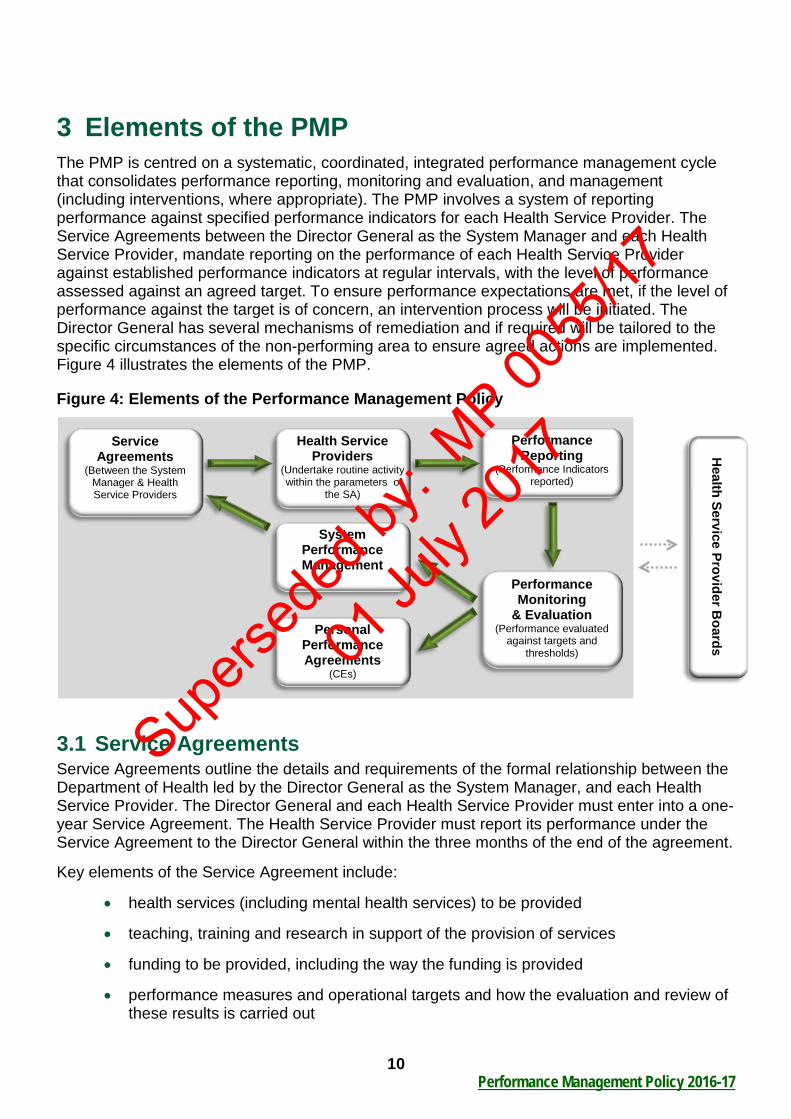
3 Elements of the PMP The PMP is centred on a systematic, coordinated, integrated performance management cycle that consolidates performance reporting, monitoring and evaluation, and management (including interventions, where appropriate). The PMP involves a system of reporting performance against specified performance indicators for each Health Service Provider. The Service Agreements between the Director General as the System Manager and each Health Service Provider, mandate reporting on the performance of each Health Service Provider against established performance indicators at regular intervals, with the level of performance assessed against an agreed target. To ensure performance expectations are met, if the level of performance against the target is of concern, an intervention process will be initiated. The Director General has several mechanisms of remediation and if required will be tailored to the specific circumstances of the non-performing area to ensure agreed actions are implemented. Figure 4 illustrates the elements of the PMP.
Figure 4: Elements of the Performance Management Policy
3.1 Service Agreements Service Agreements outline the details and requirements of the formal relationship between the Department of Health led by the Director General as the System Manager, and each Health Service Provider. The Director General and each Health Service Provider must enter into a one-year Service Agreement. The Health Service Provider must report its performance under the Service Agreement to the Director General within the three months of the end of the agreement.
Key elements of the Service Agreement include:
• health services (including mental health services) to be provided
• teaching, training and research in support of the provision of services
• funding to be provided, including the way the funding is provided
• performance measures and operational targets and how the evaluation and review of these results is carried out
Health Service Provider B
oards
Health Service Providers
(Undertake routine activity within the parameters of
the SA)
Performance Reporting
(Performance Indicators reported)
Service Agreements
(Between the System Manager & Health Service Providers
Performance Monitoring
& Evaluation (Performance evaluated
against targets and thresholds)
System Performance Management
Personal Performance Agreements
(CEs)
Supers
eded
by: M
P 0055
/17
01 Ju
ly 20
17

11 Performance Management Policy 2016-17
• performance data and other data to be provided to the Director General
• any other matter the Director General considers relevant to the provision of services.
The Service Agreement must cover a forecast period set out in the relevant binding policy framework.
The Chief Executives of each respective Health Service Provider will manage the day-to-day operations. The Service Agreements ensure that the State Government’s policy objectives on health service delivery are clearly set out and provide the basis for both payment and evaluation of performance. The performance management of each Service Agreement is undertaken as prescribed in this PMP.
Supers
eded
by: M
P 0055
/17
01 Ju
ly 20
17

12 Performance Management Policy 2016-17
4 Governance Arrangements The Health Services Act 2016 provides a legal framework for clear roles, responsibilities and accountabilities at all levels of the health system, through a devolved model of governance that enables decision-making closer to health service delivery and patient care. This section outlines the arrangements that govern the role, functions and powers of the Minister for Health, Director General of the Department of Health, and Health Service Providers. East Metropolitan Health Service (EMHS), Child and Adolescent Health Service (CAHS), North Metropolitan Health Service (NMHS), South Metropolitan Health Service (SMHS), WA Country Health Service (WACHS) and the Quadriplegic Centre are board governed Health Service Providers. Health Support Services is a chief executive governed Health Service Provider.
The revised structure of the WA health system incorporates key governance processes with a strong focus on quality and service standards. Figure 5 depicts the structure and processes for safeguarding quality standards within the WA health system.
Figure 5: Governance arrangements for the WA health system
Mental Health Commission
Mental Health Commissioner
Minister for Health Minister for Mental Health
Department of Health System Manager
Director General
Health Service Providers
Board governed
Chief Executive
Chief Executive governed
Health Services Act 2016
Mental Health Act 2014
Services Agreements
DG Policy Frameworks
and Directions Systemwide Plans and
Policy
Local Plans and Policy
o Health Support Services (HSS)
o EMHS o CAHS o NMHS o SMHS o WACHS o Quadriplegic Centre
Head Agreement
Minister: • Appoints/removes
all Board Members: - 6 to 10 members with required skills, expertise and experiences - Required to have 3 health professionals, 2 of whom must currently be practising.
• Designates Chairs/Deputy Chairs
• May appoint advisers or administrators.
Directions Instructions
Establishes and dissolves Directions
Service Agreements (consistent with
Head Agreement) Supers
eded
by: M
P 0055
/17
01 Ju
ly 20
17

13 Performance Management Policy 2016-17
The overall management of the WA health system is the responsibility of the the Department of Health led by the Director General, as the System Manager. The Director General has the powers to do anything necessary or convenient for the performance of the Director General’s functions under the Health Services Act 2016 Part 3 Division 1 s. 21. The Director General also sets the parameters within which health services will be planned and delivered, determines the clinical role and services of individual hospitals and holds each Health Service Provider to account for the delivery of the State Government’s objectives and priorities.
4.1 Role, Functions and Powers of the Director General The Department of Health led by the Director General performs the role of the System Manager for the WA health system. The Health Services Act 2016 clearly outlines the role, functions and powers of the Director General includes the:
• responsibility for the strategic leadership, planning and direction
• management of systemwide industrial relations and set conditions of the employment for Health Service Provider employees
• establishment of compulsory Service Agreements with Health Service Providers that outline budget, activity and performance measures, and monitors performance. Take remedial action when performance does not meet expected standards
• arrangement for the provision of health services by contracted health entities
• recommendations to the Minister for Health for the amounts that may be allocated from the health portfolio budget to Health Service Providers
• oversight, monitoring and promoting improvements in the safety and quality of health services.
The Director General also has several mechanisms of remediation:
• issue binding policy frameworks and directions to Health Service Providers
• agree on the performance improvements with the Chief Executive of each Health Service Provider
• evaluation and performance management of a Health Service Provider under the Service Agreement
• assess compliance, performance, safety, quality, and patient services through the powers of investigation, inspection and audit
• power to conduct an inquiry into the functions, management or operations of Health Service Providers.
4.2 Role, Functions and Powers of Health Service Providers Health Service Providers, both board governed and chief executive governed, are responsible for service delivery. The Health Services Act 2016 clearly outlines the role, functions and powers of the Health Service Providers including:
Supers
eded
by: M
P 0055
/17
01 Ju
ly 20
17
14 Performance Management Policy 2016-17
• provide safe, high quality, efficient, and economical services
• accountable for health service delivery and performance management in accordance with the Service Agreement:
o funding
o performance measures (e.g. clinical, financial, safety and quality, audit)
o operational targets
• employing authority of Health Service Provider staff
• contribute to, and implement systemwide plans
• develop and implement, corporate and clinical governance arrangements
• maintain land, buildings and assets controlled and managed by the Health Service Provider
• arrange for the provision of health services by contracted health entities subject to a Director General direction and the State Supply Commission Act 1991
• comply with policy frameworks and directions issued by the Director General
• consult with health professionals working for the Health Service Provider and consult with health consumers and community members about the provision of health services
• cooperate with other Health Service Providers, including providers of primary health care, in planning for, and providing, health services.
The Minister can also issue directions to Health Service Providers with respect to the performance of their functions.
Supers
eded
by: M
P 0055
/17
01 Ju
ly 20
17

15 Performance Management Policy 2016-17
5 Performance Reporting, Monitoring and Evaluation 5.1 Performance Reporting The Health Service Performance Report (HSPR) 2016-17, the Interim Quadriplegic Centre Performance Report (QCPR) 2016-7 and the Interim Health Support Services Performance Report (HSSPR) 2016-17 are reported monthly and support the PMP. All three reports are aligned to the strategic priorities and enablers detailed in the WA Health Strategic Intent 2015-20. The PMP is a strategic policy that manages the performance of Health Service Providers. While the reporting obligations for all performance indicators within the PMP 2016-17 apply broadly to Health Service Providers, the indicators, defined in scope, suit the specific circumstances and clinical service obligations of the Health Service Providers. A key aspect of performance reporting includes the delineation of responsibilities and accountabilities between the System Manager and each Health Service Provider detailed in Table 1.
Table 1: Responsibilities for reporting
Reporting Requirements Frequency System Manager Process the data supplied by data custodians Monthly Develop and quality assure the HSPR Monthly Undertake analysis and interpretation of indicator data Monthly Publish the HSPR Monthly Provide HSPR commentary that provides analytical details of performance
Monthly
Health Service Provider Provision of timely and accurate data Monthly Undertake analysis and interpretation of indicator data Monthly Provide HSPR commentary that provides an understanding of the drivers of performance
Monthly
5.2 Performance Indicator Targets The performance indicator targets and thresholds in the PMP play a pivotal role in performance reporting. The Performance Projects Board and Department Executive Committee (DEC) endorse performance indicators. In consultation with key stakeholders, the suite of performance indicators, targets and thresholds are endorsed by DEC, which is chaired by the Director General.
Targets have been established by adopting the most appropriate alignments to WA Health’s strategic objectives by considering the following:
1. Existing National policy based targets
2. Existing State policy based targets
3. Previous performance baselines, the results of the stress testing methodology, or expert advice from data custodians/providers.
Supers
eded
by: M
P 0055
/17
01 Ju
ly 20
17
16 Performance Management Policy 2016-17
It is recognised that the Health Service Providers do not always have sole responsibility for the delivery of all the performance indicators in the PMP 2016-17. The extent to which Health Service Providers are able to achieve the targets for these performance indicators will be taken into consideration and form part of the performance review meeting discussions.
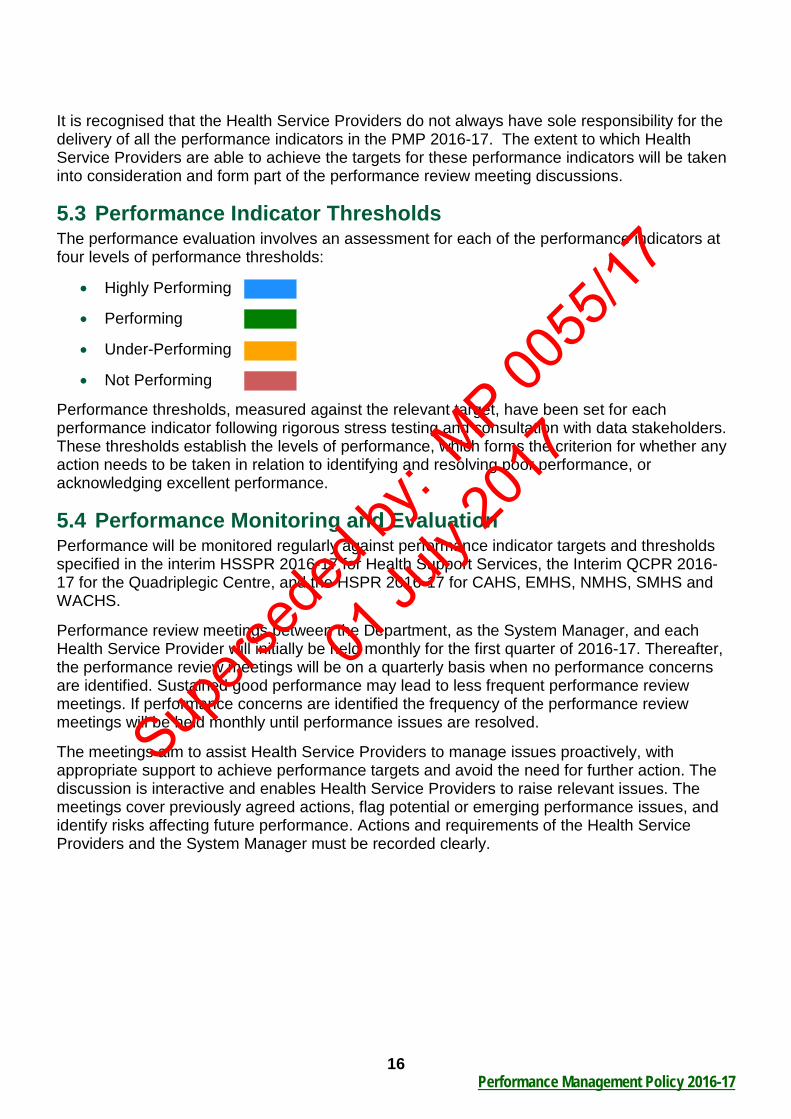
5.3 Performance Indicator Thresholds The performance evaluation involves an assessment for each of the performance indicators at four levels of performance thresholds:
• Highly Performing
• Performing
• Under-Performing
• Not Performing
Performance thresholds, measured against the relevant target, have been set for each performance indicator following rigorous stress testing and consultation with data stakeholders. These thresholds establish the levels of performance, which forms the criterion for whether any action needs to be taken in relation to identifying and resolving poor performance, or acknowledging excellent performance.
5.4 Performance Monitoring and Evaluation Performance will be monitored regularly against performance indicator targets and thresholds specified in the interim HSSPR 2016-17 for Health Support Services, the Interim QCPR 2016-17 for the Quadriplegic Centre, and the HSPR 2016-17 for CAHS, EMHS, NMHS, SMHS and WACHS.
Performance review meetings between the Department, as the System Manager, and each Health Service Provider will initially be held monthly for the first quarter of 2016-17. Thereafter, the performance review meetings will be on a quarterly basis when no performance concerns are identified. Sustained good performance may lead to less frequent performance review meetings. If performance concerns are identified the frequency of the performance review meetings will be held monthly until performance issues are resolved.
The meetings aim to assist Health Service Providers to manage issues proactively, with appropriate support to achieve performance targets and avoid the need for further action. The discussion is interactive and enables Health Service Providers to raise relevant issues. The meetings cover previously agreed actions, flag potential or emerging performance issues, and identify risks affecting future performance. Actions and requirements of the Health Service Providers and the System Manager must be recorded clearly.
Supers
eded
by: M
P 0055
/17
01 Ju
ly 20
17

17 Performance Management Policy 2016-17
6 Performance Management 6.1 Components of Performance Management The performance management will involve:
• on-going review of the performance of Health Service Providers
• identifying a performance concern and determining the appropriate response and agreed timeframe to this concern
• determining when a performance recovery plan is required and the timeframe it is required
• determining the level of intervention when required and when the performance intervention needs to be escalated or de-escalated.
6.2 Intervention Model Responsive regulation is the intervention model that has been adopted by the PMP. The model is a collaborative approach that enables accountability through agreed mechanisms that are responsive when performance issues have been identified. Responsive regulation is a supportive approach to assist Health Service Providers to maintain and improve performance.
The intervention levels and recovery plans are directly related to individual indicator performance. The Health Service Providers’ performance assessments are based on achieving performance targets for individual performance indicators outlined in the PMP.
The System Manager has the discretion to escalate or de-escalate concerns to higher or lower levels based on an assessment of performance.
Each Health Service Provider will:
1. Ensure timely responses to the System Manager requests for performance information.
2. Meet all reporting requirements specified in the PMP.
3. Demonstrate that they have comparable frameworks/processes, which map as close as possible to measures included in their Service Agreement, down to facility and clinical network/cluster or division levels for monitoring performance and identifying and managing emerging performance issues.
4. Identify delegates responsible for service delivery against performance indicators.
5. Establish processes and procedures to identify risk including a process to report this risk to the System Manager.
6. Report promptly to the System Manager any emerging or potential performance issue and/or performance risk including immediate actions taken and/or an early assessment of action that may be required to prevent the issue from deteriorating.
7. Seek appropriate partnerships to achieve performance targets.
8. Establish and maintain a culture of performance improvement by:
• promoting the PMP at all levels within the Health Service Provider
Supers
eded
by: M
P 0055
/17
01 Ju
ly 20
17

18 Performance Management Policy 2016-17
• identifying shortfalls in relation to performance, devising and implementing appropriate support and development arrangements to facilitate long-term and sustainable delivery.
• providing relevant managerial staff (administrative and clinical) with training, mentoring, and learning and development opportunities in performance management and improvement. This includes providing relevant managerial staff with the tools to enable them to have an effective performance improvement role.
• ensuring that key staff understand their performance responsibilities and the consequences of not effectively executing these responsibilities.
9. Work collaboratively with the System Manager to address performance concerns.
10. Manage contractual obligations relating to performance and report these to the System Manager as required.
6.3 Actions arising from Performance Assessments The System Manager will determine the subsequent actions required to monitor performance or correct any performance concerns.
The level of response and intervention is based on:
• the extent of sustained good performance
• the seriousness of performance concerns
• the likelihood of rapid deterioration or rapid improvement
• the level of support required to sustain health service operations or manage risks
• progress towards existing recovery plans
• persistent and emerging financial and/or clinical, safety and quality risks
• other demonstrated performance deficits.
The level of response and intervention dictates the action required by Health Service Providers and/or the System Manager. In responding to any sustained performance concerns, the objective is to build capacity and sustainability where appropriate.
The PMP comprises response and intervention levels that guide the decision to escalate or de-escalate performance concerns. The response and intervention levels will be discussed as a part of the performance review meetings if required.
Supers
eded
by: M
P 0055
/17
01 Ju
ly 20
17
19 Performance Management Policy 2016-17
Level A Response: Sustained Good Performance
The System Manager considers sustained good performance and reduces the frequency of performance review meetings.
Level B Response: Satisfactory Performance
The System Manager considers performance is satisfactory with no identified performance concerns.
Level 1 Intervention: Under Review
The System Manager advises the Health Service Providers that a performance issue has been identified. Within a timeframe determined by the System Manager, Health Service Providers are required to provide formal advice on the reasons that have led to the performance issue identified, and what, if any action is required.
Level 2 Intervention: Performance Concern
The System Manager determines whether a formal recovery plan is required, the timeframe in which the recovery plan is required, and/or if there is other, additional performance issues that need action and the timeframe in which those actions need to be undertaken.
The Health Service Provider will be required to undertake an in-depth assessment and develop a detailed recovery plan that is endorsed by the Health Service Provider Board for board governed Health Service Providers or the Chief Executive for chief executive governed Health Service Providers. The Health Service Provider and the System Manager are required to discuss the recovery plan at the performance review meeting. The recovery plan requires the Director General’s approval.
Level 3 Intervention: Sustained Performance Concern
The System Manager will determine the appropriate timeframe and course of action to be taken to redress the sustained performance concern.
The timeframe and course of action will be at the Director General’s discretion, tailored to the specific circumstances, and may involve one or more of the following actions:
1. Assigning appropriate personnel from the Department to provide additional support if the recovery plan is not achieving improved performance.
2. Assigning an expert advisor appointed by the System Manager to review the root cause(s) of the sustained performance concern and provide a series of recommendations for implementation by the Health Service Provider.
3. Requiring the Health Service Provider Board Chair or a delegate to attend performance review meetings.
4. Advising the Minister of the sustained performance concern.
5. Other intervention as deemed appropriate.
Additionally, a representative to assist the Health Service Provider Board may be appointed by the Minister to oversee the necessary performance improvements. This could include the Minister appointed representative attending Health Service Provider Board meetings.
Supers
eded
by: M
P 0055
/17
01 Ju
ly 20
17

20 Performance Management Policy 2016-17
Level 4 Intervention: Performance Failure
The System Manager will determine if the Health Service Provider is not capable of delivering the required provision of services. This level of intervention may involve one or more of the following actions by:
The Director General:
1. Commissioning an independent review of Health Service Provider governance and capability.
2. May do anything necessary or convenient for the performance of the Department Director General’s functions under Section 21 of the Health Services Act 2016.
The Minister:
1. Requiring a show cause letter from the Health Service Provider Board Chair.
2. Requiring the Health Service Provider Board Chair to demonstrate that the Board and the Chief Executive are able to achieve performance and capability improvement within a reasonable timeframe.
3. Removing the Chair, Deputy Chair or members of the Health Service Provider Board in accordance with Section 102 of the Health Services Act 2016, which includes the Minister laying before each House of Parliament notice of the action.
4. Appointing an Administrator in accordance with Section 99 of the Health Services Act 2016.
5. Stepping-in and intervening in the management of Health Service Providers where required.
It is important to note that escalation and de-escalation through the levels outlined above may not be sequential.
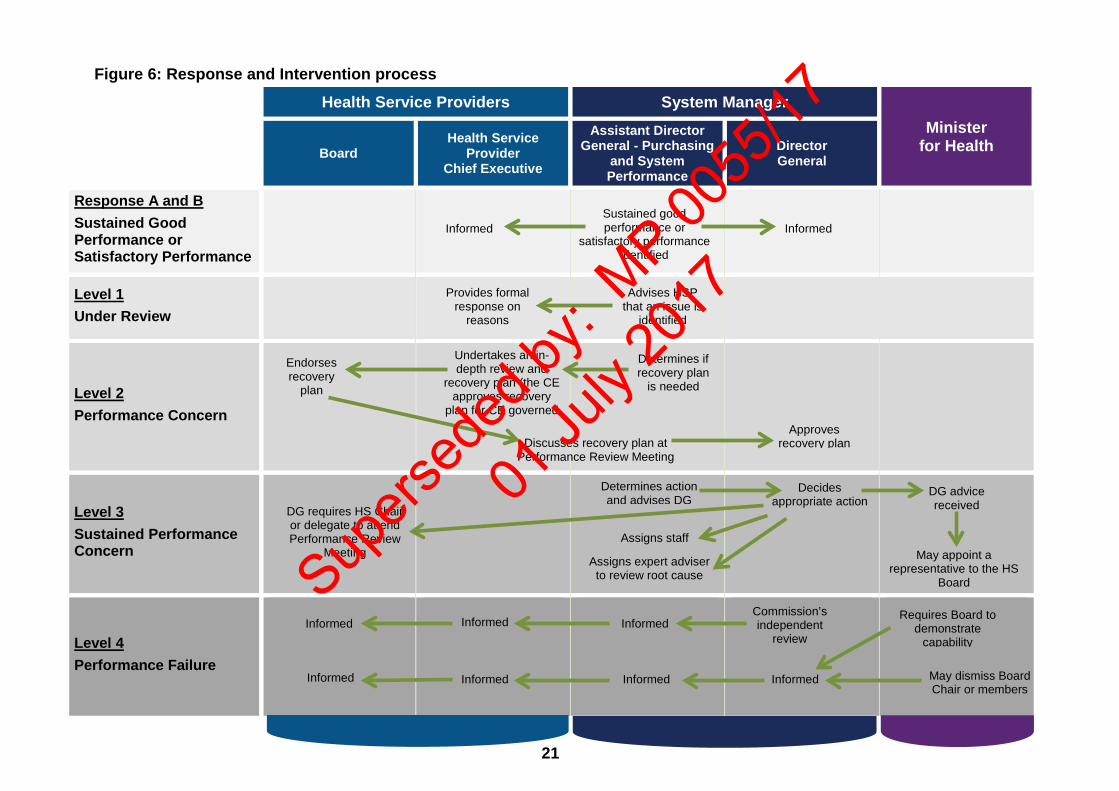
Figure 6 provides a schematic illustration of the response and intervention process.
Supers
eded
by: M
P 0055
/17
01 Ju
ly 20
17
21
Figure 6: Response and Intervention process Health Service Providers System Manager
Minister for Health
Board
Health Service Provider
Chief Executive
Assistant Director General - Purchasing
and System Performance
Director General
Response A and B Sustained Good Performance or Satisfactory Performance
Level 1 Under Review
Level 2 Performance Concern
Level 3 Sustained Performance Concern
Level 4 Performance Failure
Undertakes an in-depth review and
recovery plan (the CE approves recovery
plan for CE governed
Determines if recovery plan
is needed
Endorses recovery
plan
Discusses recovery plan at Performance Review Meeting
Approves recovery plan
Informed Sustained good performance or
satisfactory performance identified
Informed
Provides formal response on
reasons
Advises HSP that an issue is
identified
Determines action and advises DG
Decides appropriate action
DG advice received
May appoint a representative to the HS
Board
Assigns staff
Assigns expert adviser to review root cause
DG requires HS Chair or delegate to attend Performance Review
Meeting
Requires Board to demonstrate
capability
May dismiss Board Chair or members
Commission’s independent
review Informed Informed Informed
Informed Informed Informed Informed
Supers
eded
by: M
P 0055
/17
01 Ju
ly 20
17

22
Schedule 1 Health Service Performance Report (HSPR) 2016-17
Performance Indicator Targets, Target Source, and Thresholds
Supers
eded
by: M
P 0055
/17
01 Ju
ly 20
17
23
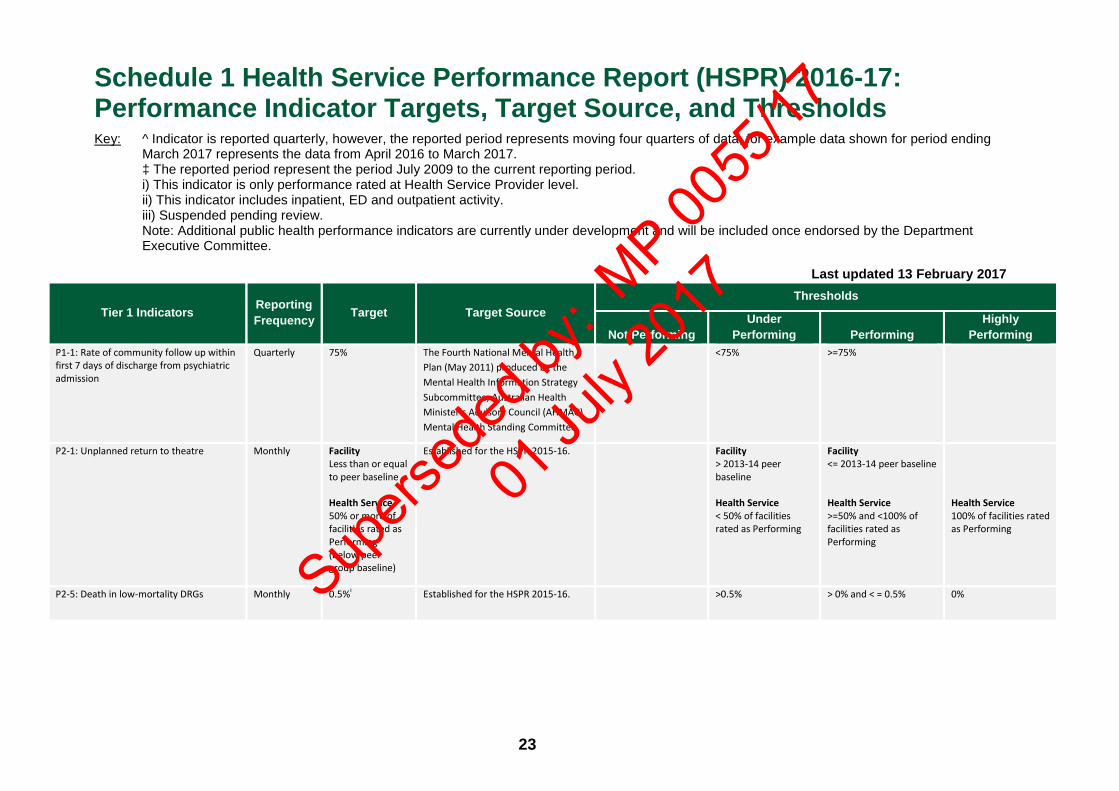
Schedule 1 Health Service Performance Report (HSPR) 2016-17: Performance Indicator Targets, Target Source, and Thresholds Key: ^ Indicator is reported quarterly, however, the reported period represents moving four quarters of data, for example data shown for period ending
March 2017 represents the data from April 2016 to March 2017. ‡ The reported period represent the period July 2009 to the current reporting period. i) This indicator is only performance rated at Health Service Provider level. ii) This indicator includes inpatient, ED and outpatient activity. iii) Suspended pending review. Note: Additional public health performance indicators are currently under development and will be included once endorsed by the Department Executive Committee.
Last updated 13 February 2017
Tier 1 Indicators Reporting Frequency Target Target Source
Thresholds
Not Performing Under
Performing Performing Highly
Performing P1-1: Rate of community follow up within first 7 days of discharge from psychiatric admission
Quarterly 75% The Fourth National Mental Health Plan (May 2011) produced by the Mental Health Information Strategy Subcommittee, Australian Health Minister’s Advisory Council (AHMAC) Mental Health Standing Committee.
<75% >=75%
P2-1: Unplanned return to theatre Monthly Facility Less than or equal to peer baseline Health Service 50% or more of facilities rated as Performing (below peer group baseline)
Established for the HSPR 2015-16. Facility > 2013-14 peer baseline Health Service < 50% of facilities rated as Performing
Facility <= 2013-14 peer baseline Health Service >=50% and <100% of facilities rated as Performing
Health Service 100% of facilities rated as Performing
P2-5: Death in low-mortality DRGs Monthly 0.5%i Established for the HSPR 2015-16. >0.5% > 0% and < = 0.5% 0% Supers
eded
by: M
P 0055
/17
01 Ju
ly 20
17

24
Tier 1 Indicators Reporting Frequency Target Target Source
Thresholds
Not Performing Under
Performing Performing Highly
Performing P2-9: WEAT – ED Attendances with LOE <= 4 hours (%)
Monthly 2015 calendar yr 90% 2016 calendar yr 90% 2017 calendar yr 90%
Prior to 2016: National Partnership Agreement on Improving Public Hospital Services (National Emergency Access Target). 2016 and 2017: Established for the HSPR 2015-16 by Health Service Improvement Unit.
2015 calendar yr <71.3% 2016 calendar yr <80% 2017 calendar yr <80%
2015 calendar yr >=71.3% and <87.5% 2016 calendar yr >=80% and <90% 2017 calendar yr >=80% and <90%
2015 calendar yr >=87.5% and <90% 2016 calendar yr >=90% and <95% 2017 calendar yr >=90% and <95%
2015 calendar yr =>90% 2016 calendar yr =>95% 2017 calendar yr =>95%
P2-17: WEST - Proportion of elective wait list patients waiting over boundary for reportable procedures
a) % Category 1 over 30 days Monthly 0%
Established for the HSPR 2016-17 by Clinical Support Directorate
>10%
>0% and ≤10%
0%
b) % Category 2 over 90 days Monthly 0%
Established for the HSPR 2016-17 by Clinical Support Directorate
>10%
>0% and ≤10%
0%
c) % Category 3 over 365 days Monthly 0%
Established for the HSPR 2016-17 by Clinical Support Directorate
>10%
>0% and ≤10%
0%
P2-18: WEST - Proportion of elective wait list patients waiting over boundary for non-reportable procedures
a) % Category 1 over 30 days Monthly 2016/17 financial yr 15% 2017/18 financial yr 8% 2018/19 financial yr 0%
Established for the HSPR 2016-17 by Clinical Support Directorate
2016/17 financial yr >23% 2017/18 financial yr >12% 2018/19 financial yr >10%
2016/17 financial yr >15% and ≤23% 2017/18 financial yr >8% and ≤12% 2018/19 financial yr >0% and ≤10%
2016/17 financial yr >8% and ≤15% 2017/18 financial yr >0% and ≤8% 2018/19 financial yr 0%
2016/17 financial yr ≥0% and ≤8% 2017/18 financial yr 0%
Supers
eded
by: M
P 0055
/17
01 Ju
ly 20
17

25
Tier 1 Indicators Reporting Frequency Target Target Source
Thresholds
Not Performing Under
Performing Performing Highly
Performing b) % Category 2 over 90 days Monthly 2016/17 financial
yr 15% 2017/18 financial yr 8% 2018/19 financial yr 0%
Established for the HSPR 2016-17 by Clinical Support Directorate
2016/17 financial yr >23% 2017/18 financial yr >12% 2018/19 financial yr >10%
2016/17 financial yr >15% and ≤23% 2017/18 financial yr >8% and ≤12% 2018/19 financial yr >0% and ≤10%
2016/17 financial yr >8% and ≤15% 2017/18 financial yr >0% and ≤8% 2018/19 financial yr 0%
2016/17 financial yr ≥0% and ≤8% 2017/18 financial yr 0%
c) % Category 3 over 365 days Monthly 2016/17 financial yr 15% 2017/18 financial yr 8% 2018/19 financial yr 0%
Established for the HSPR 2016-17 by Clinical Support Directorate
2016/17 financial yr >23% 2017/18 financial yr >12% 2018/19 financial yr >10%
2016/17 financial yr >15% and ≤23% 2017/18 financial yr >8% and ≤12% 2018/19 financial yr >0% and ≤10%
2016/17 financial yr >8% and ≤15% 2017/18 financial yr >0% and ≤8% 2018/19 financial yr 0%
2016/17 financial yr ≥0% and ≤8% 2017/18 financial yr 0%
Supers
eded
by: M
P 0055
/17
01 Ju
ly 20
17

26
Tier 1 Indicators Reporting Frequency Target Target Source
Thresholds
Not Performing Under
Performing Performing Highly
Performing P4-1: WA Health Aboriginal employment headcount
Quarterly Target is a Statewide annual increase of 100 Aboriginal employees from the baseline. The overall target has been apportioned for each budget holder. 2015/16 financial yr (Baseline = Jun 2015) 2016/17 financial yr (Baseline = Dec 2016 taking into account the increase in Statewide Aboriginal employees between July 2016 and December 2016)
Established for the HSPR 2016-17. 2015/16 financial yr < HS target 2016/17 financial yr < HS target
2015/16 financial yr ≥ HS target 2016/17 financial yr ≥ HS target
P4-2: The percentage of admitted patients who discharged against medical advice:
(a) Aboriginal Monthly Non-Aboriginal Baseline rate. (Baseline for 2016/17 = Combined Non-Aboriginal rate for 2013/14, 2014/15, and 2015/16)
Established for the HSPR 2016-17. Rate > Combined Aboriginal rate for 2013/14, 2014/15, and 2015/16
Rate ≤ Combined Aboriginal rate for 2013/14, 2014/15, and 2015/16 and > target
Rate ≤ target
Supers
eded
by: M
P 0055
/17
01 Ju
ly 20
17
27
Tier 1 Indicators Reporting Frequency Target Target Source
Thresholds
Not Performing Under
Performing Performing Highly
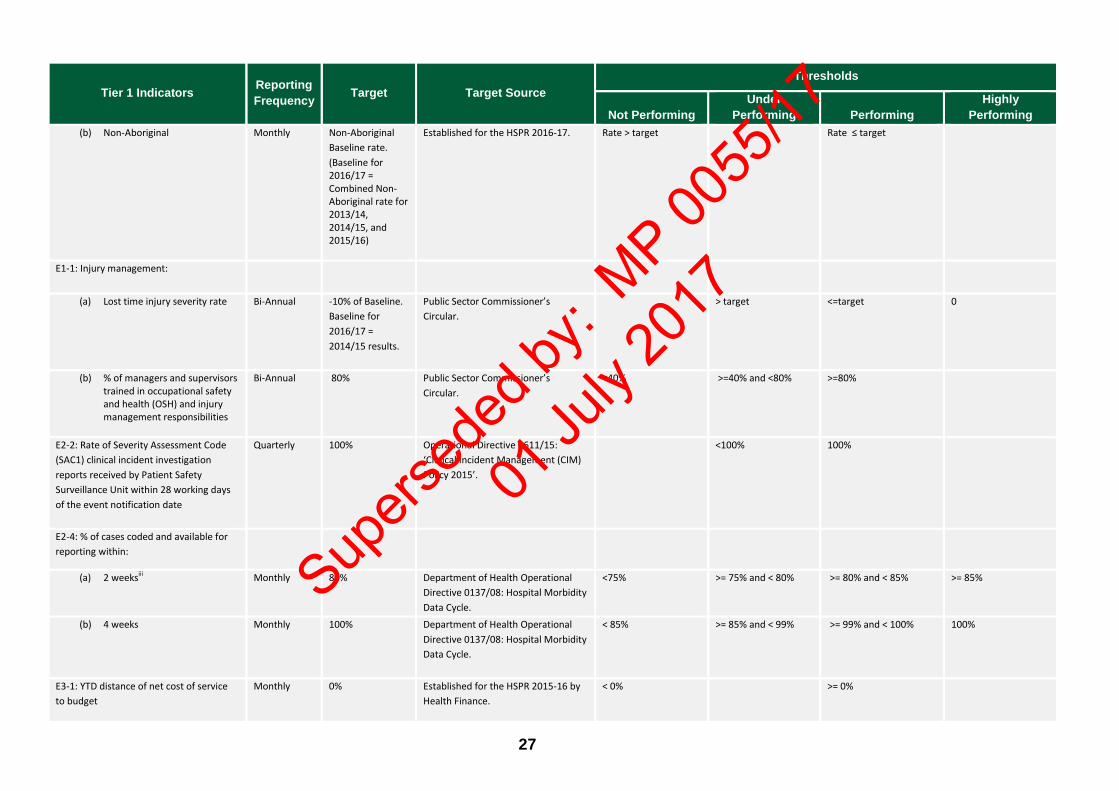
Performing (b) Non-Aboriginal Monthly Non-Aboriginal
Baseline rate. (Baseline for 2016/17 = Combined Non-Aboriginal rate for 2013/14, 2014/15, and 2015/16)
Established for the HSPR 2016-17. Rate > target
Rate ≤ target
E1-1: Injury management:
(a) Lost time injury severity rate
Bi-Annual -10% of Baseline. Baseline for 2016/17 = 2014/15 results.
Public Sector Commissioner’s Circular.
> target
<=target
0
(b) % of managers and supervisors trained in occupational safety and health (OSH) and injury management responsibilities
Bi-Annual 80%
Public Sector Commissioner’s Circular.
<40% >=40% and <80% >=80%
E2-2: Rate of Severity Assessment Code (SAC1) clinical incident investigation reports received by Patient Safety Surveillance Unit within 28 working days of the event notification date
Quarterly 100% Operational Directive 0611/15: ‘Clinical Incident Management (CIM) Policy 2015’.
<100% 100%
E2-4: % of cases coded and available for reporting within:
(a) 2 weeksiii Monthly 80%
Department of Health Operational Directive 0137/08: Hospital Morbidity Data Cycle.
<75%
>= 75% and < 80%
>= 80% and < 85%
>= 85%
(b) 4 weeks
Monthly 100%
Department of Health Operational Directive 0137/08: Hospital Morbidity Data Cycle.
< 85% >= 85% and < 99% >= 99% and < 100% 100%
E3-1: YTD distance of net cost of service to budget
Monthly 0% Established for the HSPR 2015-16 by Health Finance.
< 0% >= 0%
Supers
eded
by: M
P 0055
/17
01 Ju
ly 20
17
28
Tier 1 Indicators Reporting Frequency Target Target Source
Thresholds
Not Performing Under
Performing Performing Highly
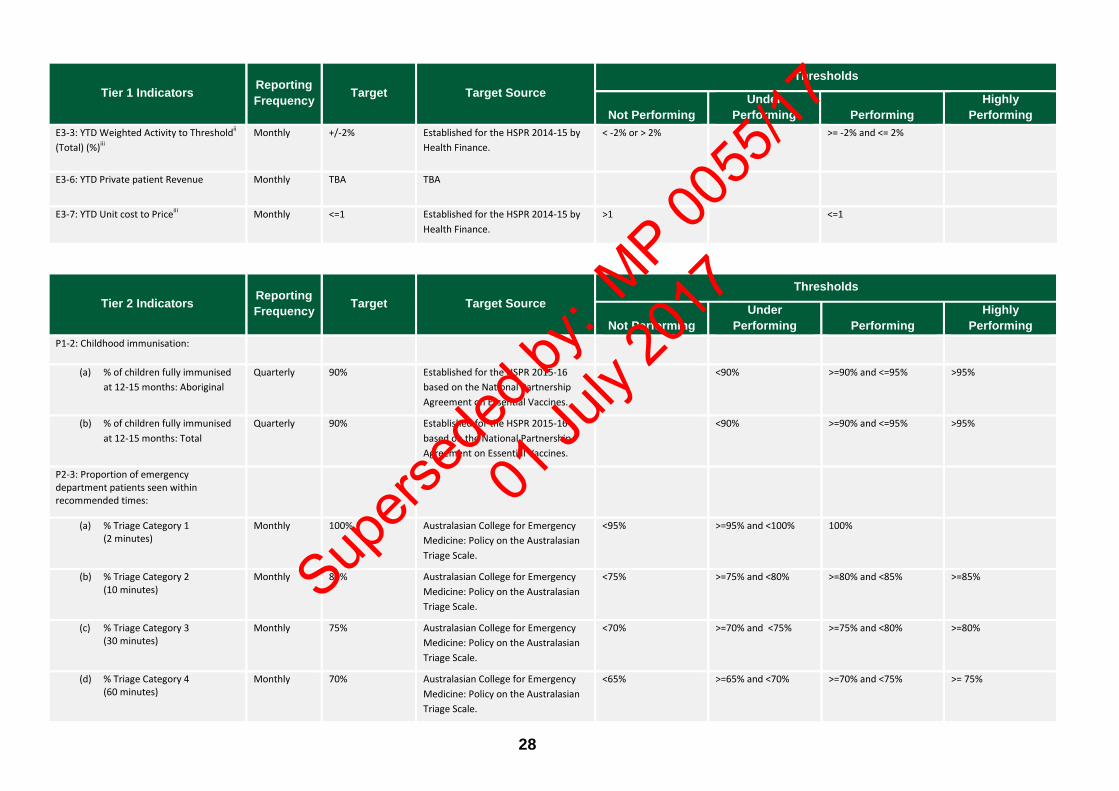
Performing E3-3: YTD Weighted Activity to Thresholdii (Total) (%)iii
Monthly +/-2% Established for the HSPR 2014-15 by Health Finance.
< -2% or > 2%
>= -2% and <= 2%
E3-6: YTD Private patient Revenue Monthly TBA TBA
E3-7: YTD Unit cost to Priceiii
Monthly <=1 Established for the HSPR 2014-15 by Health Finance.
>1 <=1
Tier 2 Indicators Reporting Frequency Target Target Source
Thresholds
Not Performing Under
Performing Performing Highly
Performing P1-2: Childhood immunisation:
(a) % of children fully immunised at 12-15 months: Aboriginal
Quarterly 90% Established for the HSPR 2015-16 based on the National Partnership Agreement on Essential Vaccines.
<90% >=90% and <=95% >95%
(b) % of children fully immunised at 12-15 months: Total
Quarterly 90% Established for the HSPR 2015-16 based on the National Partnership Agreement on Essential Vaccines.
<90% >=90% and <=95% >95%
P2-3: Proportion of emergency department patients seen within recommended times:
(a) % Triage Category 1 (2 minutes)
Monthly 100%
Australasian College for Emergency Medicine: Policy on the Australasian Triage Scale.
<95%
>=95% and <100%
100%
(b) % Triage Category 2 (10 minutes)
Monthly 80% Australasian College for Emergency Medicine: Policy on the Australasian Triage Scale.
<75%
>=75% and <80%
>=80% and <85%
>=85%
(c) % Triage Category 3 (30 minutes)
Monthly 75% Australasian College for Emergency Medicine: Policy on the Australasian Triage Scale.
<70%
>=70% and <75%
>=75% and <80%
>=80%
(d) % Triage Category 4 (60 minutes)
Monthly 70% Australasian College for Emergency Medicine: Policy on the Australasian Triage Scale.
<65%
>=65% and <70%
>=70% and <75%
>= 75%
Supers
eded
by: M
P 0055
/17
01 Ju
ly 20
17

29
Tier 2 Indicators Reporting Frequency Target Target Source
Thresholds
Not Performing Under
Performing Performing Highly
Performing (e) % Triage Category 5
(2 hours)
Monthly 70%. Australasian College for Emergency Medicine: Policy on the Australasian Triage Scale.
<65% >=65% and < 70% >=70% and <75% >=75%
P2-4: Healthcare-associated Staphylococcus aureus bloodstream infection (HA-SABSI) per 10,000 occupied bed-days
Quarterly <=1.0 per 10,000 occupied bed-days
WA Metropolitan tertiary hospital aggregate - Established for the HSPR 2014-15 in consultation with Communicable Disease Control (CDC).
> 1.0 per 10,000 occupied bed days
<= 1.0 per 10,000 occupied bed-days and > 0 per 10,000 occupied bed-days
0 per 10,000 occupied bed-days
P2-7: Unplanned hospital readmissions of patients discharged following management of:
(a) Knee replacement
Quarterly^ Average % of unplanned hospital readmissions for the period July 2011 to June 2013, by Health Service and surgery type
Established for the HSPR 2015-16.
Assessment period > target
Assessment period <= target
(b) Hip replacement Quarterly^ Average % of unplanned hospital readmissions for the period July 2011 to June 2013, by Health Service and surgery type
Established for the HSPR 2015-16. Assessment period > target
Assessment period <= target
(c) Tonsillectomy & adenoidectomy
Quarterly^ Average % of unplanned hospital readmissions for the period July 2011 to June 2013, by Health Service and surgery type
Established for the HSPR 2015-16. Assessment period > target
Assessment period <= target
Supers
eded
by: M
P 0055
/17
01 Ju
ly 20
17
30
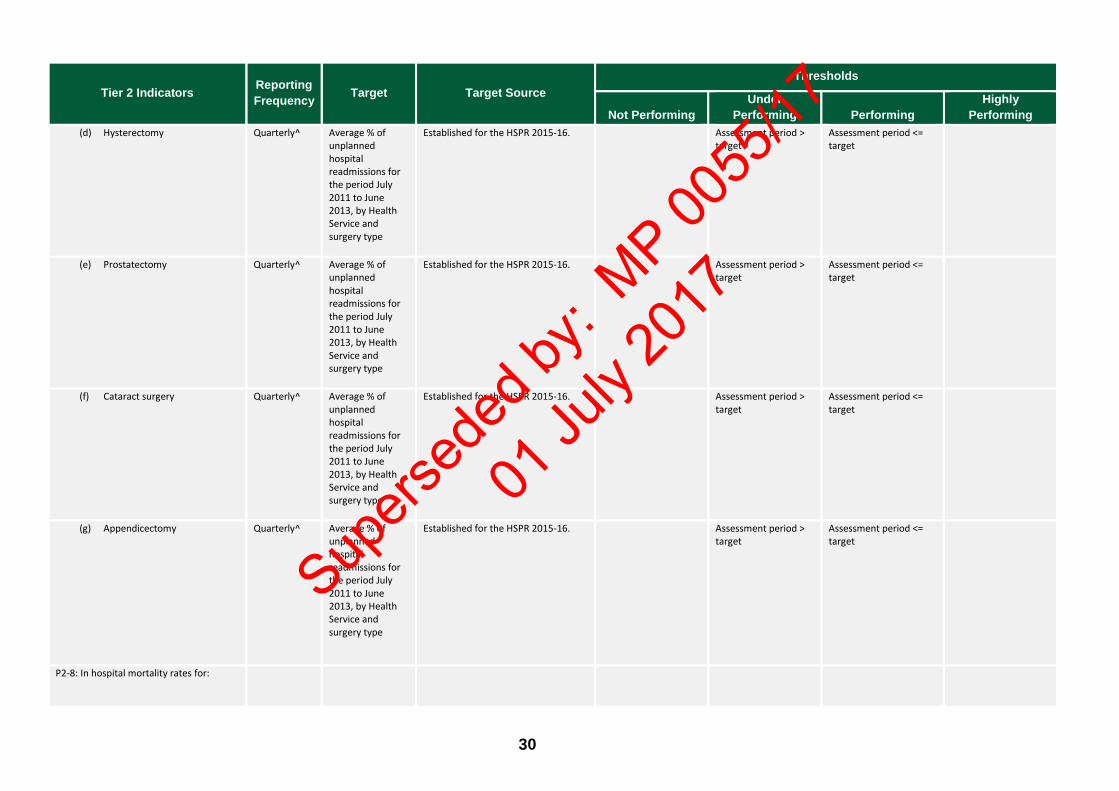
Tier 2 Indicators Reporting Frequency Target Target Source
Thresholds
Not Performing Under
Performing Performing Highly
Performing (d) Hysterectomy Quarterly^ Average % of
unplanned hospital readmissions for the period July 2011 to June 2013, by Health Service and surgery type
Established for the HSPR 2015-16. Assessment period > target
Assessment period <= target
(e) Prostatectomy Quarterly^ Average % of unplanned hospital readmissions for the period July 2011 to June 2013, by Health Service and surgery type
Established for the HSPR 2015-16. Assessment period > target
Assessment period <= target
(f) Cataract surgery Quarterly^ Average % of unplanned hospital readmissions for the period July 2011 to June 2013, by Health Service and surgery type
Established for the HSPR 2015-16. Assessment period > target
Assessment period <= target
(g) Appendicectomy
Quarterly^ Average % of unplanned hospital readmissions for the period July 2011 to June 2013, by Health Service and surgery type
Established for the HSPR 2015-16. Assessment period > target
Assessment period <= target
P2-8: In hospital mortality rates for:
Supers
eded
by: M
P 0055
/17
01 Ju
ly 20
17
31
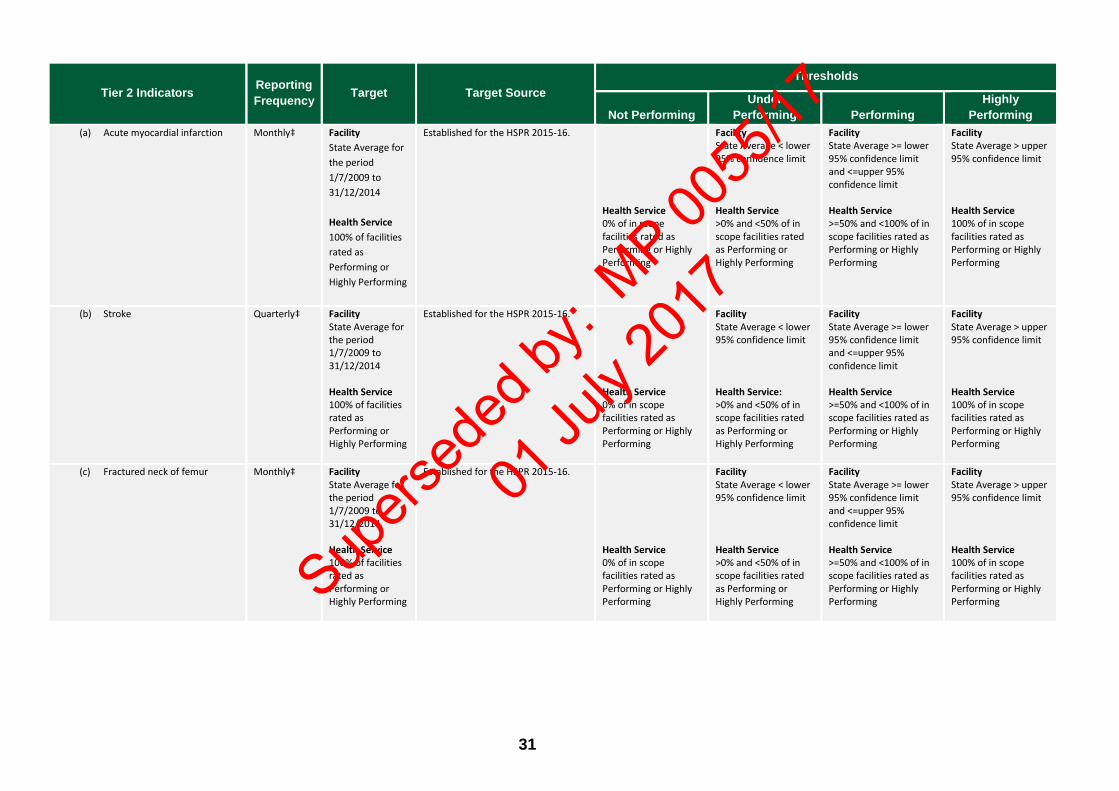
Tier 2 Indicators Reporting Frequency Target Target Source
Thresholds
Not Performing Under
Performing Performing Highly
Performing (a) Acute myocardial infarction
Monthly‡ Facility
State Average for the period 1/7/2009 to 31/12/2014 Health Service 100% of facilities rated as Performing or Highly Performing
Established for the HSPR 2015-16. Health Service 0% of in scope facilities rated as Performing or Highly Performing
Facility State Average < lower 95% confidence limit Health Service >0% and <50% of in scope facilities rated as Performing or Highly Performing
Facility State Average >= lower 95% confidence limit and <=upper 95% confidence limit Health Service >=50% and <100% of in scope facilities rated as Performing or Highly Performing
Facility State Average > upper 95% confidence limit Health Service 100% of in scope facilities rated as Performing or Highly Performing
(b) Stroke
Quarterly‡ Facility State Average for the period 1/7/2009 to 31/12/2014 Health Service 100% of facilities rated as Performing or Highly Performing
Established for the HSPR 2015-16. Health Service 0% of in scope facilities rated as Performing or Highly Performing
Facility State Average < lower 95% confidence limit Health Service: >0% and <50% of in scope facilities rated as Performing or Highly Performing
Facility State Average >= lower 95% confidence limit and <=upper 95% confidence limit Health Service >=50% and <100% of in scope facilities rated as Performing or Highly Performing
Facility State Average > upper 95% confidence limit Health Service 100% of in scope facilities rated as Performing or Highly Performing
(c) Fractured neck of femur
Monthly‡ Facility State Average for the period 1/7/2009 to 31/12/2014 Health Service 100% of facilities rated as Performing or Highly Performing
Established for the HSPR 2015-16. Health Service 0% of in scope facilities rated as Performing or Highly Performing
Facility State Average < lower 95% confidence limit Health Service >0% and <50% of in scope facilities rated as Performing or Highly Performing
Facility State Average >= lower 95% confidence limit and <=upper 95% confidence limit Health Service >=50% and <100% of in scope facilities rated as Performing or Highly Performing
Facility State Average > upper 95% confidence limit Health Service 100% of in scope facilities rated as Performing or Highly Performing Sup
ersed
ed by
: MP 00
55/17
01 Ju
ly 20
17
32
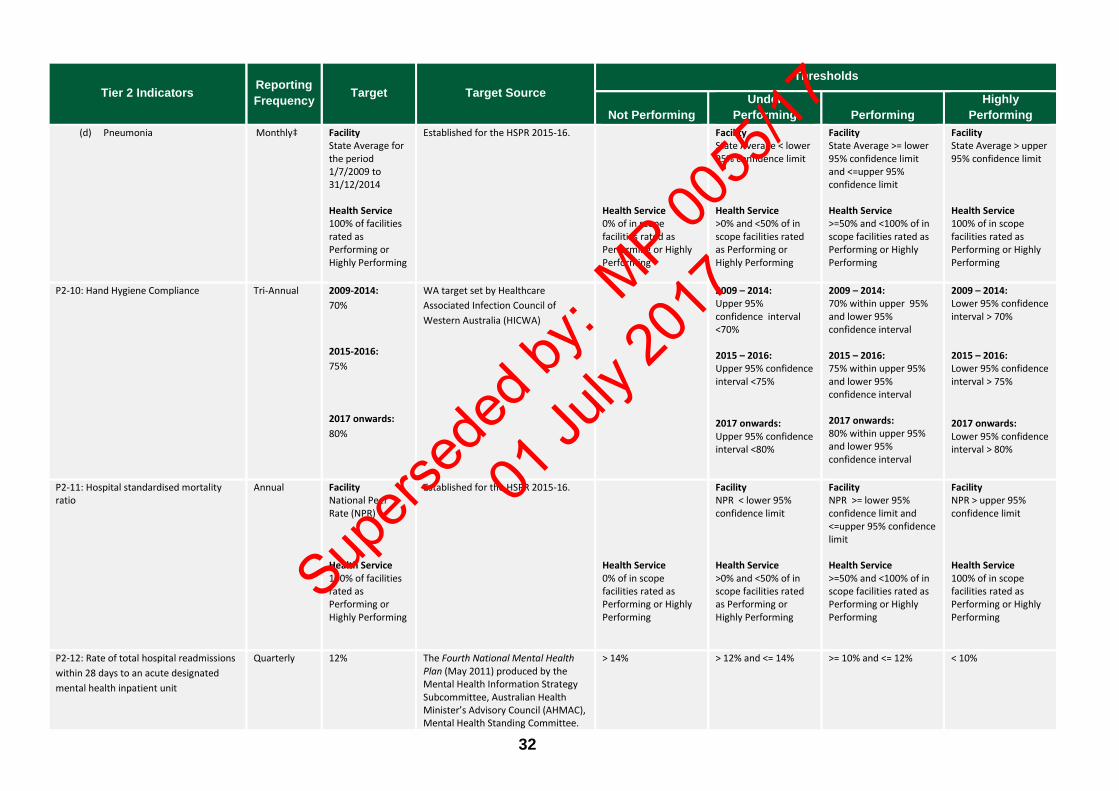
Tier 2 Indicators Reporting Frequency Target Target Source
Thresholds
Not Performing Under
Performing Performing Highly
Performing (d) Pneumonia
Monthly‡ Facility
State Average for the period 1/7/2009 to 31/12/2014 Health Service 100% of facilities rated as Performing or Highly Performing
Established for the HSPR 2015-16. Health Service 0% of in scope facilities rated as Performing or Highly Performing
Facility State Average < lower 95% confidence limit Health Service >0% and <50% of in scope facilities rated as Performing or Highly Performing
Facility State Average >= lower 95% confidence limit and <=upper 95% confidence limit Health Service >=50% and <100% of in scope facilities rated as Performing or Highly Performing
Facility State Average > upper 95% confidence limit Health Service 100% of in scope facilities rated as Performing or Highly Performing
P2-10: Hand Hygiene Compliance
Tri-Annual 2009-2014: 70%
2015-2016: 75%
2017 onwards: 80%
WA target set by Healthcare Associated Infection Council of Western Australia (HICWA)
2009 – 2014: Upper 95% confidence interval <70% 2015 – 2016: Upper 95% confidence interval <75%
2017 onwards: Upper 95% confidence interval <80%
2009 – 2014: 70% within upper 95% and lower 95% confidence interval 2015 – 2016: 75% within upper 95% and lower 95% confidence interval 2017 onwards: 80% within upper 95% and lower 95% confidence interval
2009 – 2014: Lower 95% confidence interval > 70% 2015 – 2016: Lower 95% confidence interval > 75%
2017 onwards: Lower 95% confidence interval > 80%
P2-11: Hospital standardised mortality ratio
Annual Facility National Peer Rate (NPR) Health Service 100% of facilities rated as Performing or Highly Performing
Established for the HSPR 2015-16. Health Service 0% of in scope facilities rated as Performing or Highly Performing
Facility NPR < lower 95% confidence limit Health Service >0% and <50% of in scope facilities rated as Performing or Highly Performing
Facility NPR >= lower 95% confidence limit and <=upper 95% confidence limit Health Service >=50% and <100% of in scope facilities rated as Performing or Highly Performing
Facility NPR > upper 95% confidence limit Health Service 100% of in scope facilities rated as Performing or Highly Performing
P2-12: Rate of total hospital readmissions within 28 days to an acute designated mental health inpatient unit
Quarterly 12% The Fourth National Mental Health Plan (May 2011) produced by the Mental Health Information Strategy Subcommittee, Australian Health Minister’s Advisory Council (AHMAC), Mental Health Standing Committee.
> 14%
> 12% and <= 14% >= 10% and <= 12% < 10%
Supers
eded
by: M
P 0055
/17
01 Ju
ly 20
17

33
Tier 2 Indicators Reporting Frequency Target Target Source
Thresholds
Not Performing Under
Performing Performing Highly
Performing P2-13: % of selected elective cancer surgery cases treated within boundary time:
(a) Bladder cancer
Quarterly^ 2013 calendar yr 96.3% 2014 calendar yr 98.0% 2015 calendar yr 100% 2016 calendar yr 100%
2013: Established for the Performance Management Framework 2013-14. 2014 to 2015: Established for the Performance Management Framework 2014-15. 2016 onwards: Established for the HSPR 2015-16 in consultation with Inpatient Data Collection
2013 calendar yr < 87.6% 2014 calendar yr < 87.6% 2015 calendar yr < 87.6% 2016 calendar yr < 87%
2013 calendar yr >= 87.6% and < 95.2% 2014 calendar yr >= 87.6% and < 97.2% 2015 calendar yr >= 87.6% and < 99% 2016 calendar yr >= 87% and < 99%
2013 calendar yr >= 95.2% and < 96.3% 2014 calendar yr >= 97.2% and < 98% 2015 calendar yr >= 99% and < 100% 2016 calendar yr >= 99% and < 100%
2013 calendar yr >= 96.3% 2014 calendar yr >= 98% 2015 calendar yr 100% 2016 calendar yr 100%
(b) Bowel cancer
Quarterly^ 2013 calendar yr 96.9% 2014 calendar yr 98.2% 2015 calendar yr 100% 2016 calendar yr 100%
2013: Established for the Performance Management Framework 2013-14. 2014 to 2015: Established for the Performance Management Framework 2014-15. 2016 onwards: Established for the HSPR 2015-16 in consultation with Inpatient Data Collection
2013 calendar yr < 85.9% 2014 calendar yr < 85.9% 2015 calendar yr < 85.9% 2016 calendar yr < 85%
2013 calendar yr >= 85.9% and < 95.3% 2014 calendar yr >= 85.9% and < 97.4% 2015 calendar yr >= 85.9% and < 99.1% 2016 calendar yr >= 85% and < 99%
2013 calendar yr >= 95.3% and < 96.6% 2014 calendar yr >= 97.4% and < 98.2% 2015 calendar yr >= 99.1% and < 100% 2016 calendar yr >= 99% and < 100%
2013 calendar yr >= 96.6% 2014 calendar yr >= 98.2% 2015 calendar yr 100% 2016 calendar yr 100%
(c) Breast cancer Quarterly^ 2013 calendar yr 96.9% 2014 calendar yr 98.3% 2015 calendar yr 100% 2016 calendar yr 100%
2013: Established for the Performance Management Framework 2013-14. 2014 to 2015: Established for the Performance Management Framework 2014-15. 2016 onwards: Established for the HSPR 2015-16 in consultation with Inpatient Data Collection
2013 calendar yr < 87.5% 2014 calendar yr < 87.5% 2015 calendar yr < 87.5% 2016 calendar yr < 87%
2013 calendar yr >= 87.5% and < 95.5% 2014 calendar yr >= 87.5% and < 97.6% 2015 calendar yr >= 87.5% and < 99.2% 2016 calendar yr >= 87% and < 99%
2013 calendar yr >= 95.5% and < 96.9% 2014 calendar yr >= 97.6% and < 98.3% 2015 calendar yr >= 99.2% and < 100% 2016 calendar yr >= 99% and < 100%
2013 calendar yr >= 96.9% 2014 calendar yr >= 98.3% 2015 calendar yr 100% 2016 calendar yr 100%
Supers
eded
by: M
P 0055
/17
01 Ju
ly 20
17
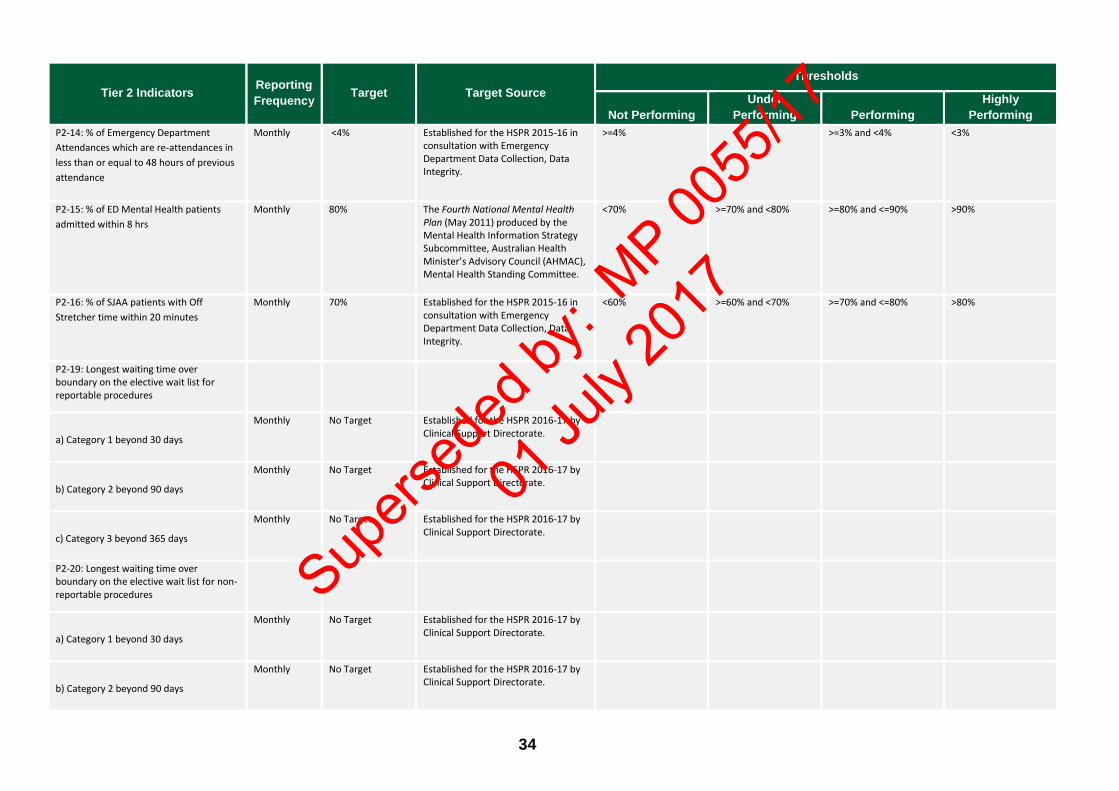
34
Tier 2 Indicators Reporting Frequency Target Target Source
Thresholds
Not Performing Under
Performing Performing Highly
Performing P2-14: % of Emergency Department Attendances which are re-attendances in less than or equal to 48 hours of previous attendance
Monthly <4% Established for the HSPR 2015-16 in consultation with Emergency Department Data Collection, Data Integrity.
>=4%
>=3% and <4% <3%
P2-15: % of ED Mental Health patients admitted within 8 hrs
Monthly 80% The Fourth National Mental Health Plan (May 2011) produced by the Mental Health Information Strategy Subcommittee, Australian Health Minister’s Advisory Council (AHMAC), Mental Health Standing Committee.
<70% >=70% and <80% >=80% and <=90% >90%
P2-16: % of SJAA patients with Off Stretcher time within 20 minutes
Monthly 70% Established for the HSPR 2015-16 in consultation with Emergency Department Data Collection, Data Integrity.
<60% >=60% and <70% >=70% and <=80% >80%
P2-19: Longest waiting time over boundary on the elective wait list for reportable procedures
a) Category 1 beyond 30 days
Monthly
No Target
Established for the HSPR 2016-17 by Clinical Support Directorate.
b) Category 2 beyond 90 days
Monthly
No Target
Established for the HSPR 2016-17 by Clinical Support Directorate.
c) Category 3 beyond 365 days
Monthly
No Target
Established for the HSPR 2016-17 by Clinical Support Directorate.
P2-20: Longest waiting time over boundary on the elective wait list for non-reportable procedures
a) Category 1 beyond 30 days
Monthly
No Target
Established for the HSPR 2016-17 by Clinical Support Directorate.
b) Category 2 beyond 90 days
Monthly
No Target
Established for the HSPR 2016-17 by Clinical Support Directorate.
Supers
eded
by: M
P 0055
/17
01 Ju
ly 20
17
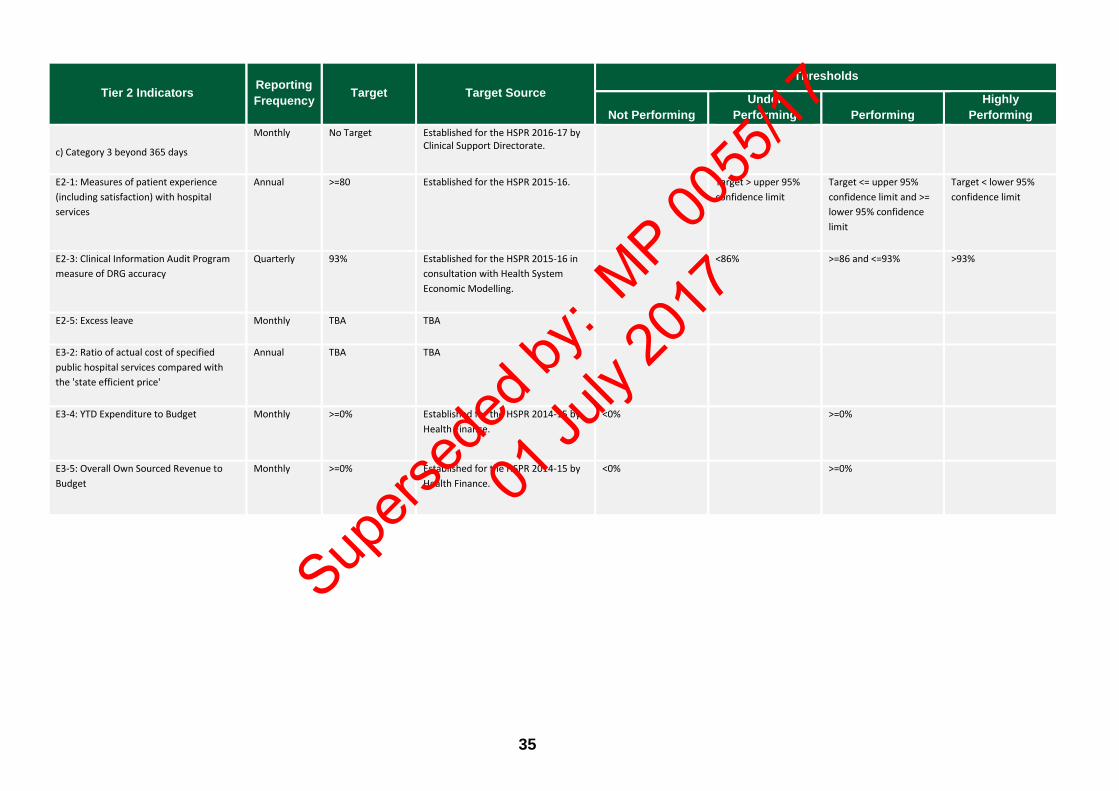
35
Tier 2 Indicators Reporting Frequency Target Target Source
Thresholds
Not Performing Under
Performing Performing Highly
Performing
c) Category 3 beyond 365 days
Monthly
No Target
Established for the HSPR 2016-17 by Clinical Support Directorate.
E2-1: Measures of patient experience (including satisfaction) with hospital services
Annual >=80
Established for the HSPR 2015-16.
Target > upper 95% confidence limit
Target <= upper 95% confidence limit and >= lower 95% confidence limit
Target < lower 95% confidence limit
E2-3: Clinical Information Audit Program measure of DRG accuracy
Quarterly 93% Established for the HSPR 2015-16 in consultation with Health System Economic Modelling.
<86% >=86 and <=93% >93%
E2-5: Excess leave
Monthly TBA TBA
E3-2: Ratio of actual cost of specified public hospital services compared with the 'state efficient price'
Annual TBA TBA
E3-4: YTD Expenditure to Budget
Monthly >=0%
Established for the HSPR 2014-15 by Health Finance.
<0%
>=0%
E3-5: Overall Own Sourced Revenue to Budget
Monthly >=0%
Established for the HSPR 2014-15 by Health Finance.
<0%
>=0%
Supers
eded
by: M
P 0055
/17
01 Ju
ly 20
17
36
Schedule 2 Interim Health Support Services Performance Report
(HSSPR) 2016-17 Performance Indicator Targets, Target Source, and Thresholds
Supers
eded
by: M
P 0055
/17
01 Ju
ly 20
17

37
Schedule 2 Health Support Services Performance Report (HSSPR) 2016-17: Performance Indicator Targets, Target Source, and Thresholds
Last updated 13 February 2017
Indicators Reporting Frequency Target Target Source
Thresholds
Not Performing Under
Performing Performing Highly
Performing E2-6: The percentage of responses from WA Health Service Providers and Department of Health who are satisfied or highly satisfied with the overall service provided by Health Support Services
Quarterly ≥ 50% Established for the Interim HSSPR 2016-17.
< Target ≥ Target
E3-9: Average cost of Accounts Payable services per transaction
Monthly TBD HSS Efficiency KPI targets are established through the annual Government Budget Statements
submission process.
> Target ≤ Target
E3-10: Average cost of Accounts Receivable services per transaction
Monthly TBD HSS Efficiency KPI targets are established through the annual Government Budget Statements
submission process.
> Target ≤ Target
E3-11: Average cost of payroll and support services to Health Support Services’ clients
Monthly TBD HSS Efficiency KPI targets are established through the annual Government Budget Statements
submission process.
> Target ≤ Target
E3-12: Average cost of Supply Services by purchasing transaction
Monthly TBD HSS Efficiency KPI targets are established through the annual Government Budget Statements
submission process.
> Target ≤ Target
E3-13: Average cost of providing ICT services to Health Support Services’ clients
Monthly TBD HSS Efficiency KPI targets are established through the annual Government Budget Statements
submission process.
> Target ≤ Target
Supers
eded
by: M
P 0055
/17
01 Ju
ly 20
17
38
Schedule 3 Interim Quadriplegic Centre Performance Report (QCPR) 2016-17 Performance Indicator Targets, Target Source, and Thresholds
Supers
eded
by: M
P 0055
/17
01 Ju
ly 20
17
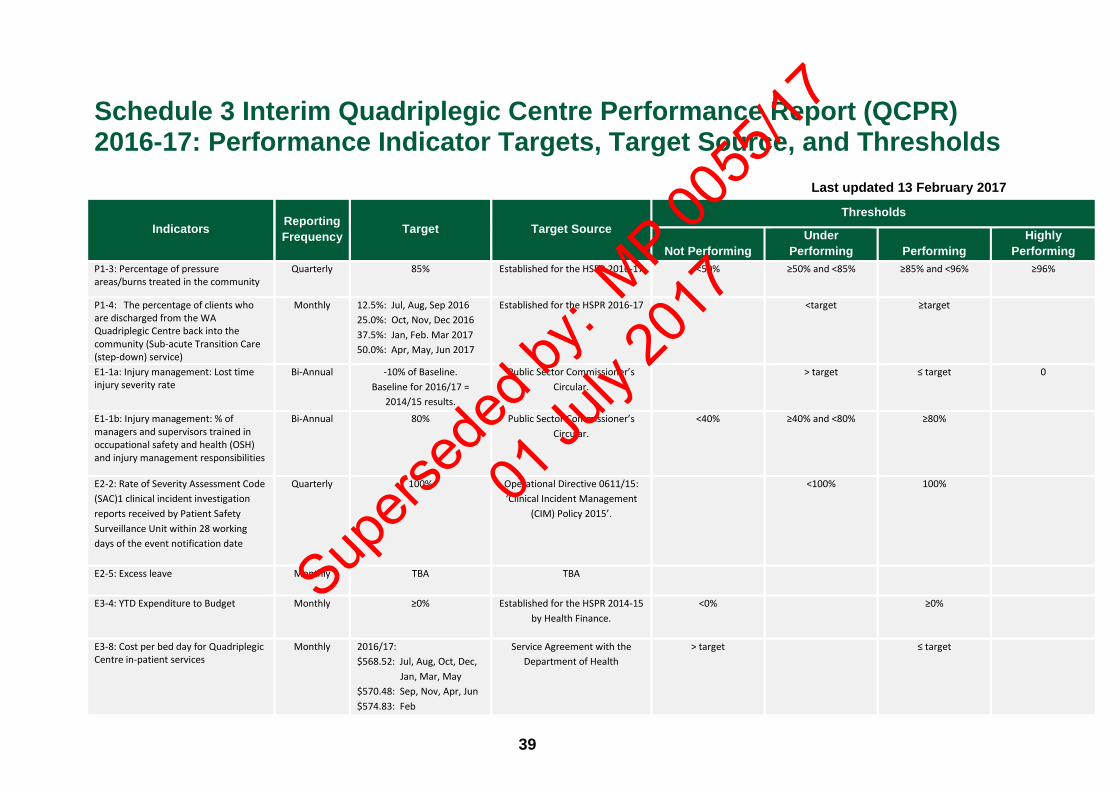
39
Schedule 3 Interim Quadriplegic Centre Performance Report (QCPR) 2016-17: Performance Indicator Targets, Target Source, and Thresholds
Last updated 13 February 2017
Indicators Reporting Frequency Target Target Source
Thresholds
Not Performing Under
Performing Performing Highly
Performing P1-3: Percentage of pressure areas/burns treated in the community
Quarterly 85% Established for the HSPR 2016-17 <50% ≥50% and <85% ≥85% and <96% ≥96%
P1-4: The percentage of clients who are discharged from the WA Quadriplegic Centre back into the community (Sub-acute Transition Care (step-down) service)
Monthly 12.5%: Jul, Aug, Sep 2016 25.0%: Oct, Nov, Dec 2016 37.5%: Jan, Feb. Mar 2017 50.0%: Apr, May, Jun 2017
Established for the HSPR 2016-17 <target ≥target
E1-1a: Injury management: Lost time injury severity rate
Bi-Annual -10% of Baseline. Baseline for 2016/17 =
2014/15 results.
Public Sector Commissioner’s Circular.
> target ≤ target 0
E1-1b: Injury management: % of managers and supervisors trained in occupational safety and health (OSH) and injury management responsibilities
Bi-Annual 80% Public Sector Commissioner’s Circular.
<40% ≥40% and <80% ≥80%
E2-2: Rate of Severity Assessment Code (SAC)1 clinical incident investigation reports received by Patient Safety Surveillance Unit within 28 working days of the event notification date
Quarterly 100% Operational Directive 0611/15: ‘Clinical Incident Management
(CIM) Policy 2015’.
<100% 100%
E2-5: Excess leave
Monthly TBA TBA
E3-4: YTD Expenditure to Budget
Monthly ≥0%
Established for the HSPR 2014-15 by Health Finance.
<0% ≥0%
E3-8: Cost per bed day for Quadriplegic Centre in-patient services
Monthly 2016/17: $568.52: Jul, Aug, Oct, Dec, Jan, Mar, May $570.48: Sep, Nov, Apr, Jun $574.83: Feb
Service Agreement with the Department of Health
> target ≤ target
Supers
eded
by: M
P 0055
/17
01 Ju
ly 20
17
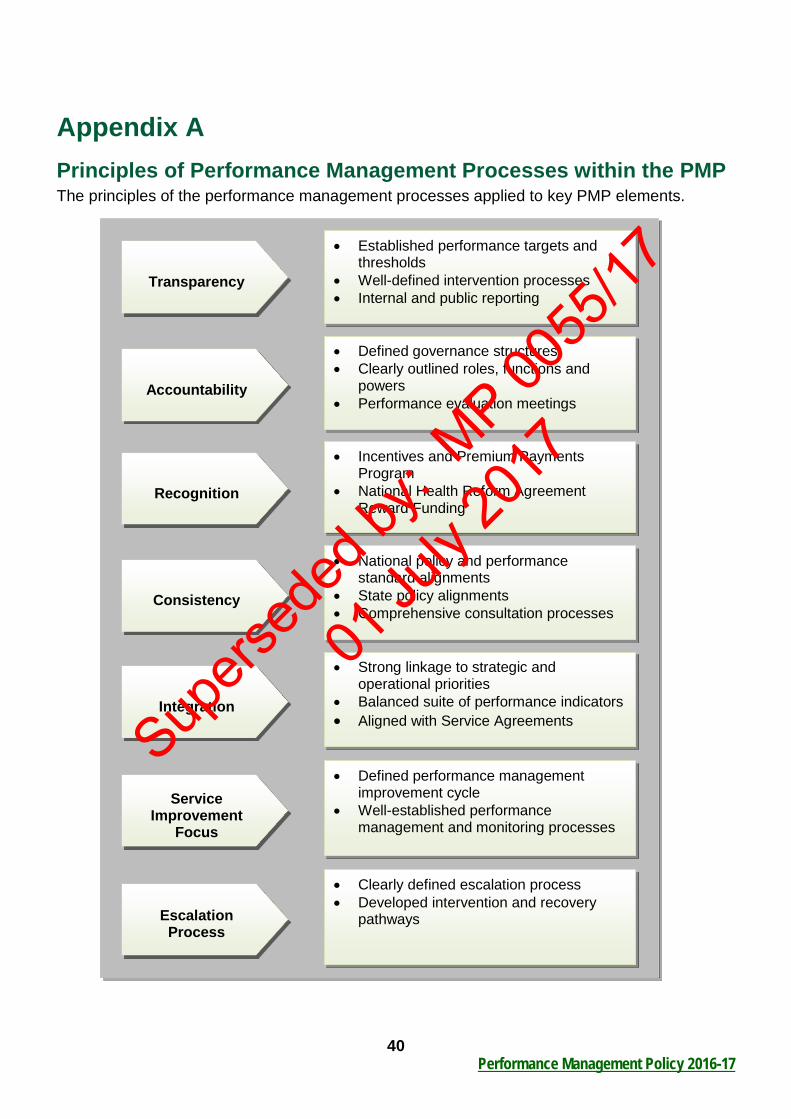
40 Performance Management Policy 2016-17
Appendix A Principles of Performance Management Processes within the PMP The principles of the performance management processes applied to key PMP elements.
• Established performance targets and thresholds
• Well-defined intervention processes • Internal and public reporting
Transparency
• Defined governance structures • Clearly outlined roles, functions and
powers • Performance evaluation meetings
Accountability
• Incentives and Premium Payments Program
• National Health Reform Agreement Reward Funding
Recognition
• National policy and performance standard alignments
• State policy alignments • Comprehensive consultation processes
Consistency
• Strong linkage to strategic and operational priorities
• Balanced suite of performance indicators • Aligned with Service Agreements
Integration
• Defined performance management improvement cycle
• Well-established performance management and monitoring processes
Service Improvement
Focus
• Clearly defined escalation process • Developed intervention and recovery
pathways
Escalation Process
Supers
eded
by: M
P 0055
/17
01 Ju
ly 20
17
41 Performance Management Policy 2016-17
Glossary Access describes how easily the community can obtain a service. Access has two main dimensions, undue delay (timeliness) and undue cost (affordability).
Appropriateness describes how well services meet client needs. Appropriateness indicators also seek to identify the extent of any under servicing or over servicing including for example separation rates for selected procedures.
Benchmarking involves the collection of performance information to undertake comparisons of performance with similar organisations.
Dashboard (Performance Dashboard) and Scorecard are terms often used synonymously. While the literature notes some subtle distinctions, in reality many organisations are referring to something similar when using both terms. A performance dashboard is a visual display, usually a single-screen, of critical information about an organisation’s performance against selected performance indicators. At the heart of any effective dashboard is the selection of relevant ‘Scorecard’ performance indicators. It should also be noted that a performance dashboard might also be referring to the Information Technology system that an organisation uses to provide performance information against performance indicators. This business technology often includes alerts, snapshots, and drill-down capability as well as the single-screen dashboard.
Data set is a collection of related data records. Data sets provided the raw information required to measure performance against a KPI. Diagnosis Related Groups (DRGs) are a patient classification system that provides a clinically meaningful way of relating the types of patients treated in a hospital to the resources required by the hospital.
Effectiveness is the term used to describe performance indicators measures of how well the outputs of a service achieve the stated objectives of that service, for example unplanned readmission rates. The reporting framework groups effectiveness indicators according to characteristics that are considered important to the service. The dimensions of effectiveness include access, appropriateness and/or quality.
Efficiency is the term used to describe overall economic efficiency, which requires satisfaction of technical, allocative and dynamic efficiency:
• Technical efficiency requires that goods and services be produced at the lowest possible cost
• Allocative efficiency requires the production of the set of goods and services that consumers value most, from a given set of resources
• Dynamic efficiency means that, over time, consumers are offered new and better products, and existing products at lower cost.
Emergency Department (ED) means the dedicated area in a hospital that is organised and administered to provide a high standard of emergency care to those in the community who perceive the need for, or are in need of acute or urgent care, including hospital admission.
Supers
eded
by: M
P 0055
/17
01 Ju
ly 20
17
42 Performance Management Policy 2016-17
Escalation usually refers to the process of ‘escalating’ poor performance results to an individual or group for intervention. Increasingly organisations are developing transparent rules-based processes that outline how an area’s performance results will be categorised; and when and how ‘under performance’ will be escalated for intervention to support performance recovery. Escalation processes are part of an organisation’s overall performance management framework.
Equity identifies the gap in service delivery outputs and outcomes between special needs groups and the general population. They will measure how well a service is meeting the needs of particular groups in society with specific needs.
Governance refers to the system by which entities are directed and controlled. This will encompass the processes, procedures and systems that have been put in place to ensure that organisations are managed appropriately. This can relate to clinical systems in Clinical Governance or corporate systems in Corporate Governance. An effective governance system ensures the integration of both system components.
Healthcare Infection Surveillance Western Australia is a program that provides a collection of key healthcare associated infection data and reports for all public hospitals and licensed private healthcare facilities that provide services for public patients in Western Australia.
Health Service Performance Report is a report that refocuses performance expectations around a core set of performance indicators that underpin an effective purchaser provider relationship.
Key Performance Indicator (KPI) is a measure that provides an ‘indication’ of progress towards achieving the organisation’s objectives. KPI usually have targets attached that define the level of performance expected against the KPI. KPI are open to audit by the WA Auditor General. Operational plans cascade from the organisation’s strategic plan and outline how each Division and Health Service Providers will contribute to the organisation’s objectives.
Organisational objectives are outlined in the Strategic Intent and are long term goals achieved over a number of years. The objectives should align with Government ambitions and targets and incorporate other commitments made through Intergovernmental Agreements and National Partnership Agreements.
Outcome describes those indicators that provide information on the impact of a service on the status of an individual or a group, and on the success of the service area in achieving its objectives.
Outputs describe the actual services delivered.
Performance Indicator provides an ‘indication’ of progress towards achieving the organisation’s objectives or outputs.
Performance Management is the management and governance system that regulates and addresses poor performance.
Performance Standards are the establishment of relevant targets and thresholds to monitor performance.
Supers
eded
by: M
P 0055
/17
01 Ju
ly 20
17
43 Performance Management Policy 2016-17
Performance Thresholds are the clearly defined limits at which a performance indicator measurement will trigger an action, response or intervention.
Personal Performance Agreement (PA) identifies and documents the key accountabilities of WA Health Executives (SHEF members). It is the key accountability document between WA Health Executives and the Director General, and sets the agenda for the coming year.
Quality describes the extent to which a service is suited to its purpose and conforms to specifications including for example service accreditation to a defined standard.
Recovery Plan is a plan put in place to remediate poor performance.
Scorecard – see Dashboard.
Service Agreement (SA) is the annual Agreement between the Director General of the Department of Health and the Health Service Providers. The agreement will include a Statement of Priorities directing policy, service targets, budgets and performance measures as performance indicators.
State Health Executive Forum (SHEF) is the principal advisory body to the Director General and assists the Director General to manage the WA Government Health System through discussion of, and provision of advice to the Director General on strategic service, policy and administrative issues.
Statistical validity is a statistical term used to describe the extent of accuracy of a concept, conclusion or measurement.
Targets for performance indicators are generally established and agreed as part of the Executive’s annual PA. Targets are based on current government priorities and commitments, historical performance and trends, agency capability and consumer demand. Targets maybe expressed as absolute numbers, ratios, and percentages; or as a range (such as 75% to 85%, rather than just a single figure of 80%). Targets should be challenging but achievable.
Trends are changes in performance data that form a pattern over time.
WA health system refers to the public health system in WA, which is funded directly or indirectly by the WA Department of Health.
Supers
eded
by: M
P 0055
/17
01 Ju
ly 20
17
44 Performance Management Policy 2016-17
References Department of Health. (2015). WA Health Strategic Intent 2015-2020, Department of Health, Perth. Available from: http://intranet.health.wa.gov.au/. Department of Health. (2015). Report on Consultation for the Draft Performance Management Framework 2015-16, Purchasing and System Performance Division, Department of Health, Perth. Available from: http://intranet.health.wa.gov.au/performance/services/bi_is.cfm Department of Health. (2015). WA Health Strategic Intent 2015-2020, Department of Health, Perth. Available from: http://ww2.health.wa.gov.au/~/media/Files/Corporate/general%20documents/About%20WA%20Health/wa_health_strategic_intent14052015.ashx Department of Health. (2015). WA Aboriginal Health and Wellbeing Framework 2015-2030 Aboriginal Health Policy Directorate, Department of Health, Perth. Available from: http://ww2.health.wa.gov.au/Improving-WA-Health/About-Aboriginal-Health Department of Health. (2014). ABF/M Performance Management Strategic Directions 2014-15 and Beyond Consultation Framework, Performance Directorate, Department of Health, Perth. Department of Health. (2014). Western Australian Strategic Plan for Safety and Quality in Health Care 2013-2017, Performance Directorate, Department of Health, Perth. Available from: http://www.safetyandquality.health.wa.gov.au/docs/WASafetyandQualityStrategicPlan2013-2017.pdf Department of Health. (2014). Guidelines for Managing Statewide Reporting Definitions, Department of Health, Perth. Available from: http://www.health.wa.gov.au/circularsnew/attachments/952.pdf Department of Health. (2013). Developing Performance Indicators – Information Package, Department of Health, Perth. Available from: http://ww2.health.wa.gov.au/~/media/Files/Corporate/general%20documents/Performance/PDF/Developing_Performance_Indicators_Information_Package.ashx Council of Australian Governments. (2011). National Health Reform Agreement, Commonwealth of Australia, Canberra. Available from: http://www.coag.gov.au/agreements_and_reports. Department of Health. (2010). WA Health Clinical Services Framework 2014- 2024, Innovation and Health System Reform Division, Department of Health, Perth. Available from: www.health.wa.gov.au
Supers
eded
by: M
P 0055
/17
01 Ju
ly 20
17

This document can be made available in alternative formats on request for a person with a disability.
© Department of Health 2016
Copyright to this material is vested in the State of Western Australia unless otherwise indicated. Apart from any fair dealing for the purposes of private study, research, criticism or review, as permitted under the provisions of the Copyright Act 1968, no part may be reproduced or re-used for any purposes whatsoever without written permission of the State of Western Australia.
Supers
eded
by: M
P 0055
/17
01 Ju
ly 20
17