Embed Size (px)
Citation preview
Report June 2012
Performance Management:Turning Individual Stress to
Organizational Strategy
Human ResouRce management
PrefacePerformance management is practiced almost univer-
sally among Canadian organizations. This report looks
at current practices in performance management based
on data from The Conference Board of Canada’s 2012
Compensation Planning Outlook survey of 381 pre-
dominantly large and medium-sized organizations. It
also features five case studies of organizations that have
challenged themselves to improve their performance
management systems. Finally, it discusses potential
roadblocks to and tips for creating an effective per-
formance management system.
Performance Management: Turning Individual Stress to Organizational Strategy
by Nicole Stewart
About The Conference Board of CanadaWe are:
� The foremost independent, not-for-profit, applied
research organization in Canada.
� Objective and non-partisan. We do not lobby
for specific interests.
� Funded exclusively through the fees we charge
for services to the private and public sectors.
� Experts in running conferences but also at con-
ducting, publishing, and disseminating research;
helping people network; developing individual
leadership skills; and building organizational
capacity.
� Specialists in economic trends, as well
as organizational performance and public
policy issues.
� Not a government department or agency,
although we are often hired to provide
services for all levels of government.
� Independent from, but affiliated with, The
Conference Board, Inc. of New York, which
serves nearly 2,000 companies in 60 nations
and has offices in Brussels and Hong Kong.
©2012 the conference Board of canada*Published in Canada • All rights reservedAgreement No. 40063028*Incorporated as AERIC Inc.
Forecasts and research often involve numerous assumptions and data sources, and are subject to inherent risks and uncertainties. This information is not intended as specific investment, accounting, legal, or tax advice.
For the exclusive use of University of Ottawa.
contents
executive summary . . . . . . . . . . . . . . . . . . . . . . . . . . . . . . . . . . . . . . . . . . . . . . . . . . . . . . . . . . . . . . . . i
chapter 1—Performance Management Systems and Appraisals. . . . . . . . . . . . . . . . . . . . . . . . . . . . . . . . . . . . . . . . 1Appraisals 101 . . . . . . . . . . . . . . . . . . . . . . . . . . . . . . . . . . . . . . . . . . . . . . . . . . . . . . . . . . . . . . . . . . . . . . . . . . . . . . 1
Getting the Full Perspective: 360s and Multi-Source Feedback . . . . . . . . . . . . . . . . . . . . . . . . . . . . . . . . . . . . . . . . 3
Appraising Yourself . . . . . . . . . . . . . . . . . . . . . . . . . . . . . . . . . . . . . . . . . . . . . . . . . . . . . . . . . . . . . . . . . . . . . . . . . . 3
chapter 2—Processes and Implementation. . . . . . . . . . . . . . . . . . . . . . . . . . . . . . . . . . . . . . . . . . . . . . . . . . . . . . . . 5Performance Discussions: Finding the Time. . . . . . . . . . . . . . . . . . . . . . . . . . . . . . . . . . . . . . . . . . . . . . . . . . . . . . . 5
Automated or Paper-Based? . . . . . . . . . . . . . . . . . . . . . . . . . . . . . . . . . . . . . . . . . . . . . . . . . . . . . . . . . . . . . . . . . . . 5
How Many Rating Levels Are Enough? . . . . . . . . . . . . . . . . . . . . . . . . . . . . . . . . . . . . . . . . . . . . . . . . . . . . . . . . . . 6
Forcing a Distribution . . . . . . . . . . . . . . . . . . . . . . . . . . . . . . . . . . . . . . . . . . . . . . . . . . . . . . . . . . . . . . . . . . . . . . . . 8
Removing Subjectivity: Calibrating Appraisals . . . . . . . . . . . . . . . . . . . . . . . . . . . . . . . . . . . . . . . . . . . . . . . . . . . . 9
Helping Managers With Performance Management . . . . . . . . . . . . . . . . . . . . . . . . . . . . . . . . . . . . . . . . . . . . . . . . . 9
chapter 3—Rewarding Performance and Talent Management. . . . . . . . . . . . . . . . . . . . . . . . . . . . . . . . . . . . . . . . . 12The Role of Performance Management in Managing Talent . . . . . . . . . . . . . . . . . . . . . . . . . . . . . . . . . . . . . . . . . 13
Turning Employee Performance Around. . . . . . . . . . . . . . . . . . . . . . . . . . . . . . . . . . . . . . . . . . . . . . . . . . . . . . . . . 14
chapter 4—Evaluation: What’s Working, What’s Not . . .. . . . . . . . . . . . . . . . . . . . . . . . . . . . . . . . . . . . . . . . . . . . . 16Effectiveness of Systems . . . . . . . . . . . . . . . . . . . . . . . . . . . . . . . . . . . . . . . . . . . . . . . . . . . . . . . . . . . . . . . . . . . . . 16
Roadblocks to Effectiveness . . . . . . . . . . . . . . . . . . . . . . . . . . . . . . . . . . . . . . . . . . . . . . . . . . . . . . . . . . . . . . . . . . 16
Keys to Success . . . . . . . . . . . . . . . . . . . . . . . . . . . . . . . . . . . . . . . . . . . . . . . . . . . . . . . . . . . . . . . . . . . . . . . . . . . . 17
Conclusion . . . . . . . . . . . . . . . . . . . . . . . . . . . . . . . . . . . . . . . . . . . . . . . . . . . . . . . . . . . . . . . . . . . . . . . . . . . . . . . . 17
appendix a—Bibliography . . . . . . . . . . . . . . . . . . . . . . . . . . . . . . . . . . . . . . . . . . . . . . . . . . . . . . . . . . . . . . . . . . . . 19
appendix B—Respondent Profile. . . . . . . . . . . . . . . . . . . . . . . . . . . . . . . . . . . . . . . . . . . . . . . . . . . . . . . . . . . . . . . 21
appendix c—Participating Organizations . . . . . . . . . . . . . . . . . . . . . . . . . . . . . . . . . . . . . . . . . . . . . . . . . . . . . . . . 22
© The Conference Board of Canada. All rights reserved. Please contact cboc.ca/ip with questions or concerns about the use of this material.
acknowledgementsThe author gratefully acknowledges the feedback and guidance provided by her Conference Board colleagues Allison Cowan, Barb Hogberg, and Karla Thorpe.
She also thanks François Pinsonnault of Bell Canada and Ryan Smith of the Saskatchewan Public Service Commission for their insights and review.
Thank you to all those who took part in our 2012 Compensation Planning Outlook, and a special thank you to those who agreed to participate in the in-depth interviews for our case studies. It is through the contribution of these organ-izations that we are able to conduct this type of research.
The Conference Board of Canada is solely responsible for the contents of this document, including any errors or omissions.
For the exclusive use of University of Ottawa.
Find this report and other Conference Board research at www .e-library .ca
The overall success of an organization and how
well its employees perform are directly related.
Performance management, the “continuous
process of identifying, measuring and developing the
performance of individuals and teams and aligning per-
formance with the strategic goals of the organization,”1
1 Gravina and Siers, “Square Pegs and Round Holes,” 281.
is undertaken almost universally among large and
medium-sized organizations. This includes the often-
stressful annual appraisal meeting.
Some question the effectiveness of formal performance
appraisals as a tool to drive employee performance. While
there are different ways to motivate performance, for-
malized performance appraisals play an integral role for
many organizations and are often key to substantiating
merit-related pay increases. Performance appraisals are
a good opportunity for managers to have a discussion
with employees, track progress, hone job responsibilities,
and address performance concerns.
Formalized performance appraisals play an integral role for many organizations and are often key to substantiating merit-related pay increases .
According to the results of The Conference Board of
Canada’s 2012 Compensation Planning Outlook, con-
ducted over the summer of 2011, almost all organizations
(97 per cent) include individual goals and objectives in
their performance appraisals. Appraisals also commonly
include ratings of employees’ competencies and track
employees’ training and development.
Performance Management:Turning Individual Stress to Organizational Strategy
executive summaRy
at a glance � Most Canadian organizations have perform-
ance management systems and appraisals.
� Seventy-eight per cent of organizations link base pay to performance, and 56 per cent link their short-term incentive pay plan to performance.
� Organizations struggle with ensuring their performance management systems are fair and consistent. Calibration and multi-source feedback are effective in keeping performance evaluations objective.
� Employees and managers need to be held accountable for performance management. Organizations can help engage employees by having a well-communicated, user-friendly performance management system.
© The Conference Board of Canada. All rights reserved. Please contact cboc.ca/ip with questions or concerns about the use of this material.
ii | Performance Management—June 2012
Find this report and other Conference Board research at www .e-library .ca
To evaluate employees’ performance, over half of
organizations (54 per cent) use a five-level appraisal
rating system, one-quarter use a four-level system, and
15 per cent use a three-level system. Multi-source feed-
back, such as 360-degree evaluations, is used by 49 per
cent of organizations. Calibration—a process where
executives/managers meet to discuss the appraisals of
employees with similar responsibilities—is one way
through which organizations can remove some of the
subjectivity from their performance ratings. Fifty-one
per cent of organizations have some type of calibration
process in place.
over three-quarters of organizations (78 per cent) link base pay to performance and 56 per cent link their short-term incentive plan to performance .
In order for organizations to maximize the effectiveness
of their performance management systems, managers
require training. Managers should be able to help their
employees set appropriate goals and objectives, and they
need to understand what constitutes a “meets” or “exceeds”
expectations rating. Managers should feel equipped to
provide useful feedback and help employees on their
career path. Sixty-one per cent of organizations provide
managers with training on how to manage employees’
performance.
Many organizations struggle to reward high performers
in a significant way while making sure not to alienate
their solid performers—who make up the bulk of their
workforce. When salary increases average 3 per cent of
base pay, meaningful differentiation based on perform-
ance can be challenging. That said, over three-quarters
of organizations (78 per cent) link base pay to perform-
ance and 56 per cent link their short-term incentive plan
to performance.
This report features case studies of organizations that
have challenged themselves to improve their perform-
ance management process. They are a diverse group,
representing organizations of different industries, sec-
tors, and sizes from across Canada. The case studies
include the following:
� “From Six Systems to One: Centralizing and
Automating Performance Management at Bell aliant”
� “Bc cancer Foundation: New Focus Leads to
Increased Performance”
� “export Development canada: Communicating
Change in a Demanding Workplace Culture”
� “Pratt & Whitney canada: Nurturing High Performers”
� “From Results to Behaviours: A New Way of
Thinking About Employee Performance at BP canada”
Organizations make substantial investments—in both
time and money—in their performance management
systems, yet less than half are confident their systems
are effective. Organizations continue to struggle most
with subjectivity, consistency, and fairness. In increasingly
busy workplaces, it is a challenge to submit appraisals
on time, let alone make time for meaningful conversation.
Complex or archaic tools, technology, and platforms
further hinder the task.
Organizations with effective performance management
systems often point to the clarity of the process and
usability of the tools as key success factors. An organiza-
tion-level calibration exercise of proposed employee
ratings is a highly effective way for management to
ensure broader fairness across the organization, as it
serves to balance out the tough-rating managers with
those who are more lenient.
Employee buy-in is critical. An effective performance
management system is one where employees and man-
agers are held equally accountable for all aspects of
performance management, including creating strong
goals, evaluating accomplishments, and following through
on development opportunities. Organizations can aid in
this process by ensuring the appraisal process is clear
and the importance of participation is well understood.
By creating a system with mutual accountability, employ-
ees have a degree of ownership in their careers.
For the exclusive use of University of Ottawa.
Find this report and other Conference Board research at www .e-library .ca
Performance management is undertaken almost
universally among large and medium-sized
organizations. Overall, a total of 96 per cent of
organizations report having a performance management
system in place. And no matter how employees and
managers may feel about them, for almost all organiza-
tions the performance management system includes the
often-stressful performance appraisal.
The terms performance management and performance
appraisal are often used interchangeably, but they are
distinct. A performance appraisal is a mechanism to look
at how an employee performs and track accomplishments
over a specific period of time. Appraisals typically include
goals or objectives against which the employee’s man-
ager can evaluate the individual’s performance and are
often linked to merit increases. Performance manage-
ment goes beyond the appraisal. It is the “continuous
process of identifying, measuring and developing the
performance of individuals and teams and aligning per-
formance with the strategic goals of the organization.”1
Usually, performance appraisals are a main component
of the greater performance management process.
aPPRaisals 101
So what does a typical performance appraisal involve?
Almost all organizations (97 per cent) include individ-
ual goals and objectives in their performance appraisals.
(See Table 1.) Training and professional development
(70 per cent) and competencies (69 per cent) are also
commonly found in appraisals.
1 Gravina and Siers, “Square Pegs and Round Holes,” 281.
Performance Management Systems and Appraisals
cHaPteR 1
chapter summary � Performance management systems are com-
mon in Canadian organizations, and almost all systems include performance appraisals.
� Goal setting is an integral part of most organ-izations’ performance appraisal cycle. While the majority of organizations include goals and objectives as part of their appraisals, less than half require that they be quantitatively measur-able. Goals should be relevant to the organiza-tion as well as to the employee.
� Just under half of organizations use multi-source feedback when conducting perform-ance appraisals. Some of the ways in which organizations collect multi-source data include 360-degree evaluations and feedback from both external and internal customers.
� More than 4 out of 10 unionized organizations have a performance management system in place for all their unionized employees.
© The Conference Board of Canada. All rights reserved. Please contact cboc.ca/ip with questions or concerns about the use of this material.
2 | Performance Management—June 2012
Find this report and other Conference Board research at www .e-library .ca
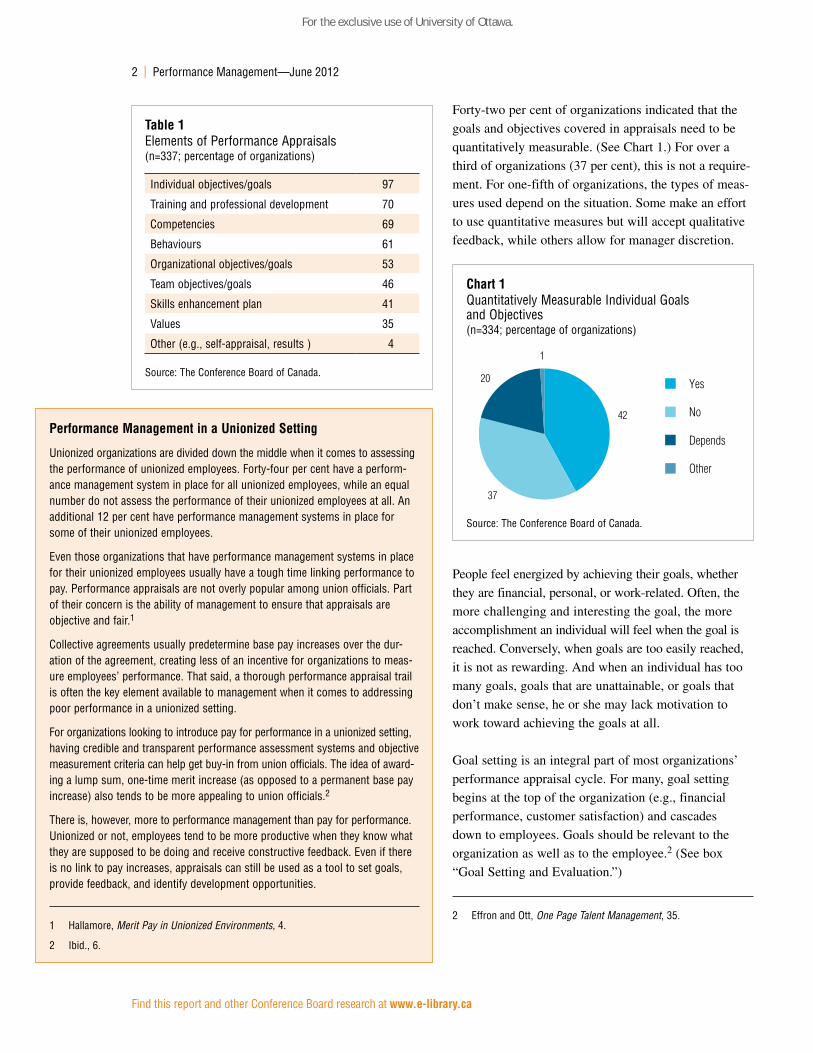
Forty-two per cent of organizations indicated that the
goals and objectives covered in appraisals need to be
quantitatively measurable. (See Chart 1.) For over a
third of organizations (37 per cent), this is not a require-
ment. For one-fifth of organizations, the types of meas-
ures used depend on the situation. Some make an effort
to use quantitative measures but will accept qualitative
feedback, while others allow for manager discretion.
People feel energized by achieving their goals, whether
they are financial, personal, or work-related. Often, the
more challenging and interesting the goal, the more
accomplishment an individual will feel when the goal is
reached. Conversely, when goals are too easily reached,
it is not as rewarding. And when an individual has too
many goals, goals that are unattainable, or goals that
don’t make sense, he or she may lack motivation to
work toward achieving the goals at all.
Goal setting is an integral part of most organizations’
performance appraisal cycle. For many, goal setting
begins at the top of the organization (e.g., financial
performance, customer satisfaction) and cascades
down to employees. Goals should be relevant to the
organization as well as to the employee.2 (See box
“Goal Setting and Evaluation.”)
2 Effron and Ott, One Page Talent Management, 35.
Performance management in a unionized setting
Unionized organizations are divided down the middle when it comes to assessing the performance of unionized employees. Forty-four per cent have a perform-ance management system in place for all unionized employees, while an equal number do not assess the performance of their unionized employees at all. An additional 12 per cent have performance management systems in place for some of their unionized employees.
Even those organizations that have performance management systems in place for their unionized employees usually have a tough time linking performance to pay. Performance appraisals are not overly popular among union officials. Part of their concern is the ability of management to ensure that appraisals are objective and fair.1
Collective agreements usually predetermine base pay increases over the dur-ation of the agreement, creating less of an incentive for organizations to meas-ure employees’ performance. That said, a thorough performance appraisal trail is often the key element available to management when it comes to addressing poor performance in a unionized setting.
For organizations looking to introduce pay for performance in a unionized setting, having credible and transparent performance assessment systems and objective measurement criteria can help get buy-in from union officials. The idea of award-ing a lump sum, one-time merit increase (as opposed to a permanent base pay increase) also tends to be more appealing to union officials.2
There is, however, more to performance management than pay for performance. Unionized or not, employees tend to be more productive when they know what they are supposed to be doing and receive constructive feedback. Even if there is no link to pay increases, appraisals can still be used as a tool to set goals, provide feedback, and identify development opportunities.
1 Hallamore, Merit Pay in Unionized Environments, 4.
2 Ibid., 6.
table 1Elements of Performance Appraisals(n=337; percentage of organizations)
Individual objectives/goals 97
Training and professional development 70
Competencies 69
Behaviours 61
Organizational objectives/goals 53
Team objectives/goals 46
Skills enhancement plan 41
Values 35
Other (e.g., self-appraisal, results ) 4
Source: The Conference Board of Canada.
chart 1Quantitatively Measurable Individual Goals and Objectives(n=334; percentage of organizations)
Source: The Conference Board of Canada.
42
37
20
1
Yes
No
Depends
Other
For the exclusive use of University of Ottawa.
The Conference Board of Canada | 3
Find this report and other Conference Board research at www .e-library .ca
There is much debate on the effectiveness of appraisals
to drive employee performance. But, while there may
be better ways to motivate performance, performance
appraisals play an important role for many organizations.
Performance appraisals are a good opportunity for the
manager and employee to have a discussion, track
progress, clarify job responsibilities, address perform-
ance concerns, and document the conversation.
completing the annual appraisal form is important, but equally so is the quality of the employee– manager conversation .
If appraisals are forgotten as soon as they are signed,
they are probably not making much of a contribution
to employee or organizational performance. In order to
inject meaning into their systems, organizations need to
view performance appraisals as a fundamental require-
ment, with managers and employees buying into the pro-
cess with accountability and ownership. While having
employees complete the annual performance appraisal
process is important, the quality of the conversation is
equally valuable.
getting tHe Full PeRsPective: 360s anD multi-souRce FeeDBack
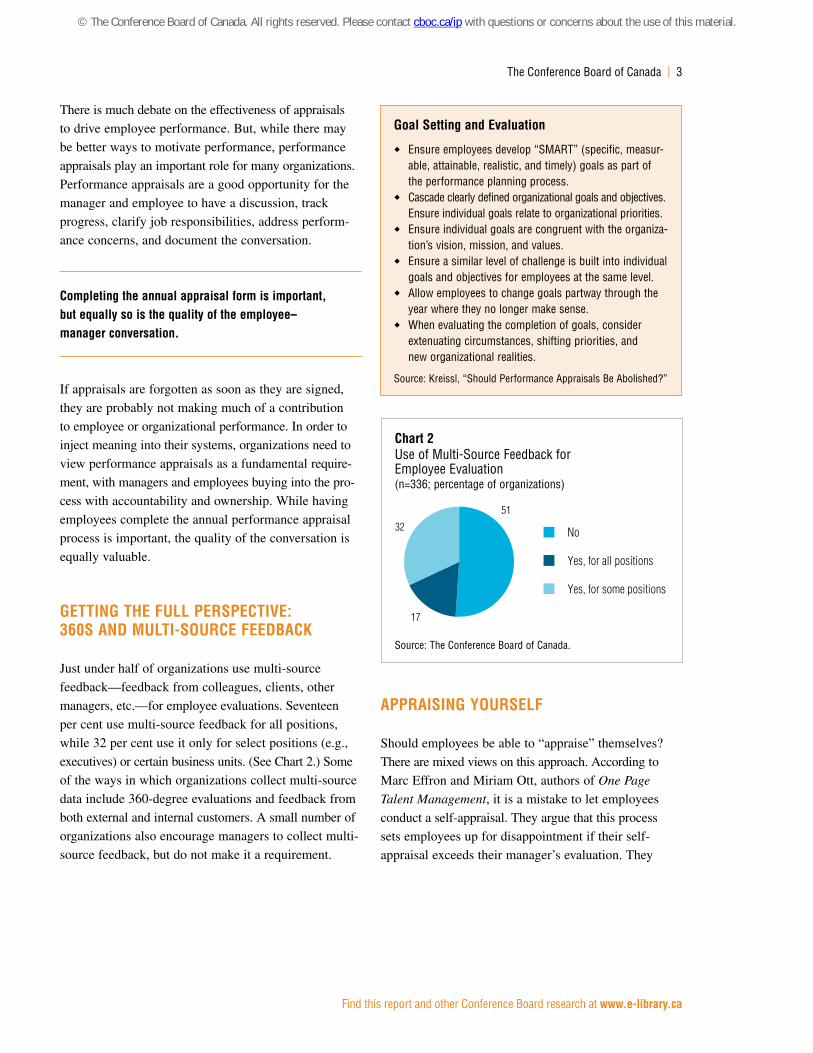
Just under half of organizations use multi-source
feedback—feedback from colleagues, clients, other
managers, etc.—for employee evaluations. Seventeen
per cent use multi-source feedback for all positions,
while 32 per cent use it only for select positions (e.g.,
executives) or certain business units. (See Chart 2.) Some
of the ways in which organizations collect multi-source
data include 360-degree evaluations and feedback from
both external and internal customers. A small number of
organizations also encourage managers to collect multi-
source feedback, but do not make it a requirement.
aPPRaising youRselF
Should employees be able to “appraise” themselves?
There are mixed views on this approach. According to
Marc Effron and Miriam Ott, authors of One Page
Talent Management, it is a mistake to let employees
conduct a self-appraisal. They argue that this process
sets employees up for disappointment if their self-
appraisal exceeds their manager’s evaluation. They
goal setting and evaluation
� Ensure employees develop “SMART” (specific, measur-able, attainable, realistic, and timely) goals as part of the performance planning process.
� Cascade clearly defined organizational goals and objectives. Ensure individual goals relate to organizational priorities.
� Ensure individual goals are congruent with the organiza-tion’s vision, mission, and values.
� Ensure a similar level of challenge is built into individual goals and objectives for employees at the same level.
� Allow employees to change goals partway through the year where they no longer make sense.
� When evaluating the completion of goals, consider extenuating circumstances, shifting priorities, and new organizational realities.
Source: Kreissl, “Should Performance Appraisals Be Abolished?”
chart 2Use of Multi-Source Feedback for Employee Evaluation(n=336; percentage of organizations)
Source: The Conference Board of Canada.
51
17
32 No
Yes, for all positions
Yes, for some positions
© The Conference Board of Canada. All rights reserved. Please contact cboc.ca/ip with questions or concerns about the use of this material.
4 | Performance Management—June 2012
Find this report and other Conference Board research at www .e-library .ca
believe that, in the end, the appraisal should reflect the
manager’s evaluation of the employee’s performance.3
Others argue that conducting a self-appraisal is a good
opportunity for employees to reflect on what they have
accomplished.
Whether or not organizations encourage employees to
rate themselves on their accomplishments, most employ-
ees should enter an appraisal meeting with a fairly good
idea of what they have accomplished. Dick Grote, a well-
known expert and consultant in the performance man-
agement field, also advises against having employees
conduct a self-appraisal. Instead, he suggests that
employees send their managers a list of their most
important accomplishments.4 Having a list of these
accomplishments can serve as a good foundation to
begin the performance management dialogue and
ensure no achievements are overlooked.
3 Effron and Ott, One Page Talent Management, 44.
4 Grote, “Let’s Abolish Self-Appraisal.”
abandoning appraisals
A handful of organizations have elected to abandon performance appraisals altogether. One school of thought believes that appraisals do little to motivate per-formance, and can even hamper it. Dr. Aubrey C. Daniels is a strong advocate of abandoning appraisals; in his opinion, they are an unnecessary process that fails to encourage performance. He argues that organizations should instead focus on employee behaviours. In his view, it is by influencing behaviours that organizations can really drive performance.
Dr. Daniel’s model looks at “behavioural consequences” that affect the probability that behaviour will be repeated in the future. According to Daniels, one of the best ways to encourage performance is to identify behaviours that produce positive outcomes and positively reinforce them. Similarly, organizations should look at behaviours that are producing poor outcomes and arrange consequences to stop them.
His model identifies six types of consequences that can influence an employee’s behaviour: positive or negative; immediate or future; and certain or uncertain. Consequences that are positive, immediate, and certain (PICs) tend to be the most effective at encouraging a behaviour, just as those that are negative, immediate, and certain (NICs) are major deterrents.
Sources: Daniels, Bringing Out the Best in People; The Conference Board of Canada.
For the exclusive use of University of Ottawa.
Find this report and other Conference Board research at www .e-library .ca
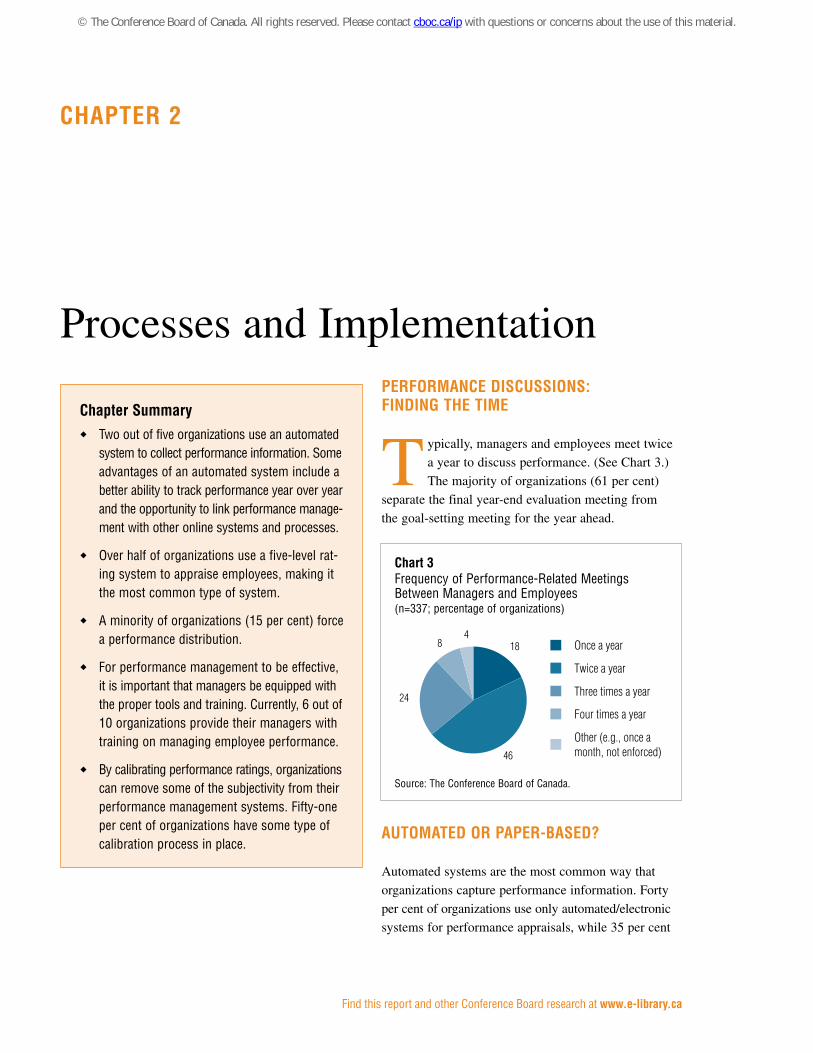
PeRFoRmance Discussions: FinDing tHe time
Typically, managers and employees meet twice
a year to discuss performance. (See Chart 3.)
The majority of organizations (61 per cent)
separate the final year-end evaluation meeting from
the goal-setting meeting for the year ahead.
automateD oR PaPeR-BaseD?
Automated systems are the most common way that
organizations capture performance information. Forty
per cent of organizations use only automated/electronic
systems for performance appraisals, while 35 per cent
Processes and Implementation
cHaPteR 2
chapter summary � Two out of five organizations use an automated
system to collect performance information. Some advantages of an automated system include a better ability to track performance year over year and the opportunity to link performance manage-ment with other online systems and processes.
� Over half of organizations use a five-level rat-ing system to appraise employees, making it the most common type of system.
� A minority of organizations (15 per cent) force a performance distribution.
� For performance management to be effective, it is important that managers be equipped with the proper tools and training. Currently, 6 out of 10 organizations provide their managers with training on managing employee performance.
� By calibrating performance ratings, organizations can remove some of the subjectivity from their performance management systems. Fifty-one per cent of organizations have some type of calibration process in place.
chart 3Frequency of Performance-Related Meetings Between Managers and Employees(n=337; percentage of organizations)
Source: The Conference Board of Canada.
18
46
24
84
Once a year
Twice a year
Three times a year
Four times a year
Other (e.g., once amonth, not enforced)
© The Conference Board of Canada. All rights reserved. Please contact cboc.ca/ip with questions or concerns about the use of this material.
6 | Performance Management—June 2012
Find this report and other Conference Board research at www .e-library .ca
use a paper-based system. A quarter of organizations
use a combination of both paper-based and automated/
electronic systems. Making the switch to an automated
system is no small task, especially in a large organization.
(See box “From Six Systems to One: Centralizing and
Automating Performance Management at Bell Aliant.”)
However, there are many advantages to having perform-
ance management information reside in one centralized
source. Some of the benefits include:
� less administration;
� a better ability to track performance year over year;
� less risk of knowledge loss when a manager leaves; and
� the possibility of integrating the performance man-
agement system with other online systems and pro-
cesses, such as merit pay or talent management.
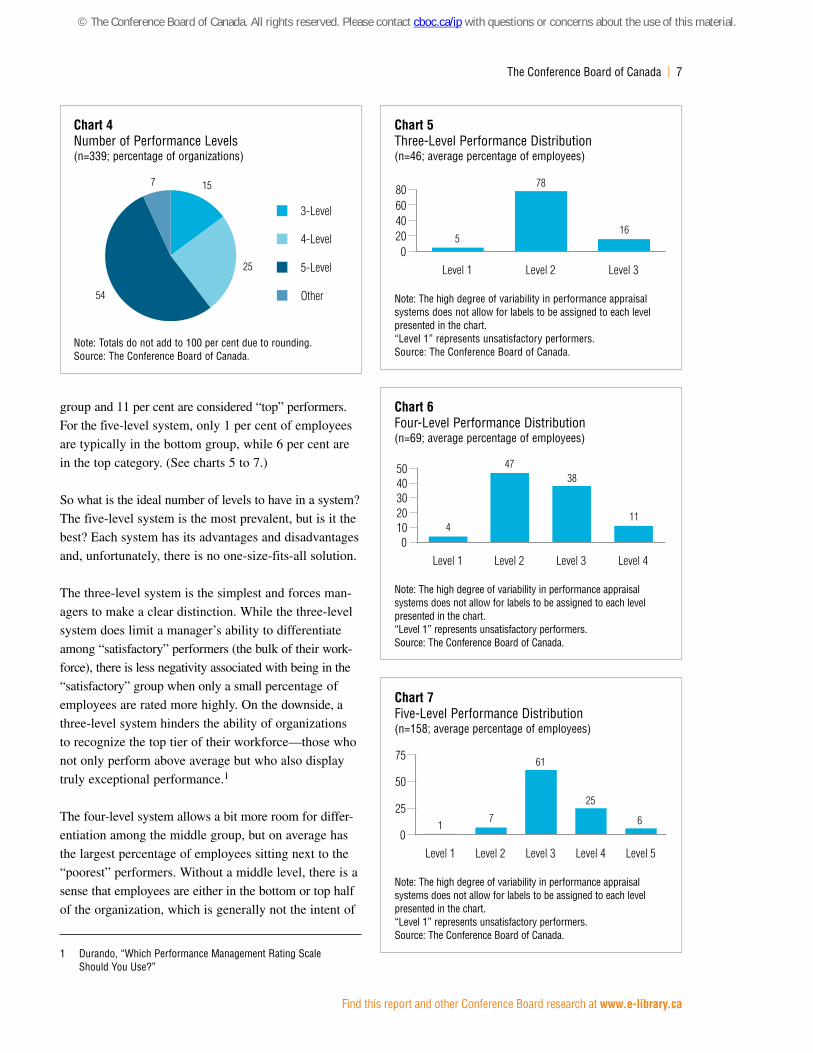
HoW many Rating levels aRe enougH?
How many levels do organizations tend to have in their
appraisal systems? Over half of organizations (54 per
cent) use a five-level rating system, one-quarter a four-
level system, and 15 per cent a three-level system. (See
Chart 4.) Nearly half of organizations recognize the import-
ance of looking at new employees differently. Forty-five
per cent of organizations have a separate category for
employees that are too new to evaluate. (This is in addi-
tion to the number of levels noted above.) Of organizations
that have a three-level performance appraisal rating sys-
tem, on average, 16 per cent of employees land in the top
performing category, while 5 per cent are in the lowest
level. Organizations with a four-level system report, on
average, that 4 per cent of employees are in the bottom
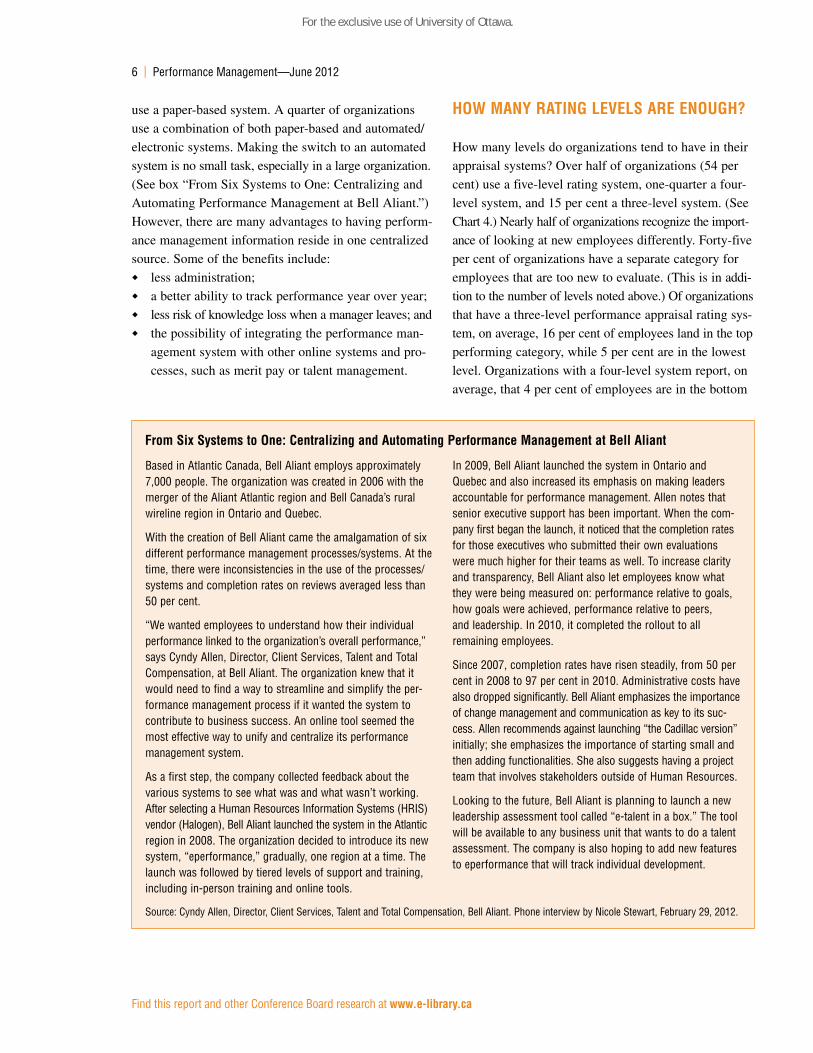
Based in Atlantic Canada, Bell Aliant employs approximately 7,000 people. The organization was created in 2006 with the merger of the Aliant Atlantic region and Bell Canada’s rural wireline region in Ontario and Quebec.
With the creation of Bell Aliant came the amalgamation of six different performance management processes/systems. At the time, there were inconsistencies in the use of the processes/systems and completion rates on reviews averaged less than 50 per cent.
“We wanted employees to understand how their individual performance linked to the organization’s overall performance,” says Cyndy Allen, Director, Client Services, Talent and Total Compensation, at Bell Aliant. The organization knew that it would need to find a way to streamline and simplify the per-formance management process if it wanted the system to contribute to business success. An online tool seemed the most effective way to unify and centralize its performance management system.
As a first step, the company collected feedback about the various systems to see what was and what wasn’t working. After selecting a Human Resources Information Systems (HRIS) vendor (Halogen), Bell Aliant launched the system in the Atlantic region in 2008. The organization decided to introduce its new system, “eperformance,” gradually, one region at a time. The launch was followed by tiered levels of support and training, including in-person training and online tools.
In 2009, Bell Aliant launched the system in Ontario and Quebec and also increased its emphasis on making leaders accountable for performance management. Allen notes that senior executive support has been important. When the com-pany first began the launch, it noticed that the completion rates for those executives who submitted their own evaluations were much higher for their teams as well. To increase clarity and transparency, Bell Aliant also let employees know what they were being measured on: performance relative to goals, how goals were achieved, performance relative to peers, and leadership. In 2010, it completed the rollout to all remaining employees.
Since 2007, completion rates have risen steadily, from 50 per cent in 2008 to 97 per cent in 2010. Administrative costs have also dropped significantly. Bell Aliant emphasizes the importance of change management and communication as key to its suc-cess. Allen recommends against launching “the Cadillac version” initially; she emphasizes the importance of starting small and then adding functionalities. She also suggests having a project team that involves stakeholders outside of Human Resources.
Looking to the future, Bell Aliant is planning to launch a new leadership assessment tool called “e-talent in a box.” The tool will be available to any business unit that wants to do a talent assessment. The company is also hoping to add new features to eperformance that will track individual development.
From six systems to one: centralizing and automating Performance management at Bell aliant
Source: Cyndy Allen, Director, Client Services, Talent and Total Compensation, Bell Aliant. Phone interview by Nicole Stewart, February 29, 2012.
For the exclusive use of University of Ottawa.
The Conference Board of Canada | 7
Find this report and other Conference Board research at www .e-library .ca
group and 11 per cent are considered “top” performers.
For the five-level system, only 1 per cent of employees
are typically in the bottom group, while 6 per cent are
in the top category. (See charts 5 to 7.)
So what is the ideal number of levels to have in a system?
The five-level system is the most prevalent, but is it the
best? Each system has its advantages and disadvantages
and, unfortunately, there is no one-size-fits-all solution.
The three-level system is the simplest and forces man-
agers to make a clear distinction. While the three-level
system does limit a manager’s ability to differentiate
among “satisfactory” performers (the bulk of their work-
force), there is less negativity associated with being in the
“satisfactory” group when only a small percentage of
employees are rated more highly. On the downside, a
three-level system hinders the ability of organizations
to recognize the top tier of their workforce—those who
not only perform above average but who also display
truly exceptional performance.1
The four-level system allows a bit more room for differ-
entiation among the middle group, but on average has
the largest percentage of employees sitting next to the
“poorest” performers. Without a middle level, there is a
sense that employees are either in the bottom or top half
of the organization, which is generally not the intent of
1 Durando, “Which Performance Management Rating Scale Should You Use?”
chart 4Number of Performance Levels(n=339; percentage of organizations)
Note: Totals do not add to 100 per cent due to rounding.Source: The Conference Board of Canada.
15
25
54
7
3-Level
4-Level
5-Level
Other
chart 5Three-Level Performance Distribution(n=46; average percentage of employees)
Note: The high degree of variability in performance appraisal systems does not allow for labels to be assigned to each level presented in the chart. “Level 1” represents unsatisfactory performers.Source: The Conference Board of Canada.
Level 1 Level 2 Level 30
20406080
5
78
16
chart 6Four-Level Performance Distribution(n=69; average percentage of employees)
Note: The high degree of variability in performance appraisal systems does not allow for labels to be assigned to each level presented in the chart. “Level 1” represents unsatisfactory performers.Source: The Conference Board of Canada.
Level 1 Level 2 Level 3 Level 40
1020304050
4
4738
11
chart 7Five-Level Performance Distribution(n=158; average percentage of employees)
Note: The high degree of variability in performance appraisal systems does not allow for labels to be assigned to each level presented in the chart. “Level 1” represents unsatisfactory performers.Source: The Conference Board of Canada.
Level 1 Level 2 Level 3 Level 4 Level 50
25
50
75
17
61
25
6
© The Conference Board of Canada. All rights reserved. Please contact cboc.ca/ip with questions or concerns about the use of this material.
8 | Performance Management—June 2012
Find this report and other Conference Board research at www .e-library .ca
a four-level system. Many organizations have a fourth
level to encourage recognition of the group of employ-
ees performing just below the top tier.
The five-level system allows for the most flexibility as
well as special distinction of exceptionally high perform-
ers, which probably explains its popularity. It also allows
more differentiation at the lower levels. However, on
average, almost a third of employees end up in the two
top groups, which can make being in the middle group
seem like less of an accomplishment.
In the end, no matter how many levels an organization
uses, the system or process needs to be transparent and
well communicated.
FoRcing a DistRiBution
The debate around forced distribution remains alive and
well. Forced distribution occurs when an organization
dictates how many employees should fall into each per-
formance rating level, for example, 10 per cent in the
lowest performance rating level, 70 per cent in the mid-
dle, and 20 per cent in the highest performance rating
level. Its supporters argue that managers are naturally
inclined to give their employees ratings that are higher
than deserved. When they are forced to differentiate,
managers will take a more serious look at their employ-
ees’ performance. Proponents of forced distribution also
believe it encourages employees to take the performance
management process more seriously.
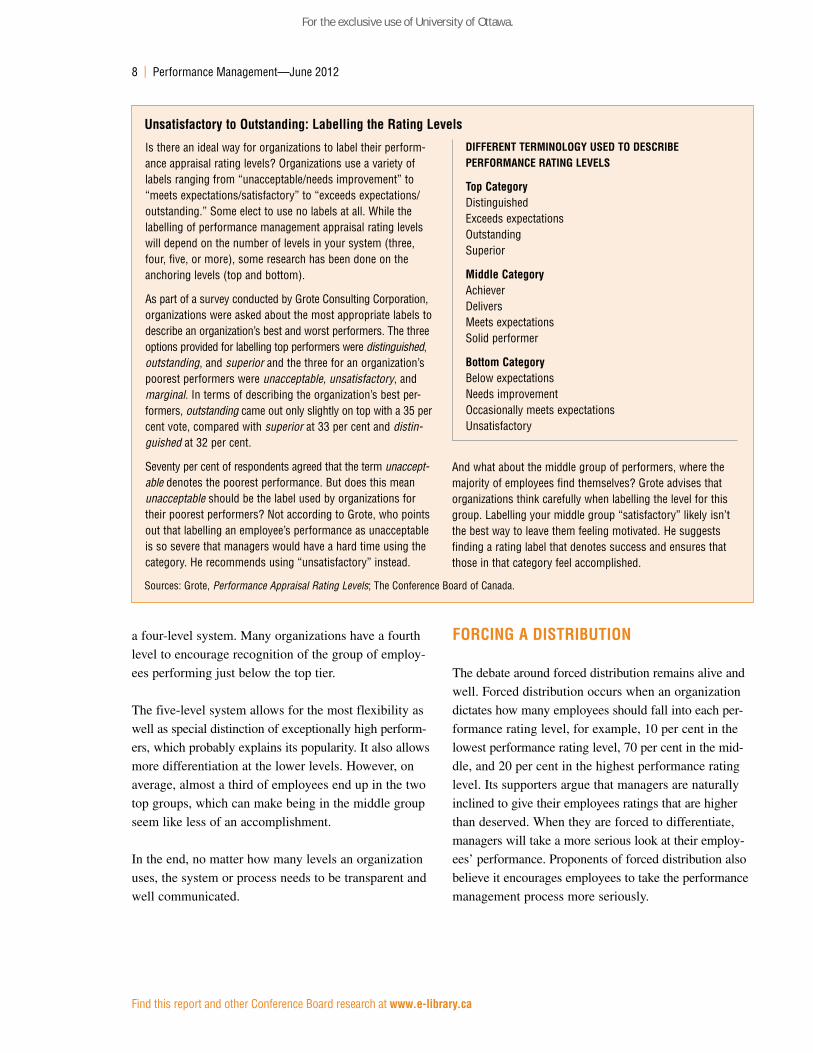
Is there an ideal way for organizations to label their perform-ance appraisal rating levels? Organizations use a variety of labels ranging from “unacceptable/needs improvement” to “meets expectations/satisfactory” to “exceeds expectations/outstanding.” Some elect to use no labels at all. While the labelling of performance management appraisal rating levels will depend on the number of levels in your system (three, four, five, or more), some research has been done on the anchoring levels (top and bottom).
As part of a survey conducted by Grote Consulting Corporation, organizations were asked about the most appropriate labels to describe an organization’s best and worst performers. The three options provided for labelling top performers were distinguished, outstanding, and superior and the three for an organization’s poorest performers were unacceptable, unsatisfactory, and marginal. In terms of describing the organization’s best per-formers, outstanding came out only slightly on top with a 35 per cent vote, compared with superior at 33 per cent and distin-guished at 32 per cent.
Seventy per cent of respondents agreed that the term unaccept-able denotes the poorest performance. But does this mean unacceptable should be the label used by organizations for their poorest performers? Not according to Grote, who points out that labelling an employee’s performance as unacceptable is so severe that managers would have a hard time using the category. He recommends using “unsatisfactory” instead.
And what about the middle group of performers, where the majority of employees find themselves? Grote advises that organizations think carefully when labelling the level for this group. Labelling your middle group “satisfactory” likely isn’t the best way to leave them feeling motivated. He suggests finding a rating label that denotes success and ensures that those in that category feel accomplished.
unsatisfactory to outstanding: labelling the Rating levels
DiFFeRent teRminology useD to DescRiBe PeRFoRmance Rating levels
top categoryDistinguished Exceeds expectationsOutstandingSuperior
middle categoryAchieverDelivers Meets expectationsSolid performer
Bottom categoryBelow expectationsNeeds improvementOccasionally meets expectations Unsatisfactory
Sources: Grote, Performance Appraisal Rating Levels; The Conference Board of Canada.
For the exclusive use of University of Ottawa.
The Conference Board of Canada | 9
Find this report and other Conference Board research at www .e-library .ca
Those who argue against forced distribution believe that
such a system does not necessarily reflect the performance
of the actual workers it is used to categorize, especially
in smaller organizations. It is possible that an organiza-
tion has few or no poor performers. They also believe
that it creates a competitive, rather than a collaborative,
work environment.
Some organizations that feel they have significant per-
formance issues or are looking to downsize may elect to
use forced distribution for a period of time. If poor per-
formers are being let go or put on performance improve-
ment plans on an annual basis, fewer and fewer of them
will remain in the organization. This may eventually allow
the organization to remove the forced distribution.
those who argue against forced distribution believe that it creates a competitive, rather than a collaborative, work environment .
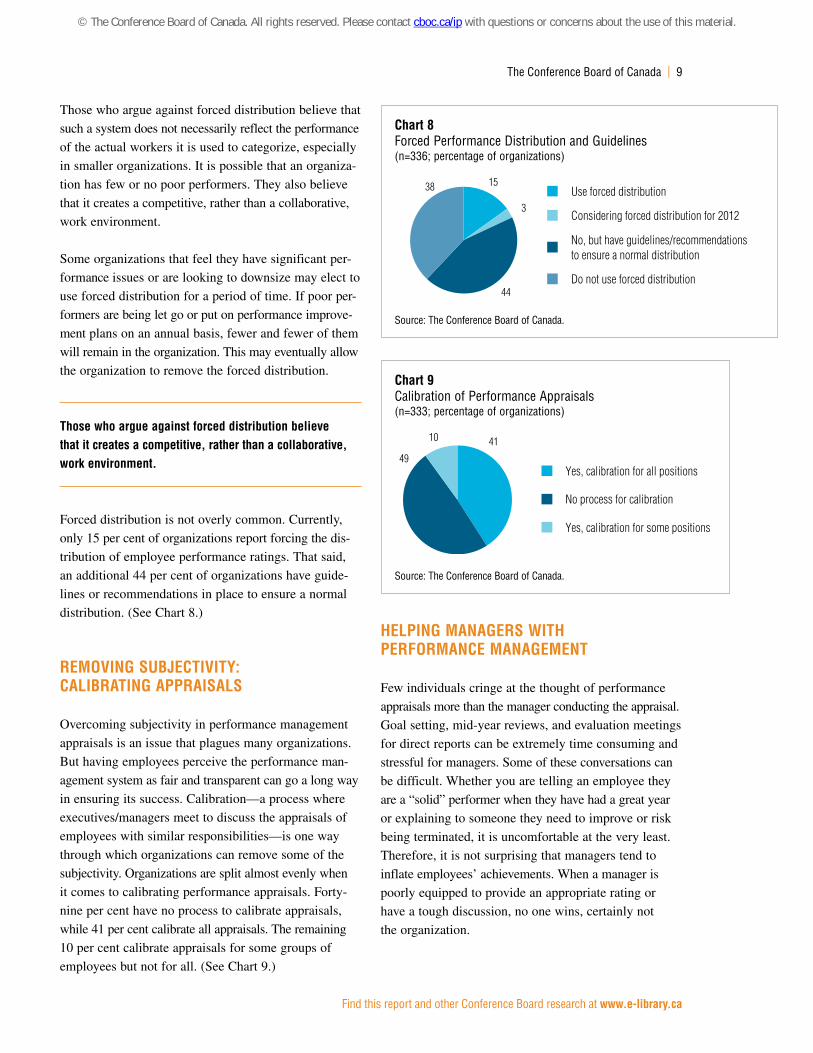
Forced distribution is not overly common. Currently,
only 15 per cent of organizations report forcing the dis-
tribution of employee performance ratings. That said,
an additional 44 per cent of organizations have guide-
lines or recommendations in place to ensure a normal
distribution. (See Chart 8.)
Removing suBjectivity: caliBRating aPPRaisals
Overcoming subjectivity in performance management
appraisals is an issue that plagues many organizations.
But having employees perceive the performance man-
agement system as fair and transparent can go a long way
in ensuring its success. Calibration—a process where
executives/managers meet to discuss the appraisals of
employees with similar responsibilities—is one way
through which organizations can remove some of the
subjectivity. Organizations are split almost evenly when
it comes to calibrating performance appraisals. Forty-
nine per cent have no process to calibrate appraisals,
while 41 per cent calibrate all appraisals. The remaining
10 per cent calibrate appraisals for some groups of
employees but not for all. (See Chart 9.)
HelPing manageRs WitH PeRFoRmance management
Few individuals cringe at the thought of performance
appraisals more than the manager conducting the appraisal.
Goal setting, mid-year reviews, and evaluation meetings
for direct reports can be extremely time consuming and
stressful for managers. Some of these conversations can
be difficult. Whether you are telling an employee they
are a “solid” performer when they have had a great year
or explaining to someone they need to improve or risk
being terminated, it is uncomfortable at the very least.
Therefore, it is not surprising that managers tend to
inflate employees’ achievements. When a manager is
poorly equipped to provide an appropriate rating or
have a tough discussion, no one wins, certainly not
the organization.
chart 8Forced Performance Distribution and Guidelines(n=336; percentage of organizations)
Source: The Conference Board of Canada.
15
3
44
38 Use forced distribution
Considering forced distribution for 2012
No, but have guidelines/recommendationsto ensure a normal distribution
Do not use forced distribution
chart 9Calibration of Performance Appraisals(n=333; percentage of organizations)
Source: The Conference Board of Canada.
41
49
10
Yes, calibration for all positions
No process for calibration
Yes, calibration for some positions
© The Conference Board of Canada. All rights reserved. Please contact cboc.ca/ip with questions or concerns about the use of this material.
10 | Performance Management—June 2012
Find this report and other Conference Board research at www .e-library .ca
People managers are in place to manage people. Making
sure employees are on track to meet their goals is a key
part of their job. For performance management to be effect-
ive, managers must certainly be trained on the system and
processes, but this is not sufficient. Managers should also
be able to help their employees set appropriate goals and
objectives, and they need to understand what types of
accomplishments warrant a rating of “meets” or “exceeds”
expectations. Managers should not only feel equipped to
provide useful feedback and help employees on their
career path, but should also take an active interest in it.
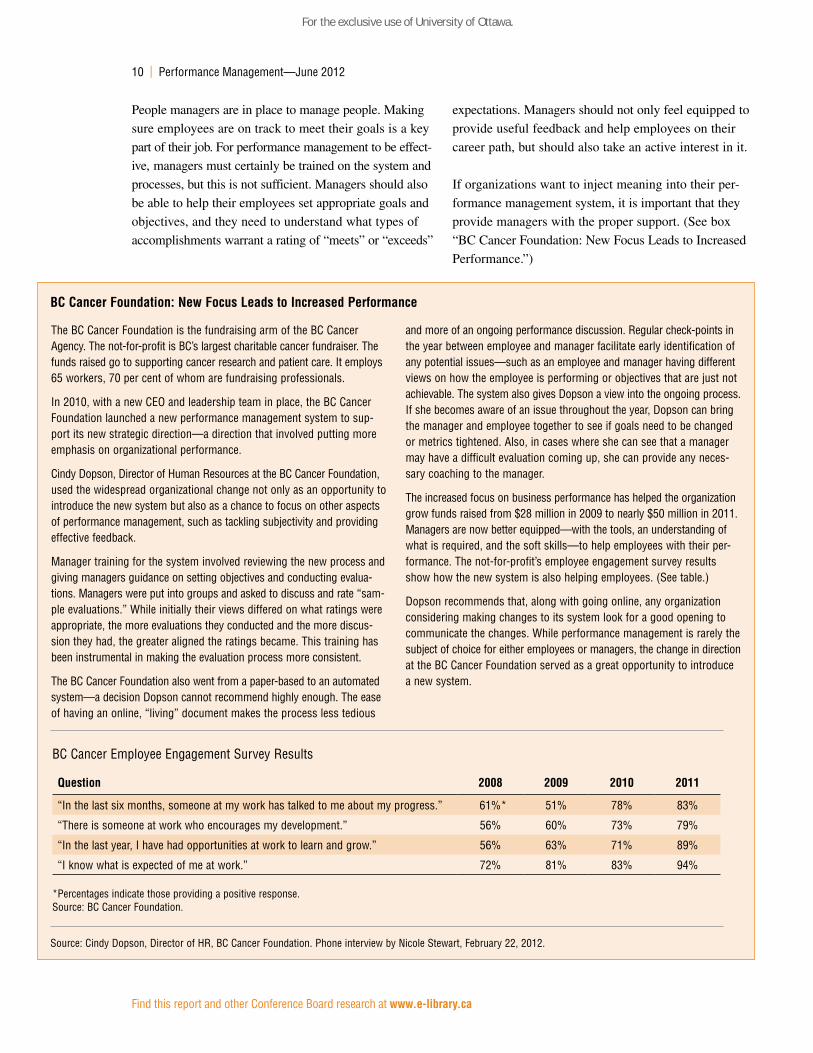
If organizations want to inject meaning into their per-
formance management system, it is important that they
provide managers with the proper support. (See box
“BC Cancer Foundation: New Focus Leads to Increased
Performance.”)
The BC Cancer Foundation is the fundraising arm of the BC Cancer Agency. The not-for-profit is BC’s largest charitable cancer fundraiser. The funds raised go to supporting cancer research and patient care. It employs 65 workers, 70 per cent of whom are fundraising professionals.
In 2010, with a new CEO and leadership team in place, the BC Cancer Foundation launched a new performance management system to sup-port its new strategic direction—a direction that involved putting more emphasis on organizational performance.
Cindy Dopson, Director of Human Resources at the BC Cancer Foundation, used the widespread organizational change not only as an opportunity to introduce the new system but also as a chance to focus on other aspects of performance management, such as tackling subjectivity and providing effective feedback.
Manager training for the system involved reviewing the new process and giving managers guidance on setting objectives and conducting evalua-tions. Managers were put into groups and asked to discuss and rate “sam-ple evaluations.” While initially their views differed on what ratings were appropriate, the more evaluations they conducted and the more discus-sion they had, the greater aligned the ratings became. This training has been instrumental in making the evaluation process more consistent.
The BC Cancer Foundation also went from a paper-based to an automated system—a decision Dopson cannot recommend highly enough. The ease of having an online, “living” document makes the process less tedious
and more of an ongoing performance discussion. Regular check-points in the year between employee and manager facilitate early identification of any potential issues—such as an employee and manager having different views on how the employee is performing or objectives that are just not achievable. The system also gives Dopson a view into the ongoing process. If she becomes aware of an issue throughout the year, Dopson can bring the manager and employee together to see if goals need to be changed or metrics tightened. Also, in cases where she can see that a manager may have a difficult evaluation coming up, she can provide any neces-sary coaching to the manager.
The increased focus on business performance has helped the organization grow funds raised from $28 million in 2009 to nearly $50 million in 2011. Managers are now better equipped—with the tools, an understanding of what is required, and the soft skills—to help employees with their per-formance. The not-for-profit’s employee engagement survey results show how the new system is also helping employees. (See table.)
Dopson recommends that, along with going online, any organization considering making changes to its system look for a good opening to communicate the changes. While performance management is rarely the subject of choice for either employees or managers, the change in direction at the BC Cancer Foundation served as a great opportunity to introduce a new system.
Bc cancer Foundation: new Focus leads to increased Performance
BC Cancer Employee Engagement Survey Results
Question 2008 2009 2010 2011
“In the last six months, someone at my work has talked to me about my progress.” 61%* 51% 78% 83%
“There is someone at work who encourages my development.” 56% 60% 73% 79%
“In the last year, I have had opportunities at work to learn and grow.” 56% 63% 71% 89%
“I know what is expected of me at work.” 72% 81% 83% 94%
*Percentages indicate those providing a positive response. Source: BC Cancer Foundation.
Source: Cindy Dopson, Director of HR, BC Cancer Foundation. Phone interview by Nicole Stewart, February 22, 2012.
For the exclusive use of University of Ottawa.
The Conference Board of Canada | 11
Find this report and other Conference Board research at www .e-library .ca
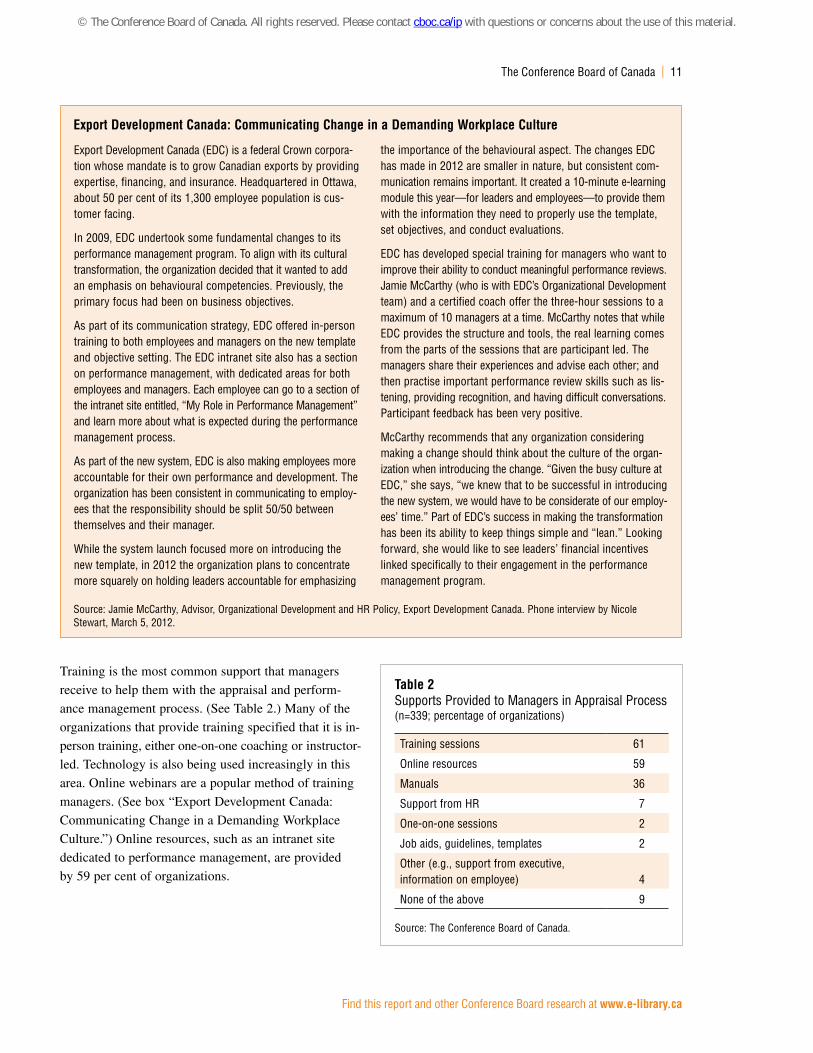
Training is the most common support that managers
receive to help them with the appraisal and perform-
ance management process. (See Table 2.) Many of the
organizations that provide training specified that it is in-
person training, either one-on-one coaching or instructor-
led. Technology is also being used increasingly in this
area. Online webinars are a popular method of training
managers. (See box “Export Development Canada:
Communicating Change in a Demanding Workplace
Culture.”) Online resources, such as an intranet site
dedicated to performance management, are provided
by 59 per cent of organizations.
table 2Supports Provided to Managers in Appraisal Process(n=339; percentage of organizations)
Training sessions 61
Online resources 59
Manuals 36
Support from HR 7
One-on-one sessions 2
Job aids, guidelines, templates 2
Other (e.g., support from executive, information on employee) 4
None of the above 9
Source: The Conference Board of Canada.
Export Development Canada (EDC) is a federal Crown corpora-tion whose mandate is to grow Canadian exports by providing expertise, financing, and insurance. Headquartered in Ottawa, about 50 per cent of its 1,300 employee population is cus-tomer facing.
In 2009, EDC undertook some fundamental changes to its performance management program. To align with its cultural transformation, the organization decided that it wanted to add an emphasis on behavioural competencies. Previously, the primary focus had been on business objectives.
As part of its communication strategy, EDC offered in-person training to both employees and managers on the new template and objective setting. The EDC intranet site also has a section on performance management, with dedicated areas for both employees and managers. Each employee can go to a section of the intranet site entitled, “My Role in Performance Management” and learn more about what is expected during the performance management process.
As part of the new system, EDC is also making employees more accountable for their own performance and development. The organization has been consistent in communicating to employ-ees that the responsibility should be split 50/50 between themselves and their manager.
While the system launch focused more on introducing the new template, in 2012 the organization plans to concentrate more squarely on holding leaders accountable for emphasizing
the importance of the behavioural aspect. The changes EDC has made in 2012 are smaller in nature, but consistent com-munication remains important. It created a 10-minute e-learning module this year—for leaders and employees—to provide them with the information they need to properly use the template, set objectives, and conduct evaluations.
EDC has developed special training for managers who want to improve their ability to conduct meaningful performance reviews. Jamie McCarthy (who is with EDC’s Organizational Development team) and a certified coach offer the three-hour sessions to a maximum of 10 managers at a time. McCarthy notes that while EDC provides the structure and tools, the real learning comes from the parts of the sessions that are participant led. The managers share their experiences and advise each other; and then practise important performance review skills such as lis-tening, providing recognition, and having difficult conversations. Participant feedback has been very positive.
McCarthy recommends that any organization considering making a change should think about the culture of the organ-ization when introducing the change. “Given the busy culture at EDC,” she says, “we knew that to be successful in introducing the new system, we would have to be considerate of our employ-ees’ time.” Part of EDC’s success in making the transformation has been its ability to keep things simple and “lean.” Looking forward, she would like to see leaders’ financial incentives linked specifically to their engagement in the performance management program.
export Development canada: communicating change in a Demanding Workplace culture
Source: Jamie McCarthy, Advisor, Organizational Development and HR Policy, Export Development Canada. Phone interview by Nicole Stewart, March 5, 2012.
© The Conference Board of Canada. All rights reserved. Please contact cboc.ca/ip with questions or concerns about the use of this material.
Find this report and other Conference Board research at www .e-library .ca
In an economy where the average annual base sal-
ary increase is 3 per cent of base pay, differentia-
tion based on performance can be demanding.
Many organizations are challenged to reward high per-
formers in a significant way, while making sure not to
alienate their “solid” performers—those who make up
the bulk of their workforce.
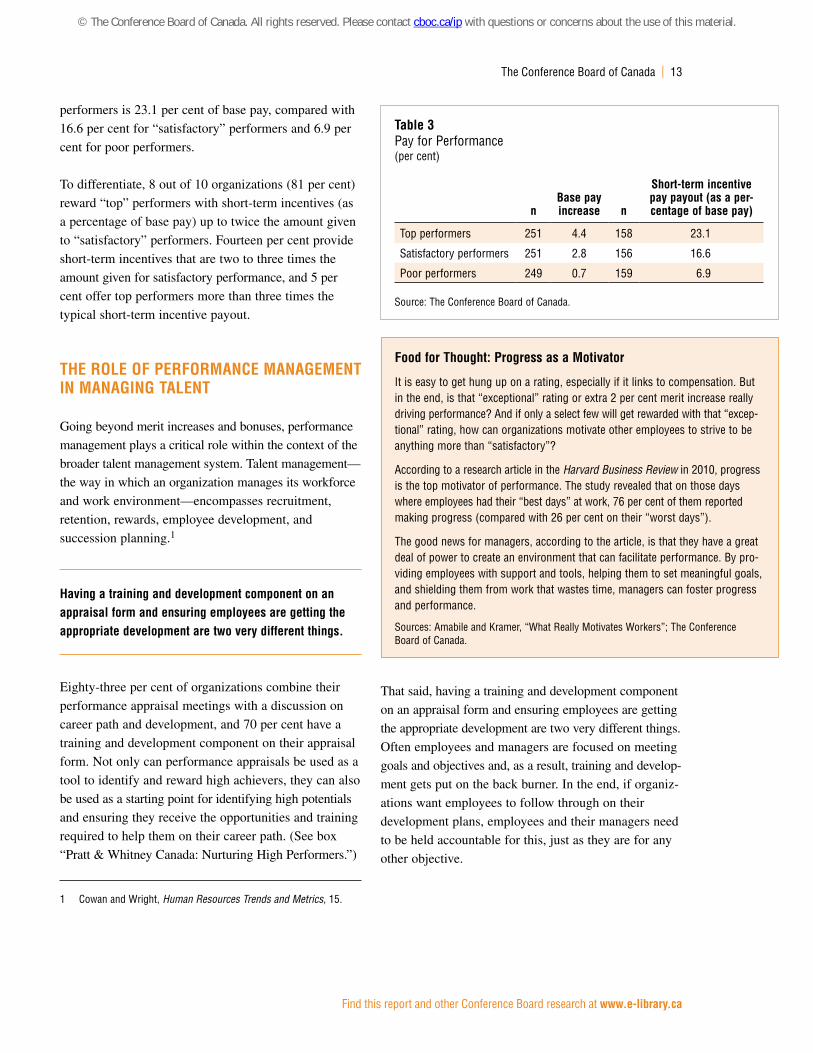
Over three-quarters (78 per cent) of organizations link
base pay to performance. “Top” performers received an
average salary increase of 4.4 per cent, compared with
2.8 per cent for “satisfactory” performers and 0.7 per
cent for “poor” performers. (See Table 3.)
While organizations do typically vary base pay increases
by level of performance, there is still room for further
differentiation. Seventy-eight per cent of organizations
reward “top” performers with increases that are less than
twice the average increase given to “solid” performers.
Two in 10 reward outstanding performance with increases
that are two to three times the average increase for satis-
factory performance. Two per cent reported that the
average increases for outstanding performers are more
than three times those given to solid performers.
More than half of organizations (56 per cent) link their
performance management system to short-term incentive
pay. The average short-term incentive given to “top”
Rewarding Performance and Talent Management
cHaPteR 3
chapter summary � The majority of organizations link pay to per-
formance. Over three-quarters of organizations link base pay to performance, and 56 per cent link performance to short-term incentives.
� Eighty-three per cent of organizations com-bine performance appraisal meetings with a discussion on career path and development, and 70 per cent of organizations include train-ing and development objectives as part of their appraisal.
� If employee development is a priority, then employees and their managers should be held accountable for their training and development goals, just as they are for any other objective.
� Performance appraisals can be used by organ-izations to help identify high-potential employees.
� By having well-designed performance improvement plans or systems in place, man-agers are in a better position to help employ-ees and more likely to provide honest feedback.
For the exclusive use of University of Ottawa.
The Conference Board of Canada | 13
Find this report and other Conference Board research at www .e-library .ca
performers is 23.1 per cent of base pay, compared with
16.6 per cent for “satisfactory” performers and 6.9 per
cent for poor performers.
To differentiate, 8 out of 10 organizations (81 per cent)
reward “top” performers with short-term incentives (as
a percentage of base pay) up to twice the amount given
to “satisfactory” performers. Fourteen per cent provide
short-term incentives that are two to three times the
amount given for satisfactory performance, and 5 per
cent offer top performers more than three times the
typical short-term incentive payout.
tHe Role oF PeRFoRmance management in managing talent
Going beyond merit increases and bonuses, performance
management plays a critical role within the context of the
broader talent management system. Talent management—
the way in which an organization manages its workforce
and work environment—encompasses recruitment,
retention, rewards, employee development, and
succession planning.1
Having a training and development component on an appraisal form and ensuring employees are getting the appropriate development are two very different things .
Eighty-three per cent of organizations combine their
performance appraisal meetings with a discussion on
career path and development, and 70 per cent have a
training and development component on their appraisal
form. Not only can performance appraisals be used as a
tool to identify and reward high achievers, they can also
be used as a starting point for identifying high potentials
and ensuring they receive the opportunities and training
required to help them on their career path. (See box
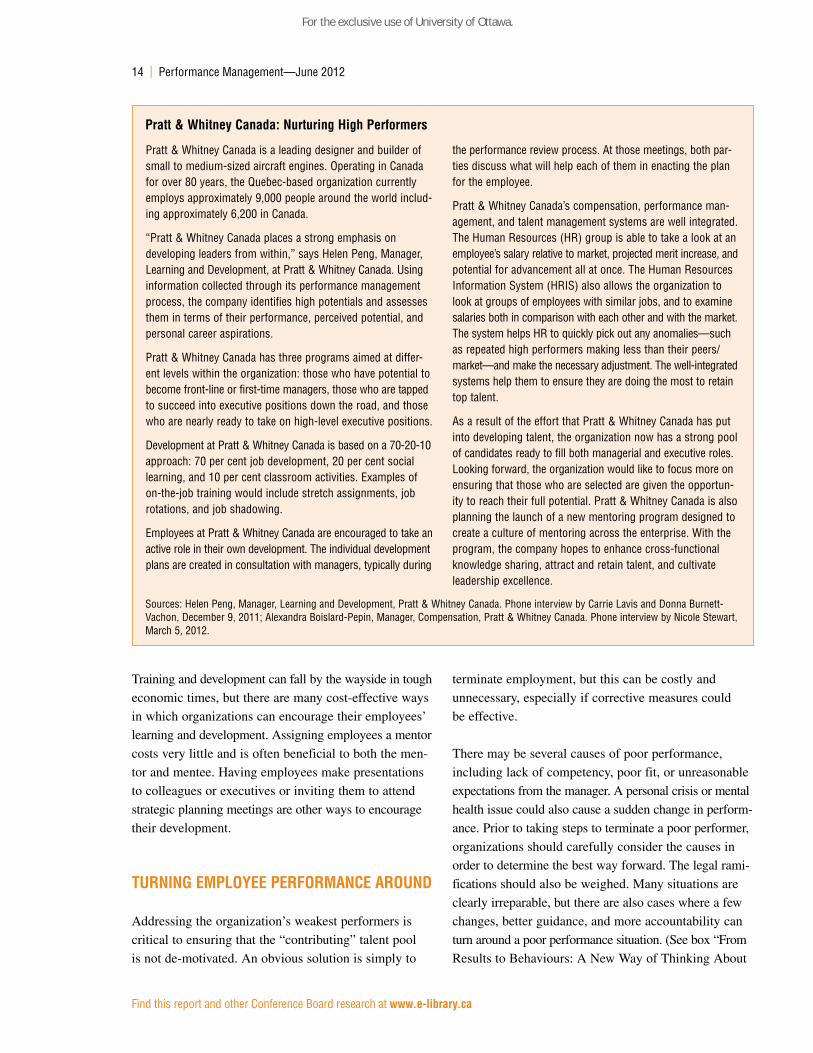
“Pratt & Whitney Canada: Nurturing High Performers.”)
1 Cowan and Wright, Human Resources Trends and Metrics, 15.
That said, having a training and development component
on an appraisal form and ensuring employees are getting
the appropriate development are two very different things.
Often employees and managers are focused on meeting
goals and objectives and, as a result, training and develop-
ment gets put on the back burner. In the end, if organiz-
ations want employees to follow through on their
development plans, employees and their managers need
to be held accountable for this, just as they are for any
other objective.
table 3Pay for Performance(per cent)
nBase pay increase n
short-term incentive pay payout (as a per-centage of base pay)
Top performers 251 4.4 158 23.1
Satisfactory performers 251 2.8 156 16.6
Poor performers 249 0.7 159 6.9
Source: The Conference Board of Canada.
Food for thought: Progress as a motivator
It is easy to get hung up on a rating, especially if it links to compensation. But in the end, is that “exceptional” rating or extra 2 per cent merit increase really driving performance? And if only a select few will get rewarded with that “excep-tional” rating, how can organizations motivate other employees to strive to be anything more than “satisfactory”?
According to a research article in the Harvard Business Review in 2010, progress is the top motivator of performance. The study revealed that on those days where employees had their “best days” at work, 76 per cent of them reported making progress (compared with 26 per cent on their “worst days”).
The good news for managers, according to the article, is that they have a great deal of power to create an environment that can facilitate performance. By pro-viding employees with support and tools, helping them to set meaningful goals, and shielding them from work that wastes time, managers can foster progress and performance.
Sources: Amabile and Kramer, “What Really Motivates Workers”; The Conference Board of Canada.
© The Conference Board of Canada. All rights reserved. Please contact cboc.ca/ip with questions or concerns about the use of this material.
14 | Performance Management—June 2012
Find this report and other Conference Board research at www .e-library .ca
Training and development can fall by the wayside in tough
economic times, but there are many cost-effective ways
in which organizations can encourage their employees’
learning and development. Assigning employees a mentor
costs very little and is often beneficial to both the men-
tor and mentee. Having employees make presentations
to colleagues or executives or inviting them to attend
strategic planning meetings are other ways to encourage
their development.
tuRning emPloyee PeRFoRmance aRounD
Addressing the organization’s weakest performers is
critical to ensuring that the “contributing” talent pool
is not de-motivated. An obvious solution is simply to
terminate employment, but this can be costly and
unnecessary, especially if corrective measures could
be effective.
There may be several causes of poor performance,
including lack of competency, poor fit, or unreasonable
expectations from the manager. A personal crisis or mental
health issue could also cause a sudden change in perform-
ance. Prior to taking steps to terminate a poor performer,
organizations should carefully consider the causes in
order to determine the best way forward. The legal rami-
fications should also be weighed. Many situations are
clearly irreparable, but there are also cases where a few
changes, better guidance, and more accountability can
turn around a poor performance situation. (See box “From
Results to Behaviours: A New Way of Thinking About
Pratt & Whitney Canada is a leading designer and builder of small to medium-sized aircraft engines. Operating in Canada for over 80 years, the Quebec-based organization currently employs approximately 9,000 people around the world includ-ing approximately 6,200 in Canada.
“Pratt & Whitney Canada places a strong emphasis on developing leaders from within,” says Helen Peng, Manager, Learning and Development, at Pratt & Whitney Canada. Using information collected through its performance management process, the company identifies high potentials and assesses them in terms of their performance, perceived potential, and personal career aspirations.
Pratt & Whitney Canada has three programs aimed at differ-ent levels within the organization: those who have potential to become front-line or first-time managers, those who are tapped to succeed into executive positions down the road, and those who are nearly ready to take on high-level executive positions.
Development at Pratt & Whitney Canada is based on a 70-20-10 approach: 70 per cent job development, 20 per cent social learning, and 10 per cent classroom activities. Examples of on-the-job training would include stretch assignments, job rotations, and job shadowing.
Employees at Pratt & Whitney Canada are encouraged to take an active role in their own development. The individual development plans are created in consultation with managers, typically during
the performance review process. At those meetings, both par-ties discuss what will help each of them in enacting the plan for the employee.
Pratt & Whitney Canada’s compensation, performance man-agement, and talent management systems are well integrated. The Human Resources (HR) group is able to take a look at an employee’s salary relative to market, projected merit increase, and potential for advancement all at once. The Human Resources Information System (HRIS) also allows the organization to look at groups of employees with similar jobs, and to examine salaries both in comparison with each other and with the market. The system helps HR to quickly pick out any anomalies—such as repeated high performers making less than their peers/market—and make the necessary adjustment. The well-integrated systems help them to ensure they are doing the most to retain top talent.
As a result of the effort that Pratt & Whitney Canada has put into developing talent, the organization now has a strong pool of candidates ready to fill both managerial and executive roles. Looking forward, the organization would like to focus more on ensuring that those who are selected are given the opportun-ity to reach their full potential. Pratt & Whitney Canada is also planning the launch of a new mentoring program designed to create a culture of mentoring across the enterprise. With the program, the company hopes to enhance cross-functional knowledge sharing, attract and retain talent, and cultivate leadership excellence.
Pratt & Whitney canada: nurturing High Performers
Sources: Helen Peng, Manager, Learning and Development, Pratt & Whitney Canada. Phone interview by Carrie Lavis and Donna Burnett-Vachon, December 9, 2011; Alexandra Boislard-Pepin, Manager, Compensation, Pratt & Whitney Canada. Phone interview by Nicole Stewart, March 5, 2012.
For the exclusive use of University of Ottawa.
The Conference Board of Canada | 15
Find this report and other Conference Board research at www .e-library .ca
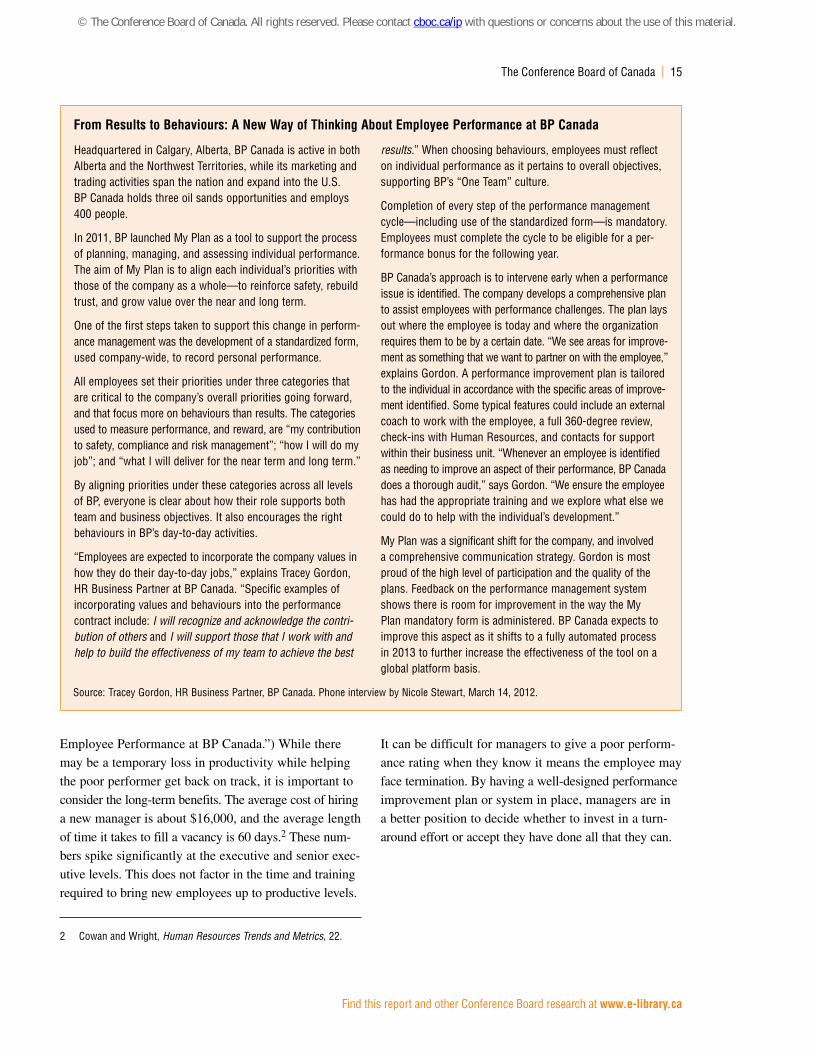
Employee Performance at BP Canada.”) While there
may be a temporary loss in productivity while helping
the poor performer get back on track, it is important to
consider the long-term benefits. The average cost of hiring
a new manager is about $16,000, and the average length
of time it takes to fill a vacancy is 60 days.2 These num-
bers spike significantly at the executive and senior exec-
utive levels. This does not factor in the time and training
required to bring new employees up to productive levels.
2 Cowan and Wright, Human Resources Trends and Metrics, 22.
It can be difficult for managers to give a poor perform-
ance rating when they know it means the employee may
face termination. By having a well-designed performance
improvement plan or system in place, managers are in
a better position to decide whether to invest in a turn-
around effort or accept they have done all that they can.
Headquartered in Calgary, Alberta, BP Canada is active in both Alberta and the Northwest Territories, while its marketing and trading activities span the nation and expand into the U.S. BP Canada holds three oil sands opportunities and employs 400 people.
In 2011, BP launched My Plan as a tool to support the process of planning, managing, and assessing individual performance. The aim of My Plan is to align each individual’s priorities with those of the company as a whole—to reinforce safety, rebuild trust, and grow value over the near and long term.
One of the first steps taken to support this change in perform-ance management was the development of a standardized form, used company-wide, to record personal performance.
All employees set their priorities under three categories that are critical to the company’s overall priorities going forward, and that focus more on behaviours than results. The categories used to measure performance, and reward, are “my contribution to safety, compliance and risk management”; “how I will do my job”; and “what I will deliver for the near term and long term.”
By aligning priorities under these categories across all levels of BP, everyone is clear about how their role supports both team and business objectives. It also encourages the right behaviours in BP’s day-to-day activities.
“Employees are expected to incorporate the company values in how they do their day-to-day jobs,” explains Tracey Gordon, HR Business Partner at BP Canada. “Specific examples of incorporating values and behaviours into the performance contract include: I will recognize and acknowledge the contri-bution of others and I will support those that I work with and help to build the effectiveness of my team to achieve the best
results.” When choosing behaviours, employees must reflect on individual performance as it pertains to overall objectives, supporting BP’s “One Team” culture.
Completion of every step of the performance management cycle—including use of the standardized form—is mandatory. Employees must complete the cycle to be eligible for a per-formance bonus for the following year.
BP Canada’s approach is to intervene early when a performance issue is identified. The company develops a comprehensive plan to assist employees with performance challenges. The plan lays out where the employee is today and where the organization requires them to be by a certain date. “We see areas for improve-ment as something that we want to partner on with the employee,” explains Gordon. A performance improvement plan is tailored to the individual in accordance with the specific areas of improve-ment identified. Some typical features could include an external coach to work with the employee, a full 360-degree review, check-ins with Human Resources, and contacts for support within their business unit. “Whenever an employee is identified as needing to improve an aspect of their performance, BP Canada does a thorough audit,” says Gordon. “We ensure the employee has had the appropriate training and we explore what else we could do to help with the individual’s development.”
My Plan was a significant shift for the company, and involved a comprehensive communication strategy. Gordon is most proud of the high level of participation and the quality of the plans. Feedback on the performance management system shows there is room for improvement in the way the My Plan mandatory form is administered. BP Canada expects to improve this aspect as it shifts to a fully automated process in 2013 to further increase the effectiveness of the tool on a global platform basis.
From Results to Behaviours: a new Way of thinking about employee Performance at BP canada
Source: Tracey Gordon, HR Business Partner, BP Canada. Phone interview by Nicole Stewart, March 14, 2012.
© The Conference Board of Canada. All rights reserved. Please contact cboc.ca/ip with questions or concerns about the use of this material.
Find this report and other Conference Board research at www .e-library .ca
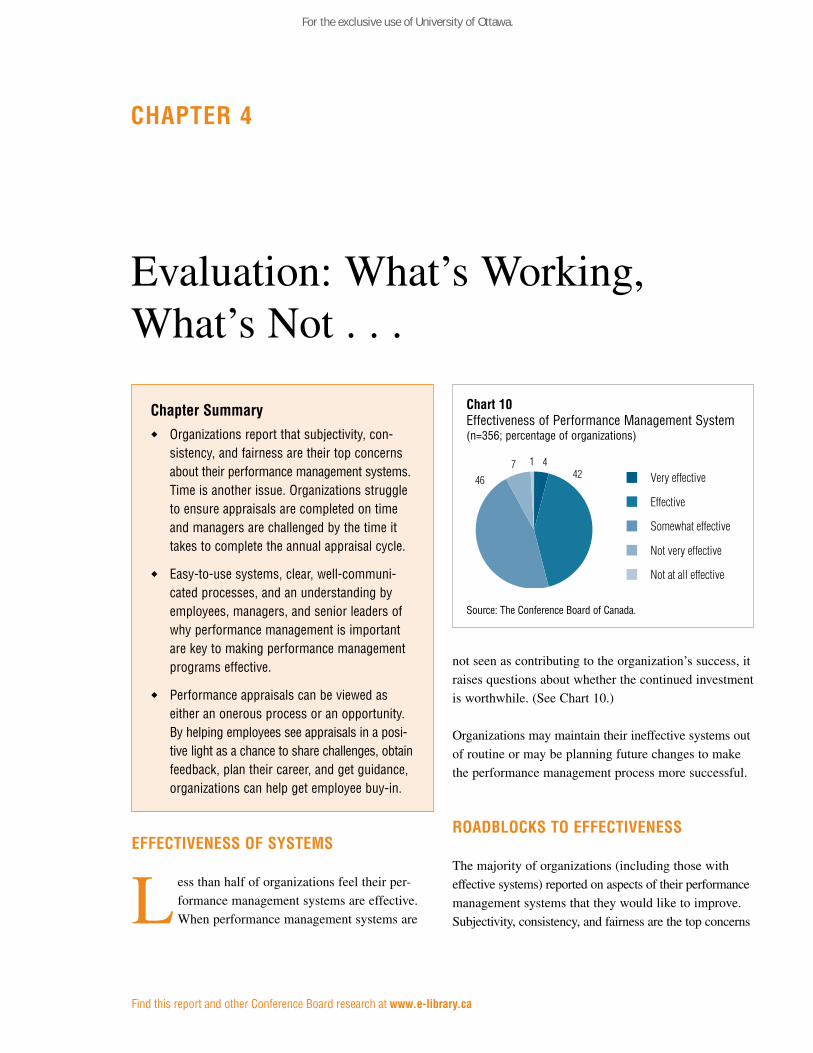
eFFectiveness oF systems
Less than half of organizations feel their per-
formance management systems are effective.
When performance management systems are
not seen as contributing to the organization’s success, it
raises questions about whether the continued investment
is worthwhile. (See Chart 10.)
Organizations may maintain their ineffective systems out
of routine or may be planning future changes to make
the performance management process more successful.
RoaDBlocks to eFFectiveness
The majority of organizations (including those with
effective systems) reported on aspects of their performance
management systems that they would like to improve.
Subjectivity, consistency, and fairness are the top concerns
Evaluation: What’s Working, What’s Not . . .
cHaPteR 4
chapter summary � Organizations report that subjectivity, con-
sistency, and fairness are their top concerns about their performance management systems. Time is another issue. Organizations struggle to ensure appraisals are completed on time and managers are challenged by the time it takes to complete the annual appraisal cycle.
� Easy-to-use systems, clear, well-communi-cated processes, and an understanding by employees, managers, and senior leaders of why performance management is important are key to making performance management programs effective.
� Performance appraisals can be viewed as either an onerous process or an opportunity. By helping employees see appraisals in a posi-tive light as a chance to share challenges, obtain feedback, plan their career, and get guidance, organizations can help get employee buy-in.
chart 10Effectiveness of Performance Management System(n=356; percentage of organizations)
Source: The Conference Board of Canada.
44246
7 1
Very effective
Effective
Somewhat effective
Not very effective
Not at all effective
For the exclusive use of University of Ottawa.
The Conference Board of Canada | 17
Find this report and other Conference Board research at www .e-library .ca
organizations have with their performance management
systems. Organizations are challenged with ensuring their
performance management systems are being applied
consistently and fairly across the organization, within
divisions, and even among employees reporting to the
same manager.
if senior managers do not find the system meaningful or effective, it is difficult to get buy-in from the rest of the employee population .
Another concern for organizations is the heavy invest-
ment of time that both managers and employees need
to devote to the performance management process in
addition to other work demands. Given these competing
pressures, compliance can be difficult. While average
completion rates are 94 per cent, many organizations
face challenges in ensuring that appraisals are com-
pleted on time. Another issue identified by organiza-
tions relates to tools and complex or archaic platforms
and systems. Organizations struggle to get managers to
complete complex forms and have a tough time tracking
manually filled-out forms. Buy-in, from both employees
and leaders, throughout this process is also a key issue.
If senior leaders do not find the system meaningful or
effective, it is difficult to get buy-in from the rest of the
employee population.
keys to success
For most organizations, performance appraisals are an
integral part of the performance management system.
So it is natural to focus on areas for improvement as
organizations strive to make their systems as effective
as possible. And while organizations acknowledged
facing challenges with performance management,
they also shared many keys to success.
So what can organizations do to make them more effect-
ive? Some tips for employers are provided in the box
“Improving the Effectiveness of Your Organization’s
Performance Management System.” As with any other
program, organizations should carefully consider their
purpose in conducting performance appraisals. Without
a clear goal in mind it is difficult to ensure its success.
Performance appraisals can be viewed by managers and
employees as either an onerous process or an opportunity.
By focusing on how the process can create open space
for dialogue on successes, challenges, obstacles faced,
supports needed, and priorities, organizations can help
get buy-in.
conclusion
Almost all organizations have a performance management
system in place, and performance appraisals are a fixture
within these systems. While there is debate on their effect-
iveness in motivating performance, appraisals serve as a
improving the effectiveness of your organization’s Performance management system
keep it simple: Make sure the system is easy to use. Figure out what you really need. If you are making a big change or starting from scratch, begin with the basics.
communicate clearly: Employees must understand why performance reviews are important, their role in the process, what they need to do, and when they need to do it.
set cascading goals: An employee’s individual goals and objectives should be aligned with overall organizational goals and objectives.
set the tone at the top: Senior leaders need to lead by example and take the process seriously, for themselves and for their direct reports.
ensure accountability from employees and managers: In addition to completing forms, individuals should be held accountable for the quality of the conversation between manager and employee.
link Pay to Performance: Reward employees for their accomplishments. Look for opportunities to differentiate pay based on performance.
Provide training: Not everyone is born to coach. Not only do employees and managers need to understand the process, managers may also benefit from training on how to provide meaningful feed-back and make objective ratings.
ensure Fairness and objectivity: If subjectivity or “ratings creep” is an issue, add a process to calibrate appraisals organization-wide. Collect multi-source feedback to ensure a complete view.
Source: The Conference Board of Canada.
© The Conference Board of Canada. All rights reserved. Please contact cboc.ca/ip with questions or concerns about the use of this material.
18 | Performance Management—June 2012
Find this report and other Conference Board research at www .e-library .ca
key process for many organizations. Ongoing dialogue
between a manager and an employee is ideal, but apprais-
als serve as a good opportunity for managers to have a
formal discussion with employees about their performance
and career. Organizations differ in their assessments of the
effectiveness of their performance management systems, but
most organizations believe there is room for improvement.
Performance management and appraisals do not have to
be a burdensome process. They should be an opportunity
for employees to obtain feedback, check on their progress,
and get any needed support. Organizations can help ensure
they are getting the most out of their performance man-
agement systems by making employees and managers
accountable for performance management, simplifying
processes, clearly communicating expectations, ensuring
fairness, helping managers develop the skills needed to
help their employees perform, setting cascading goals,
linking pay to performance, and getting leadership and
employee buy-in.
> Tell us how we’re doing—rate this publication.
www.conferenceboard.ca/e-Library/abstract.aspx?did=4843
For the exclusive use of University of Ottawa.
Find this report and other Conference Board research at www .e-library .ca
aPPenDix a
Bibliography
Amabile, Teresa M., and Mukti Khaire. “Creativity
and the Role of the Leader.” Harvard Business Review,
October 2008: 101–09.
Amabile, Teresa M., and Steven J. Kramer. “The Power
of Small Wins.” Harvard Business Review, May 2011:
72–80.
—. “What Really Motivates Workers.” Harvard
Business Review, January 2010: 44–45.
Chou, Kerry, and Elizabeth Morris. “Performance
Rating and Distribution.” WorldatWork, December
2005 www.worldatwork.org/WAW/adimLink?id-17233
(accessed November 15, 2011).
Cowan, Allison, and Ruth Wright. Human Resources
Trends and Metrics: Valuing Your Talent. Ottawa: The
Conference Board of Canada, 2010.
Daniels, Aubrey C. Bringing Out the Best in People:
How to Apply the Astonishing Power of Positive
Reinforcement. New York: McGraw-Hill, 1999.
—. “Designing a Compensation Program That
Motivates and Produces.” PM eZine: The Performance
Management Magazine. http://aubreydaniels.com/
pmezine/designing-compensation-system-motivates
(accessed November 10, 2011).
—. Oops! 13 Management Practices That Waste Time
and Money (and what to do instead). Performance
Management Publications, 2009.
Dobson, Sarah. “Performance Reviews Valued
by Employees: Poll.” Canadian HR Reporter,
December 20, 2011: 1.
Durando, Laura. “Which Performance Management
Rating Scale Should You Use?” Cornerstone: On Demand.
August 17, 2009. www.cornerstoneondemand.com/
blog-which-performance-management-rating-scale-
should-you-use (accessed March 21, 2011).
Effron, Marc, and Miriam Ott. One Page Talent
Management: Eliminating Complexity, Adding
Value. Boston: Havard Business Press, 2010.
Fernandes, Christina. “Performanace Appraisal:
A Key Business Tool or an Annual Ritual?” SHRM
India. 2011. www.shrmindia.org/print/1328 (accessed
April 29, 2011).
Gravina, Nicole E., and Brian P. Siers. “Square Pegs
and Round Holes: Ruminations on the Relationship
Between Performance Appraisal and Performance
Management.” Journal of Organizational Behavior
Management 31, no. 4 ( 2011): 277–87.
© The Conference Board of Canada. All rights reserved. Please contact cboc.ca/ip with questions or concerns about the use of this material.
20 | Performance Management—June 2012
Find this report and other Conference Board research at www .e-library .ca
Grote, Dick. “Forced Ranking: Making Performance
Management Work.” Harvard Business School: Working
Knowledge for Business Leaders. November 14, 2005.
http://hbswk.hbs.edu/archive/5091.html (accessed
December 9, 2011).
—. “Is Performance Management All That Important?”
Dick Grote’s Performance Management Blog. 2011.
www.dickgrote.com/category/performance-management/
page/26/ (accessed November 16, 2011).
—. “Let’s Abolish Self-Appraisal.” Dick
Grote’s Performance Management Blog. 2011.
www.dickgrote.com/let%e2%80%99s-abolish-
self-appraisal/ (accessed November 16, 2011).
—. Performance Appraisal Rating Labels: What’s Best,
What’s Worst? White Paper, Grote Consulting, 2002.
—. “The Myth of Performance Metrics.” Dick
Grote’s Performance Management Blog. 2011.
www.dickgrote.com/the-myth-of-performance-metrics/
(accessed November 16, 2011).
Hallamore, Christopher. Merit Pay in Unionized
Environments. Ottawa: The Conference Board of
Canada, 2005.
Karakowsky, Len, and Igor Kotlyar. “Think You
Know Your High Performers?” Canadian HR
Reporter, December 5, 2011: 23.
Kreissl, Brian. “Should Performance Appraisals Be
Abolished?” Canadian HR Reporter, December 13, 2011.
www.hrreporter.com/blog/HR-Policies-Practices/archive/
2011/12/13/should-performance-appraisals-be-abolished
(accessed December 14, 2011).
Krell, Eric. “All for Incentives, Incentives for All.”
HR Magazine 56, no. 1 (January 2011): 35–38.
McGregor, Jena. “The Struggle to Measure Performance.”
Bloomberg Businessweek. January 9, 2006.
http://businessweek.com/magazine/content/06_02/
b3966060.htm (accessed December 9, 2011).
Meisler, Andy. “Dead Man’s Curve.” Workforce
Management, July 2003: 44–49.
Pace, Ann. “A New Era of Performance Management.”
Training and Development, October 2011: 12.
Pulakos, Elaine D. Performance Management: A Road
Map for Developing, Implementing and Evaluating
Performance Management Systems. Alexandria:
SHRM Foundation, 2004.
Spreitzer, Gretchen, and Christine Porath. “Creating
Sustainable Performance.” Harvard Business Review,
2012: 93–99.
For the exclusive use of University of Ottawa.
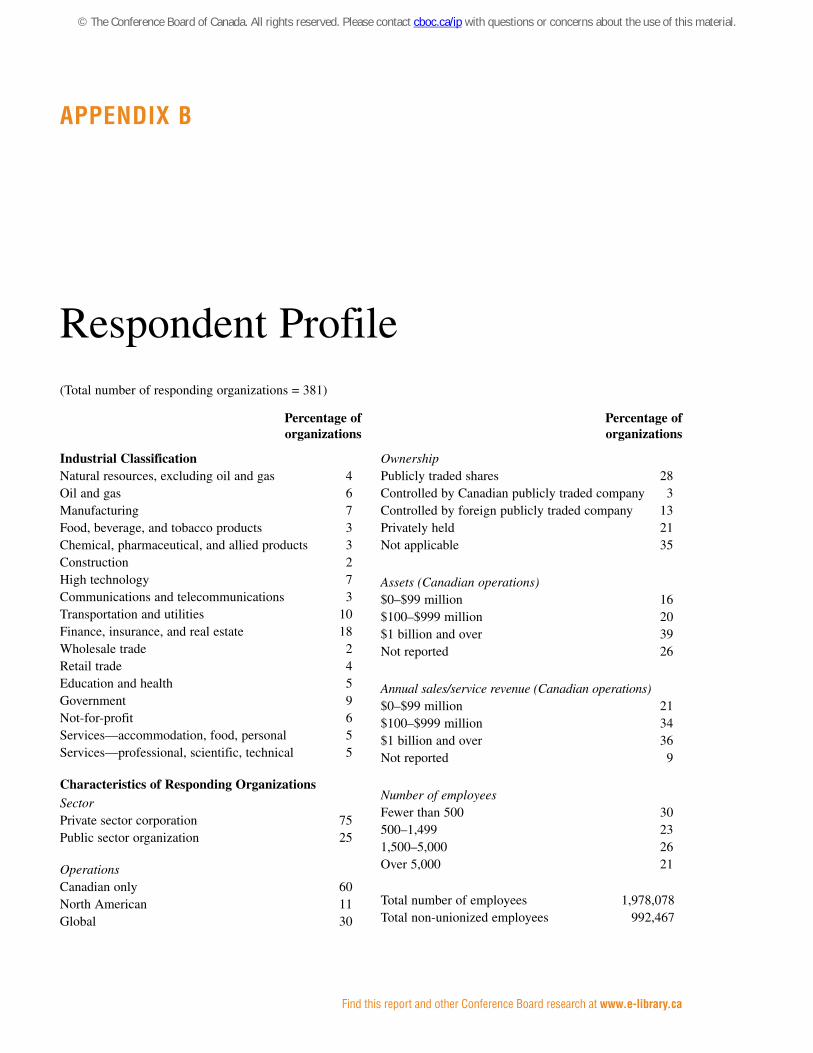
Find this report and other Conference Board research at www .e-library .ca
Respondent Profile
aPPenDix B
(Total number of responding organizations = 381)
Percentage of organizations
Industrial ClassificationNatural resources, excluding oil and gas 4Oil and gas 6Manufacturing 7Food, beverage, and tobacco products 3Chemical, pharmaceutical, and allied products 3Construction 2High technology 7Communications and telecommunications 3Transportation and utilities 10Finance, insurance, and real estate 18Wholesale trade 2Retail trade 4Education and health 5Government 9Not-for-profit 6Services—accommodation, food, personal 5Services—professional, scientific, technical 5
Characteristics of Responding OrganizationsSectorPrivate sector corporation 75Public sector organization 25
OperationsCanadian only 60North American 11Global 30
Percentage of organizations
OwnershipPublicly traded shares 28Controlled by Canadian publicly traded company 3Controlled by foreign publicly traded company 13Privately held 21Not applicable 35
Assets (Canadian operations)$0–$99 million 16$100–$999 million 20$1 billion and over 39Not reported 26
Annual sales/service revenue (Canadian operations)$0–$99 million 21$100–$999 million 34$1 billion and over 36Not reported 9
Number of employeesFewer than 500 30500–1,499 231,500–5,000 26Over 5,000 21
Total number of employees 1,978,078Total non-unionized employees 992,467
© The Conference Board of Canada. All rights reserved. Please contact cboc.ca/ip with questions or concerns about the use of this material.
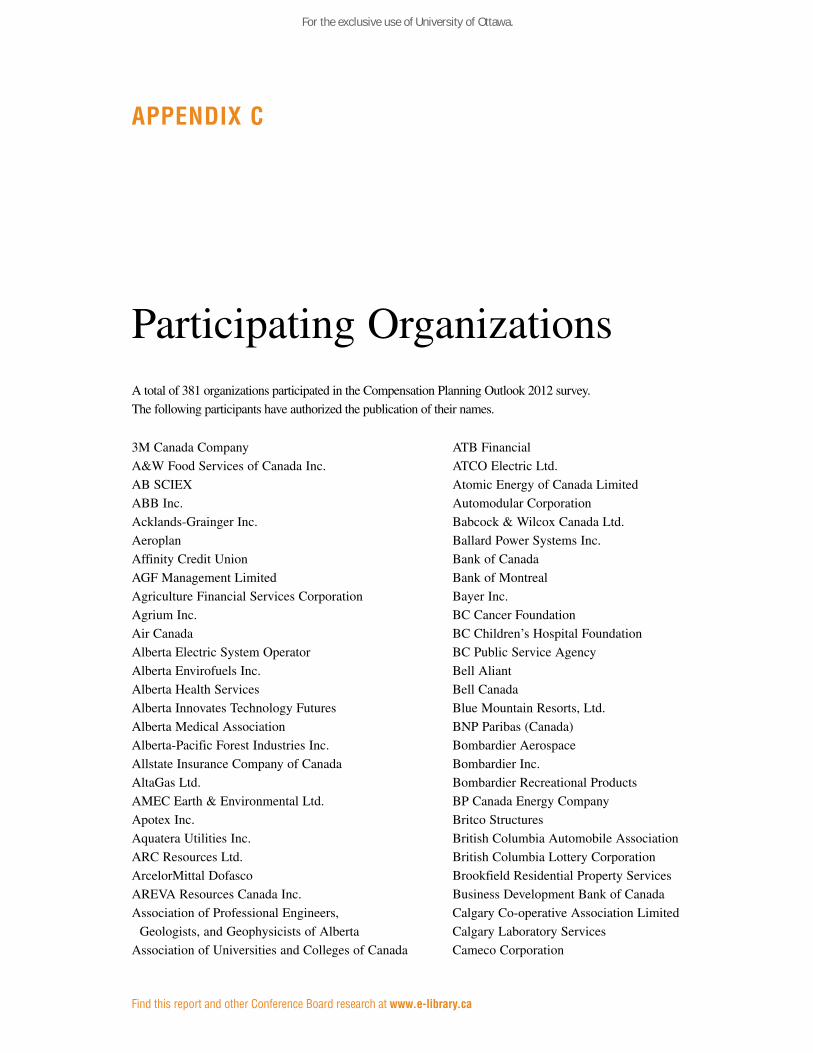
Find this report and other Conference Board research at www .e-library .ca
aPPenDix c
Participating Organizations A total of 381 organizations participated in the Compensation Planning Outlook 2012 survey.
The following participants have authorized the publication of their names.
3M Canada Company
A&W Food Services of Canada Inc.
AB SCIEX
ABB Inc.
Acklands-Grainger Inc.
Aeroplan
Affinity Credit Union
AGF Management Limited
Agriculture Financial Services Corporation
Agrium Inc.
Air Canada
Alberta Electric System Operator
Alberta Envirofuels Inc.
Alberta Health Services
Alberta Innovates Technology Futures
Alberta Medical Association
Alberta-Pacific Forest Industries Inc.
Allstate Insurance Company of Canada
AltaGas Ltd.
AMEC Earth & Environmental Ltd.
Apotex Inc.
Aquatera Utilities Inc.
ARC Resources Ltd.
ArcelorMittal Dofasco
AREVA Resources Canada Inc.
Association of Professional Engineers,
Geologists, and Geophysicists of Alberta
Association of Universities and Colleges of Canada
ATB Financial
ATCO Electric Ltd.
Atomic Energy of Canada Limited
Automodular Corporation
Babcock & Wilcox Canada Ltd.
Ballard Power Systems Inc.
Bank of Canada
Bank of Montreal
Bayer Inc.
BC Cancer Foundation
BC Children’s Hospital Foundation
BC Public Service Agency
Bell Aliant
Bell Canada
Blue Mountain Resorts, Ltd.
BNP Paribas (Canada)
Bombardier Aerospace
Bombardier Inc.
Bombardier Recreational Products
BP Canada Energy Company
Britco Structures
British Columbia Automobile Association
British Columbia Lottery Corporation
Brookfield Residential Property Services
Business Development Bank of Canada
Calgary Co-operative Association Limited
Calgary Laboratory Services
Cameco Corporation
For the exclusive use of University of Ottawa.
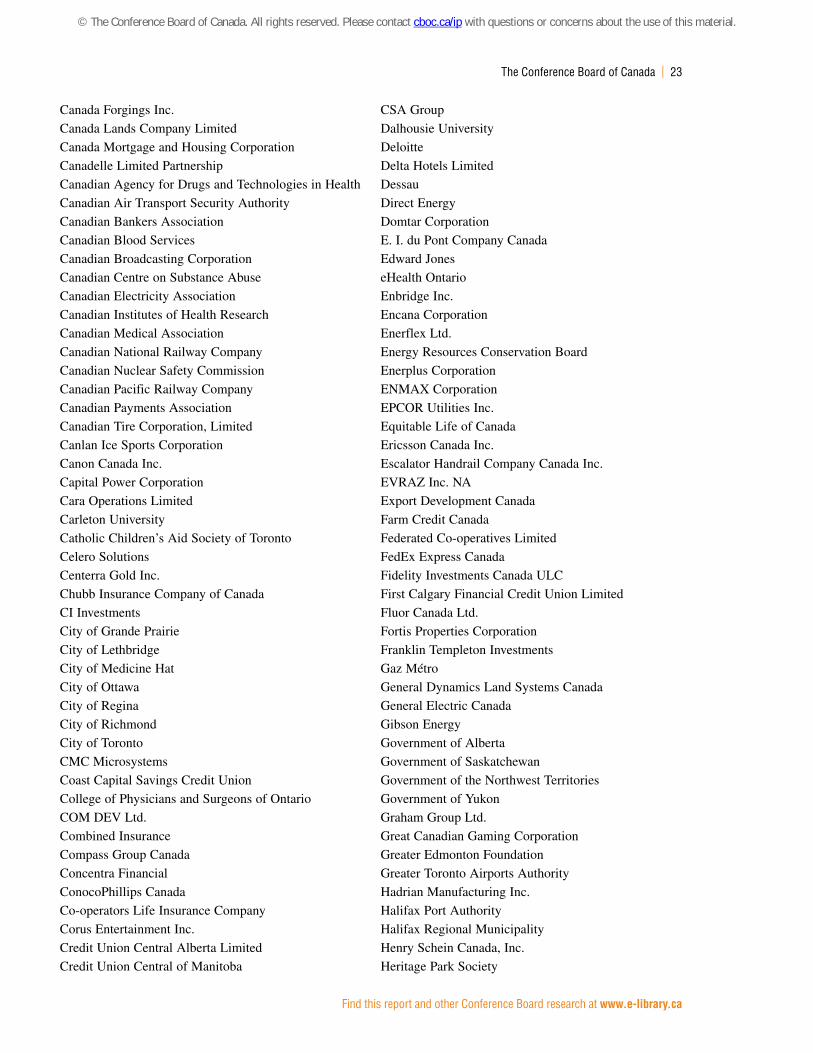
The Conference Board of Canada | 23
Find this report and other Conference Board research at www .e-library .ca
Canada Forgings Inc.
Canada Lands Company Limited
Canada Mortgage and Housing Corporation
Canadelle Limited Partnership
Canadian Agency for Drugs and Technologies in Health
Canadian Air Transport Security Authority
Canadian Bankers Association
Canadian Blood Services
Canadian Broadcasting Corporation
Canadian Centre on Substance Abuse
Canadian Electricity Association
Canadian Institutes of Health Research
Canadian Medical Association
Canadian National Railway Company
Canadian Nuclear Safety Commission
Canadian Pacific Railway Company
Canadian Payments Association
Canadian Tire Corporation, Limited
Canlan Ice Sports Corporation
Canon Canada Inc.
Capital Power Corporation
Cara Operations Limited
Carleton University
Catholic Children’s Aid Society of Toronto
Celero Solutions
Centerra Gold Inc.
Chubb Insurance Company of Canada
CI Investments
City of Grande Prairie
City of Lethbridge
City of Medicine Hat
City of Ottawa
City of Regina
City of Richmond
City of Toronto
CMC Microsystems
Coast Capital Savings Credit Union
College of Physicians and Surgeons of Ontario
COM DEV Ltd.
Combined Insurance
Compass Group Canada
Concentra Financial
ConocoPhillips Canada
Co-operators Life Insurance Company
Corus Entertainment Inc.
Credit Union Central Alberta Limited
Credit Union Central of Manitoba
CSA Group
Dalhousie University
Deloitte
Delta Hotels Limited
Dessau
Direct Energy
Domtar Corporation
E. I. du Pont Company Canada
Edward Jones
eHealth Ontario
Enbridge Inc.
Encana Corporation
Enerflex Ltd.
Energy Resources Conservation Board
Enerplus Corporation
ENMAX Corporation
EPCOR Utilities Inc.
Equitable Life of Canada
Ericsson Canada Inc.
Escalator Handrail Company Canada Inc.
EVRAZ Inc. NA
Export Development Canada
Farm Credit Canada
Federated Co-operatives Limited
FedEx Express Canada
Fidelity Investments Canada ULC
First Calgary Financial Credit Union Limited
Fluor Canada Ltd.
Fortis Properties Corporation
Franklin Templeton Investments
Gaz Métro
General Dynamics Land Systems Canada
General Electric Canada
Gibson Energy
Government of Alberta
Government of Saskatchewan
Government of the Northwest Territories
Government of Yukon
Graham Group Ltd.
Great Canadian Gaming Corporation
Greater Edmonton Foundation
Greater Toronto Airports Authority
Hadrian Manufacturing Inc.
Halifax Port Authority
Halifax Regional Municipality
Henry Schein Canada, Inc.
Heritage Park Society
© The Conference Board of Canada. All rights reserved. Please contact cboc.ca/ip with questions or concerns about the use of this material.
24 | Performance Management—June 2012
Find this report and other Conference Board research at www .e-library .ca
Hewitt Equipment Limited
Hewlett Packard (Canada) Co.
Hoffmann-La Roche Limited
Holcim (Canada) Inc.
Holland Bloorview Kids Rehabilitation Hospital
Home Depot Canada
Hudson Bay Credit Union
Husky Energy Inc.
Hydro-Québec
IAMGOLD Corporation
IBM Canada Ltd.
Imperial Oil Ltd.
Imperial Tobacco Canada Limited
IMS Health
Independent Electricity System Operator
Industrial Alliance, Insurance
and Financial Services Inc.
Information Services Corporation of Saskatchewan
Innovapost
Insurance Corporation of British Columbia
Intact Financial Corporation
Inter Pipeline Fund
Interior Savings Credit Union
International Development Research Centre
Investors Group Inc.
Island Savings Credit Union
Kellogg Canada Inc.
Kinder Morgan Canada Inc.
Kinectrics Inc.
Kinross Gold Corporation
L-3 Communications—Wescam Inc.
Ledcor Group of Companies
Lifelabs Inc.
Lilydale Inc., a Sofina Foods Inc. company
Liquor Control Board of Ontario
Loblaw Companies Ltd.
Lockheed Martin Canada Inc.
London Health Sciences Centre
Loto-Québec
MacDonald, Dettwiler and Associates Ltd.
Manitoba Liquor Control Commission
Manitoba Lotteries Corporation
Manitoba Public Insurance
Manulife Financial
Maple Leaf Foods Inc.
Marine Atlantic Inc.
Marsh Canada Limited
Mattel Canada Inc.
MCAP
McCormick Canada
MCF Housing for Seniors
McGill University
McMaster University
MEG Energy
Mercer
Meridian Credit Union
Methanex Corporation
Metro Toronto Convention Centre Corporation
Metro Vancouver
Molson Coors Canada
Morneau Shepell
Mosaic Group Inc.
MTS Allstream Inc.
Mylan Pharmaceuticals ULC
NAL Resources Management Ltd.
National Bank Financial Group
NAV CANADA
New Brunswick Office of Human Resources
New Brunswick Power Holding Corporation
Newalta Corporation
Nexen Inc.
Nordion Inc.
North American Construction Group
NOVA Chemicals
Nova Scotia Liquor Corporation
NovaGold Resources Inc.
Novatel Inc.
Ontario Energy Board
Ontario Pension Board
Ontario Power Authority
Ontario Power Generation
Ontario Securities Commission
Ontario Teachers’ Pension Plan
OPSEU Pension Trust
Pacific Northern Gas
Panasonic Canada Inc.
Parmalat Canada
PCL Constructors Inc.
Pelmorex Media Inc.
Pengrowth Energy Corporation
Penn West Exploration
People First HR Services
PepsiCo Canada
Pitney Bowes Inc.
For the exclusive use of University of Ottawa.
The Conference Board of Canada | 25
Find this report and other Conference Board research at www .e-library .ca
Plexo Inc.
Polytainers Inc.
Port Metro Vancouver
Pratt & Whitney Canada
Price Industries Ltd.
PricewaterhouseCoopers LLP
Prince Rupert Port Authority
Psion Inc.
PSP Investments
PTI Group, Inc.
Purolator Inc.
QLT Inc.
Quebecor Media Inc.
RBC Financial Group
Regional Municipality of Durham
Regional Municipality of Halton
Regional Municipality of Niagara
Regional Municipality of Peel
Reitmans Canada Ltd.
Research In Motion
Revera Inc.
RIDLEY Inc.
Rio Tinto
Rogers Communications Inc.
Rothmans, Benson & Hedges Inc.
Russel Metals Inc.
Ryerson University
Saint Elizabeth Health Care
SAIT Polytechnic
Sanofi Canada Inc.
Saputo Inc.
Saskatchewan Government Insurance
SaskEnergy Incorporated
SaskTel
Schneider Electric
Scotiabank
Sears Canada Inc.
Servus Credit Union
Shell Canada Ltd.
Sherritt International
Shoppers Drug Mart/Pharmaprix
Shore Gold Inc.
SickKids Foundation
Siemens Canada Ltd.
SMART Technologies ULC
SNC-Lavalin
Société de transport de Montréal
Société des alcools du Québec
Sony of Canada
Standard Life Canada
Staples Inc.
Stewart & Stevenson Canada
Strathcona Paper
Sudbury Credit Union Limited
Suncor Energy Inc.
Symcor Inc.
Syncrude Canada Ltd.
Tarion Warranty Corporation
TD Bank Financial Group
Teck Resources Limited
Teknion Corporation
Telesat Canada
Teranet Inc.
Teva Canada
The Beer Store
The Brick Ltd.
The Calgary Airport Authority
The Canadian Depository for Securities Limited
The Churchill Corporation
The City of Calgary
The DATA Group of Companies
The Dominion of Canada General Insurance Company
The Great-West Life Assurance Company
The Minto Group
The University of British Columbia
The Wawanesa Mutual Insurance Company
The Wendy’s Company
Thermo Fisher Scientific
Tim Hortons Inc.
TimberWest Forest Corp.
TMX Group Inc.
Toronto Central Community Care Access Centre
Toronto Hydro-Electric System Limited
Toronto Transit Commission
Total E&P Canada
Town of Oakville
Town of Okotoks
Town of Richmond Hill
Toyota Motor Manufacturing Canada Inc.
TransAlta Corporation
Transat A.T. Inc.
TransCanada Corporation
Treasury Board of Canada Secretariat
Troy Life & Fire Safety Ltd.
© The Conference Board of Canada. All rights reserved. Please contact cboc.ca/ip with questions or concerns about the use of this material.
26 | Performance Management—June 2012
Find this report and other Conference Board research at www .e-library .ca
University Health Network
University of Ontario Institute of Technology
University of Regina
University of Saskatchewan
University of Toronto
UPS Canada
VAE Nortrak Ltd.
Vancity
VIA Rail Canada
Vicwest Building Products, a division
of Vicwest Corporation
Viterra
Walmart Canada Corp.
Westminster Savings Credit Union
Weyerhaeuser Company Limited
Workers’ Compensation Board—Alberta
Workplace Safety and Insurance Board
Xerox Canada
YMCA of Greater Toronto
Zarlink Semiconductor
Zurich Canada
For the exclusive use of University of Ottawa.
Do you want to have access to expert thinking on the issues that really matter to you and your organization?
Our e-library contains hundreds of Conference Board research studies in the areas of Organizational Performance, Economic Trends and Forecasts, and Public Policy. visit www .e-library .ca or call 1-866-711-2262 for more information.
e-Library
get expert insights when you need them most [ conferenceboard .ca ]
© The Conference Board of Canada. All rights reserved. Please contact cboc.ca/ip with questions or concerns about the use of this material.
conferenceboard.ca
Publ
icat
ion
13-0
03E-
copy
: $62
5
255 Smyth Road, Ottawa ON K1H 8M7 Canada Tel. 613-526-3280 • Fax 613-526-4857 • Inquiries 1-866-711-2262
The Conference Board, Inc. 845 Third Avenue, New York NY 10022-6679 USA Tel. 212-759-0900 • Fax 212-980-7014 • www.conference-board.orgThe Conference Board Europe Chaussée de La Hulpe 130, Box 11, B-1000 Brussels, Belgium Tel. +32 2 675 54 05 • Fax +32 2 675 03 95
The Conference Board Asia-Pacific 2802 Admiralty Centre, Tower 1, 18 Harcourt Road, Admiralty Hong Kong SAR Tel. +852 2511 1630 • Fax +852 2869 1403
For the exclusive use of University of Ottawa.