Embed Size (px)
Citation preview

Performance Measurement and Analysis with gprof
Tri-Lab Tools Workshop
Mahesh Rajan, SNLWednesday, March 24, 2010 @ SNLThursday March 25, 2010 @ LANL
Thursday July 29, 2010 @ LLNL
Sandia is a multi-program laboratory operated by Sandia Corporation, a Lockheed Martin Company, for the United States National Nuclear Security Administration and the Department of Energy under contract DE-AC04-94AL85000
Objectives
• A quick overview of gprof
• Information to get started on TLCC system like SNL’s glory
• Information to get started on dawndev
• A simple example to illustrate the use of the tool and analysis of an application

gprof: What can it do?A simple to use performance profiler that provides: function flat profile, call-graph profiles and the number of function calls
Program Instrumentation through compiler flag – No source modification Timings are collected by statistical sampling Could be used with serial or parallel program Measurement impacts run time. Typically the program counter is looked at around 100 times per second of run time Mostly used as a command line tool without a GUI, but GUIs are available: http://kprof.sourceforge.net/
Basic Information for getting started -TLCC
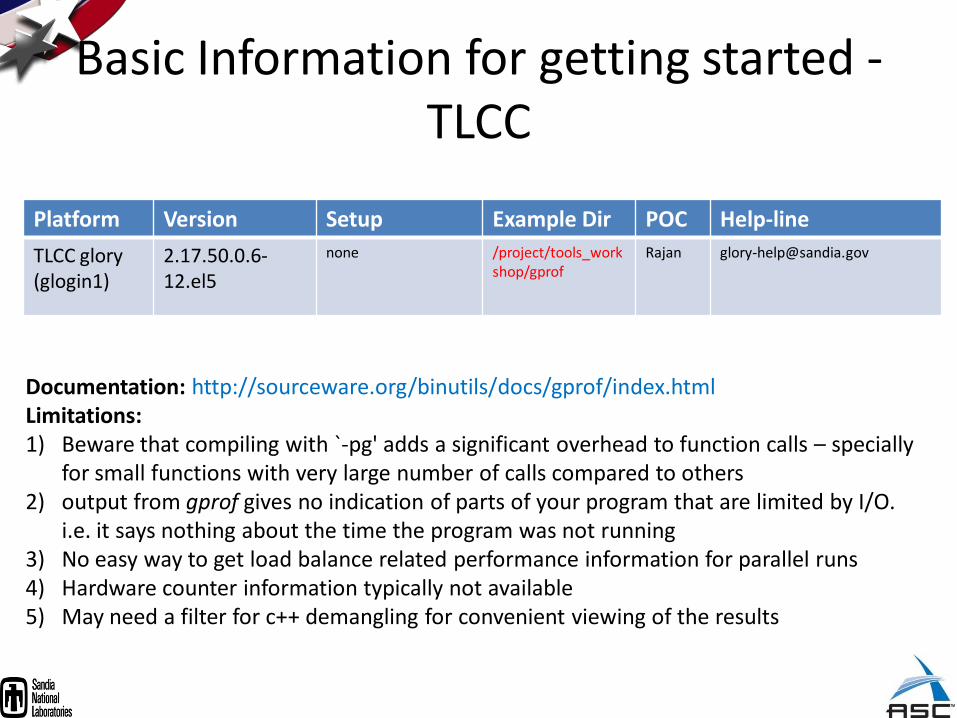
Platform Version Setup Example Dir POC Help-line
TLCC glory (glogin1)
2.17.50.0.6-12.el5
none /project/tools_workshop/gprof
Rajan [email protected]
Documentation: http://sourceware.org/binutils/docs/gprof/index.html Limitations:1) Beware that compiling with `-pg' adds a significant overhead to function calls – specially
for small functions with very large number of calls compared to others 2) output from gprof gives no indication of parts of your program that are limited by I/O.
i.e. it says nothing about the time the program was not running3) No easy way to get load balance related performance information for parallel runs4) Hardware counter information typically not available5) May need a filter for c++ demangling for convenient viewing of the results

Basic Information for getting started -dawndev
Platform Version Setup Example Dir POC Help-line
dawndev TBD none /home/mrajan/tools_workshop
Rajan [email protected]
IBM Differences:1) GMON_OUT_PREFIX environment variable does not seem to work in renaming profile
output files2) IBM Red Book suggests just linking with `-pg‘ to reduce overhead of function calls –
needs further investigation on dawndev3) Profile data goes to gmon.out.<mpi_rank_id> for parallel runs4) ‘gprof a.out gmon.out.*’ DOES NOT produce an ASCI profile output properly interpreting
wild-card ‘*’; Behavior different from clusters running Linux (like TLCC) where the profile has the sum of the run times from all the processors
Using gprof
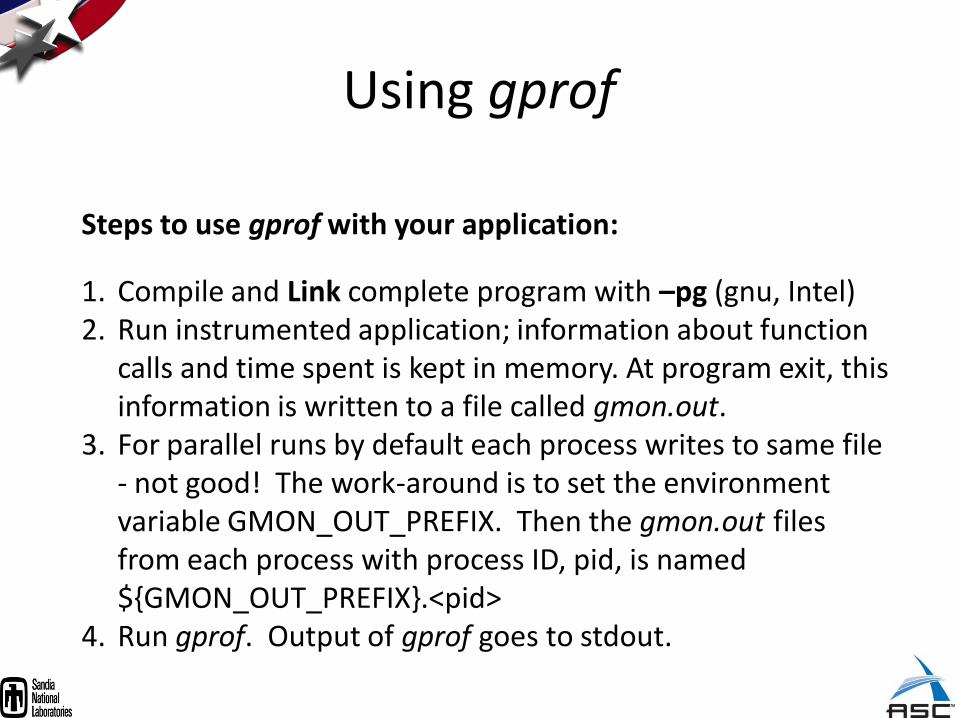
Steps to use gprof with your application:
1. Compile and Link complete program with –pg (gnu, Intel)2. Run instrumented application; information about function
calls and time spent is kept in memory. At program exit, this information is written to a file called gmon.out.
3. For parallel runs by default each process writes to same file - not good! The work-around is to set the environment variable GMON_OUT_PREFIX. Then the gmon.out files from each process with process ID, pid, is named ${GMON_OUT_PREFIX}.<pid>
4. Run gprof. Output of gprof goes to stdout.
gprof Example SNL Mantevo HPCCG ( Conjugate Gradient Mini-app)
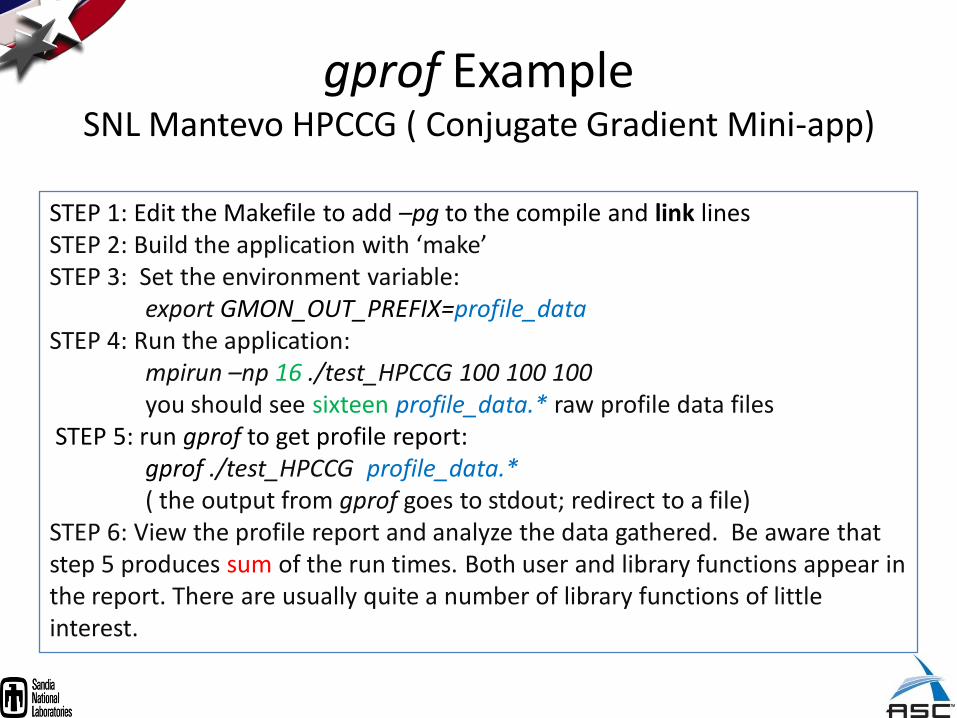
STEP 1: Edit the Makefile to add –pg to the compile and link linesSTEP 2: Build the application with ‘make’STEP 3: Set the environment variable:
export GMON_OUT_PREFIX=profile_dataSTEP 4: Run the application:
mpirun –np 16 ./test_HPCCG 100 100 100you should see sixteen profile_data.* raw profile data files
STEP 5: run gprof to get profile report:gprof ./test_HPCCG profile_data.* ( the output from gprof goes to stdout; redirect to a file)
STEP 6: View the profile report and analyze the data gathered. Be aware that step 5 produces sum of the run times. Both user and library functions appear in the report. There are usually quite a number of library functions of little interest.

Sample gprof reportFlat & Call graph profile
Flat profile:
Each sample counts as 0.01 seconds.% cumulative self self total
time seconds seconds calls s/call s/call name82.48 688.07 688.07 2400 0.29 0.29 HPC_sparsemv(HPC_Sparse_Matrix_STRUCT*, double const*, double*)11.10 780.68 92.60 7184 0.01 0.01 waxpby(int, double, double const*, double, double const*, double*)4.95 821.99 41.32 4768 0.01 0.01 ddot(int, double const*, double const*, double*, double&)
CODE Timer Output:********** Performance Summary (times in sec) ***********Total Time/FLOPS/MFLOPS = 57.123/1.52576e+11/2671.01.DDOT Time/FLOPS/MFLOPS = 3.14276/9.536e+09/3034.27.
Minimum DDOT MPI_Allreduce time (over all processors) = 0.029531Maximum DDOT MPI_Allreduce time (over all processors) = 0.773707Average DDOT MPI_Allreduce time (over all processors) = 0.488581
WAXPBY Time/FLOPS/MFLOPS = 6.36643/1.4304e+10/2246.78.SPARSEMV Time/FLOPS/MFLOPS = 47.5337/1.28736e+11/2708.31.
Observe that gprofprofile times have small discrepancies to the times reported by the code. However percentages are close
Call graph (explanation follows)
granularity: each sample hit covers 2 byte(s) for 0.00% of 834.33 seconds
index % time self children called name-----------------------------------------------
0.00 822.56 16/16 main [1][2] 98.6 0.00 822.56 16 HPCCG(HPC_Sparse_Matrix_STRUCT*, double const*, double*, int, double, int&, double&, double*) [2]
688.07 0.00 2400/2400 HPC_sparsemv(HPC_Sparse_Matrix_STRUCT*, double const*, double*) [3]92.60 0.00 7184/7184 waxpby(int, double, double const*, double, double const*, double*) [4]41.32 0.00 4768/4768 ddot(int, double const*, double const*, double*, double&) [5]0.57 0.00 2400/2400 exchange_externals(HPC_Sparse_Matrix_STRUCT*, double const*) [8]0.00 0.00 28768/38368 mytimer() [19]
-----------------------------------------------
Code Reported Total time 57.12
Functiongprof flat self
code time
code_t_16X Difference
gprof % flat
code % calculated
HPC_sparsemv 688.8 47.53 760.5 71.64 82.48 82.83%
waxpby 92.44 6.366 101.8 9.422 11.10 11.06%
ddot 41.68 3.142 50.28 8.604 4.95 5.80%

Performance Measurement and Analysis with CrayPat and
Apprentice
Tri-Lab Tools Workshop
Mahesh Rajan, SNLWednesday, March 24, 2010 @ SNLThursday March 25, 2010 @ LANL
Thursday July 29, 2010 @ LLNL
Sandia is a multi-program laboratory operated by Sandia Corporation, a Lockheed Martin Company, for the United States National Nuclear Security Administration and the Department of Energy under contract DE-AC04-94AL85000
Objectives
• A quick overview of Cray’s CrayPat and Apprentice tools
• Information to get started on SNL’s Red Storm, and Cray XT5 and ACES Cielo/Cray XE6
• A simple example to illustrate the use of the tool and analysis of an application
• A preview of what is covered in the afternoon session -- experience with use of CrayPat with a few applications

CrayPat: What can it do?Helps you identify and characterize performance issues
Automatic Program Instrumentation – No source or Makefile modification Can be used to measure MPI, I/O, heap, hardware counter data Basic infrastructure consists of:
pat_build, pat_hwpc/lib_hwpc, pat_report, pat_help Single Processor Optimization: call graph, hardware counter data, API for low level instrumentation Message Passing Optimization: MPI profiler, load balance information, message statistics, MPI tracing

Basic Information for getting started – Red StormPlatform Version Setup Example Dir POC Help-line
Red Storm Qual (rsqual01)
3.2/4.3.2 (CrayPat/apprentice2)
Module load craypat/3.2Module load apprentice2/4.3.2
/home/mrajan/tools_workshop
Rajan, Davis, Dinge [email protected]
Red Storm -classified
3.2/4.3.2 (CrayPat/apprentice2)
Module load craypat/3.2Module load apprentice2/4.3.2
/home/mrajan_s/tools_workshop
Rajan, Davis, Dinge [email protected]
Documentation: http://docs.cray.com -- click on ‘platforms’, choose ‘XT3’ , ‘XT4’Limitations:1) pat_build –g mpi –u <executable> can bloat run time; sampling available in later release
of CrayPat2) Pat_build –g mpi for complex codes like Sierra can make the executable > 2GB3) lib_hwpc on Red Storm may not give correct counts for quad-core Opterons4) Pat_build –g mpi –u < executable> may break for complex codes like Sierra – may need
to selectively instrument
Tutorials Offered by Cray: At every SC conference, at CUG meetings and at LCI conference

Basic Information for getting started –Cray XT5, Cielo/Cray XE6
Platform Version Setup Example Dir POC Help-line
Cray XT5(xtplogin01)
5.0.2.2 (xt-crayPat/apprentice2)
Module load xt-craypat/5.0.2.2Module load apprentice2/5.0.2.2
/home/mrajan/tools_workshop
Rajan, Davis, Dinge [email protected]
Cray XE6 ( mzlogin01) Or Cielito at LANL (ci-fe1)
5.0.2/5.1.0.14(CrayPat/apprentice2)
Module load craypat/5.0.2.Module load apprentice2/5.1.0.14
/home/mrajan/tools_workshop
Rajan, Davis, Dinge TBD
Documentation: http://docs.cray.com -- click on ‘platforms’, choose ‘XT3’ , ‘XT4’Enhancements:1) Sampling is available - helps lower instrumentation overhead and run time bloat

Using CrayPat
Six steps to use of CrayPat with your application:
1. Load CrayPat module2. Build application - No makefile modification needed3. Instrument application with pat_build
% pat_build [-g group] [-u] [options] a.outAnalysis Groups: mpi, io, heap, user function (-u) …
4. Run instrumented application5. Generate performance file (.ap2) with pat_report
% pat_report –f ap2 [options] <.xf file>6. Performance analysis and visualization with CrayPat and Cray Apprentice2

CrayPat & Apprentice Example SNL Mantevo HPCCG ( Conjugate Gradient Mini-app)
STEP 1: Load craypat Module; module load craypat/3.2STEP 2: Build the application: ‘make’ gives executable ‘test_HPCCG’STEP 3: Instrument the application:
pat_build –u –g mpi test_HPCCG(gives an instrumented executable test_HPCCG+pat)
STEP 4: Run the application: yod –sz 4 test_HPCCG+pat 100 100 100
STEP 5: Generate ap2 or ASCI performance filepat_report –f ap2 <the .xf file produced in STEP 4>pat_report <the .xf file produced in STEP 4> pat_report has options: -b, -d, -s to customize the report; get from manpage
STEP 6: Visualize the performance data; module load apprentice2/4.3.2app2 <.ap2 file from STEP 5>
CrayPat runtime environment variables: 1) PAT_RT_SUMMARY=1 ( summary) ; PAT_RT_SUMMARY=0 (for trace)2) PAT_RT_EXPFILE_PER_PROCESS=1 ( one file per process if running from NFS, Do not need if running from /scratch Lustre)3) PAT_RT_HWPC=1 ( hardware counter event set 1)EVENT_SET 1 gives: Float Ops, Load Stores, L1 Misses, & TLB Missesmore info: man hwpc
(example batch script)#!/bin/bash#PBS -lselect=16:dual#PBS -lwalltime=0:10:00#PBS -A FY092581export PAT_RT_EXPFILE_PER_PROCESS=1export PAT_RT_HWPC=1export PAT_RT_SUMMARY=1 cd $PBS_O_WORKDIRyod -VN2 -sz 16 test_HPCCG+pat 100 100 100

Sample pat_report ASCI OutputNotes for table 1:
Table option:-O profile
Options implied by table option:-d ti%@0.05,ti,imb_ti,imb_ti%,tr -b ex,gr,fu,pe=HIDE
Table 1: Profile by Function Group and Function
Time % | Time |Imb. Time | Imb. | Calls |Experiment=1| | | Time % | |Group| | | | | Function| | | | | PE='HIDE'
100.0% | 35.307257 | -- | -- | 123578 |Total|-------------------------------------------------------------| 99.2% | 35.008960 | -- | -- | 55216 |USER||------------------------------------------------------------|| 78.7% | 27.567933 | 0.054516 | 0.2% | 2400 |HPC_sparsemv(HPC_Sparse_Matrix_STRUCT *, const double *, double *)|| 14.5% | 5.080704 | 0.024785 | 0.5% | 7184 |waxpby(int, double, const double *, double, const double *, double *)|| 4.9% | 1.711066 | 0.037586 | 2.3% | 4768 |ddot(int, const double *, const double *, double *, double &)|| 1.0% | 0.359326 | 0.000920 | 0.3% | 16 |generate_matrix(int, int, int, HPC_Sparse_Matrix_STRUCT **, double **, double **, double **)|| 0.7% | 0.240166 | 0.003094 | 1.4% | 16 |make_local_matrix(HPC_Sparse_Matrix_STRUCT *)|| 0.1% | 0.026610 | 0.004042 | 14.1% | 2400 |exchange_externals(HPC_Sparse_Matrix_STRUCT *, const double *)
CODE Timer Output:********** Performance Summary (times in sec) ***********
Total Time/FLOPS/MFLOPS = 34.626/1.52576e+11/4406.41.DDOT Time/FLOPS/MFLOPS = 2.18476/9.536e+09/4364.77.
Minimum DDOT MPI_Allreduce time (over all processors) = 0.115714Maximum DDOT MPI_Allreduce time (over all processors) = 0.433244Average DDOT MPI_Allreduce time (over all processors) = 0.17458
WAXPBY Time/FLOPS/MFLOPS = 5.06025/1.4304e+10/2826.74.SPARSEMV Time/FLOPS/MFLOPS = 27.3116/1.28736e+11/4713.6.
Observe: CrayPat profile times match the times reported by the code ( similar colors )
Run time of instrumented code can bloat; be aware!

Sample pat_report; Hardware Performance Counter PAT_RT_HWPC=1
Table 1: Profile by Function Group and Function
Experiment=1 / Group / Function / PE='HIDE'....
========================================================================USER / HPC_sparsemv(HPC_Sparse_Matrix_STRUCT *, const double *, double *)------------------------------------------------------------------------Time% 77.6%Time 25.835989Imb.Time 0.324971Imb.Time% 1.3%Calls 2400PAPI_TLB_DM 8.557M/sec 221065210 missesPAPI_L1_DCA 8357.318M/sec 215916426481 opsPAPI_FP_OPS 5571.610M/sec 143945966653 opsDC_MISS 559.023M/sec 14442703857 opsUser time 25.836 secs 62005472433 cyclesUtilization rate 100.0%HW FP Ops / Cycles 2.32 ops/cycleHW FP Ops / User time 5571.610M/sec 143945966653 ops 7.3%peakHW FP Ops / WCT 5571.529M/secComputation intensity 0.67 ops/refLD & ST per TLB miss 976.71 ops/missLD & ST per D1 miss 14.95 ops/missD1 cache hit ratio 93.3%% TLB misses / cycle 0.0%
Flat Profile times
HWC data
Derived Metrics
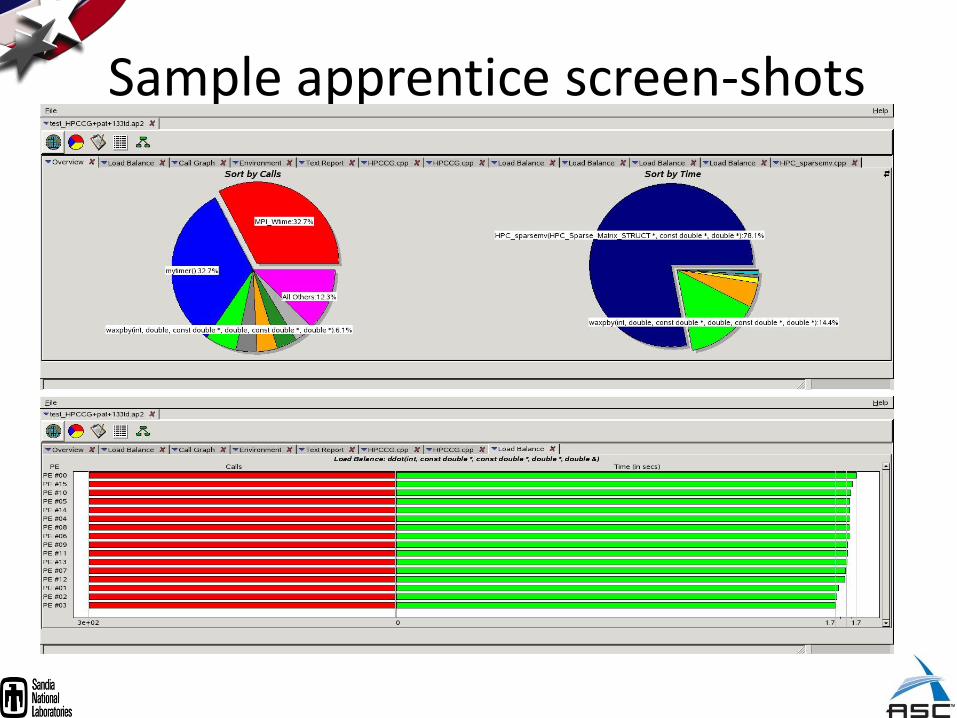
Sample apprentice screen-shots

Afternoon Session Possible Topics
• Live demo of CrayPat and Apprentice with couple of applications
• Analysis of an application to understand performance issues
• Limitations of CrayPat and possible work-around
• Answer user specific questions