Embed Size (px)
Citation preview

Performance Measurement Work Group
Meeting
2/19/2020

2
Agenda
1. Welcome and introductions2. Potentially Avoidable Utilization (PAU)3. Readmissions Reduction Incentive Program
(RRIP)4. Quality Based Reimbursement (QBR) Subgroup
Overview5. Qlarant QIN Scope of Work Overview

PAU Measurement Report
▶ Staff presented a RY21 and RY22 PAU Measurement Report to the Commission in February.
▶ Measurement Report Goals:▶ Provide progress report on efforts to modernize PAU
▶ Per Capita PQIs▶ PDIs▶ PAU subgroup▶ Low value care exploration
▶ Align PAU Savings program timeline with other quality program timelines (performance measurement determined earlier in performance year)
▶ Request Commissioner feedback on strategic direction
4
Review IP/OBS consideration
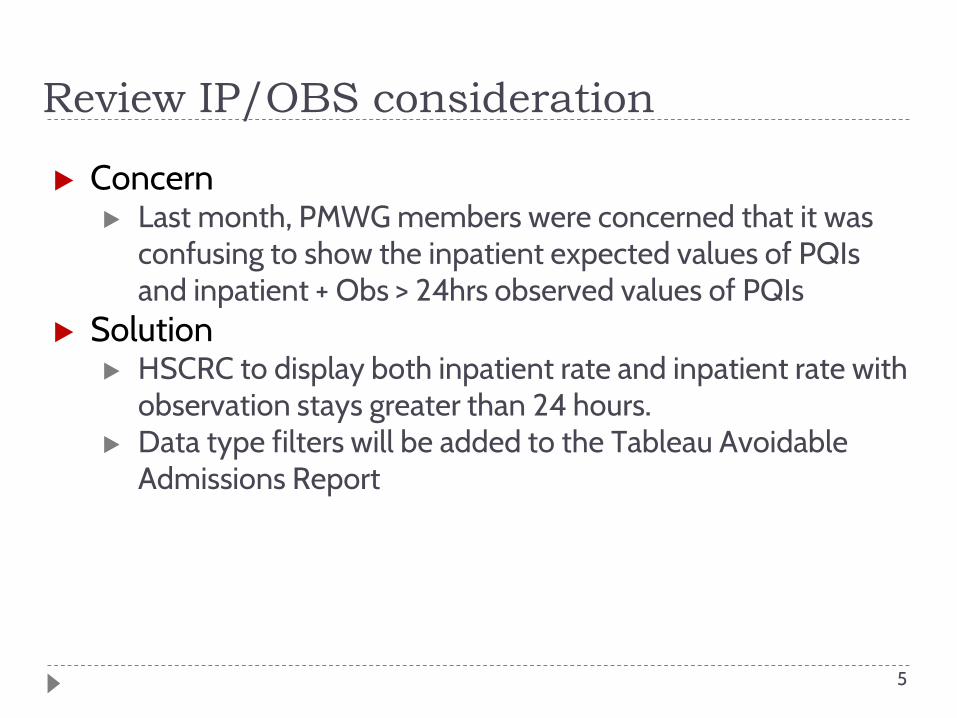
▶ Concern▶ Last month, PMWG members were concerned that it was
confusing to show the inpatient expected values of PQIs and inpatient + Obs > 24hrs observed values of PQIs
▶ Solution▶ HSCRC to display both inpatient rate and inpatient rate with
observation stays greater than 24 hours. ▶ Data type filters will be added to the Tableau Avoidable
Admissions Report
5

RY2021 Adjustment
▶ Will bring hospital-specific methodology/modeling to March meeting
▶ Percent Reduction▶ Plan on using the inflation-based calculation
developed last year to calculate the PAU Savings amount in the spring
▶ New: Exclude dollars associated with categorical exclusions to align with Innovation policy
6

Overall impetus for discussion
▶ All Payer Model focused on reducing avoidable inpatient utilization and appropriately moving services down the continuum of care. In the Total Cost of Care Model, staff need to consider avoidable utilization in other settings.
▶ Multiple programs/policies related to the TCOC model reference avoidable ED, but may use different definitions
▶ Interest in selecting one definition to be used as the default definition through analyses and reporting
8

Why Avoidable ED
▶ Research shows it can be impacted▶ MDPCP investments in PCPs - should have reduced
avoidable ED utilization▶ Hospitals have impacted avoidable ED rates, but those
reductions are shared in market shift▶ Mentioned in our RTI report
9

Avoidable ED - Goals for today’s meeting
▶ Introduce Avoidable ED concept▶ Opportunities and challenges▶ Timeline
▶ Introduce Avoidable ED definitions▶ NYU/Billings Algorithm▶ Adaptations of PQI definition
▶ All Payer Model Evaluation definition▶ MedPAC/RTI definition
▶ 3M PPV▶ Review Preliminary results
10

Avoidable ED
▶ What is avoidable ED? Can be split into two buckets: ▶ Preventive - ED care needed but could have been
prevented with community and primary care▶ Care pathways- alternative setting of care
▶ Also preventive▶ Treatment required within 12 hours, but could be treated by
primary care or other outpatient providers▶ Non-emergent
11

Avoidable ED Opportunities/Challenges
▶ Regulatory Challenges▶ Care settings with EMS▶ EMTALA
▶ Other Challenges▶ Insurance Coverage▶ Physician supply
12

Timeline
▶ CY2020 Q1 (Current): ED measure selection and initial testing
▶ CY2020 Q2: Discuss attribution approaches and develop risk adjustment if applicable
▶ CY2020 Q3-Q4: Build summary reporting and incorporate selected ED measures into data
▶ CY2021 Q1: RY2023 PAU measurement report, potentially recommending avoidable ED measure inclusion in RY2023 PAU measurement (CY2021 Performance Period).
13
Potential Avoidable ED definitions
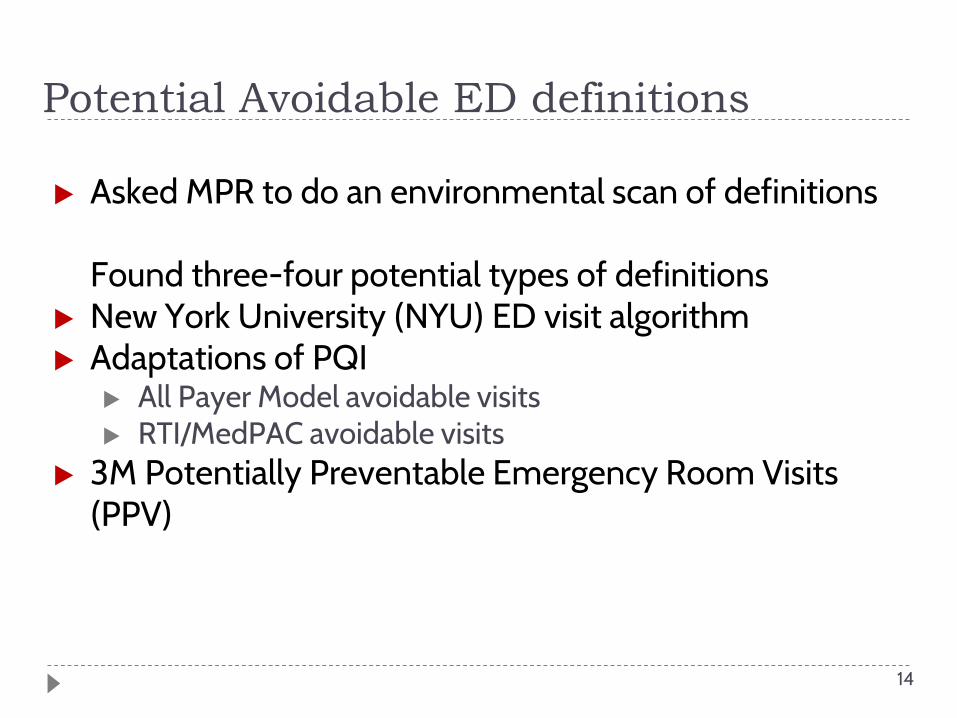
▶ Asked MPR to do an environmental scan of definitions
Found three-four potential types of definitions▶ New York University (NYU) ED visit algorithm ▶ Adaptations of PQI
▶ All Payer Model avoidable visits▶ RTI/MedPAC avoidable visits
▶ 3M Potentially Preventable Emergency Room Visits (PPV)
14

NYU/Billings Algorithm▶ Claims-based measure for assessing the probability that an ED visit with a given
discharge diagnosis falls into one of the four categories: ▶ (1) a non-emergency; ▶ (2) an emergency treatable in primary care setting; ▶ (3) an emergency not treatable in primary care setting but preventable or
avoidable; and ▶ (4) an emergency not preventable or avoidable.
15
Non-emergent: Record indicated that immediate medical care was not required within 12 hours;
Emergent- ED care Needed- Preventable.Avoidable: •ED care was required, but was potentially preventable/avoidable if timely and effective ambulatory care had been received during the episode of illness
Emergent/Primary Care Treatable: treatment was required within 12 hours, but care could have been provided effectively and safely in a primary care setting.
Emergent- ED Care Needed- not
preventable/avoidable: ED care was required and ambulatory care treatment could not have prevented the condition

NYU/Billings Algorithm continued
▶ Probabilities▶ Probabilities developed in the 1990s by NYU researchers▶ Based on study of clinical information from 6,000 ED
records in six Bronx, New York hospitals ▶ Estimated probabilities can then be aggregated to the
population level ▶ No measure steward that updates each year
▶ The NYU algorithm has been widely used in academic research, state programs, and numerous local and industry-led quality initiatives.▶ Pennsylvania Rural Health Model quantifying opportunity▶ The New York State Department of Health dashboards
16

NYU/Billings Algorithm categories
18
Prevention - similar to PQIs
Alternative care pathways
Alternative care pathways
?
??
?

Adapted PQI (All Payer Model Eval)
▶ Potentially avoidable ED visits measure used in the Evaluation of the Maryland All-Payer Model published by CMS (Susan Haber et al, 2019)
▶ Included only four ACSC conditions (chronic COPD or asthma, bacterial pneumonia, uncontrolled diabetes, and heart failure).
19

MedPAC/RTI Avoidable Visits
▶ Developed by RTI and considered by the Medicare Payment Advisory Commission (Feng, et al. 2019). ▶ builds on PQIs and HEDIS measures for Hospitalization for
Potentially Preventable Complications (HPC). ▶ Include:
▶ diabetes, chronic obstructive pulmonary disease (COPD), asthma, hypertension, heart failure, bacterial pneumonia, urinary tract infection, cellulitis, pressure ulcers, upper respiratory infection/otitis/rhinitis, influenza (without pneumonia), and nonspecific back pain.
▶ RTI AV measure classifies visits to binary categories, assuming that any ED visit is either potentially avoidable or not based on the diagnosis or procedure code.
20

3M PPV Measure▶ 3M Potentially Preventable Emergency Room Visits (PPV)
measure identifies ED visits for conditions that could otherwise be treated in a nonemergency setting.
▶ Proprietary▶ Assigns each ED visit to a 3M Enhanced Ambulatory Patient
Group (EAPG) based on claim procedure codes ▶ potentially preventable if the assigned EAPG is one of the
ambulatory sensitive conditions defined by the algorithm ▶ Follows a similar logic as the RTI AV measure, but enables
users to measure specific types of potentially avoidable ED visits.▶ Several states—such as New York, Florida, and
Minnesota— are using the 3M PPV software to monitor ED visits for their all-payer and/or Medicaid populations.
21

Conditions captured
22
APM
evaluation
RTI/MedP
AC AV
measure
Billings
Diabetes M A M
COPD or asthma A A M
Hypertension A M
Heart Failure A A S
Bacterial Pneumonia A A M
UTI A A
Cellulitis A M
Pressure Ulcers A Unclassified
Upper respiratory infection/otitis/rhinitis A M
Influenza (without pneumonia) A S
Non specific back pain A S
Mental health/substance use
Injury subsequent encounters M
Cutaneous abscess A
Gastroenteritis A
Pain in throat and chest S
Other S
A = Avoidable, M = Mostly Avoidable, S = Somewhat Avoidable

Applying analyses to data
All analyses are on HSCRC ED data that does not lead to an admission or an observation stay greater than or equal to 24 hours.
23

Preliminary Results
▶ See Spreadsheets▶ CY 17 and CY18▶ General ED counts and charges by paper▶ Avoidable using original algorithm
24

26
RY 2022 RRIP Draft Recommendations
1. Readmission measure changes:a. Include oncology with cancer-specific clinical adjustments b. Exclude patients discharged AMA from denominator
2. Readmission Improvement Target: -7.5% over five years (-3.07% by end of 2020)
3. Readmission Attainment Target: Maintain current 65 percent attainment threshold for earning rewards based on updated benchmarking
4. Implement payment incentives on disparity gap metric (Reward-Only)
5. Develop all-payer EDAC to assess ED and OBS revisits
27
Commissioner Feedback and Next Steps
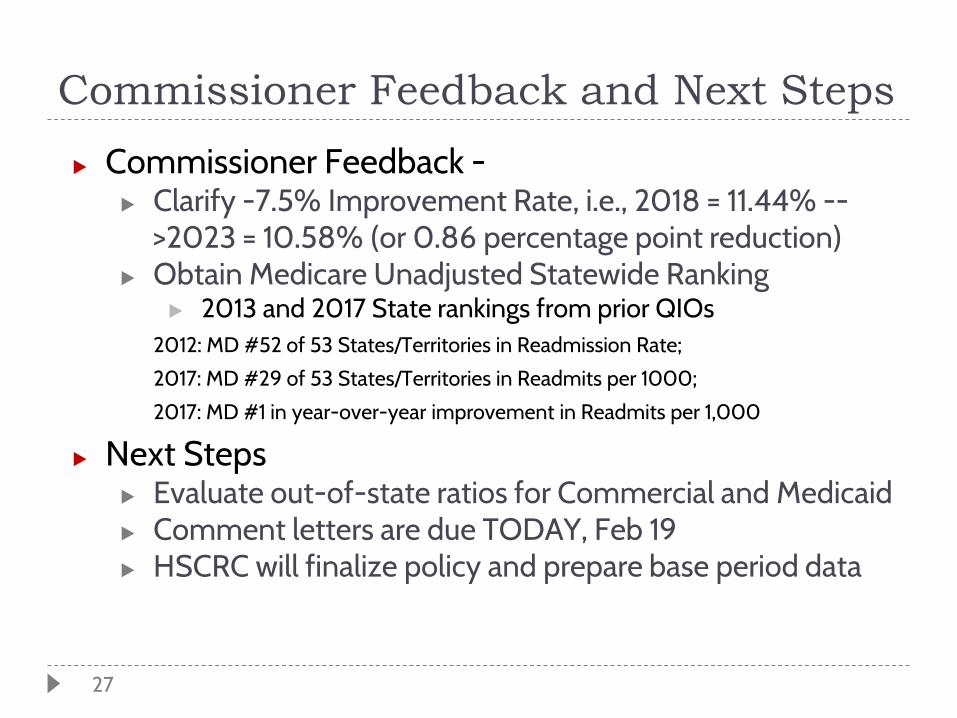
▶ Commissioner Feedback -▶ Clarify -7.5% Improvement Rate, i.e., 2018 = 11.44% --
>2023 = 10.58% (or 0.86 percentage point reduction)▶ Obtain Medicare Unadjusted Statewide Ranking
▶ 2013 and 2017 State rankings from prior QIOs2012: MD #52 of 53 States/Territories in Readmission Rate;
2017: MD #29 of 53 States/Territories in Readmits per 1000;
2017: MD #1 in year-over-year improvement in Readmits per 1,000
▶ Next Steps▶ Evaluate out-of-state ratios for Commercial and Medicaid▶ Comment letters are due TODAY, Feb 19▶ HSCRC will finalize policy and prepare base period data

29
Commissioner Feedback and Next Steps
▶ Commissioner Feedback -▶ Identify opportunities to collaborate with Medicaid managed
care on disparity reduction▶ Evaluate potential for unintended consequences
▶ Will hospitals attempt to avoid high-PAI patients? ◻ Statistical model takes into account hospital average PAI◻ Disparity incentive should be calibrated relative to the main RRIP
incentives, such that overall improvement in readmissions is still primary driver of behavior
▶ Next Steps▶ Interim reporting of demographic components within PAI
(unweighted) will be added to detail-level readmission reports in March
▶ Staff working to develop additional reporting.

30
Policy Evaluation
▶ Introduction of disparity incentive in payment program is
innovative and would make Maryland the first state in
the nation to pilot such an approach:
▶ If we only monitor, we cannot gauge the impact of payment
incentives
▶ Thus staff recommends implementing in RY 2022 as as a
reward only program
▶ Based on experience with disparity gap metric in
payment program, in future years staff may
recommend:
▶ Changes to PAI or gap estimation methods
▶ Modification to financial incentives

31
Staff Proposal
▶ Restrict disparity reward eligibility to hospitals with reduction
in overall readmission rate
▶ RY 2022: Base Year 2018 Performance Year 2020
▶ Preliminary goal, pending SIHIS development, is a 50%
reduction in disparity over 8 year TCOC Model
▶ Proposed RY 2022 reward of:
▶ 0.25% of IP revenue for hospitals on pace for 25% reduction in 8
years, >=6.94% reduction in disparity gap
▶ 0.50% of IP revenue for hospitals on pace for 50% reduction in 8
years, >=15.91% reduction in disparity gap
32
Hospital Reporting
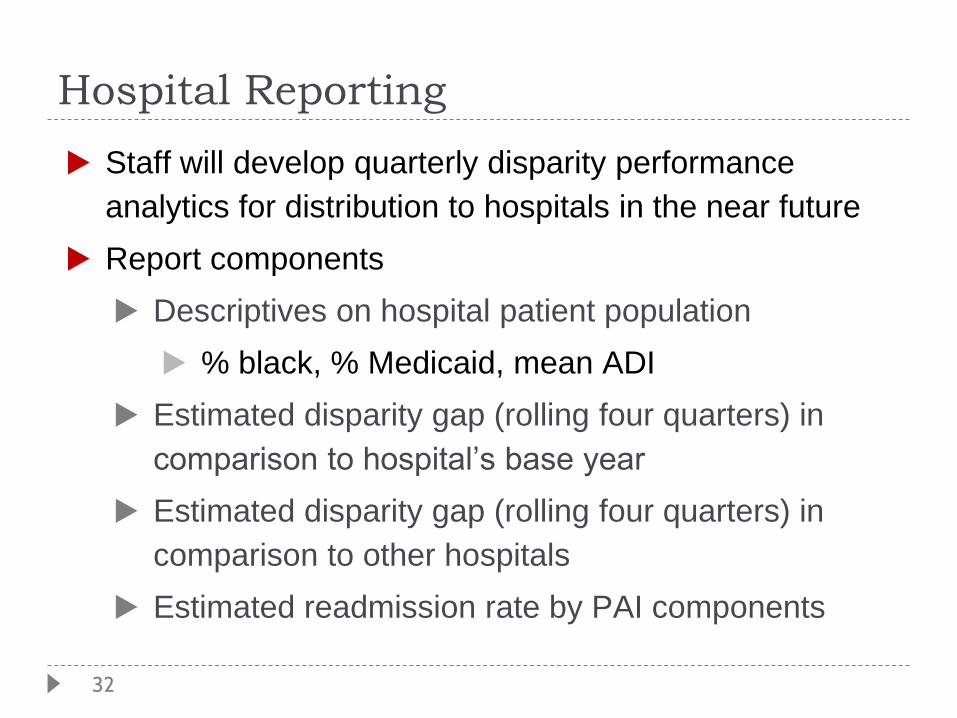
▶ Staff will develop quarterly disparity performance
analytics for distribution to hospitals in the near future
▶ Report components
▶ Descriptives on hospital patient population
▶ % black, % Medicaid, mean ADI
▶ Estimated disparity gap (rolling four quarters) in
comparison to hospital’s base year
▶ Estimated disparity gap (rolling four quarters) in
comparison to other hospitals
▶ Estimated readmission rate by PAI components

34
QBR Redesign Subgroup Purpose and
Goals
▶ Consider options for overhauling the program to
continue to meet or exceed the cost and quality
outcomes of the national VBP program
▶ Ensure the state achieves the goals of the TCOC
Model of better care with improved health outcomes,
while slowing the growth of health spending
▶ Within the scope specified, the goals of the Subgroup
will include reviewing and suggesting options for:
▶ Updating measures in the QBR program
▶ Updating the scoring and incentives
▶ Measurement data sources

35
QBR Redesign Scope of Work
1. Consideration of options for targeting HCAHPS
improvement● Revising incentives to improve performance
2. Consideration of ED wait time measurement issues● Consider options for data sources or data development such as
eCQM ED-2b measure, or ADT feed
● Measure alignment with incentives of Model
● Need and options for potential additional risk adjustment
3. Exploration of complementary measures that align with
State Integrated Health Improvement Strategy (SIHIS)
& RTI Maryland Model evaluation report, e.g.:● Follow-up after discharge measure
● Other care coordination elements that can reinforce use of
Chesapeake Regional Information System for our Patients
(CRISP) data

36
QBR Redesign Scope of Work,
Continued.4. Refinement of existing measures/domains
● Mortality: Shift from current all-payer, all-condition inpatient measure to all-
payer, all-condition 30-day mortality
● Patient Safety Indicator Composite: Implement all-payer PSI composite
● Total Hip/Total Knee complications (THA-TKA): Consider feasibility of
implementing all-payer measure.
5. Consideration of “attainment only” scoring for various aspects of
the program, i.e. mortality
6. Movement to outpatient hospital/ambulatory surgery, e.g.:● New measures such as return to hospital after colonoscopy or surgery at
ambulatory surgery center
● THA-TKA complications after outpatient hospital surgery
7. Consideration of alternative measurement topic or domain options
for needed improvement areas in Maryland, e.g.:● Maternal health care
● Incentives for improving disparities
● Palliative Care

Qlarant (pronounced “Clarant”)
QIO Presentation
37

Enhance the Health
of Your Community
Partner with the IPRO QIN-QIO
Health Services Review Commission Meeting
Performance Measurement Work Group
February 19, 2020

39
Meet Your Presenters
Dr. Paula Neuman, Ed.D., PSYD., MSCP, HSPPDirector of Behavioral Health / Neuropsychologist,
Clinical Psychopharmacologist
Bonnie Horvath, MHSA, FACHESenior Director, Quality Improvement
Angela DiggsProject Manager, Chronic Disease
Janet JonesProject Manager, Care Transitions
Charlotte Gjerloev, BSN, RNProject Manager, Nursing Home Quality
Lisa Nanton, CPhTQuality Improvement Consultant

40
The IPRO QIN-QIO –
Who We Are
• Led by IPRO
• Joined by Healthcentric Advisors and Qlarant
• Offering enhanced resources and support to healthcare providers and the patients and residents they serve
• Promoting patient and family engagement in care
• Supporting implementation and strengthening of innovative, evidence-based, and data-driven methodologies to support improvements
The federally funded Medicare Quality Innovation Network – Quality Improvement Organization for 11 states and the District of Columbia

41
The IPRO QIN-QIO –
Where We Are
IPRO: New York, New Jersey, Ohio
Healthcentric Advisors: Maine, New Hampshire, Vermont, Massachusetts, Connecticut, Rhode Island
Qlarant: Maryland, Delaware, District of Columbia
The IPRO QIN-QIO Region
Working to ensure high-quality, safe healthcare for 20% of the nation’s Medicare beneficiaries

42
QIN-QIO vs. BFCC-QIO
Quality Innovation Network – Quality Improvement Organizations (QIN-QIOs)
• Bring together healthcare providers, stakeholders, and Medicare beneficiaries to improve the quality of healthcare for targeted health conditions
• 12 regional CMS QIN-QIOs
Beneficiary and Family Centered Care-Quality Improvement Organizations (BFCC-QIOs)• Manage all beneficiary complaints, quality of care reviews, EMTALA violations, and
reviews of hospital discharge or discontinuation-of-services appeals
• Two regional BFCC-QIOs (Livanta and KePro)

43
Enhance the Health of
Your Community
• Align healthcare quality improvement activities with quality reporting and payment focus areas
• Leverage data to identify, track and quantify improvements
• Improve processes within your four walls and within your community
• Problem solve with experts and peers across 11 states and the District of Columbia
IPRO Quality Innovation
Network -
Partner
with the
IPRO QIN-QIO

44
The Whole is Greater
Than the Sum of its Parts
• Invitation only spot light on success sharing, affinity groups and ECHO sprints with national subject matter experts
• Network and collaborate in peer-to-peer shared learning across states
Learning & Action Network
* In applicable communities
Community Coalitions*
• Apply a collaborative approach to improve the overall health of community
Individual Providers
• Refine processes and improve outcomes with evidence-based tools/resources

45
Focus Areas Impact the
Health of our Communities
Behavioral Health & Opioid Use
Patient Safety
Chronic Disease Self-Management
Care Transitions
Nursing Home Quality

46
Cross-Cutting Priority Areas
Health Information
TechnologyPatient & Family
Engagement
Health Equity
Trauma-Informed CareRural Health

47
Technical Assistance
From QI Experts
• Root cause analysis (RCA)
• Evidence-based and best practice intervention selection & implementation
• Rapid cycle improvement via Plan–Do-Study-Act (PDSA)
• Measurement strategy and data analytics
• Access to clinician, patient and care partner education resources, e.g., webinars, ECHO programs, learning and action networks, mobile apps, subject matter experts

48
Behavioral Health and
Opioid Use
Use innovative, evidence-based and data driven methods to reduce opioid deaths and adverse drug events (ADEs) by
• Decreasing opioid prescribing for prescriptions ≥90 MME daily across hospitals, long-term care and outpatient facilities
• Reducing opioid utilization, where appropriate
• Assisting in implementation of pain management and opioid use best practices
• Increasing access to behavioral health services

49
Increase Patient Safety:
Reduce All-Cause Harm
Use innovative, evidence-based and data driven methods to:
• Reduce ADEs due to high risk medications in community and long term care settings
• High risk medications include anticoagulants, diabetes medications, and opioids, or a medication class otherwise prioritized by the HHS National Action Plan for ADE Drug Event Prevention
• Reduce Clostridioides difficile infection in all settings by promoting the identification, prevention and treatment of C. difficile and the initiation/expansion of antibiotic stewardship

50
Chronic Disease Self-Management:
A Public Health Issue

51
Improving Care Transitions:
Reducing Readmissions
Source: Medicare Payment Advisory Commission. 2007. Report to the Congress. Promoting Greater Efficiency in Medicare
18% of Medicare patients
discharged from the hospital
have a readmission within 30 days,
accounting for $15 billion
in healthcare spending

52
Improving Care Transitions:
Reducing Readmissions
Under the Hospital Readmission Reduction Program (HRRP),
CMS withholds up to 3% of reimbursement for hospitals with
higher-than-expected number of 30-day readmissions for:
• Chronic lung disease
• Coronary artery bypass graft surgery
• Heart attacks
• Heart failure
• Hip and knee replacements
• Pneumonia
2,599 hospitals
(82% of participants)
will receive reduced
reimbursement under the
Hospital Readmissions
Reduction Program
(HRRP) in FY 2019

53
Improve Nursing Home
Quality
Nursing Home Quality Improvement (QI) Focus using current best practices and person-centered approaches:
• Decrease opioid prescribing
• Reduce adverse drug events (ADEs)
• Reduce hospitalizations for nursing home onset C. difficile
• Reduce healthcare-acquired infections
• Reduce emergency department visits & readmissions for short stay nursing home residents
• Improve the mean Total Quality Score for all nursing homes

54
Together We Can
Make a Difference
We invite you to…
• Join our team to improve the quality of care across our network
• Be part of the solution for improving healthcare outcomes for 20% of the Medicare beneficiaries in the nation

55
Next Work Group Meeting
Next PMWG meeting is scheduled for Wednesday, March 18