Embed Size (px)
Citation preview
1
Performance Miracles via DASD IO Activity Tuning
Ivan L. GelbGelb Information System CorporationE-mail: [email protected]
May 18, 2000
Copyright 2000 GIS Corporation
OS/390
Abstract
The OS/390 environment IO activity tuning opportunities can produce results that seem like miracles. Productive capacity of a complex can be greatly increased because IO activity tuning will also improve processor, main storage and virtual storage utilization. This presentation will demonstrate all thatis needed for an effective IO activity tuning project along withthe benefits achieved by such activities.
2
2 2000 Gelb Information Systems Corp. – Comments/Questions: igelb@injersey .com / 732-303-1333
Bullet Points
• Anatomy of IOs
• Where, What, How of Measurement Data
• Obtaining Information from Measurements
• Tuning Alternatives
• Sample Results
Presentation Outline
1. Anatomy of IOs
Life of a Read
Life of a Write
2. Where, What, How of Measurement Data
RMF, SMF, Others
Collection Issues
3. Obtaining Information from Measurements
80/20 Analysis
Quantifying Potential Benefits
4. Tuning Alternatives
Workload Management
Disk Subsystems
Applications
5. Sample Results

3 2000 Gelb Information Systems Corp. – Comments/Questions: igelb@injersey .com / 732-303-1333
Anatomy of IOs
• Life of DB2 Data
• Anatomy of a Read
• Anatomy of a Write
Next is the discussion of the travels of a record within a typical OS/390 complex.

4 2000 Gelb Information Systems Corp. – Comments/Questions: igelb@injersey .com / 732-303-1333
Life of DB2 Data
Disk Subsystem
Program Virtual Buffer Pools Hiper-
pools
C
P
U
Channels
Physical (and logical)
disk volumes
This is an illustration of the data locations in a S/390 system.
Life of data begins and ends on a disk volume (except for some rare data in memory applications).
The focus of this presentation will be on the analysis of disk I/O activity and the miraculous results such performance tuning efforts can yield.
When data has to placed on or retrieved from a disk volumes, it takes many orders of magnitude longer than any other component of the total service time. Typically, I/O time is 60 - 90% of the total time.
5 2000 Gelb Information Systems Corp. – Comments/Questions: igelb@injersey .com / 732-303-1333
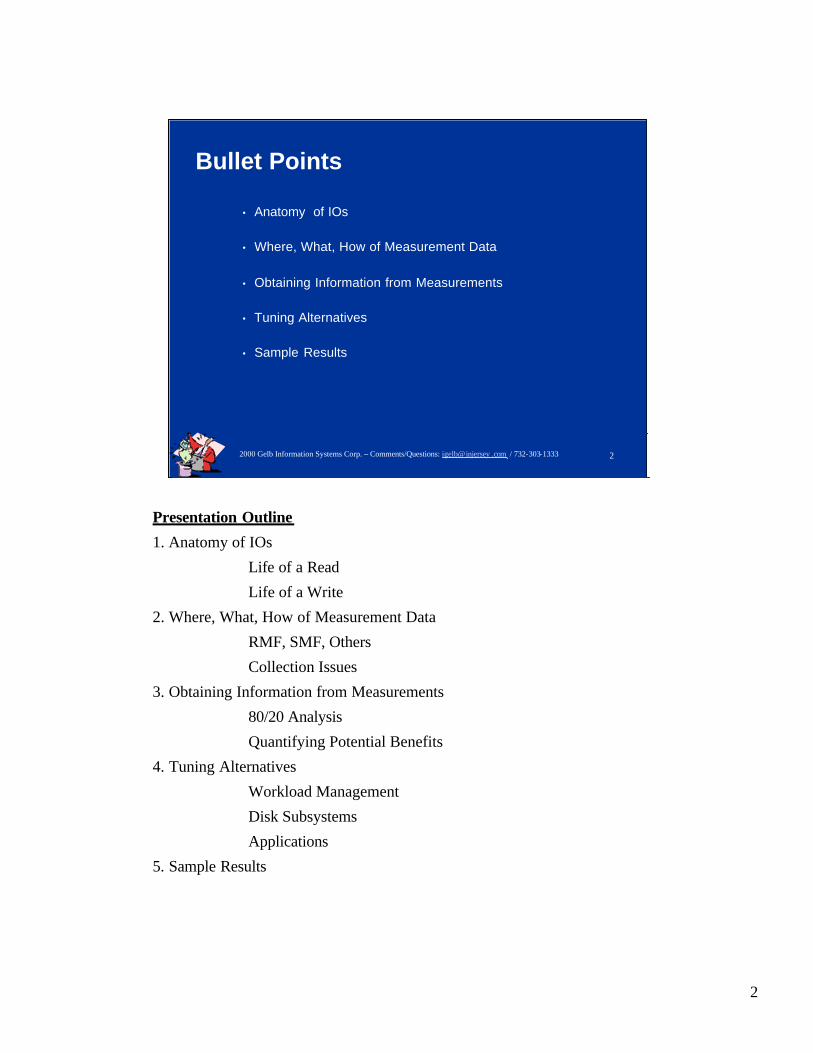
Anatomy of IOs - READ• Application issues a read request for a record:
• 1. Virtual buffer pools (VP) are searched. Record could be found in storage, paged out, in hiperpools or not found.
• 2. If used, and made found in hiperpool, record is moved into VP and request is completed.
• 3. Request is sent to disk subsystem.Performance factors: IOS queuing, channel utilization.
• 4. Cache is searched. Performance factors: Amount of cache, other good or bad cache users, channel utilization, I/O pend request handling by CPU.
• 5. If not found, read is sent to disk drive. Performance factors: device utilization, intra-file contention, inter-file contention, channel utilization, path utilization, I/O pend request handling by CPU.
Typical read I/O request service times:
- Nano- seconds if found in main or expanded storage
- < 5 milliseconds average if found in cache
- > 15 milliseconds average if found on drive
Read performance is affected by the factors enumerated on this slide.
6 2000 Gelb Information Systems Corp. – Comments/Questions: igelb@injersey .com / 732-303-1333
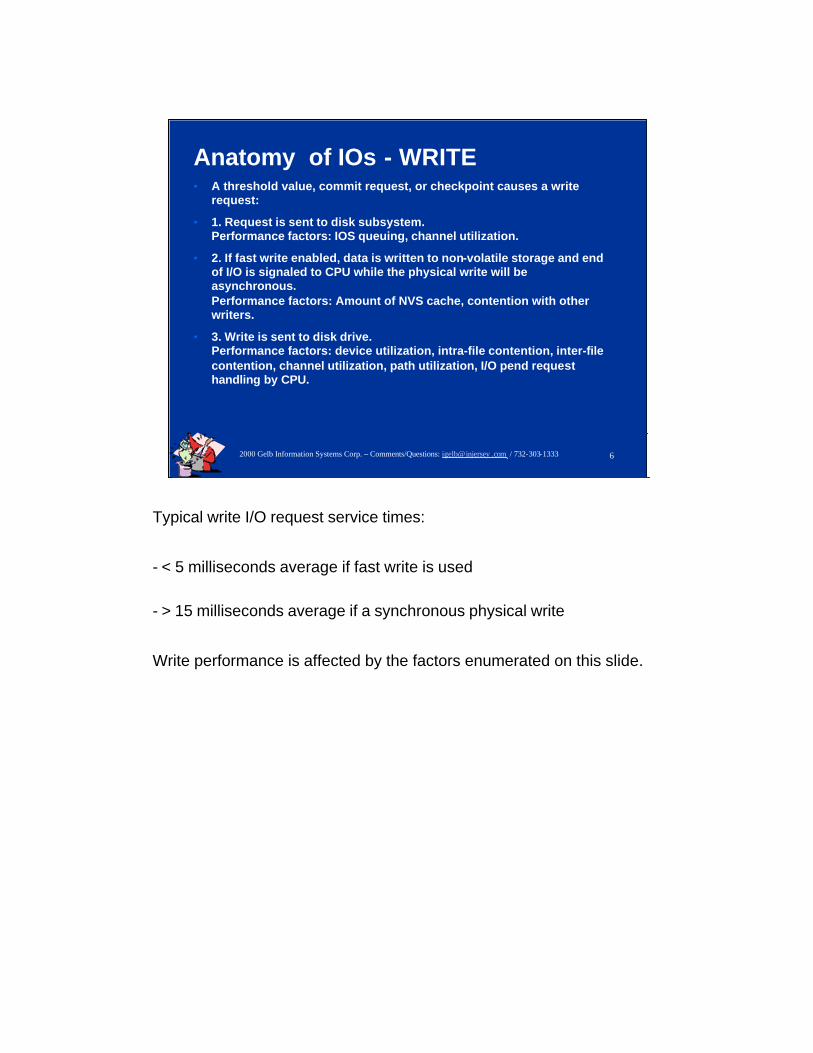
Anatomy of IOs - WRITE• A threshold value, commit request, or checkpoint causes a write
request:
• 1. Request is sent to disk subsystem.Performance factors: IOS queuing, channel utilization.
• 2. If fast write enabled, data is written to non-volatile storage and end of I/O is signaled to CPU while the physical write will be asynchronous.Performance factors: Amount of NVS cache, contention with other writers.
• 3. Write is sent to disk drive. Performance factors: device utilization, intra-file contention, inter-file contention, channel utilization, path utilization, I/O pend request handling by CPU.
Typical write I/O request service times:
- < 5 milliseconds average if fast write is used
- > 15 milliseconds average if a synchronous physical write
Write performance is affected by the factors enumerated on this slide.
7 2000 Gelb Information Systems Corp. – Comments/Questions: igelb@injersey .com / 732-303-1333
Where, What, How of Measurement Data• Measurements Collection Issues
• RMF, SMF, & Other Measurements
Next we will review the issues related to performance data collection.

8 2000 Gelb Information Systems Corp. – Comments/Questions: igelb@injersey .com / 732-303-1333
Measurements Collection Issues
• Monthly• Weekly• Daily• Hourly, 30 minutes, 15 minutes,…• Choose intervals with care
GUIDING THOUGHT: Collect during the period(s) when your life and/or your company’s business success depends on the performance of the system.
“Tricks” of data collection:
1. Collect enough data to be sure that it is representative.
2. Insure that critical periods of differing profiles are represented.
3. Keep checking that the periods you select are the important ones.
4. Multiple periods can increase the complexity of the analysis.
5. Keep collection and periodic analysis going even if things are OK!
6. Make sure that you have focused on all “politically” important times.
9 2000 Gelb Information Systems Corp. – Comments/Questions: igelb@injersey .com / 732-303-1333
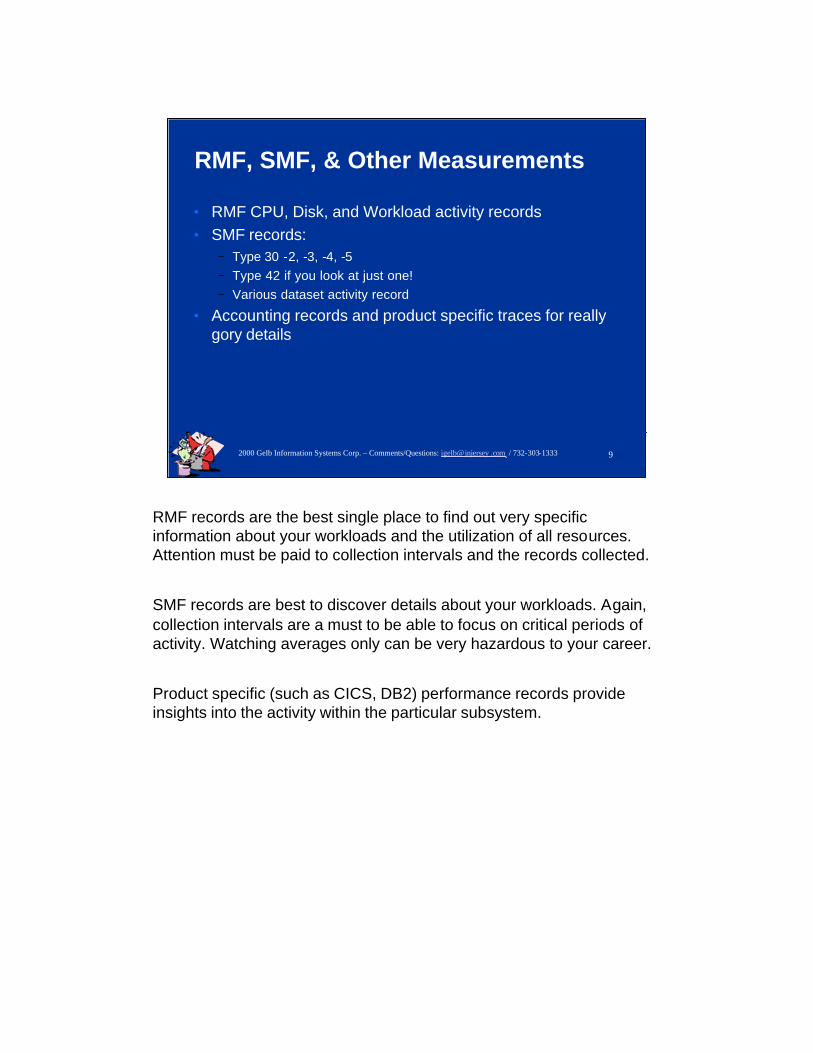
RMF, SMF, & Other Measurements
• RMF CPU, Disk, and Workload activity records• SMF records:
− Type 30 -2, -3, -4, -5− Type 42 if you look at just one!− Various dataset activity record
• Accounting records and product specific traces for really gory details
RMF records are the best single place to find out very specific information about your workloads and the utilization of all resources. Attention must be paid to collection intervals and the records collected.
SMF records are best to discover details about your workloads. Again, collection intervals are a must to be able to focus on critical periods of activity. Watching averages only can be very hazardous to your career.
Product specific (such as CICS, DB2) performance records provideinsights into the activity within the particular subsystem.
10 2000 Gelb Information Systems Corp. – Comments/Questions: igelb@injersey .com / 732-303-1333
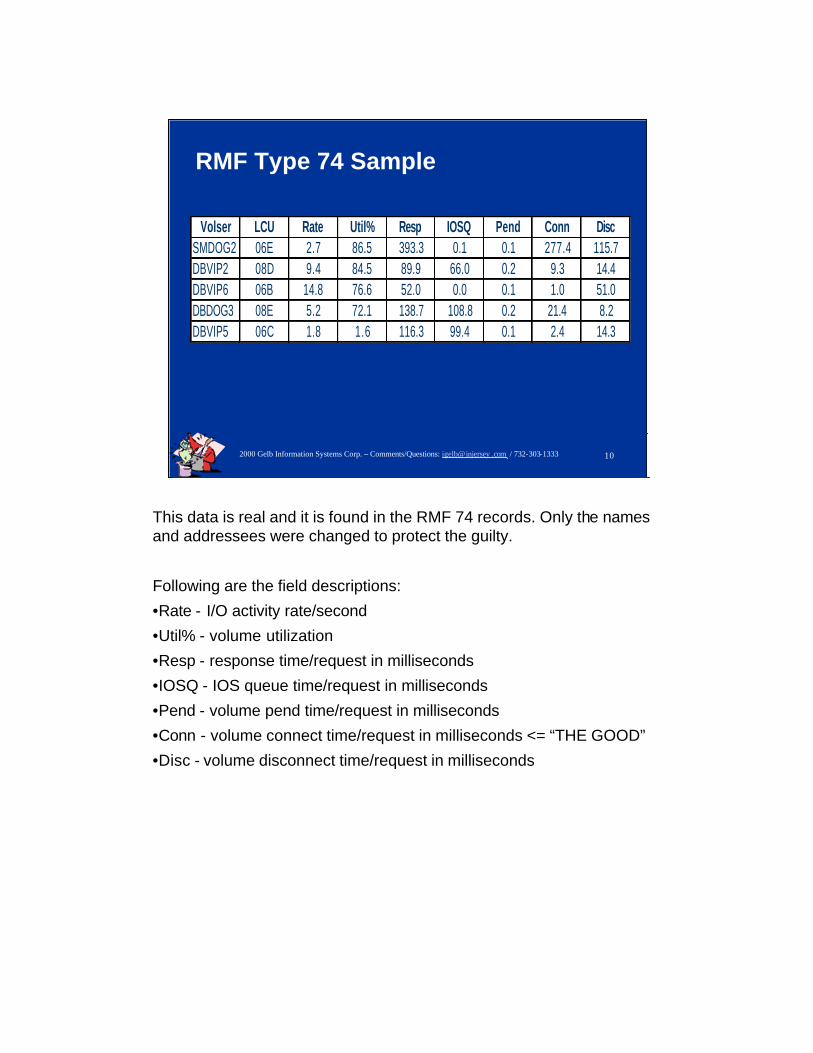
RMF Type 74 Sample
Volser LCU Rate Util% Resp IOSQ Pend Conn DiscSMDOG2 06E 2.7 86.5 393.3 0.1 0.1 277.4 115.7DBVIP2 08D 9.4 84.5 89.9 66.0 0.2 9.3 14.4DBVIP6 06B 14.8 76.6 52.0 0.0 0.1 1.0 51.0DBDOG3 08E 5.2 72.1 138.7 108.8 0.2 21.4 8.2DBVIP5 06C 1.8 1.6 116.3 99.4 0.1 2.4 14.3
This data is real and it is found in the RMF 74 records. Only the names and addressees were changed to protect the guilty.
Following are the field descriptions:
•Rate - I/O activity rate/second
•Util% - volume utilization
•Resp - response time/request in milliseconds
•IOSQ - IOS queue time/request in milliseconds
•Pend - volume pend time/request in milliseconds
•Conn - volume connect time/request in milliseconds <= “THE GOOD”
•Disc - volume disconnect time/request in milliseconds
11 2000 Gelb Information Systems Corp. – Comments/Questions: igelb@injersey .com / 732-303-1333
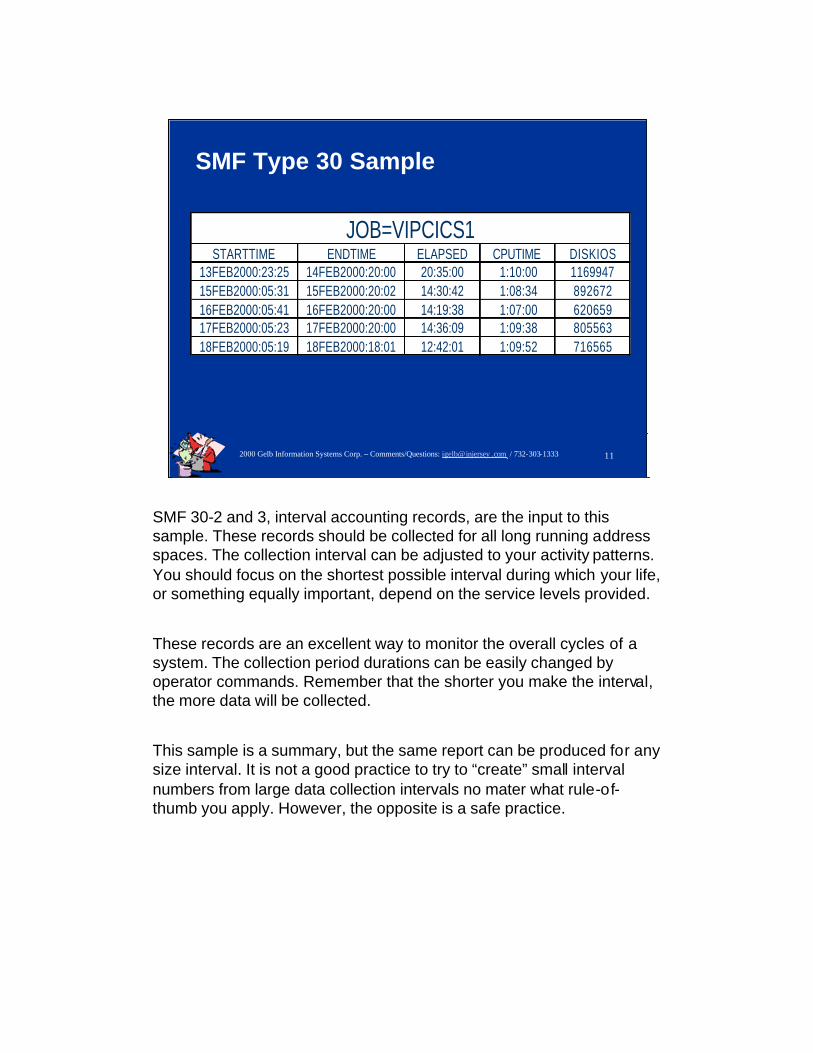
SMF Type 30 Sample
JOB=VIPCICS1STARTTIME ENDTIME ELAPSED CPUTIME DISKIOS
13FEB2000:23:25 14FEB2000:20:00 20:35:00 1:10:00 116994715FEB2000:05:31 15FEB2000:20:02 14:30:42 1:08:34 89267216FEB2000:05:41 16FEB2000:20:00 14:19:38 1:07:00 62065917FEB2000:05:23 17FEB2000:20:00 14:36:09 1:09:38 80556318FEB2000:05:19 18FEB2000:18:01 12:42:01 1:09:52 716565
SMF 30-2 and 3, interval accounting records, are the input to this sample. These records should be collected for all long running address spaces. The collection interval can be adjusted to your activity patterns. You should focus on the shortest possible interval during which your life, or something equally important, depend on the service levels provided.
These records are an excellent way to monitor the overall cycles of a system. The collection period durations can be easily changed byoperator commands. Remember that the shorter you make the interval, the more data will be collected.
This sample is a summary, but the same report can be produced for any size interval. It is not a good practice to try to “create” small interval numbers from large data collection intervals no mater what rule-of-thumb you apply. However, the opposite is a safe practice.
12 2000 Gelb Information Systems Corp. – Comments/Questions: igelb@injersey .com / 732-303-1333
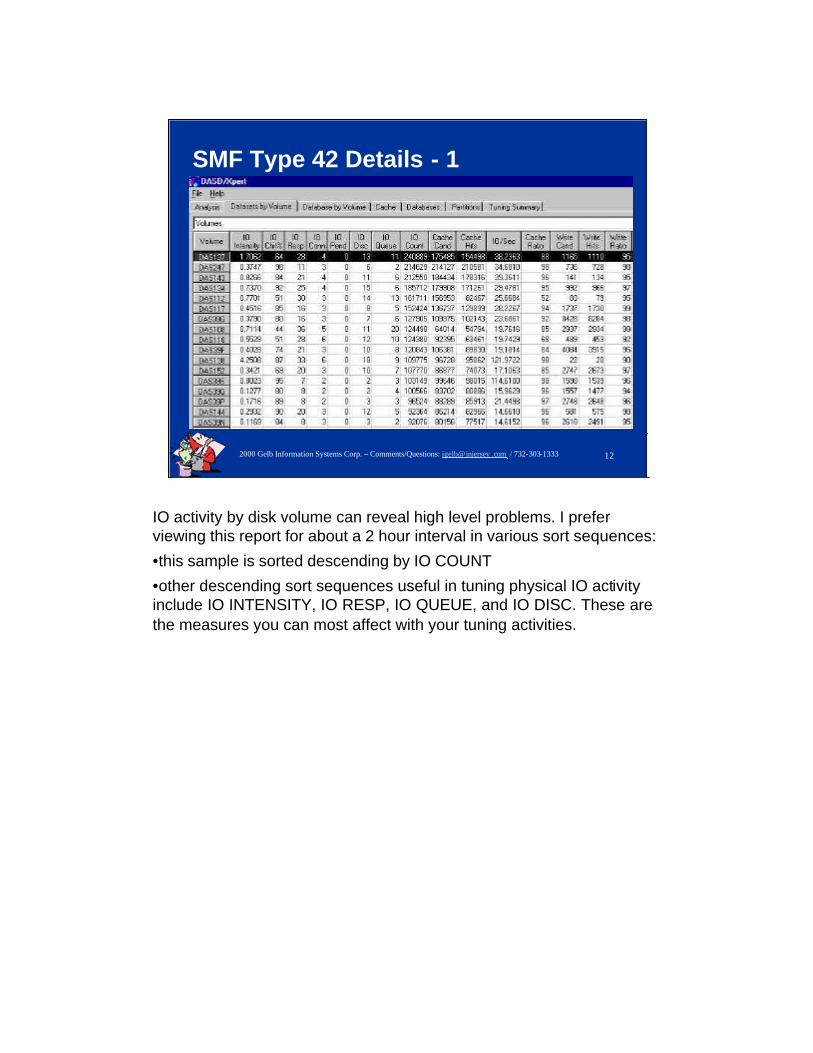
SMF Type 42 Details - 1
IO activity by disk volume can reveal high level problems. I prefer viewing this report for about a 2 hour interval in various sort sequences:
•this sample is sorted descending by IO COUNT
•other descending sort sequences useful in tuning physical IO activity include IO INTENSITY, IO RESP, IO QUEUE, and IO DISC. These are the measures you can most affect with your tuning activities.
13 2000 Gelb Information Systems Corp. – Comments/Questions: igelb@injersey .com / 732-303-1333
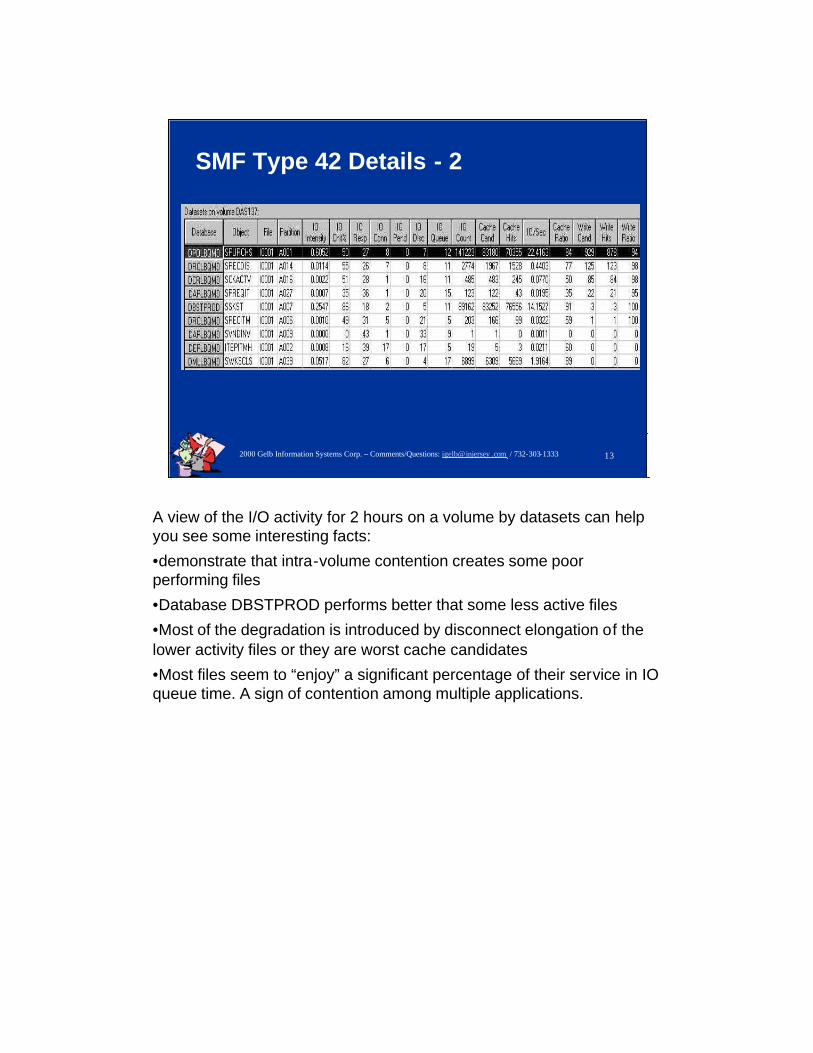
SMF Type 42 Details - 2
A view of the I/O activity for 2 hours on a volume by datasets can help you see some interesting facts:
•demonstrate that intra-volume contention creates some poor performing files
•Database DBSTPROD performs better that some less active files
•Most of the degradation is introduced by disconnect elongation of the lower activity files or they are worst cache candidates
•Most files seem to “enjoy” a significant percentage of their service in IO queue time. A sign of contention among multiple applications.
14 2000 Gelb Information Systems Corp. – Comments/Questions: igelb@injersey .com / 732-303-1333
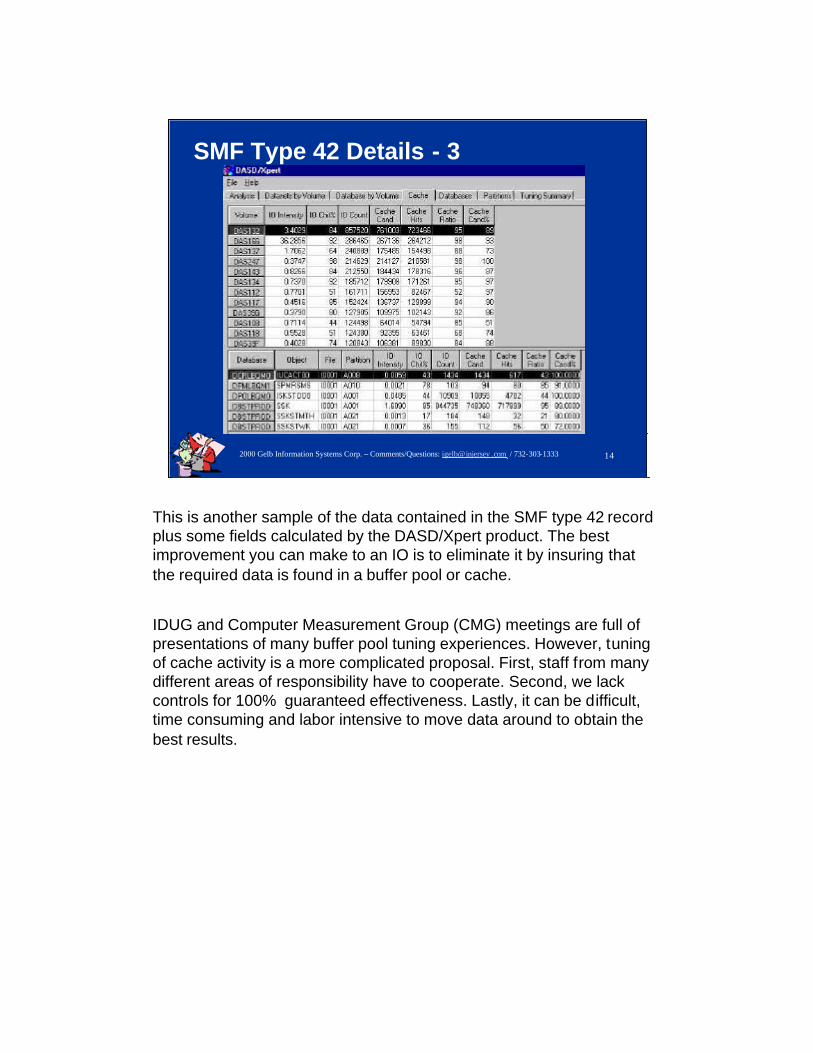
SMF Type 42 Details - 3
This is another sample of the data contained in the SMF type 42 record plus some fields calculated by the DASD/Xpert product. The best improvement you can make to an IO is to eliminate it by insuring that the required data is found in a buffer pool or cache.
IDUG and Computer Measurement Group (CMG) meetings are full of presentations of many buffer pool tuning experiences. However, tuning of cache activity is a more complicated proposal. First, staff from many different areas of responsibility have to cooperate. Second, we lack controls for 100% guaranteed effectiveness. Lastly, it can be difficult, time consuming and labor intensive to move data around to obtain the best results.
15 2000 Gelb Information Systems Corp. – Comments/Questions: igelb@injersey .com / 732-303-1333
SMF Type 42 + RMF Type 74 Details - 1
Physical IO Activity Details by Sysplex Member
VOL SER
VOL RT2
PCT BY2
RSP TM2
IOQ TM2
CON TM2
DISC TM2
PND TM2
VOL RT4
PCT BY4
RSP TM4
IOQ TM4
CON TM4
DISC TM4
PND TM4
VOL RT5
PCT BY5
RSP TM5
IOQ TM5
CON TM5
DISC TM5
PND TM5
1 78.7 48.8 16.5 9.9 3.6 2.6 0.4 0.0 0.0 0.0 0.0 0.0 0.0 0.0 0.0 0.0 0.0 0.0 0.0 0.0 0.02 0.0 0.0 0.0 0.0 0.0 0.0 0.0 0.0 0.0 0.0 0.0 0.0 0.0 0.0 40.3 23.1 6.3 0.2 3.7 2.1 0.43 0.0 0.0 67.4 0.0 32.7 7.9 26.9 1.0 2.0 26.7 0.5 3.6 15.3 7.3 12.2 19.8 22.0 4.7 3.6 12.7 1.04 0.0 0.0 0.0 0.0 0.0 0.0 0.0 0.0 0.0 0.0 0.0 0.0 0.0 0.0 72.5 23.0 5.6 2.1 1.3 1.9 0.45 22.4 15.8 10.9 3.1 4.0 3.1 0.7 0.0 0.0 0.0 0.0 0.0 0.0 0.0 0.0 0.0 0.0 0.0 0.0 0.0 0.06 29.5 15.3 8.3 2.7 2.2 3.0 0.3 0.0 0.0 0.0 0.0 0.0 0.0 0.0 0.0 0.0 0.0 0.0 0.0 0.0 0.07 28.0 14.5 7.4 1.9 2.3 2.8 0.4 0.0 0.0 0.0 0.0 0.0 0.0 0.0 0.0 0.0 0.0 0.0 0.0 0.0 0.08 6.6 14.7 26.6 3.7 3.1 19.2 0.6 0.0 0.0 0.7 0.0 0.4 0.0 0.2 0.0 0.0 0.6 0.0 0.4 0.0 0.39 0.0 0.0 0.0 0.0 0.0 0.0 0.0 5.8 8.4 22.7 2.8 3.8 10.6 5.5 8.9 14.2 23.6 4.4 3.9 12.0 3.4
10 0.0 0.0 0.0 0.0 0.0 0.0 0.0 5.7 8.6 27.2 5.6 3.9 11.2 6.5 8.9 14.2 24.3 4.6 3.9 12.0 3.711 61.3 15.9 4.0 1.1 1.1 1.5 0.4 0.0 0.0 0.0 0.0 0.0 0.0 0.0 0.0 0.0 0.0 0.0 0.0 0.0 0.0
Sum of All Activity / CPU / File within the Sysplex
VOL RATE
FILE UTL
VOL UTL
ALL UTL
RESP M S
CONN MS
DISC M S
PEND M S
IOSQ M S
13.71 6.68% 6.68% A 1 77.6 45.7 48.8 48.8 16.1 3.6 2.3 0.3 106.81 3.32% 10.00% B 2 40.3 22.7 23.1 23.1 6.5 3.6 2 0.3 0.65.88 2.86% 12.86% C 3 12.2 19.6 19.8 24.4 23.4 3.5 12.7 1 6.34.89 2.38% 15.24% D 4 36.4 16.3 23 23 6.7 1.2 3.3 0.3 1.94.65 2.27% 17.51% E 5 22.4 15.5 15.8 15.8 11.6 4 2.9 0.6 4.14.53 2.21% 19.72% F 6 29.5 15.1 15.3 15.3 8.6 2.2 2.9 0.3 3.24.29 2.09% 21.81% G 7 28 14.3 14.5 14.5 7.6 2.3 2.8 0.4 24.29 2.09% 23.90% H 8 6.4 14.3 14.7 14.7 26.9 2.8 19.5 0.5 4.14.23 2.06% 25.96% I 9 8.9 14.1 14.2 30.7 24.4 3.8 11.9 3.3 5.44.20 2.05% 28.00% J 10 8.9 14 14.2 31.2 26.5 3.8 11.9 3.7 74.11 2.00% 30.01% K 11 36.8 13.7 15.9 15.9 5.2 1.3 2.4 0.3 1.3
VOL SER
DATA NAME
Total Serv./ IO Intensity
(mins)
% of Current
Total Service
Cummul. % of
Current Service
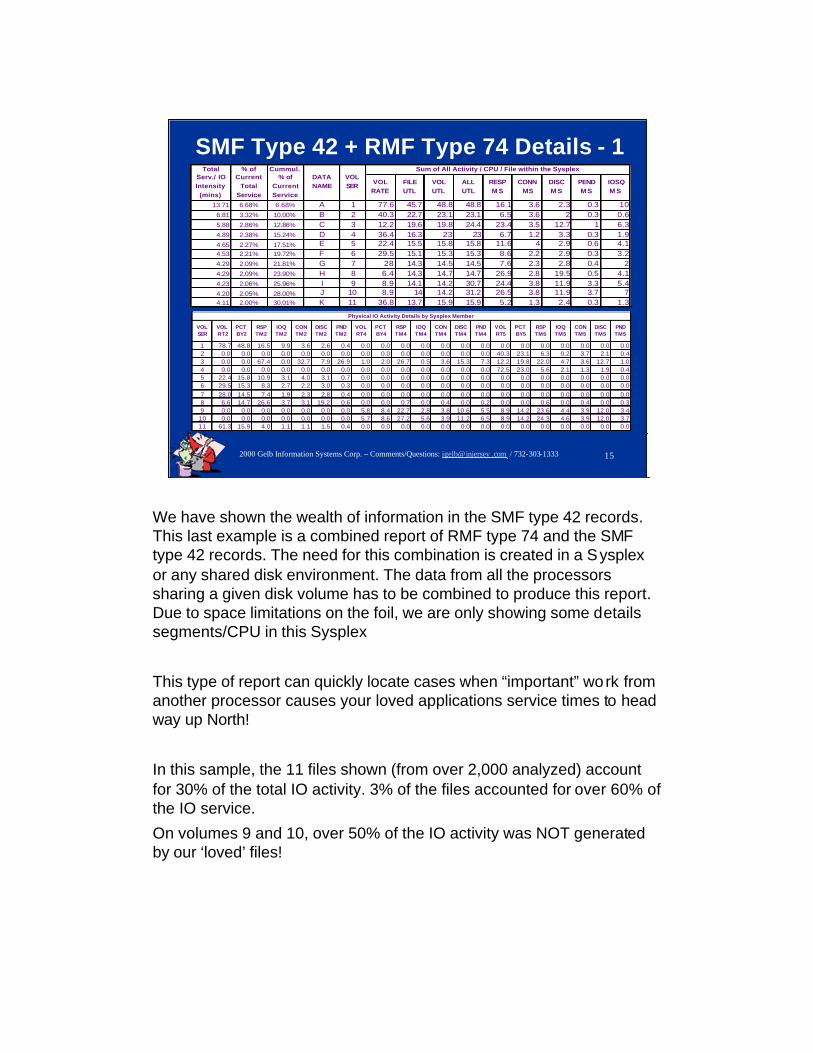
We have shown the wealth of information in the SMF type 42 records. This last example is a combined report of RMF type 74 and the SMF type 42 records. The need for this combination is created in a Sysplex or any shared disk environment. The data from all the processorssharing a given disk volume has to be combined to produce this report. Due to space limitations on the foil, we are only showing some details segments/CPU in this Sysplex
This type of report can quickly locate cases when “important” work from another processor causes your loved applications service times to head way up North!
In this sample, the 11 files shown (from over 2,000 analyzed) account for 30% of the total IO activity. 3% of the files accounted for over 60% of the IO service.
On volumes 9 and 10, over 50% of the IO activity was NOT generated by our ‘loved’ files!
16 2000 Gelb Information Systems Corp. – Comments/Questions: igelb@injersey .com / 732-303-1333
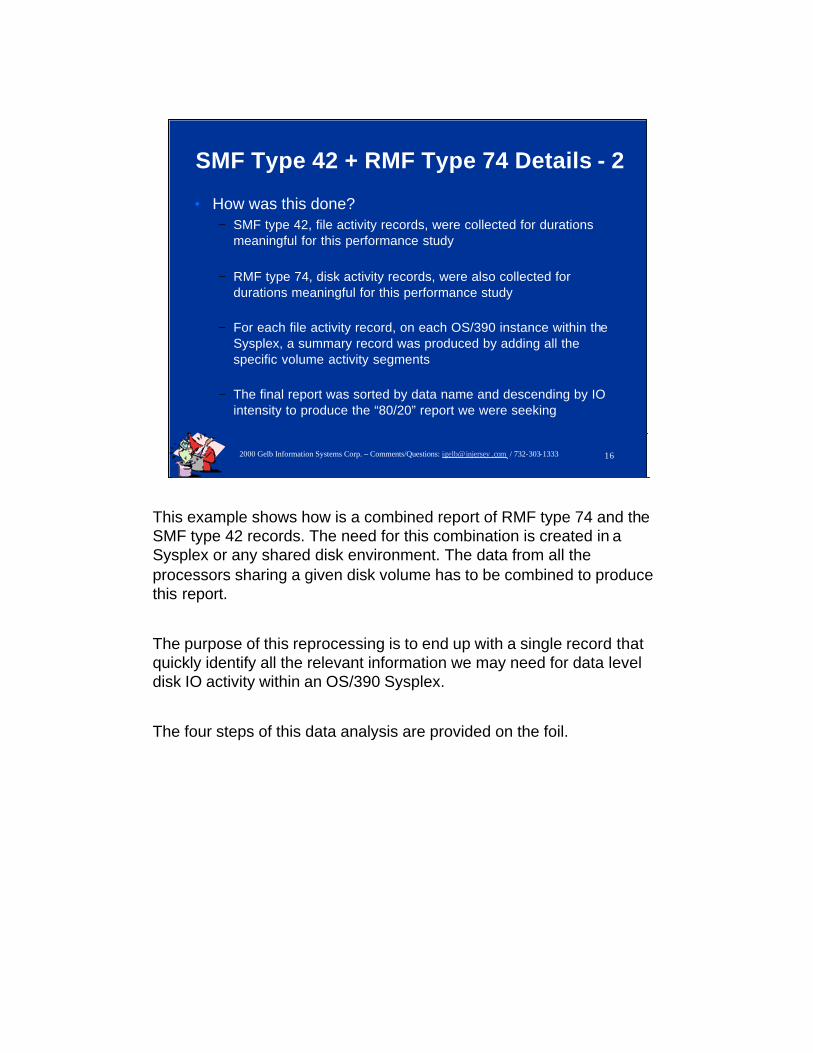
SMF Type 42 + RMF Type 74 Details - 2
• How was this done?− SMF type 42, file activity records, were collected for durations
meaningful for this performance study
− RMF type 74, disk activity records, were also collected for durations meaningful for this performance study
− For each file activity record, on each OS/390 instance within the Sysplex, a summary record was produced by adding all the specific volume activity segments
− The final report was sorted by data name and descending by IO intensity to produce the “80/20” report we were seeking
This example shows how is a combined report of RMF type 74 and the SMF type 42 records. The need for this combination is created in a Sysplex or any shared disk environment. The data from all the processors sharing a given disk volume has to be combined to produce this report.
The purpose of this reprocessing is to end up with a single record that quickly identify all the relevant information we may need for data level disk IO activity within an OS/390 Sysplex.
The four steps of this data analysis are provided on the foil.
17 2000 Gelb Information Systems Corp. – Comments/Questions: igelb@injersey .com / 732-303-1333
Obtaining Information from Measurements• 80/20 Analysis
• Quantifying Potential Benefits
Next we will present analysis methods and how to effectively present your accomplishment.
18 2000 Gelb Information Systems Corp. – Comments/Questions: igelb@injersey .com / 732-303-1333
80/20 Analysis - 1
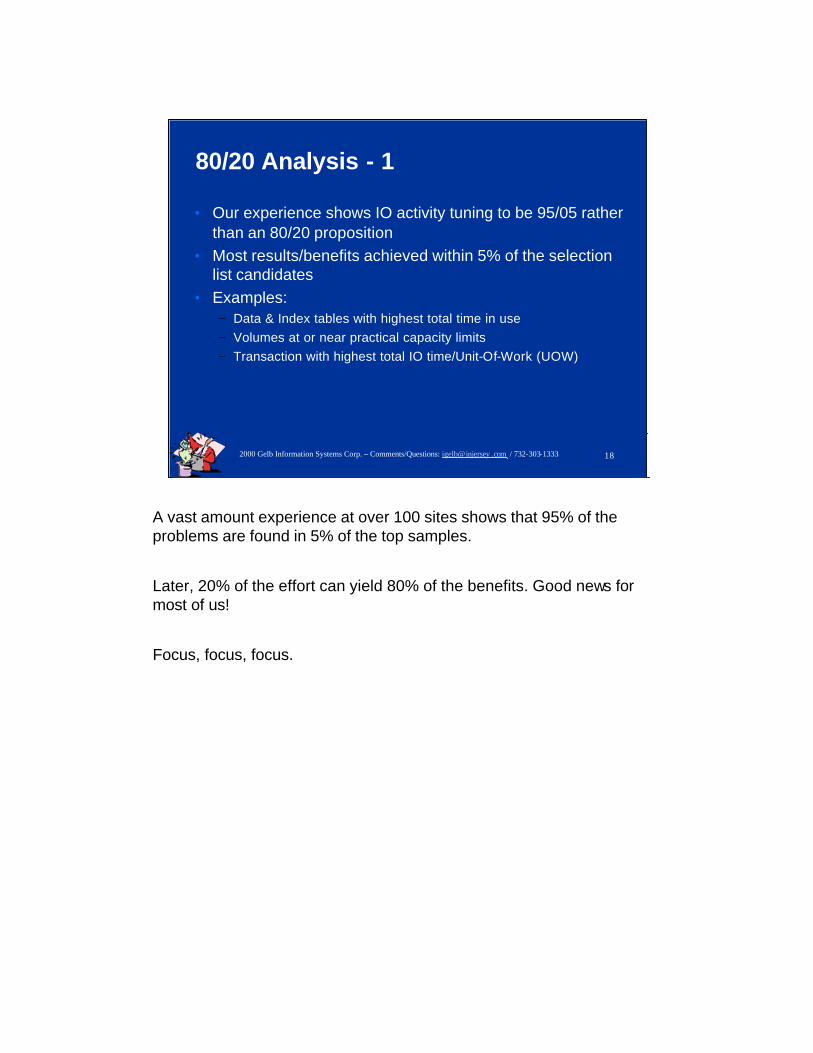
• Our experience shows IO activity tuning to be 95/05 rather than an 80/20 proposition
• Most results/benefits achieved within 5% of the selection list candidates
• Examples:− Data & Index tables with highest total time in use− Volumes at or near practical capacity limits− Transaction with highest total IO time/Unit-Of-Work (UOW)
A vast amount experience at over 100 sites shows that 95% of theproblems are found in 5% of the top samples.
Later, 20% of the effort can yield 80% of the benefits. Good news for most of us!
Focus, focus, focus.
19 2000 Gelb Information Systems Corp. – Comments/Questions: igelb@injersey .com / 732-303-1333
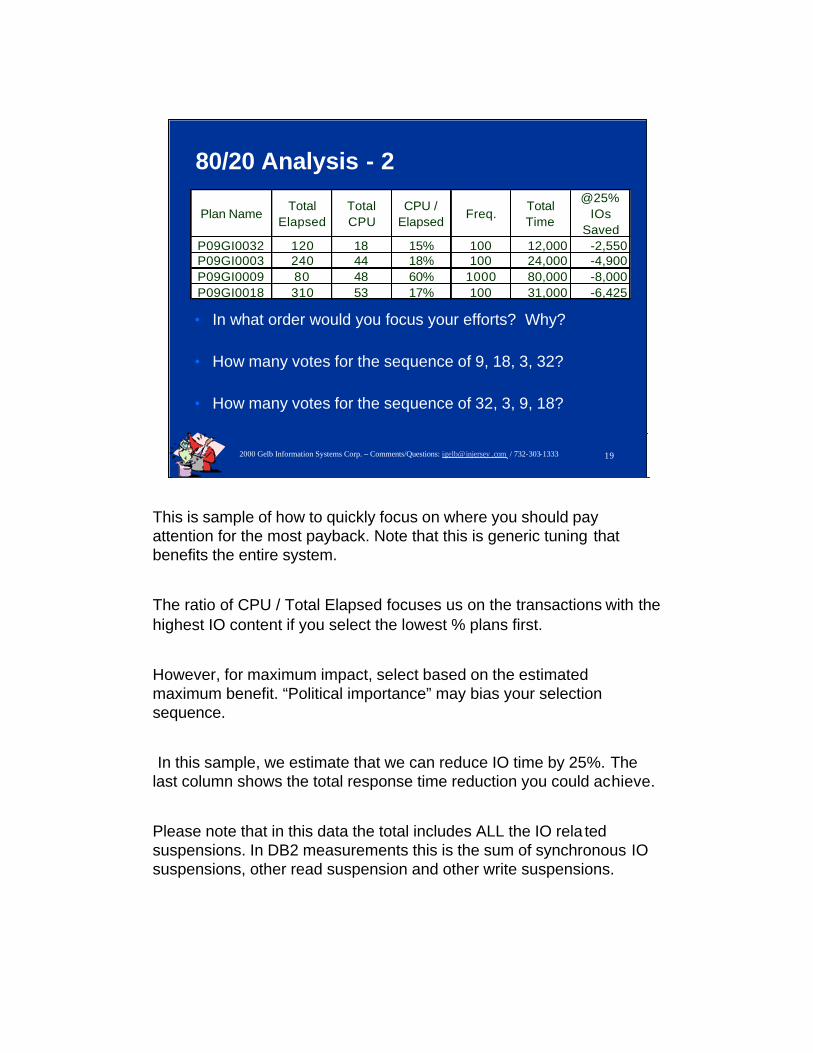
80/20 Analysis - 2
Plan NameTotal
ElapsedTotal CPU
CPU / Elapsed
Freq.Total Time
@25% IOs
SavedP09GI0032 120 18 15% 100 12,000 -2,550P09GI0003 240 44 18% 100 24,000 -4,900P09GI0009 80 48 60% 1000 80,000 -8,000P09GI0018 310 53 17% 100 31,000 -6,425
• In what order would you focus your efforts? Why?
• How many votes for the sequence of 9, 18, 3, 32?
• How many votes for the sequence of 32, 3, 9, 18?
This is sample of how to quickly focus on where you should pay attention for the most payback. Note that this is generic tuning that benefits the entire system.
The ratio of CPU / Total Elapsed focuses us on the transactions with the highest IO content if you select the lowest % plans first.
However, for maximum impact, select based on the estimated maximum benefit. “Political importance” may bias your selection sequence.
In this sample, we estimate that we can reduce IO time by 25%. The last column shows the total response time reduction you could achieve.
Please note that in this data the total includes ALL the IO rela ted suspensions. In DB2 measurements this is the sum of synchronous IO suspensions, other read suspension and other write suspensions.
20 2000 Gelb Information Systems Corp. – Comments/Questions: igelb@injersey .com / 732-303-1333
Quantifying Potential Benefits
• Example for technical audience
• Example for all audiences
Examples about how to present results follow.
21 2000 Gelb Information Systems Corp. – Comments/Questions: igelb@injersey .com / 732-303-1333
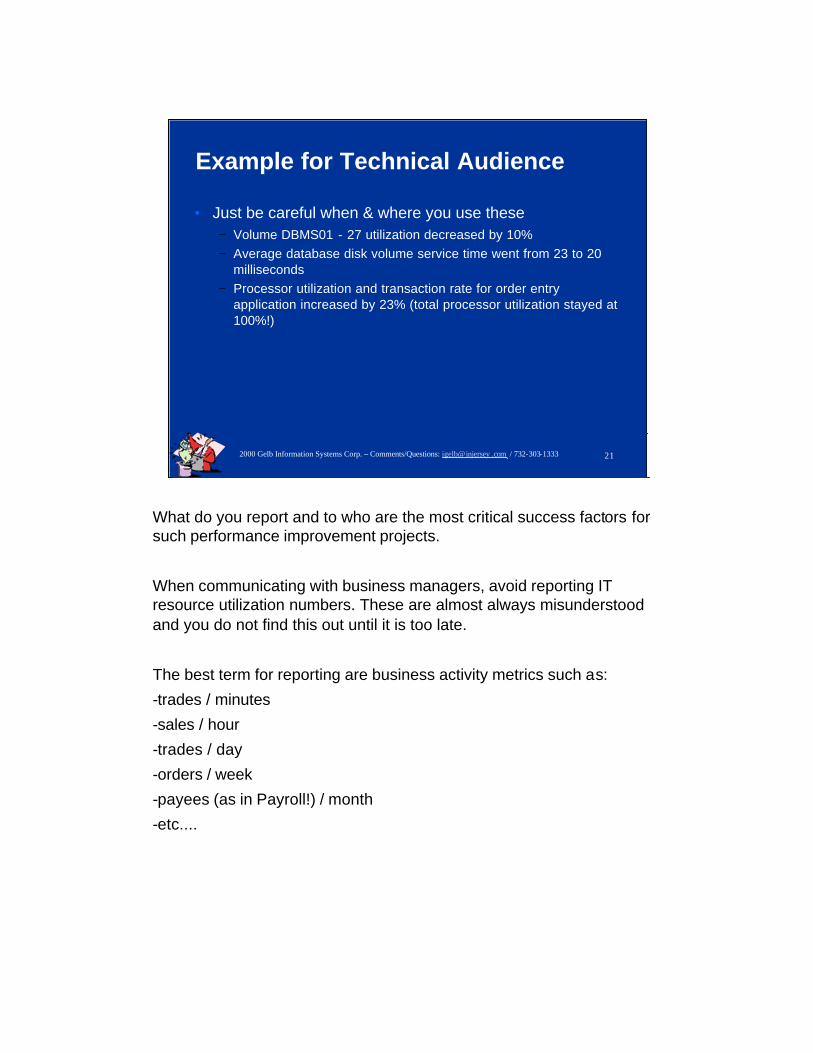
Example for Technical Audience
• Just be careful when & where you use these− Volume DBMS01 - 27 utilization decreased by 10%− Average database disk volume service time went from 23 to 20
milliseconds− Processor utilization and transaction rate for order entry
application increased by 23% (total processor utilization stayed at 100%!)
What do you report and to who are the most critical success factors for such performance improvement projects.
When communicating with business managers, avoid reporting IT resource utilization numbers. These are almost always misunderstood and you do not find this out until it is too late.
The best term for reporting are business activity metrics such as:
-trades / minutes
-sales / hour
-trades / day
-orders / week
-payees (as in Payroll!) / month
-etc....
22 2000 Gelb Information Systems Corp. – Comments/Questions: igelb@injersey .com / 732-303-1333
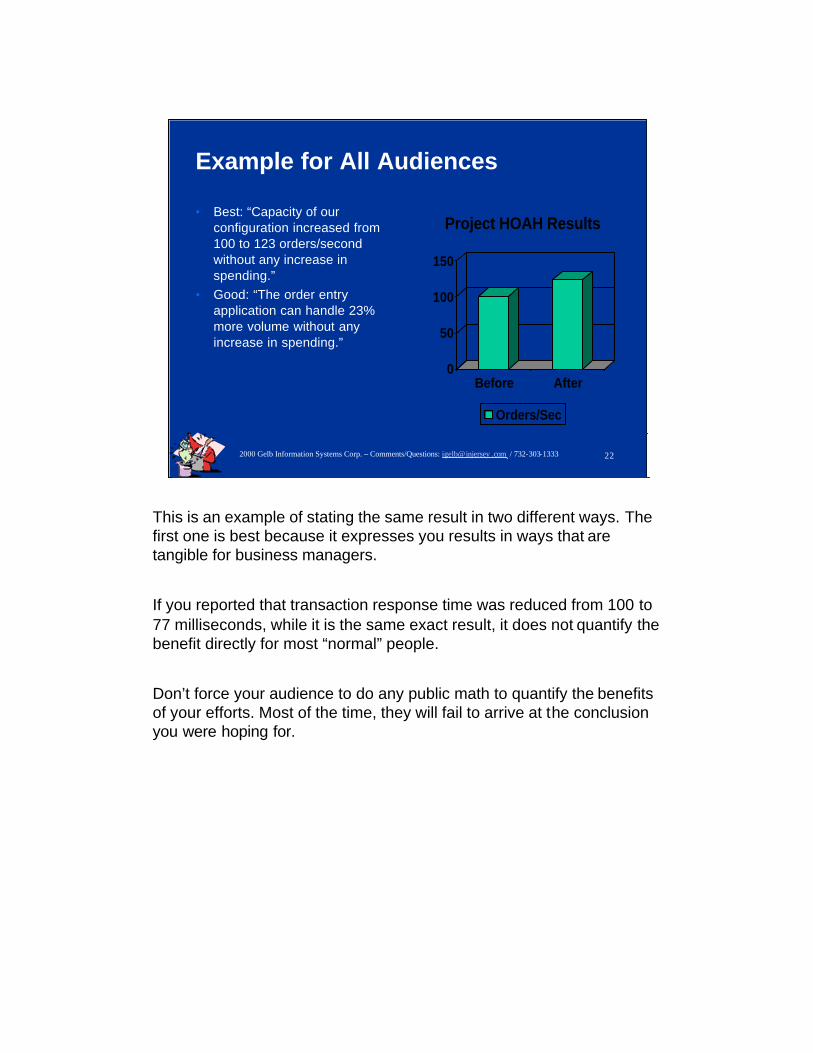
Example for All Audiences
• Best: “Capacity of our configuration increased from 100 to 123 orders/second without any increase in spending.”
• Good: “The order entry application can handle 23% more volume without any increase in spending.”
0
50
100
150
Before After
Project HOAH Results
Orders/Sec
This is an example of stating the same result in two different ways. The first one is best because it expresses you results in ways that are tangible for business managers.
If you reported that transaction response time was reduced from 100 to 77 milliseconds, while it is the same exact result, it does not quantify the benefit directly for most “normal” people.
Don’t force your audience to do any public math to quantify the benefits of your efforts. Most of the time, they will fail to arrive at the conclusion you were hoping for.
23 2000 Gelb Information Systems Corp. – Comments/Questions: igelb@injersey .com / 732-303-1333
Tuning Alternatives
• Methodology Overview
• Workload Management
• Disk Subsystems
• Tuning Recommendations
Next is the discussion of tuning methodology, overall management of the workloads, details relevant to disk subsystems and specific tuning recommendations that are proven effective.
24 2000 Gelb Information Systems Corp. – Comments/Questions: igelb@injersey .com / 732-303-1333
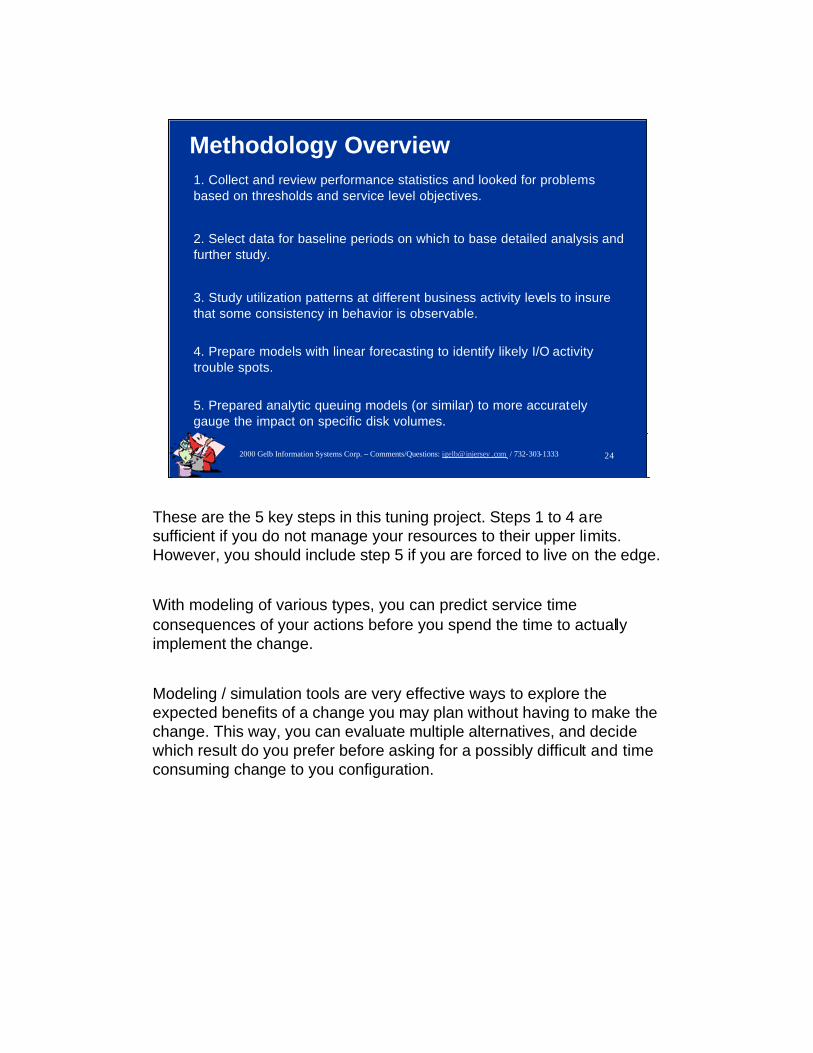
Methodology Overview1. Collect and review performance statistics and looked for problems based on thresholds and service level objectives.
2. Select data for baseline periods on which to base detailed analysis and further study.
3. Study utilization patterns at different business activity levels to insure that some consistency in behavior is observable.
4. Prepare models with linear forecasting to identify likely I/O activity trouble spots.
5. Prepared analytic queuing models (or similar) to more accurately gauge the impact on specific disk volumes.
These are the 5 key steps in this tuning project. Steps 1 to 4 are sufficient if you do not manage your resources to their upper limits. However, you should include step 5 if you are forced to live on the edge.
With modeling of various types, you can predict service time consequences of your actions before you spend the time to actually implement the change.
Modeling / simulation tools are very effective ways to explore the expected benefits of a change you may plan without having to make the change. This way, you can evaluate multiple alternatives, and decide which result do you prefer before asking for a possibly difficult and time consuming change to you configuration.
25 2000 Gelb Information Systems Corp. – Comments/Questions: igelb@injersey .com / 732-303-1333
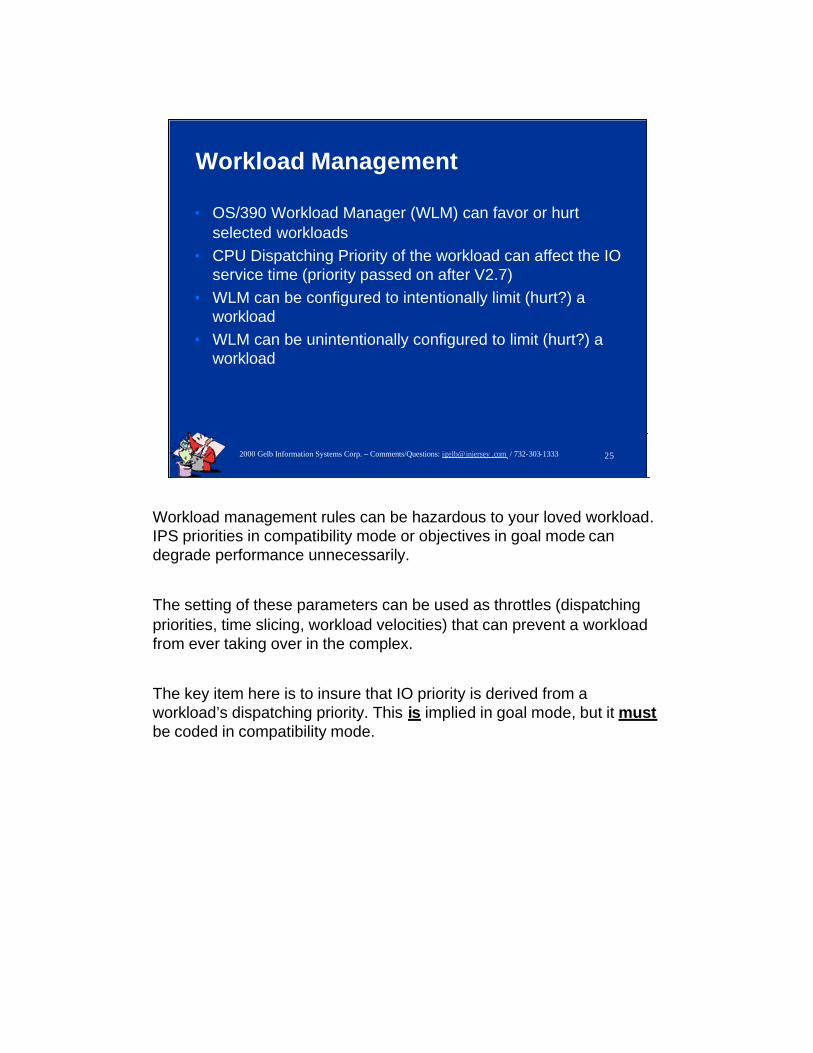
Workload Management
• OS/390 Workload Manager (WLM) can favor or hurt selected workloads
• CPU Dispatching Priority of the workload can affect the IO service time (priority passed on after V2.7)
• WLM can be configured to intentionally limit (hurt?) a workload
• WLM can be unintentionally configured to limit (hurt?) a workload
Workload management rules can be hazardous to your loved workload. IPS priorities in compatibility mode or objectives in goal mode can degrade performance unnecessarily.
The setting of these parameters can be used as throttles (dispatching priorities, time slicing, workload velocities) that can prevent a workload from ever taking over in the complex.
The key item here is to insure that IO priority is derived from a workload’s dispatching priority. This is implied in goal mode, but it mustbe coded in compatibility mode.
26 2000 Gelb Information Systems Corp. – Comments/Questions: igelb@injersey .com / 732-303-1333
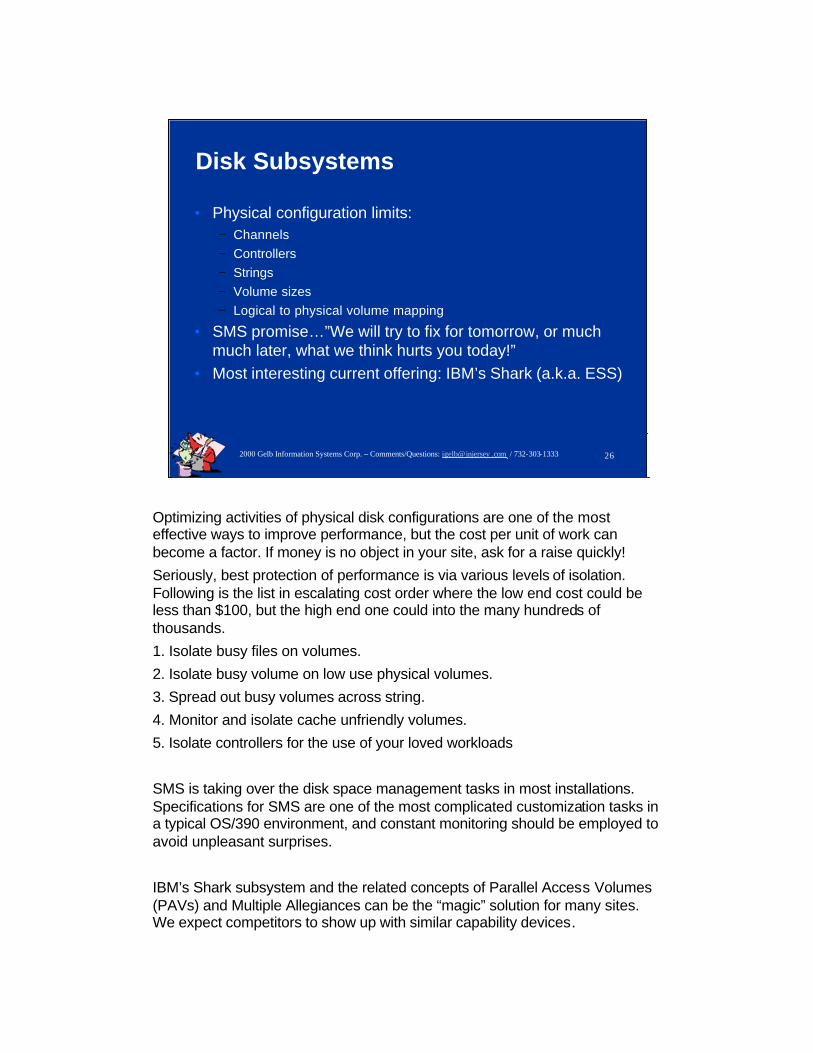
Disk Subsystems
• Physical configuration limits:− Channels− Controllers− Strings− Volume sizes− Logical to physical volume mapping
• SMS promise…”We will try to fix for tomorrow, or much much later, what we think hurts you today!”
• Most interesting current offering: IBM’s Shark (a.k.a. ESS)
Optimizing activities of physical disk configurations are one of the most effective ways to improve performance, but the cost per unit of work can become a factor. If money is no object in your site, ask for a raise quickly!
Seriously, best protection of performance is via various levels of isolation. Following is the list in escalating cost order where the low end cost could be less than $100, but the high end one could into the many hundreds of thousands.
1. Isolate busy files on volumes.
2. Isolate busy volume on low use physical volumes.
3. Spread out busy volumes across string.
4. Monitor and isolate cache unfriendly volumes.
5. Isolate controllers for the use of your loved workloads
SMS is taking over the disk space management tasks in most installations. Specifications for SMS are one of the most complicated customization tasks in a typical OS/390 environment, and constant monitoring should be employed to avoid unpleasant surprises.
IBM’s Shark subsystem and the related concepts of Parallel Access Volumes (PAVs) and Multiple Allegiances can be the “magic” solution for many sites. We expect competitors to show up with similar capability devices.
27 2000 Gelb Information Systems Corp. – Comments/Questions: igelb@injersey .com / 732-303-1333
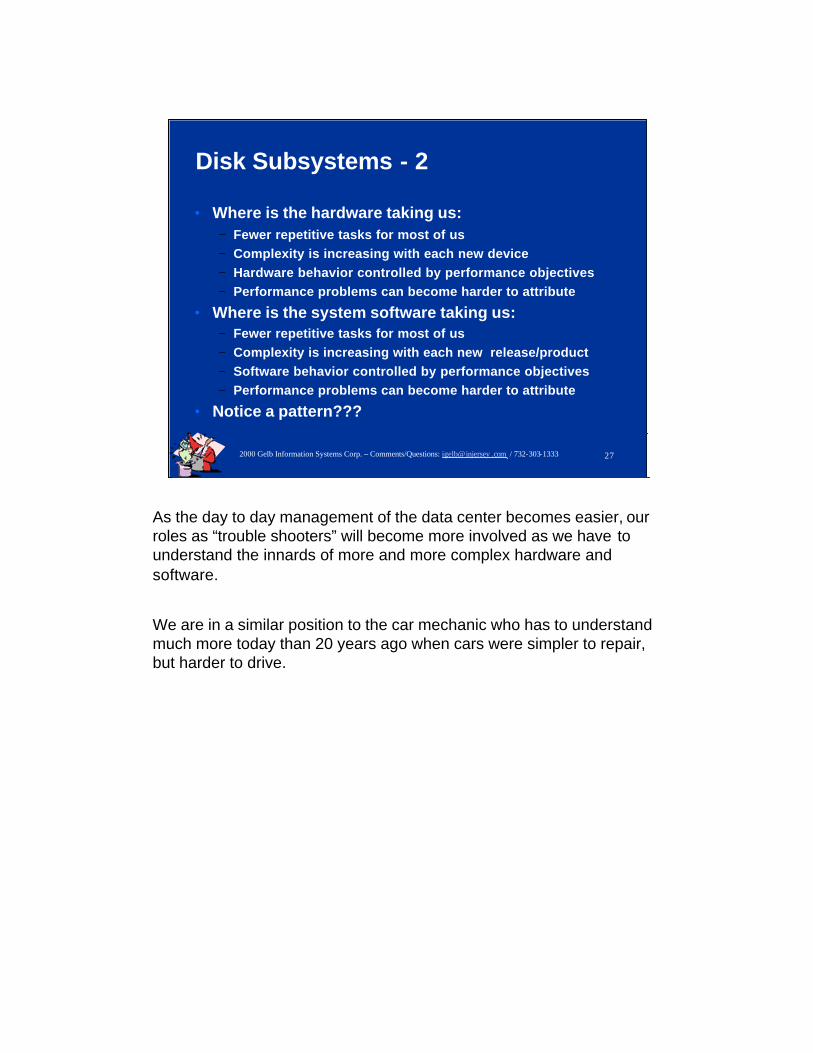
Disk Subsystems - 2
• Where is the hardware taking us:− Fewer repetitive tasks for most of us− Complexity is increasing with each new device− Hardware behavior controlled by performance objectives− Performance problems can become harder to attribute
• Where is the system software taking us:− Fewer repetitive tasks for most of us− Complexity is increasing with each new release/product− Software behavior controlled by performance objectives− Performance problems can become harder to attribute
• Notice a pattern???
As the day to day management of the data center becomes easier, our roles as “trouble shooters” will become more involved as we have to understand the innards of more and more complex hardware and software.
We are in a similar position to the car mechanic who has to understand much more today than 20 years ago when cars were simpler to repair, but harder to drive.
28 2000 Gelb Information Systems Corp. – Comments/Questions: igelb@injersey .com / 732-303-1333
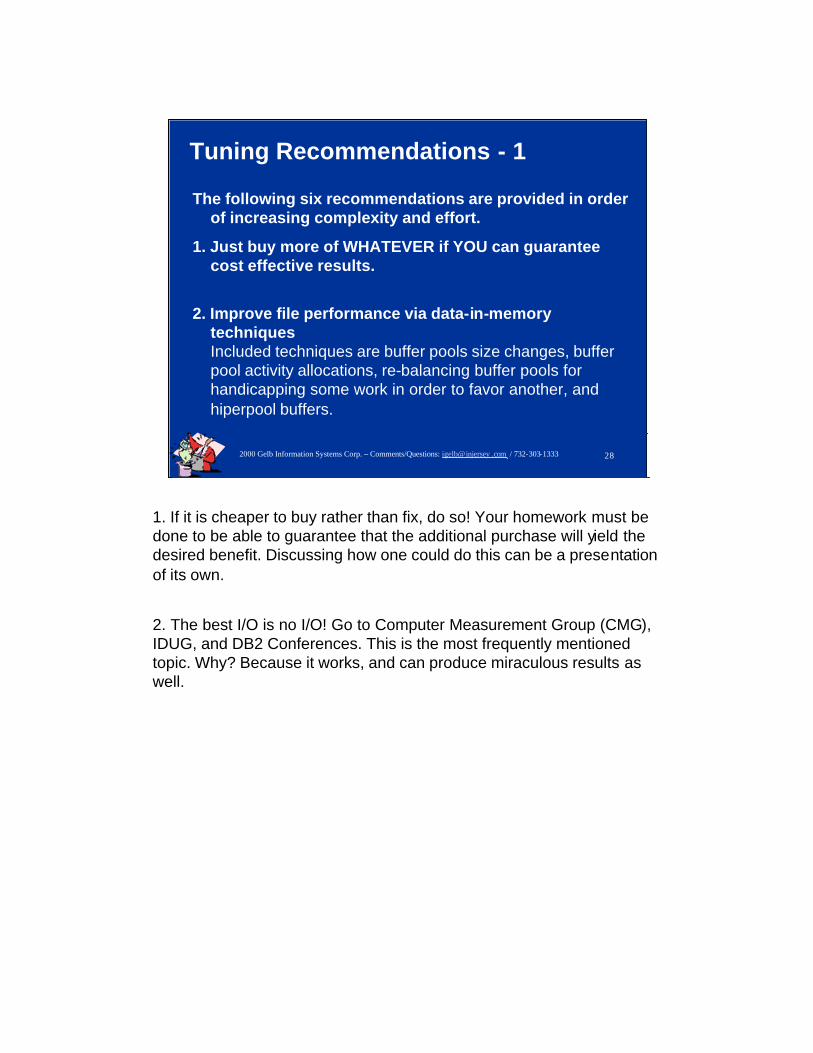
Tuning Recommendations - 1
The following six recommendations are provided in order of increasing complexity and effort.
1. Just buy more of WHATEVER if YOU can guarantee cost effective results.
2. Improve file performance via data-in-memory techniquesIncluded techniques are buffer pools size changes, buffer pool activity allocations, re-balancing buffer pools for handicapping some work in order to favor another, and hiperpool buffers.
1. If it is cheaper to buy rather than fix, do so! Your homework must be done to be able to guarantee that the additional purchase will yield the desired benefit. Discussing how one could do this can be a presentation of its own.
2. The best I/O is no I/O! Go to Computer Measurement Group (CMG), IDUG, and DB2 Conferences. This is the most frequently mentionedtopic. Why? Because it works, and can produce miraculous results as well.
29 2000 Gelb Information Systems Corp. – Comments/Questions: igelb@injersey .com / 732-303-1333
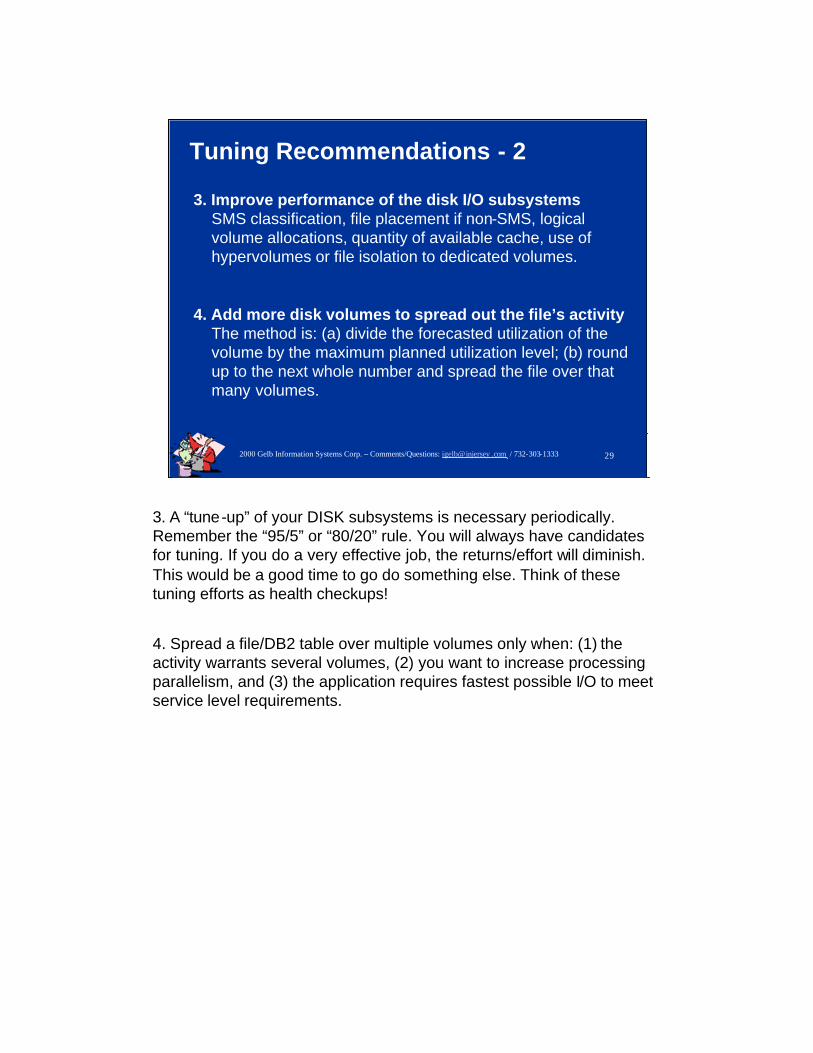
Tuning Recommendations - 2
3. Improve performance of the disk I/O subsystemsSMS classification, file placement if non-SMS, logical volume allocations, quantity of available cache, use of hypervolumes or file isolation to dedicated volumes.
4. Add more disk volumes to spread out the file’s activityThe method is: (a) divide the forecasted utilization of the volume by the maximum planned utilization level; (b) round up to the next whole number and spread the file over that many volumes.
3. A “tune-up” of your DISK subsystems is necessary periodically. Remember the “95/5” or “80/20” rule. You will always have candidates for tuning. If you do a very effective job, the returns/effort will diminish. This would be a good time to go do something else. Think of these tuning efforts as health checkups!
4. Spread a file/DB2 table over multiple volumes only when: (1) the activity warrants several volumes, (2) you want to increase processing parallelism, and (3) the application requires fastest possible I/O to meet service level requirements.
30 2000 Gelb Information Systems Corp. – Comments/Questions: igelb@injersey .com / 732-303-1333
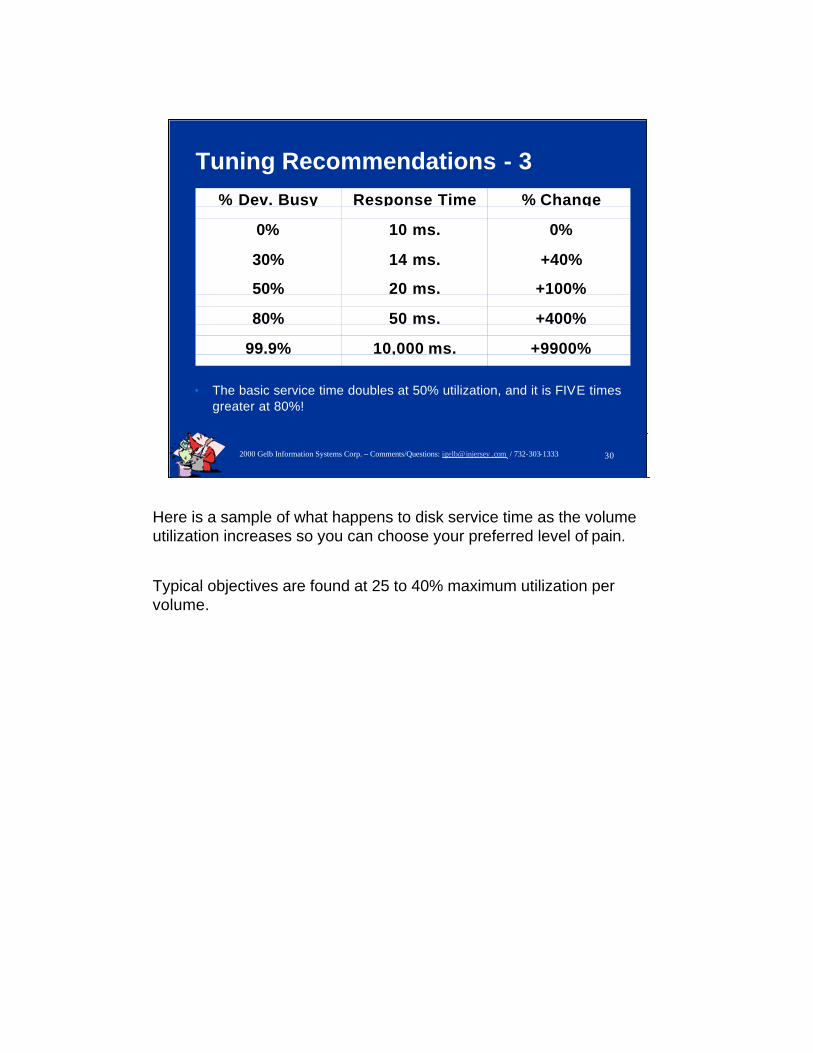
Tuning Recommendations - 3% Dev. Busy Response Time % Change
0% 10 ms. 0%
30% 14 ms. +40%
50% 20 ms. +100%
80% 50 ms. +400%
99.9% 10,000 ms. +9900%
• The basic service time doubles at 50% utilization, and it is FIVE times greater at 80%!
Here is a sample of what happens to disk service time as the volume utilization increases so you can choose your preferred level of pain.
Typical objectives are found at 25 to 40% maximum utilization per volume.
31 2000 Gelb Information Systems Corp. – Comments/Questions: igelb@injersey .com / 732-303-1333
Tuning Recommendations - 4
5. Replicate complete filesFile replication introduces the possible need for application changes. However, read-only activity segregation could produce major performance improvements.
6. Undertake application I/O performance re-engineering.Such changes can produce dramatic improvements, but much management support is a critical requirement. Many areas have to work closely together.
5. Since replicating files can become expensive and sometimes difficult to implement and make the required operational changes, it should only be done when it is perhaps the last resort to meet service levelobjectives. However, if you seek the ability to guarantee service levels, isolation via segregation is very effective.
6. The key to a successful re-engineering project usually hinges as much on our interpersonal skills when presenting the project andworking with the programmers as on our technical expertise. There are a number of software tools available from various vendors that can make this task somewhat simpler. The Strobe product is dedicated to identifying such opportunities. Most of the online activity monitors also have features for tracing frequently executed code patterns.
32 2000 Gelb Information Systems Corp. – Comments/Questions: igelb@injersey .com / 732-303-1333
Sample Results
• Batch jobs/Overnight window issue
• Online Systems Performance
Following are two sample results.
33 2000 Gelb Information Systems Corp. – Comments/Questions: igelb@injersey .com / 732-303-1333
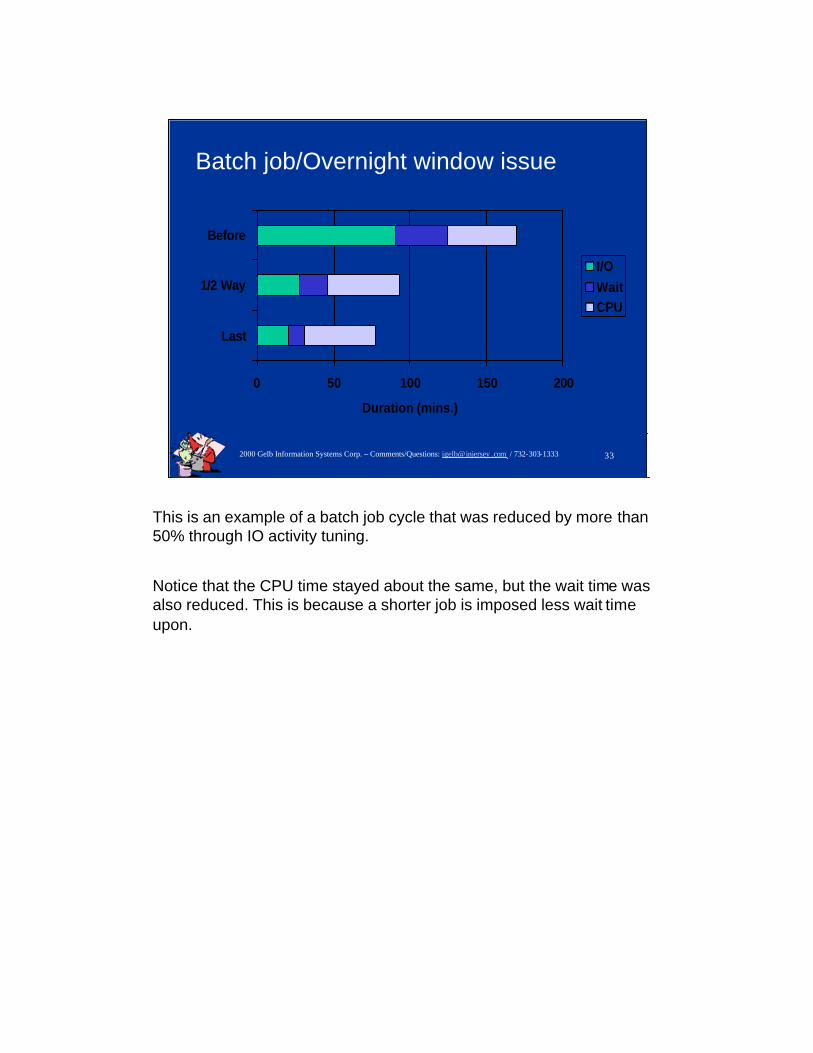
Batch job/Overnight window issue
0 50 100 150 200
Last
1/2 Way
Before
Duration (mins.)
I/OWaitCPU
This is an example of a batch job cycle that was reduced by more than 50% through IO activity tuning.
Notice that the CPU time stayed about the same, but the wait time was also reduced. This is because a shorter job is imposed less wait time upon.
34 2000 Gelb Information Systems Corp. – Comments/Questions: igelb@injersey .com / 732-303-1333
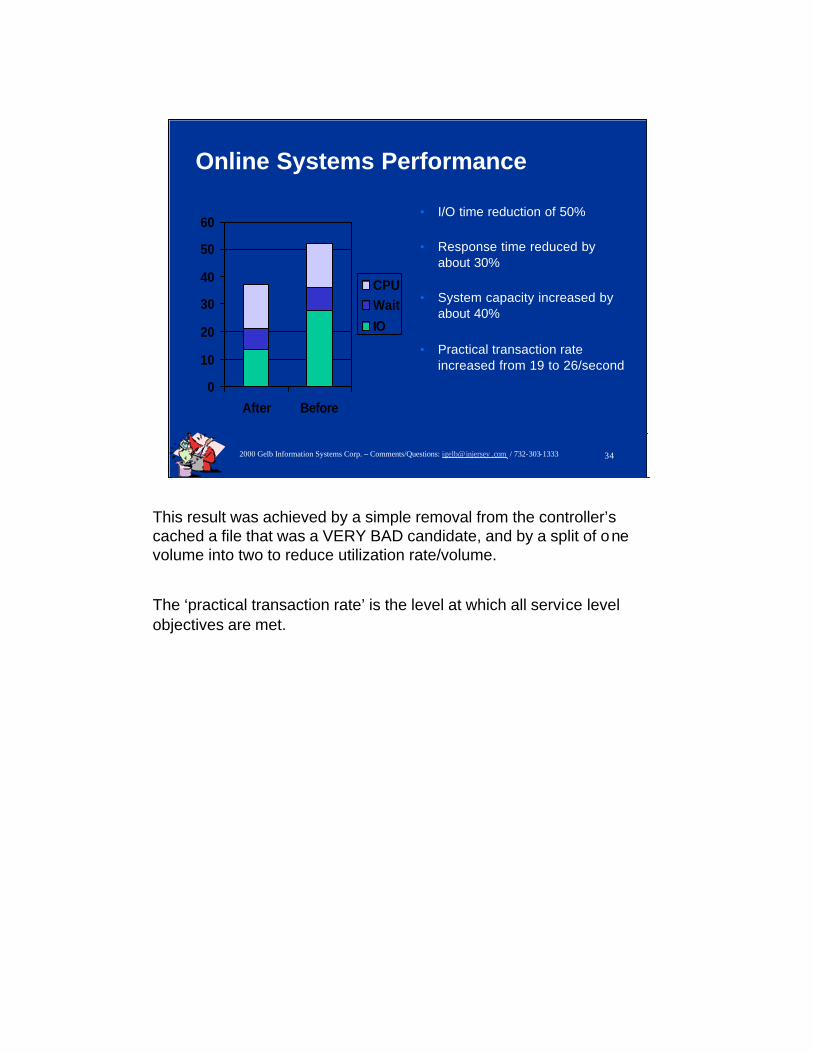
Online Systems Performance
0
10
20
30
40
50
60
After Before
CPUWaitIO
• I/O time reduction of 50%
• Response time reduced by about 30%
• System capacity increased by about 40%
• Practical transaction rate increased from 19 to 26/second
This result was achieved by a simple removal from the controller’s cached a file that was a VERY BAD candidate, and by a split of one volume into two to reduce utilization rate/volume.
The ‘practical transaction rate’ is the level at which all service level objectives are met.
35 2000 Gelb Information Systems Corp. – Comments/Questions: igelb@injersey .com / 732-303-1333
Information Sources
• Goldstein, Joel, “DB2 Buffer Pool Tuning - Top Down or Bottom Up,” IDUG Proceedings, 1998.
• IBM SG24-2213 DB2 for OS/390 Version 5 Performance Topics
• IBM SG24-2244 DB2 for OS/390 Capacity Planning
• IBM SG24-4706 OS/390 MVS Parallel Sysplex Capacity Planning
• Responsive Systems Co., “DASD/Xpert for DB2,” 1999
Notes: None
36 2000 Gelb Information Systems Corp. – Comments/Questions: igelb@injersey .com / 732-303-1333
The End
• YOU can perform miracles with I/Os.
• Cooperative staff is most helpful - the opposite just prolongs the process.
• I/O activity optimization will continue to be an area with major benefits.
We welcome all questions, comments and criticism. Please feel free to contact me, Ivan Gelb, via:
Phone: 732-303-1333
E-mail: [email protected]
Snail-mail: Gelb Information Systems Corp.
10 Country Club Lane
Marlboro, NJ 07746
If you send me an e-mail message, and it is an urgent matter for you, please also call the above phone number. My e-mail does go unchecked for up to a week periodically.