Embed Size (px)
Citation preview
~~~.. -.--.~~~~~~~~~~~~~~~.~. ... ,.... .. .
WORLD BANK TECHNICAL PAPER NO. 334
\WrP 33L0Work in progress 9for public discussion
Performance MonitoringIndicators Handbook
AGRICULTURE
4 - 3g1, i', I AIUSTMUENT
EDUCATION
ENVIRONMENT
FMANCIAI SECTOR
- -x.t - : @HOUSING ANDUR_AN DEVELOPMENT
_.USTRY AND MINING
} - _ t ~~~~~~~~~~~~~OIll AND GAS
POPULAnON, HEALTH.* a _ i: AND NUrRMON
? POVERTY REDUCTION
_ SECTOR DEVELOPMENT
-1 ',Wiiun MANAGEMENT
TECHNICAL ASSISTANCE
TELECOMMUNICATIONS
TRANSPORT
- AND WASTEWATER
Roberto lIosseLeigh Ellen Sontheimer
RECENT WORLD BANK TECHNICAL PAPERS
No. 256 Campbell, Design and Operation of Smallholder Irrigation in South Asia
No. 258 De Geyndt, Managing the Quality of Health Care in Developing Countries
No. 259 Chaudry, Reid, and Malik, editors, Civil Service Reform in Latin America and the Caribbean: Proceedings of a Conference
No. 260 Humphrey, Payment Systems: Principles, Practice, and Improvements
No. 261 Lynch, Provision for Children with Special Educational Needs in the Asia Region
No. 262 Lee and Bobadilla, Health Statisticsfor the AmericasNo. 263 Le Moigne, Subramanian, Xie, and Giltner, editors, A Guide to the Formulation of Water Resources Strategy
No. 264 Miller and Jones, Organic and Compost-Based Growing Mediafor Tree Seedling NurseriesNo. 265 Viswanath, Building Partnershipsfor Poverty Reduction: The Participatory Project Planning Approach of the Women's
Enterprise Management Training Outreach Program (WEMTOP)No. 266 Hill and Bender, Developing the Regulatory Environmentfor Competitive Agricultural Markets
No. 267 Valdes and Schaeffer, Surveillance of Agricultural Prices and Trade: A Handbookfor the Dominican Republic
No. 268 Valdes and Schaeffer, Surveillance of Agricultural Prices and Trade: A Handbookfor Colombia
No. 269 Scheierling, Overcoming Agricultural Pollution of Water: The Challenge of Integrating Agricultural andEnvironmental Policies in the European Union
No. 270 Banerjee, Rehabilitation of Degraded Forests in Asia
No. 271 Ahmed, Technological Development and Pollution Abatement: A Study of How Enterprises Are Finding Alternatives toChlorofluorocarbons
No. 272 Greaney and Kellaghan, Equity Issues in Public Examinations in Developing CountriesNo. 273 Grimshaw and Helfer, editors, Vetiver Grassfor Soil and Water Conservation, Land Rehabilitation, and Embankment
Stabilization: A Collection of Papers and Newsletters Compiled by the Vetiver Network
No. 274 Govindaraj, Murray, and Chellaraj, Health Expenditures in Latin America
No. 275 Heggie, Management and Financing of Roads: An Agenda for Reform
No. 276 Johnson, Quality Review Schemes for Auditors: Their Potentialfor Sub-Saharan Africa
No. 277 Convery, Applying Environmental Economics in Africa
No. 278 Wijetilleke and Karunaratne, Air Quality Management: Considerationsfor Developing Countries
No. 279 Anderson and Ahzned, The Casefor Solar Energy InvestmentsNo. 280 Rowat, Malik, and Dakolias, Judicial Reform in Latin America and the Caribbean: Proceedings of a World Bank Conference
No. 281 Shen and Contreras-Hermosilla, Environmental and Economic Issues in Forestry: Selected Case Studies in Asia
No. 282 Kim and Benton, Cost-Benefit Analysis of the Onchocerciasis Control Program (OCP)
No. 283 Jacobsen, Scobie and Duncan, Statutory Intervention in Agricultural Marketing: A New Zealand Perspective
No. 284 Valdes and Schaeffer in collaboration with Roldos and Chiara, Surveillance of Agricultural Price and Trade Policies: AHandbookfor Uruguay
No. 285 Brehm and Castro, The Marketfor Water Rights in Chile: Major Issues
No. 286 Tavoulareas and Charpentier, Clean Coal Technologiesfor Developing Countries
No. 287 Gillham, Bell, Arin, Matthews, Rumeur, and Hearn, Cotton Production Prospectsfor the Next Decade
No. 288 Biggs, Shaw, and Srivastiva, Technological Capabilities and Learning in African Enterprises
No. 289 Dinar, Seidl, Olem, Jorden, Duda, and Johnson, Restoring and Protecting the World's Lakes and Reservoirs
No. 290 Weijenberg, Dagg, Kampen Kalunda, Mailu, Ketema, Navarro, and Abdi Noor, Strengthening National AgricultualResearch Systems in Eastern and Central Africa: A Frameworkfor Action
No. 291 Vald6s and Schaeffer in collaboration with Errazuriz and Francisco, Surveillance of Agricultural Price and TradePolicies: A Handbookfor Chile
No. 292 Gorriz, Subramanian, and Simas, Irrigation Management Transfer in Mexico: Process and Progress
No. 293 Preker and Feachem, Market Mechanisms and the Health Sector in Central and Eastern Europe
No. 294 Valdes and Schaeffer in collaboration with Sturzenegger and Bebczuk, Surveillance of Agricultural Priceand Trade Policies: A Handbookfor Argentina
(List continues on the inside back cover)
WORLD BANK TECHNICAL PAPER NO. 334
Performance MonitoringIndicators Handbook
Roberto MosseLeigh Ellen Sontheimer
The World BankWashington, D. C.
Copyright © 1996The International Bank for Reconstructionand Development/THE WORLD BANK1818 H Street, N.W.Washington, D.C. 20433, U.S.A.
All rights reservedManufactured in the United States of AmericaFirst printing September 1996
Technical Papers are published to communicate the results of the Bank's work to the developmentcommunity with the least possible delay. The typescript of this paper therefore has not been prepared inaccordance with the procedures appropriate to formal printed texts, and the World Bank accepts noresponsibility for errors. Some sources cited in this paper may be informal documents that are not readilyavailable.
The findings, interpretations, and conclusions expressed in this paper are entirely those of theauthor(s) and should not be attributed in any manner to the World Bank, to its affiliated organizations, orto members of its Board of Executive Directors or the countries they represent. The World Bank does notguarantee the accuracy of the data included in this publication and accepts no responsibility whatsoeverfor any consequence of their use. The boundaries, colors, denominations, and other information shown onany map in this volume do not imply on the part of the World Bank Group any judgment on the legalstatus of any territory or the endorsement or acceptance of such boundaries.
The material in this publication is copyrighted. Requests for permission to reproduce portions of itshould be sent to the Office of the Publisher at the address shown in the copyright notice above. TheWorld Bank encourages dissemination of its work and will normally give permission promptly and, whenthe reproduction is for noncommercial purposes, without asking a fee. Permission to copy portions forclassroom use is granted through the Copyright Clearance Center, Inc., Suite 910, 222 Rosewood Drive,Danvers, Massachusetts 01923, U.S.A.
The complete backlist of publications from the World Bank is shown in the annual Index of Publications,which contains an alphabetical title list (with full ordering information) and indexes of subjects, authors,and countries and regions. The latest edition is available free of charge from the Distribution Unit, Officeof the Publisher, The World Bank, 1818 H Street, N.W., Washington, D.C. 20433, U.S.A., or from Publica-tions, The World Bank, 66, avenue d'Iena, 75116 Paris, France.
ISSN: 0253-7494
Both authors work in the Bank's Operations Policy Group in the Operations Policy Department. Robert Mosse isoperations adviser; Leigh Ellen Sontheimer is a consultant.
Library of Congress Cataloging-in-Publication Data
Mosse, Roberto, 1944-Performance monitoring indicators handbook / Roberto Mosse and
Leigh Ellen Sontheimer.p. cm. - (World Bank technical paper ; no. 334)
Includes bibliographical references.ISBN 0-8213-3731-91. World Bank. 2. Economic development projects-Evaluation.
1. Sontheimer, Leigh Ellen, 1964- . II. World Bank. III. Title.IV. Series.HG3881.5.W57M685 1996338.9'0068'6-dc2O 96-27346
CIP
CONTENTS
FOREWORD V
ACKNOWLEDGMENTS VI
PERFORMANCE MONITORING INDICATORS
What are performance monitoring indicators? 1Why are performance monitoring indicators important? 1
Portfolio Management Task Force findings 1OED studies 2Next Steps Action Plan 2
What are the advantages of performance monitoring indicators? 3How are performance monitoring indicators developed? 4
The logical framework 4Antecedents to the logical framework 5Importance of clarifying assumptions 7Hierarchy of objectives and the link to performcnce indicators 8Organizing the hierarchy of objectives 8
Types of performance indicators 11Results indicators 11Risk indicators 1 4Efficacy indicators 14
Ways of measuring performance 15Direct measures 15Indirect measures 15Early pointers: intermediate and leading indicators 15Quantitative and qualitative measures 16Measurement scope 17Special studies 1 7
General principles for selecting indicators 18Problems with defining indicators 1 8Problems with measuring impact 1 9
Indicator benchmarks and international comparators 19How do performance monitoring indicators affect the Bank's work? 19
Economic and sector work 19Project cycle 20
Project identification, preparation, and preappraisal 20
iii
Appraisal and negotiations 21Implementation and supervision 21Evaluation 21
Performance indicators and project management 21Field-level implementers 22Implementation unit managers 22Borrower officials and Bank staff 23
Some related issues 23Good practice in monitoring and evaluation 23
Data collection and management 24Institutional arrangements and capacity building 25Feedback from monitoring and evaluation efforts and interpreting
indicators 25Relation to loan covenants 26Working at cross purposes 26Last word 27
Notes 27
SECTORAL NOTES ON INDICATORS 28
What topics do the notes cover? 28How were the notes developed? 29How are indicators selected from the notes? 29Where are the notes available? 29How to learn more 29
EXAMPLES OF INDICATORS 3 1
Table 1 Honduras Basic Education Project(SAR 13791-HO, March 8, 1995) 32
Table 2 Indonesia Rural Electrification Project(SAR 12920-IND, February 3, 1995) 33
Table 3 Indonesia: Second Agricultural Research Management Project(SAR 13933-IND, April 21, 1995) 35
Table 4 Lithuania Siauliai Environment Project(SAR 14981 -LT, November 9, 1995) 37
Table 5 Peru Rural Roads Rehabilitation and Maintenance Project(SAR 14939-PE, November 6, 1995) 38
Table 6 The Philippines Women's Health and Safe Motherhood Project(SAR 13566-PH, January 27, 1995) 40
Table 7 Venezuela Agricultural Extension Project(SAR 13591 -VE, March 7, 1995) 42
Table 8 Chad: Structural Adjustment Credit(President's Report P-6785-CD) 43
Table 9 Morocco: Financial Markets Development Loan(President's Report P-6633-MOR) 45
iv

FOREWORD
As part of ongoing efforts to improve the quality and impact of its work, the WorldBank is placing new emphasis on the use of performance monitoring indicators. Theseindicators, which are based on a logical framework of project objectives and end-means relationships, help generate more thoughtful, logically constructed projectdesigns. And because they serve as benchmarks against which to measure projectprogress toward development objectives, they result in more meaningful project moni-toring and evaluation.
Over the post two years Bank staff have developed notes on suggestedperformance monitoring indicators for each of the main sectors in which the Bank isactive. These notes offer a framework for use by task managers, borrowers, and pro-ject implementation units in analyzing the relationship between objectives and moni-torable outcomes and impacts. They also offer a menu of possible indicators.
This handbook, which introduces and supplements the sector notes, is divided intothree sections. The first section explains why menus of indicators were developed;provides the background on the logical framework and typology of indicators;describes how indicators are developed and applied in project design, supervision,and evaluation; and discusses important issues related to the meaningful use of indi-cators. The second section describes the sector notes on indicators and their use andexplains how to get copies. The third section provides examples of performance indi-cators developed for Bank-financed projects and shows how the indicators weredeveloped on the basis of each project's development objectives.
Myrna AlexanderDirector, Operations Policy
May 1996
V
ACKNOWLE DGME NTS
This handbook was edited by Patricia Rogers of the World Bank's Operations PolicyDepartment and Meto de Coquereaumont and Paul Holtz of American Writing Corpo-ration. Laurel Morais and Christian Perez (American Writing Corporation) laid out thetext. The authors are grateful to Gerald Britan (U.S. Agency for International Develop-ment), Moses Thompson (Teams Technologies, Inc.), Ulrich Thumm (Operations Evalua-tion Department, World Bank), and Deborah Wetzel (Development Economics, WorldBank) for their valuable contributions and comments.
The authors also thank the following Bank task managers for preparing objectivesand indicators matrixes: Maria Dalupan, Hennie Deboeck, Dely Gapasin, Jose LuisIrigoyen, Rama Lakshminarayanan, David Nielson, Arun Sanghvi, Anna Sant'Anna,Stanley Scheyer, Sari Soderstrom, and Christopher Walker.
vi
PERFORMANCE MONITORINGINDICATORS
What are performance monitoring indicators?
Performance indicators are measures of project impacts, outcomes, outputs, andinputs that are monitored during project implementation to assess progress towardproject objectives. They are also used later to evaluate a project's success. Indicatorsorganize information in a way that clarifies the relationships between a project'simpacts, outcomes, outputs, and inputs and help to identify problems along the waythat can impede the achievement of project objectives.
Why are performance monitoring indicators important?
In recent years several important studies-most notably the Portfolio ManagementTask Force Report and reviews by the Operations Evaluation Department (OED)-have found that the monitoring and evaluation of Bank-financed projects did not focusadequately on the factors that are critical for positive development impact. Both thetask force and OED concluded that performance indicators should be integrated withthe monitoring and evaluation procedures used by the Bank and its borrowers.
The Portfolio Management Task Force Report (also known as the Wapenhans Report) Porifolloanalyzed the factors that affect the development impact of Bank operations.1 As part Management Taskof this analysis the task force focused on how evaluation methodologies, including the Farce findingscalculation of economic rate of return and the project rating methodology, were usedduring project appraisal and supervision to enhance the quality of Bank-supportedprojects. The task force found that project ratings were not providing implementationunits, borrowers, and Bank task managers with adequate feedback about progresstoward development impact for several reasons:
* Too much emphasis was placed on the mechanics (physical and financial) of pro-ject implementation.
* The risks and factors that most influence project outcomes were poorly identified.* Objective criteria, transparency, and-since the methodology depended on the
judgment of individuals-consistency across units were lacking.* Ratings tended to be overly optimistic.
1
Without appropriate feedback, none of the parties concerned with project outcomescould make appropriate, informed decisions about whether and how to adjust projectdesign or implementation arrangements to better achieve a project's intendedobjectives. A related problem is that the objectives themselves are often not well thoughtout or clearly articulated, clouding the development of appropriate performance moni-toring indicators and making monitoring and evaluation even more difficult.
Further, the task force pointed out that the Bank's traditional method of appraisaland evaluation of development impact-the calculation of economic rate of return ornet present value-cannot be applied to all projects and that for some projects, ameaningful cost-benefit analysis is not feasible. Even for projects for which net presentvalue or economic rate of return is calculated, Bank practice is to calculate it only afew times-during appraisal, during a midterm review, upon restructuring ifnecessary, and at the time of the Implementation Completion Report. Neither the cal-culations nor the critical variables that affect them are monitored explicitly throughoutimplementation. Moreover, the report pointed out, in many instances costs and bene-fits could be more easily identified and measured with performance indicators.
The task force concluded that the Bank's project rating methodology and supervisionreporting system should be adapted to include the use of project performance monitor-ing indicators derived from a project's development objectives and implementation plan.
OED studies Two OED studies reviewing the Bank's record on the monitoring and evaluation ofprojects reinrorced the findings of the task force report.2 In fiscal 1 994 a study assess-ing twenty years of Bank projects found that Bank guidelines and directives on moni-toring and evaluation had not been followed adequately, either during projectappraisal (when monitoring and evaluation are planned) or during implementation.But the study also found evidence that the situation was changing.
A follow-up study of monitoring and evaluation plans in a sample of fiscal 1995projects suggests that the quality of such planning has improved. The improvement isevident in the rising use of performance monitoring indicators-the share of projectswith at least some indicators rose from 72 percent in fiscal 1 993 to 77 percent in fis-cal 1995. Nevertheless, the expanding use of indicators has not been matched byarrangements for data collection or monitoring and evaluation capacity-buildingefforts in either the Bank or borrowing countries. Relatively few projects (14 percentof the sample reviewed by OED in fiscal 1995) achieve overall good practice in com-prehensive design or use of monitoring and evaluation. And performance monitoringindicators, although more widely used, are weak in structure and usually do not fol-low a logical framework or a typology, and there is not always follow-through ondata collection.
Next Steps In response to these concerns, Bank management has made efforts to foster the use ofAction Plan performance indicators. In the Next Steps Action Plan, which was designed to imple-
ment the recommendations of the Wapenhans task force, management called for incor-porating performance monitoring indicators in the project rating system used for projectmonitoring (through Form 590 and the Annual Report on Portfolio Performance), to
2
better monitor progress toward a project's development objectives. Management alsorecognized that the Bank needed to develop sector-specific indicators to help borrow-ers and Bank staff define project objectives more narrowly and to derive logical mea-sures of project outcomes and impact in order to measure achievement of projectobjectives. The Bank also needed to support the use of indicators in the revised projectrating system. Therefore the action plan called for the sector departments within theCentral Vice Presidencies to develop sets of sector-specific indicators that are most rele-vant to project design and monitoring-the sector notes on indicators discussed in thesecond part of this handbook. Staff would then be required to ensure that key sector-specific project impact indicators were identified in project appraisal documentationand that progress was monitored against these benchmarks.
What are the advantages of performance monitoring indicators?
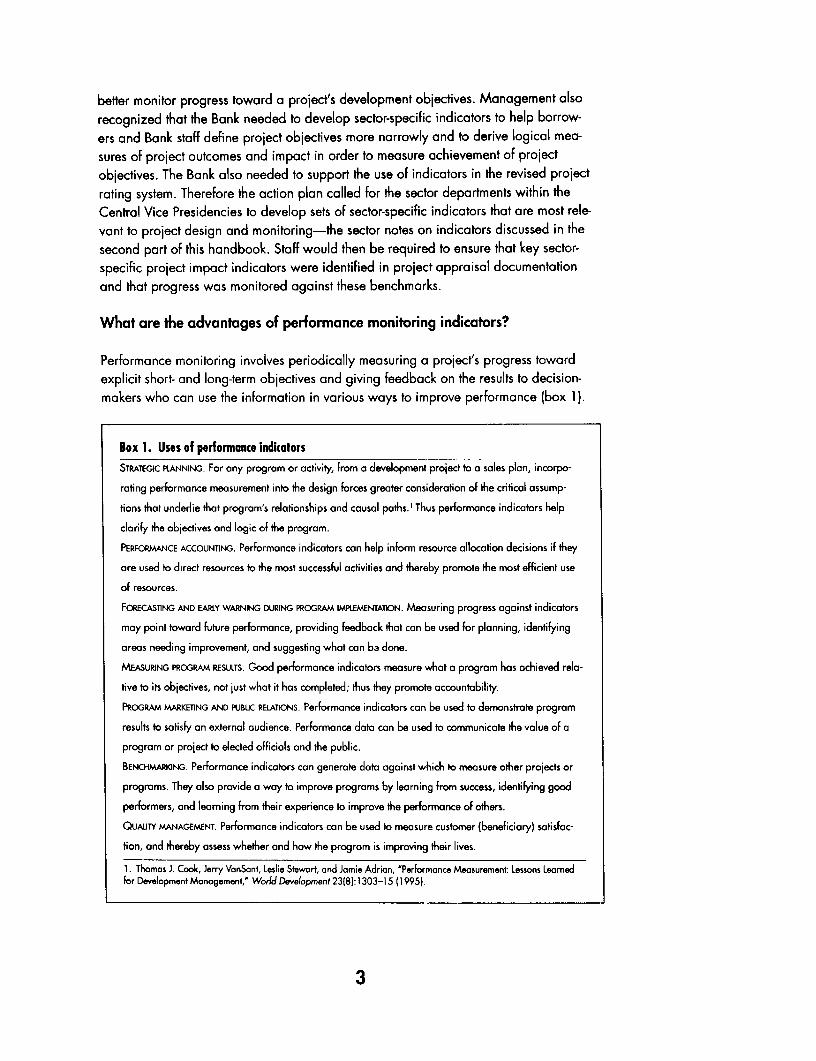
Performance monitoring involves periodically measuring a project's progress towardexplicit short- and long-term objectives and giving feedback on the results to decision-makers who can use the information in various ways to improve performance (box 1).
Box 1. Uses of performance indicatorsSTPATEGIc PtANNING. For any program or activity, From a development project to a sales plan, incorpo-
rating performance measurement into the design forces greater consideration of the critical assump-
tions that underlie that program's relationships and causal paths.' Thus performance indicators help
clarify the objectives and logic of the program.
PERFORMANCE ACCOUNTING. Performance indicators can help inform resource allocation decisions if they
are used to direct resources to the most successful activities and thereby promote the most efficient use
of resources.
FORECASTING AND EARLY WARNING DURING PROGRAM IMPLEMENTATION. Measuring progress against indicators
may point toward future performance, providing feedback that can be used for planning, identifying
areas needing improvement, and suggesting what can be done.
MEASURING PROGRAM RESULTS. Good performance indicators measure what a program has achieved rela-
tive to its objectives, not just what it has completed; thus they promote accountability.
PROGRAM MARKETING AND PJBUC RELAnONS. Performance indicators can be used to demonstrate program
results to satisfy an external audience. Performance data can be used to communicate the value of a
program or project to elected officials and the public.
BENCHMARKING. Performance indicators can generate data against which to measure other projects or
programs. They also provide a way to improve programs by learning from success, identifying good
performers, and leaming from their experience to improve the performance of others.
QUALITY MANAGEMENT. Performance indicators can be used to measure customer (beneficiary) satisfac-
tion, and thereby assess whether and how the program is improving their lives.
1. Thomas J. Cook, Jerry VanSant, Leslie Stewort, and Jamie Adrian, 'Performance Meosurement: Lessons Learnedfor Development Management,' World Development 23181:1303-15 (19951.
3
For the purposes of the Bank and its clients the most significant benefits of performanceindicators accrue in project design (strategic planning), project supervision and monitor-ing (forecasting results), and project evaluation (measuring results and quality manage-ment). The needed information and data collection egforts become evident as projectobjectives are formulated. In a performance monitoring system, indicators serve as toolsfor measuring the flow of change. Baselines are the values of performance indicators atthe beginning of the planning period; targets are the values at the end.
The benefits of indicators come from their measurability and from their direct deriva-tion from project objectives, which are grounded in sector, economic, risk, and benefi-ciary analysis. Indicators specifically link a project's inputs and activities with quantifiedmeasures of expected outputs and impact. Before selecting indicators, the borrower orproject implementation unit and the Bank must consider which measures ofperformance will tell them whether and how a project's proposed objectives are beingachieved and who will benefit-thereby contributing to a more precise definition of theobjectives. Borrowers and the Bank must also ask whether the necessary data are avail-able and decide what users should do in response to the indicator outcomes.
With indicators, monitoring and evaluation is more compelling because it is objec-tive, not based on personal judgments or pure description. Furthermore, indicatorshold a project's ultimate goals clearly in view throughout implementation. If designedand used correctly, indicators meet the specific information needs and scope ofauthority of all the parties concerned with implementation-field staff, implementationunit, borrower, task manager, and Bank management. The implementation unit and itssubunits are most interested-and in a better position to respond to-indicators ofinputs, risk factors, and outputs. The Bank and its borrowers are most interested inindicators of output, outcome, and development impact. Thus the indicators help allparties focus on the areas of greatest concern to them.
How are performance monitoring indicators developed?
Performance indicators must be based on the unique objectives of individual projects.3
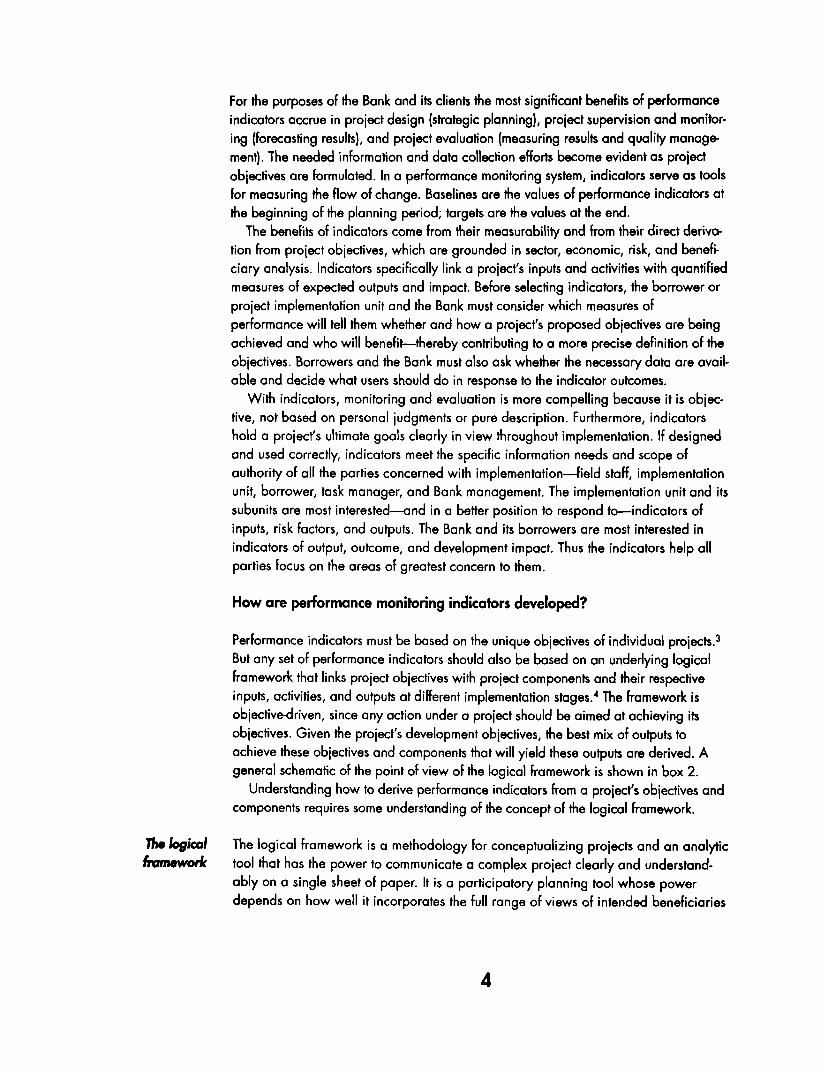
But any set of performance indicators should also be based on an underlying logicalframework that links project objectives with project components and their respectiveinputs, activities, and outputs at different implementation stages. The framework isobjective-driven, since any action under a project should be aimed at achieving itsobjectives. Given the project's development objectives, the best mix of outputs toachieve these objectives and components that will yield these outputs are derived. Ageneral schematic of the point of view of the logical framework is shown in box 2.
Understanding how to derive performance indicators from a project's objectives andcomponents requires some understanding of the concept of the logical framework.
The Iogicl The logical framework is a methodology for conceptualizing projects and an analyticfrmework tool that has the power to communicate a complex project clearly and understand-
ably on a single sheet of paper. It is a participatory planning tool whose powerdepends on how well it incorporates the full range of views of intended beneficiaries
4
Box 2. Point of view of the logicl framework
DEvELoWaq OSECUnE
Describes the proiect's real outcome-the impac that the project's outputs will hae on the
beneficiary, institution, or system in terms of changed behavior or improved perwformrc.
The development objective defines the projects success.
PROJECT OUuws
Define what the project can 6e held directly accountable for producing-the projeds deliv-
erables the goods and services it will produce. Typically, outputs are indepwdnt, synergis-
tic, and integrated.
Clusters of ac6ivifies that rdefine howv the products and services Wfill 6e deli-YOO (hchnical
ossistance, physical infrastructure, and the lilke).
Source: Team Technologies, Inc.
and others who have a stake in the project design. It is best used to help projectdesigners and stakeholders:
e Set proper objectives* Define indicators of success
Identify key activity clusters (project components)* Define critical assumptions on which the project is based* Identify means of verifying project accomplishments* Define resources required for implementation.
As an up-front planner the logical framework can be used to help design tools forproject implementation and evaluation. Knowing its advantages and limitations helpsin assessing the value of the logical framework methodology at various points in theproject cycle (box 3).
Antecedents to the logical frameworkThe logical framework can improve the identification, preparation, and performanceappraisal process by clarifying a project's design and making it transparent to theborrower, the lender, and beneficiaries and other stakeholders. The frameworkassumes that projects are instruments of change and that they are selected from
5
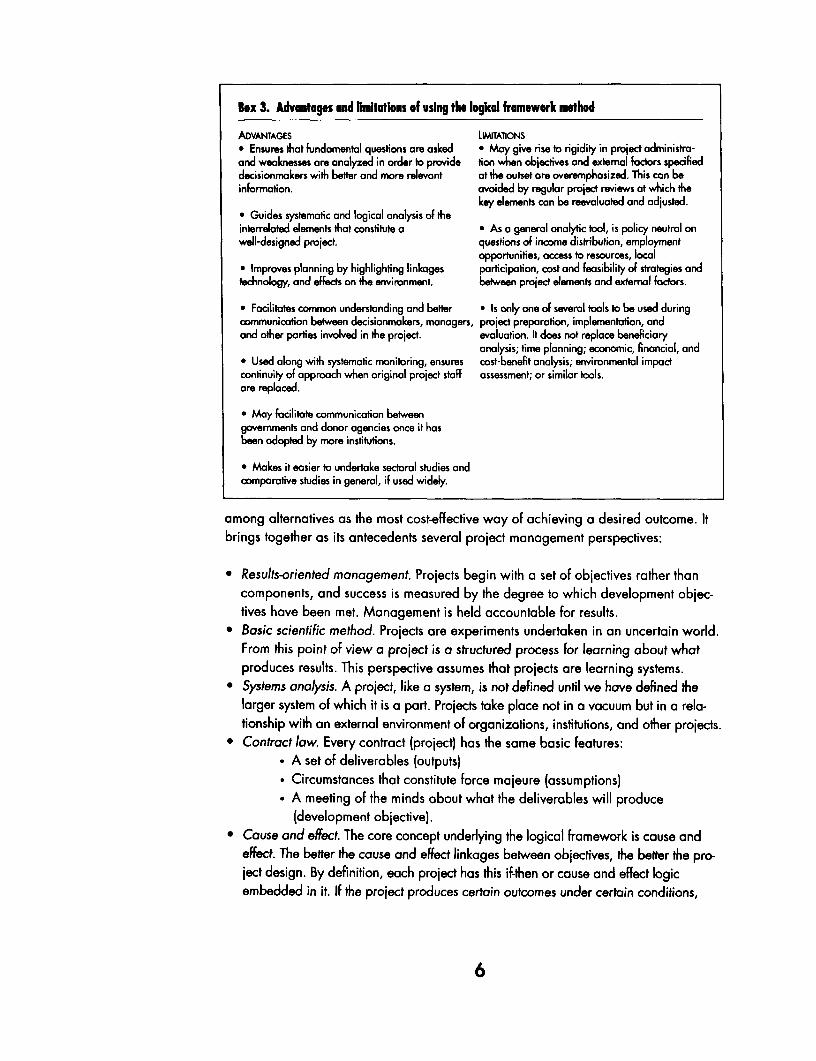
Ibx 3. Advantages and lihitations of using the logkal framework method
ADVANTAGES LMTA11ONS* Ensures that fundamental queshons are asked * May give rise to rigidity in project administra-and weaknesses are analyzed in order to provide tion when objectives and extemal factors specifieddecisionmakers with better and more relevant at the outset are overemphasized. This con beinformation. avoided by regular project reviews at which the
key elements can be reevaluated and adjusted.* Guides systematic and logical analysis of theinterrelated elements that constitute a . As a general analytic tool, is policy neutral onwell-designed project. questions of income distribution, employment
opportunities, access to resources, local* Improves planning 6y highlighting linkages participation, cost and feasibility of strategies andtechnology, and effects on the environment. between project elements and extemcal factors.
* Facilitates common understanding and better . Is only one of several tools to be used duringcommunication between decisionmakers, managers, project preparation, implementation, andand other parties involved in the project. evaluafion. It does not replace beneficiary
analysis; fime planning; economic, financial, and* Used along vith systematic monitoring, ensures cost-benefit analysis; environmental impactcontinuity of approach when original project staff assessment; or similar tools.are replaced.
* May facilitate communication betweengovemments and donor agencies once it hasbeen adopted by more institutions.
. Makes it easier to undertake sectoral studies andcomparative studies in generol, if used widely.
among alternatives as the most cost-effective way of achieving a desired outcome. Itbrings together as its antecedents several project management perspectives:
* Results-oriented management. Projects begin with a set of objectives rather thancomponents, and success is measured by the degree to which development objec-tives have been met. Management is held accountable for results.
* Basic scientific method. Projects are experiments undertaken in an uncertain world.From this point of view a project is a structured process for learning about whatproduces results. This perspective assumes that projects are learning systems.
* Systems analysis. A project, like a system, is not defined until we have defined thelarger system of which it is a part. Projects take place not in a vacuum but in a rela-tionship with an external environment of organizations, institutions, and other projects.
* Contract law. Every contract (project) has the same basic features:. A set of deliverables (outputs). Circumstances that constitute force majeure (assumptions). A meeting of the minds about what the deliverables will produce
(development objective).* Cause and effect. The core concept underlying the logical framework is cause and
effect. The better the cause and effect linkages between objectives, the better the pro-ject design. By definition, each project has this if-then or cause and effect logicembedded in it. If the project produces certain outcomes under certain conditions,
6
then it can be expected to achieve certain other outcomes. For example, if the projectsupplies farmers with improved seed and puts a credit system in place, and assumingthere is adequate rainfall, then production will increase. The logical framework forcesproject planners to make this cause and effect logic explicit, but it does not guaranteea good design. The validity of the cause and effect logic depends on the quality andexperience of the design team.
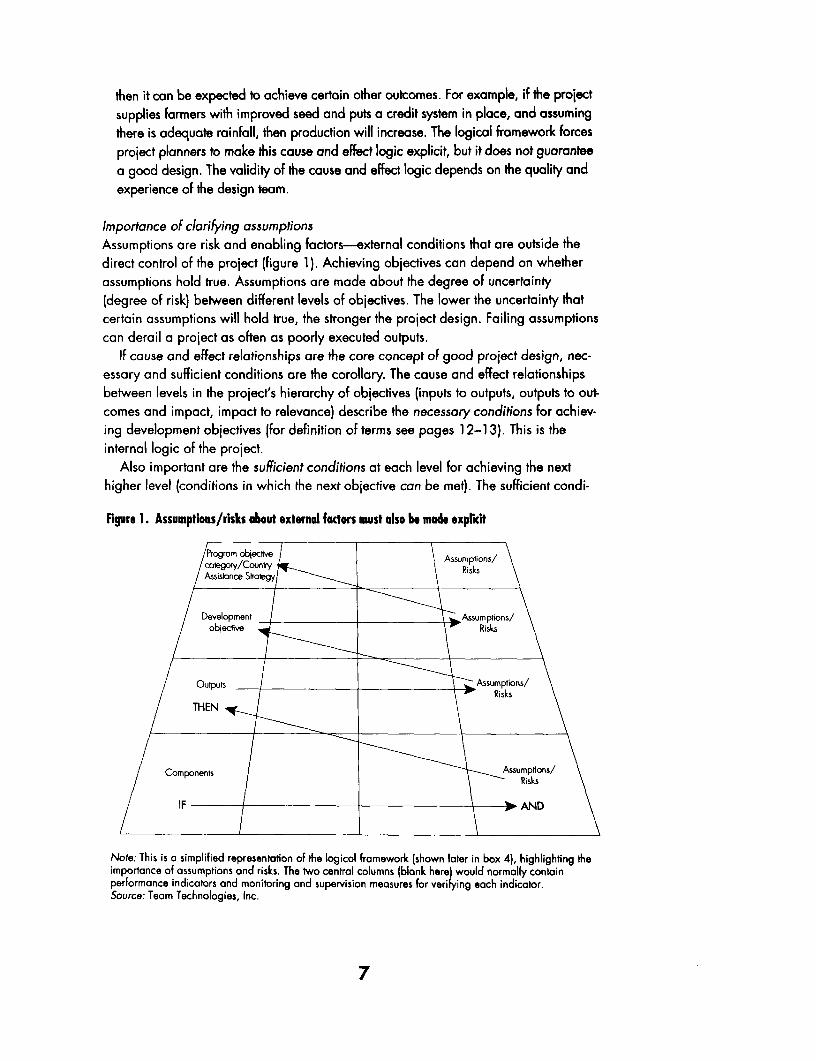
Importance of clarifying assumptionsAssumptions are risk and enabling factors-external conditions that are outside thedirect control of the project (figure 1). Achieving objectives can depend on whetherassumptions hold true. Assumptions are made about the degree of uncertainty(degree of risk) between different levels of objectives. The lower the uncertainty thatcertain assumptions will hold true, the stronger the project design. Failing assumptionscan derail a project as often as poorly executed outputs.
If cause and effect relationships are the core concept of good project design, nec-essary and sufficient conditions are the corollary. The cause and effect relationshipsbetween levels in the project's hierarchy of objectives (inputs to outputs, outputs to out-comes and impact, impact to relevance) describe the necessary conditions for achiev-ing development objectives (for definition of terms see pages 12-1 3). This is theinternal logic of the project.
Also important are the sufficient conditions at each level for achieving the nexthigher level (conditions in which the next objective can be met). The sufficient condi-
Figure 1. Assumptions/risks obout external factors must also be made expliet
Program jectve Assumptionscaegory/Couny RisksAssislonce Slrabgy Risks
Development Assumptions/objective Risks
/ Otput s tAssumptions/
Components t Assumplios/\~Ri spks
I IF | >AND \
Note: This is a simplified representation of the logical framework (shown later in box 4), highlighting theimportance of assumptions and risks. The two centrol columns (blank herel would normally containperformance indicators and monitoring and supervision measures for verifying each indicator.Source: Team Technologies, Inc.
7
tions between levels in the hierarchy of objectives are the assumptions. This is theexternal logic of the project. The objectives hierarchy (necessary conditions) plus theassumptions (sufficient conditions) together give one a much clearer idea of the pro-ject's design. This is what the logical framework graphically represents.
Hierarchy of objectives and the link to performance indicatorsUsers of the logical framework have come to agree on a common set of terms (out-comes, results, targets, indicators, outputs, goals, achievements, development objec-tives). These terms are essentially ways of referring to or classifying objectives.
The logical framework assumes that there are several levels of objectives in a pro-ject (a hierarchy of objectives). Though there is no logical limit to the number of lev-els, most project teams find it difficult to manage more than four levels effectively. Thelogical framework typically specifies four. The World Bank uses indicators predicatedon a framework that specifies three levels of objectives: inputs for project activities,outputs of project activities, and outcomes and impacts. For the World Bank'spurposes, inputs and outputs correspond strictly to project management, whileoutcomes and impacts correspond to the project's development objectives.
The Country Assistance Strategy reflects the agreement between the Bank and itsborrowers on a country's overall development goals and the anticipated means-projects, economic and sector work, technical assistance-for the Bank (and otherfinanciers) to help achieve them. Projects must show how their objectives are relevantto the realization of overall country development goals.
For any project a set of performance indicators should be designed within the logi-cal framework. The development of performance indicators begins with the project'sobjectives and reflects the associated hierarchy of activities and their outputs andintended outcomes for each project component. The activities conducted and theresults achieved at lower levels of objectives are inputs toward the achievement ofhigher-level project objectives, at the institutional, sectoral, program, or country level.5
The definition of indicators at each level thus hinges on the project's ultimate objec-tive, which can be modest Ifor example, to reduce the incidence of preventable dis-ease within a given population by increasing immunizations) or more ambitious inscale (to reduce child mortality).
Organizing the hierarchy of objectivesThe logical framework presents schematically the hierarchy of project objectives, theperformance indicators for measuring the achievement of each objective, the meansof verifying each indicator, and the assumptions (risk and enabling factors) critical toachieving the next objective level. Box 4 illustrates a sample logical framework for anutrition and child development project in Uganda.
The relationships among project objectives-and the need for performance informa-tion-can be also be clarified by graphically depicting the overall program logic andperformance expectations in an objectives tree (figure 2). The tree begins with the over-arching development objectives of a project (consistent with the objectives of the Coun-try Assistance Strategy), lists the lower-level outputs through which these objectives are
8
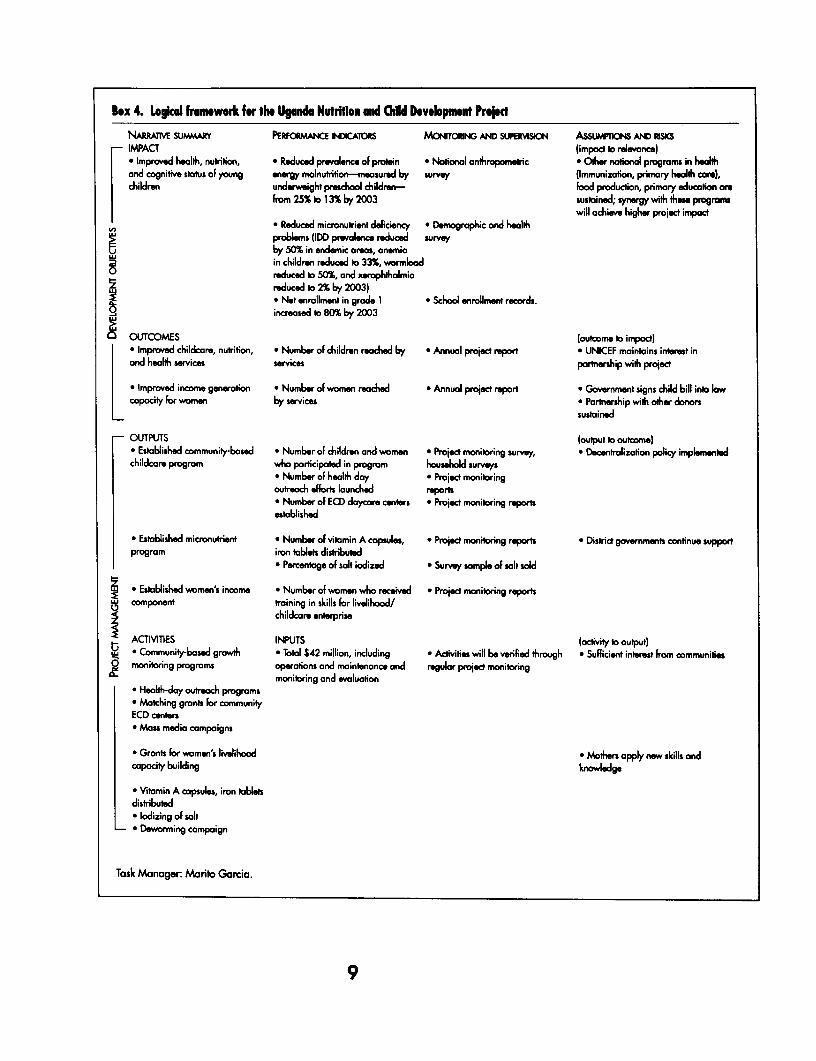
Box 4. Logkai fromework for the Uganda Nutrition and Child Developmen Prsct
NARRA I suMRY PEWORMANC NDICATORS MONTOING AND RSUbSIO4N ASSmwPT AmD mS6IMPACT (impact to relevance)* Improved health, nurition, * Reduced prevalence of protein * Noainal anthropomeiric * Oiler national programs in heathand cogniive status of young energy malnutrition-measured by survey (Immunizoaion, primary healh core),children underweight preschool children- food production, primary educaion are
from 25% to 13% by 2003 sustained; synergy with then programswill achieve higher projed impoct
Reduced micronuirient deficiency * Demogrophic and healthproblems (IDM prevalence reduced surveyby 50% in endemic areas, anemiain children reduced to 33%, wormloodreduced to 50%, and xeophthalmiareduced io 2% by 2003)* Net enrollment in grode 1 * Schoa enrollment recordsincreased to 80% by 2003
OUTCOMES (outcome to impoct)* Improved childcare, nutrition, . Number of children reached by . Annual projec report * UNICEF maintains interest inand health services services partnership with projed
* Improved inoome generaion * Number oF women reached * Annual projed report . Governmen signs child bill into wcopocity for women by services * Partnership with other donors
L sustained
OUTPUTS (output to outcome)* Established community-based * Number of children and women * Projedc monitoring survey, * Decentralizoaion policy implementedchildcare program who participated in program household surveys
* Number of health day * Project monitoringoutreach efforts lounched reports* Number of ECD daycore centers * Projedc monitoring reportsestablished
* Established micronutrient * Number oF vitamin A capsules, . Projec monitaring reports * Distrid governments continue supportprogram iron tablets distributed
. Percentge of salt iodized * Survey somple of swt sold
* Established women's income * Number of women who received * Projed monitaring reportscomponent training in skills for livelihood/
childcare enterprise
ACTIVITIES INPUTS (octivity to output)* Community-6ased growth * btal $42 million, including . Adiviies will 6e verified through * Sufficient interest from communitiesa monitoring programs operations and maintenance and regular projed monitoring
monitoring and evaluation* Heoah-day outreoch programs* Matching grants Fr oommunityECD center* Mass media campaigns
* Gronts for women's livelihood * Mothers apply new skills andcapocity building knowledge
* Vitamin A capsules, iron tabletdistributed* Iodizing of salta Deworming compoign
Task Manager: Marib Garcia.
9
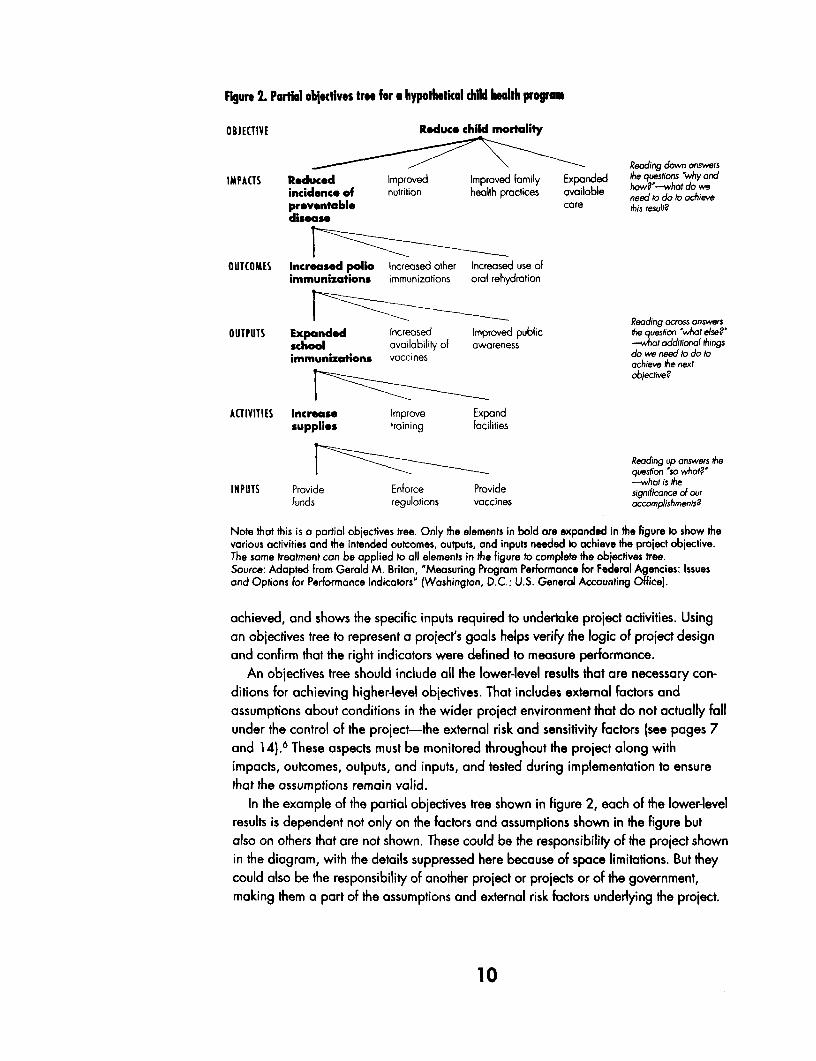
Figure 2. Partial oblectlves troe for a hypothetkal chiM health proFgm
OBJECTIVE Reduce child mortality
Reoding down ansversIMPACTS Reduced Improved Improved family Expanded the questions why and
incidence of nutrition health practices availoble how? -whoat do weneed to do to achievpreventable care this result?disease
OUTCOMES Increased polio Increased other Increased use ofimmunizations immunizations oral rehydration
Reading across answersOUTPUTS Expanded Increased Improved public the eshon whoat ese?
school availability of awareness =at dditional thingsimmunizations vaccines do we need to do toachieve the nextI= = =aobjecthve?
ACTIVITIES Incrase Improve Expandsupplies training facilities
Reading up answers thequestion 'sa whato?-what is theINPUTS Provide Enforce Provide significonce af our
funds regulations vaccines accomphdshments?
Note that this is a partial objectives tree. Only the elements in bold are expanded in the figure to show thevarious activities and the intended outcomes, outputs, and inputs needed to achieve the project objective.The some treatment can be applied to all elements in the figure to complete the objectives tree.Source: Adopted from Gerald M. Britan, 'Measuring Program Performance for Federal Agencies: Issuesand Opfions for Performance Indicators' (Washington, D.C.: U.S. General Accounting Office).
achieved, and shows the specific inputs required to undertake project acfivities. Usingan objectives tree to represent a project's goals helps verify the logic of project designand confirm that the right indicators were defined to measure performance.
An objectives tree should include all the lower-evel results that are necessary con-ditions for achieving higher-level objectives. That includes external factors andassumptions about conditions in the wider project environment that do not actually fallunder the control of the project-the external risk and sensitivity factors (see pages 7and 1 4).6 These aspects must be monitored throughout the project along withimpacts, outcomes, outputs, and inputs, and tested during implementation to ensurethat the assumptions remain valid.
In the example of the partial objectives tree shown in figure 2, each of the lower-levelresults is dependent not only on the factors and assumptions shown in the figure butalso on others that are not shown. These could be the responsibility of the project shownin the diagram, with the details suppressed here because of space limitations. But theycould also be the responsibility of another project or projects or of the government,making them a part of the assumptions and external risk factors underlying the project.
10
For example, "expanded school immunizations" depends, as shown, on "increasingsupplies," "improving training" and "expanding facilities"all, according to the figure,responsibilities of the project. It also depends on "increased availability of vaccines"and "improved public awareness," which could be part of the project (though the figuredoes not show that) or part of another project and therefore part of the project'sassumptions and external risk factors.
A tool to conceptualize, design, and appraise projects, such as an objectives treeor similar analytical tool-and the performance indicators derived from it-should notbe considered unchangeable.7 It should be continually reevaluated during eachphase of project preparation, implementation, and evaluation. If the results analyzedduring project implementation point to a need to change the means of achieving pro-ject objectives, the mix of inputs (activities to be undertaken) and definition of outputsshould be adjusted and new indicators derived to measure the newly defined targets.
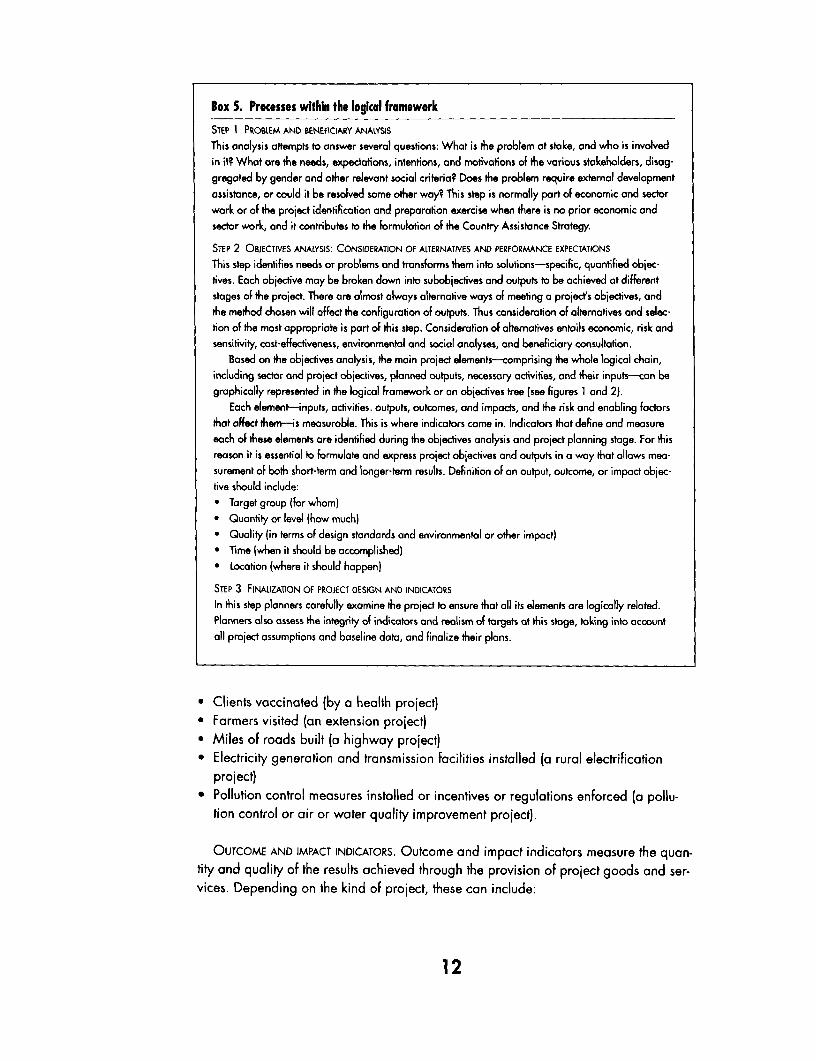
The general steps that go into formulating project objectives and constructing thelogical structure of a project are important aspects of the identification and prepara-tion stages of the Bank's project cycle (box 5).8
There are different ways to measure performance for any given variable (objective, Types of performanceimpact, outcome, output, input). A system of indicators anchored in the logical frame- indicatorswork approach is modeled in figure 3. While figure 3 shows a comprehensive systemof indicators in order to provide a complete frame of reference, the elements of thesystem that are not covered in detail by this handbook are shown in dotted lines.These elements are included in OED's evaluations of project performance.
Results indicatorsResults indicators measure project results relative to project objectives. Results aremeasured at the level determined by a project's objectives. Remember that followingthe logical framework approach, they should be defined starting with the impact andoutcome indicators (and working backwards to the input indicators).
INPUT INDICATORS. Input indicators measure the quantity (and sometimes the quality) ofresources provided for project activities. Depending on the project, these can include:
* Funding-counterpart funds, Bank loan funds, cofinancing, grants* Guarantees* Human resources-number of person-years for members of the implementation unit,
consultants, and technical advisers* Training* Equipment, materials, and supplies, or recurrent costs of these items-for example,
textbooks, syringes, vaccines, classroom facilities.
OUTPUT INDICATORS. Output indicators measure the quantity (and sometimes the qual-ity) of the goods or services created or provided through the use of inputs. Dependingon the project, these can include such elements as:
11
Box 5. Processes within the logical framework
STEP I PROBLEM AND BENEFICIARY ANALYSIS
This analysis aHtempts to answer several questions: What is the problem at stake, and who is involvedin it? What are the needs, expectations, intentions, and motivations of the various stakeholders, disag-gregoted 6y gender and other relevant social criteria? Does the problem require extemal developmentassistance, or could it be resolved some other way2 This step is normally part of economic and sectorwork or of the project identification and preparation exercise when there is no prior economic andsector work, and it contributes to the formulation of the Country Assistance Strategy.
STEP 2 OBJECTIVES ANALYSIS: CONSIDERATION OF ALTERNATIVES AND PERFORMANCE EXPECTATIONS
This step identifies needs or problems and transforms them into solutions-specific, quantified objec-tives. Each objective may be broken down into subobjectives and outputs to be achieved at differentstages of the project. There are almost always alternative ways of meeting a projects objectives, andthe method chosen will affect the configuration of outputs. Thus consideration of alternatives and selec-tion of the most appropriate is part of this step. Consideration oF altematives entails economic, risk andsensitivity, cost-effectiveness, environmental and social analyses, and beneficiary consultation.
Based on the objectives analysis, the main project elements-comprising the whole logical chain,including sector and project objectives, planned outputs, necessary activities, and their inputs-can begraphically represented in the logical framework or an objectives tree (see figures 1 and 2).
Each element-inputs, activities., outputs, outcomes, and impacts, and the risk and enabling factorsthat affect thern-is measuroble. This is where indicators come in. Indicators that define and measureeach of these elements are identified during the objectives analysis and project planning stage. For thisreason it is essential to formulate and express project objectives and outputs in a way that allows mea-surement of both short-term and longer-term results. Definition of an output, outcome, or impact objec-tive should include:* Target group (for whom)* Quantity or level (how much)* Quality (in terms of design standards and environmental or other impact)* Time (when it should be accomplished)* Location (where it should happen)
STEP 3 FINALIZATION OF PROJECT DESIGN AND INDICATORS
In this step planners carefully examine the project to ensure that all its elements are logically related.Planners also assess the integrity of indicators and realism of targets at this stage, taking into accountall project assumptions and baseline data, and finalize their plans.
* Clients vaccinated (by a health project)* Farmers visited (an extension project)* Miles of roads built (a highway project)* Electricity generation and transmission facilities installed (a rural electrification
project)* Pollution control measures installed or incentives or regulations enforced (a pollu-
tion control or air or water quality improvement project).
OUTCOME AND IMPACT INDICATORS. Outcome and impact indicators measure the quan-tity and quality of the results achieved through the provision of project goods and ser-vices. Depending on the kind of project, these can include:
12
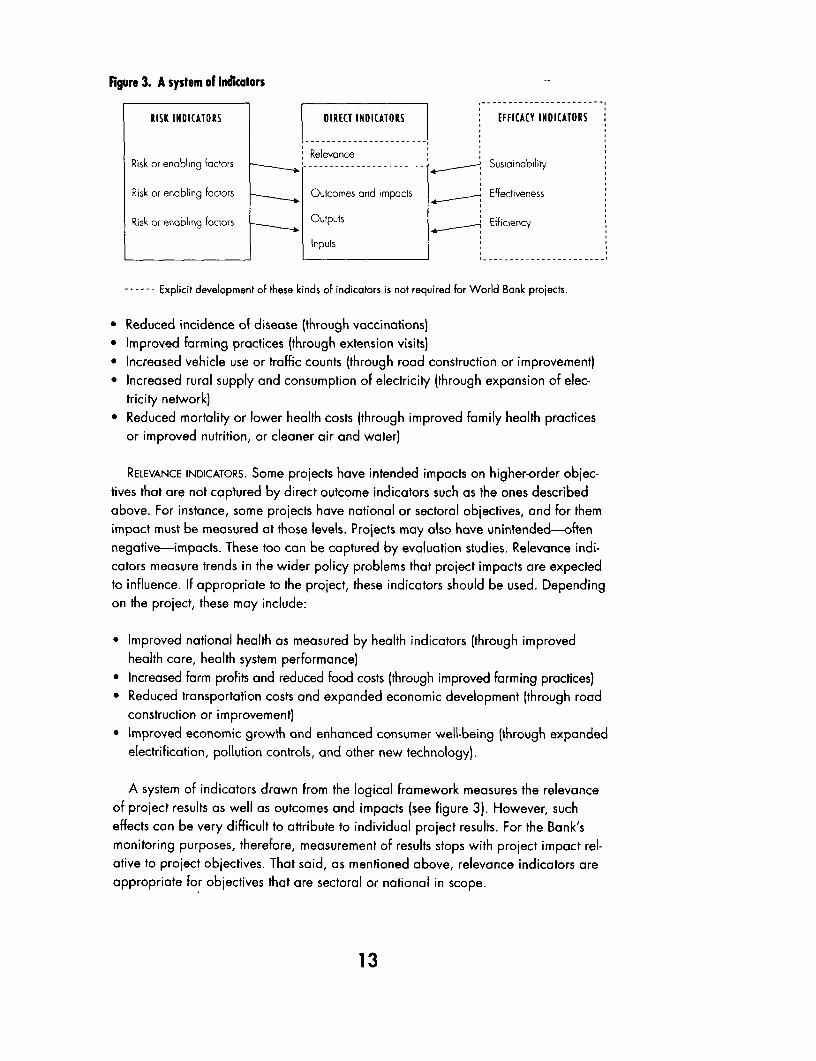
igure 3. A system of indicators
RISK INDICATORS DIRECT INDICATORS EFFICACY INDICATORS
RelevanceRisk or enabling factors -- - --------- Sustainability
Risk or enabling factors Outcomes and impacts Effectiveness
Risk or enabling factors Outputs Efficiency
Inputs
------ Explicit development of these kinds of indicators is not required for World Bank projects.
* Reduced incidence of disease (through vaccinations)* Improved farming practices (through extension visits)* Increased vehicle use or traffic counts (through road construction or improvement)* Increased rural supply and consumption of electricity (through expansion of elec-
tricity network)* Reduced mortality or lower health costs (through improved family health practices
or improved nutrition, or cleaner air and water)
RELEVANCE INDICATORS. Some projects have intended impacts on higher-order objec-tives that are not captured by direct outcome indicators such as the ones describedabove. For instance, some projects have national or sectoral objectives, and for themimpact must be measured at those levels. Projects may also have unintended-oftennegative-impacts. These too can be captured by evaluation studies. Relevance indi-cators measure trends in the wider policy problems that project impacts are expectedto influence. If appropriate to the project, these indicators should be used. Dependingon the project, these may include:
* Improved national health as measured by health indicators (through improvedhealth care, health system performance)
* Increased farm profits and reduced food costs (through improved farming practices)* Reduced transportation costs and expanded economic development (through road
construction or improvement)* Improved economic growth and enhanced consumer well-being (through expanded
electrification, pollution controls, and other new technology).
A system of indicators drawn from the logical framework measures the relevanceof project results as well as outcomes and impacts (see figure 3). However, sucheffects can be very difficult to attribute to individual project results. For the Bank'smonitoring purposes, therefore, measurement of results stops with project impact rel-ative to project objectives. That said, as mentioned above, relevance indicators areappropriate for objectives that are sectoral or national in scope.
13
Risk indicatorsRisk indicators measure the status of the exogenous factors identified as criticalthrough the risk and sensitivity analysis (risk and enabling factors) performed as partof a project's economic analysis. These are the factors that are determined to be themost likely to have a direct influence on the outcome of various aspects of the project(for example, economic prices for power or competitive salaries for project staff)-theassumptions that are made about conditions external to the project. A project's objec-tives can only be achieved if the logical means-end relationship of the projectelements is secure and the external risk factors are favorable.
Efficacy indicatorsEfficacy indicators show how well the results at one level of project implementationhave been translated into results at the next level: the efficiency of inputs, effective-ness of project outputs, and sustainability of project impact. They measure a pro-ject's efficacy in achieving its objectives, rather than its results. The logicalframework approach sometimes uses these measures in addition to direct indica-tors of results.
For the Bank's monitoring purposes, the measurement of results usually stops withimpact: Bank staff are not expected to measure sustainability, effectiveness, orefficiency as part of project supervision or Implementation Completion Reports butrather to stick to "direct results" indicators. However, efficacy indicators can be rele-vant indicators of results if efficiency (of an institution, for example) is a project objec-tive. Moreover, OED uses these measures in its evaluations of project performance. Itis for these reasons that these descriptions of indicators are included here.
EFFICIENCY INDICATORS. Efficiency indicators usually represent the ratio of inputsneeded per unit of output produced-for example, physical inputs, dollars, orlabor required per unit of output. Accountability indicators (which are the centralfocus of much project and financial auditing) can be considered a subset of effi-ciency indicators. They measure the extent to which resources are available forand appropriately applied to the activities for which they were targeted.
EFFECTIVENESS INDICATORS. Effectiveness indicators usually represent the ratio ofoutputs (or the resources used to produce the outputs) per unit of project outcomeor impact, or the degree to which outputs affect outcomes and impacts. Forexample:
* Number of vaccinations administered (or their cost) per unit decline in morbidityrate (illness prevented) or per unit decline in mortality rate
* Number of farmers visited per measured change in farm practices (number of farm-ers adopting new practices), or number of farmers adopting new practices per unitincrease in agricultural productivity
* Miles of read built per unit increase in vehicle usage, or new road usage per unitdecrease in traffic congestion.
14
SUSTAINABILITY INDICATORS. Sustainability indicators represent the persistence of pro-ject benefits over time, particularly after project funding ends. They could include, forexample:
* Disease incidence trends after external funding for a vaccination project ends* Persistence of changed farming practices after extension visits are completed* Maintenance and use of roads after highway construction ends* Persistence of institutions (programs, organizations, relationships, and so on) cre-
ated to deliver project benefits.
Information on performance as measured by impact, outcome, output, input, efficacy, Ways of measuringand risk indicators can be expressed and gathered in different ways. The choice of performanceindicator and means of collection depend on data availability, time constraints, andcost-benefit considerations as well as the relationships between the variables.
Direct measuresDirect measures correspond precisely to results at any performance level. For instance,quantities of goods delivered or counts of clients served are direct measures of output,instances of change in beneficiary behavior are a direct measure of project outcome,and a decrease in infant mortality is a direct measure of project impact. A given vari-able could possibly serve as an indicator of results at any of various levels (input, out-put, outcome, or impact) depending on the project objectives.
Indirect measuresIndirect measures correspond less precisely than direct measures to the performancesought. They are often used where direct measures are too difficult, inconvenient, orcostly to obtain. Indirect measures are based on a known relationship between theperformance variable and the measure chosen to express it-for example, usinglower farmgate prices as an indirect indicator of increased agricultural productivity,using declining freight or taxi tariffs as an indirect measure of decreasing traffic con-gestion, or using reduced numbers of consumer complaints as an indirect indicator ofimproved customer processing.
Early pointers: intermediate and leading indicatorsAt times information on likely project results is needed before final performance dataare available. At other times it is important to gauge whether a project is on trackeven though final results have not yet been achieved. In both cases intermediate orleading indicators can provide an early assessment of performance (figure 4).
Intermediate indicators measure intermediate results or intervening steps towardproject objectives. They usually measure changes associated with the ultimate impactsought but for which information can be obtained earlier. For example, fertilizer pur-chases could be used as a preliminary indicator of changed farming practices, orincreased nutritional knowledge as an indicator of improved eating practices. Twopoints must be kept in mind, however. First, intermediate indicators often represent
15
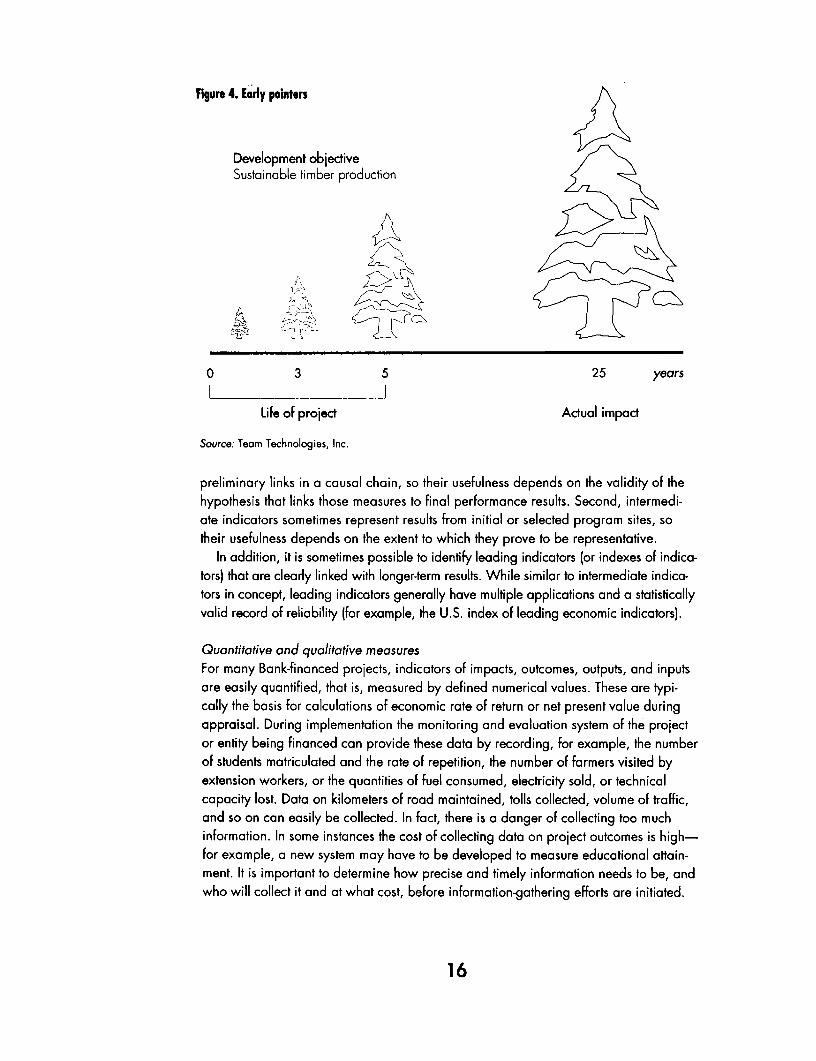
Figure 4. Early pointers
Development objectiveSustainable timber production
-4 CL~ ~ ~~C
0 3 5 25 years
I ILife of project Actual impact
Source: Team Technologies, Inc.
preliminary links in a causal chain, so their usefulness depends on the validity of thehypothesis that links those measures to final performance results. Second, intermedi-ate indicators sometimes represent results from initial or selected program sites, sotheir usefulness depends on the extent to which they prove to be representative.
In addition, it is sometimes possible to identify leading indicators (or indexes of indica-tors) that are clearly linked with longer-term results. While similar to intermediate indica-tors in concept, leading indicators generally have multiple applications and a statisticallyvalid record of reliability (for example, the U.S. index of leading economic indicators).
Quantitative and qualitative measuresFor many Bank-financed projects, indicators of impacts, outcomes, outputs, and inputsare easily quantified, that is, measured by defined numerical values. These are typi-cally the basis for calculations of economic rate of return or net present value duringappraisal. During implementation the monitoring and evaluation system of the projector entity being financed can provide these data by recording, for example, the numberof students matriculated and the rate of repetition, the number of farmers visited byextension workers, or the quantities of fuel consumed, electricity sold, or technicalcapacity lost. Data on kilometers of road maintained, tolls collected, volume of traffic,and so on can easily be collected. In fact, there is a danger of collecting too muchinformation. In some instances the cost of collecting data on project outcomes is high-for example, a new system may have to be developed to measure educational attain-ment. It is important to determine how precise and timely information needs to be, andwho will collect it and at what cost, before information-gathering efforts are initiated.
16
A project's outcomes and impacts may not manifest themselves as directly mea-surable numeric information, however. These projects' effects may be felt more interms of the attitudes of beneficiaries. For example, do parents now have moreinput into their children's education? Is teacher morale higher? A purely narrativedescription of these effects may be insufficient to measure results, however. It maybe necessary to devise ways of measuring outcomes and impacts in quantitativeterms, converting qualitative descriptions into quantitative information. This conver-sion can be achieved using survey techniques such as beneficiary assessments,rapid rural appraisals, or focus group interviews with structured questions. Theinformation gained through these techniques can be used to calculate nominal mea-sures, rank orderings of categories, and frequency counts. Ratio and interval scalescan also be used. The potential for quantifying information on project results shouldnot be underestimated.
Measurement scopeMeasurement scope refers to the use of sample populations. Performance indica-tors sometimes measure results directly for an entire target population (of individu-als or organizations) through administrative records, observations, or censussurveys. Often, however, the scope of measurement is limited to a sample of tar-gets or sites. This approach raises an additional technical issue: how reliably canoverall project performance be statistically inferred on the basis of this sample?Sometimes performance is measured in only one project setting, or in a very few,as case studies instead of statistical sampling. While case studies can provide use-ful information on how projects work (or why they do not work as expected) andhow they can be improved, care must be taken (even more than in the use of sam-ples) not to assurne that results from one site necessarily represent project perfor-mance overall. Accordingly, such case studies are usually conducted in the contextof speciol studies (see below) rather than as a replacement for broaderperformance data.
Special studiesSometimes a project's routine monitoring and evaluation data do not provide suffi-cient information. If an unexpected problem arises, additional in-depth analysisthrough special studies can guide the way toward solving it--- and avoiding it in thefuture. Special studies are formative evaluations of the fundamentals of problemsand their origins, and in that way differ from monitoring indicators, which are partof an early warning system. For instance, project managers might need to learnmore about the causal links among project outputs, outcomes, and impacts, espe-cially when indicators reveal that the broader purposes of a project are not beingachieved even though its planned outputs are being delivered. In this case some-thing clearly is wrong: the project logic may be faulty, assumptions about risk andenabling factors may be invalid, or some necessary input may be lacking. Specialstudies often provide important feedback for project redesign and higher-level pol-icy debates.
17
General principles for Three general principles should guide the selection of performance indicators: indica-selecting indicators tors must be meaningful and relevant, a reliable system for collecting the requisite
data must be developed in a timely fashion, and the borrower's institutional capacityfor using a monitoring and evaluation system-and its willingness to do so-must betaken into account. These general principles imply the following considerations:9
* Relevance. The indicators selected must be relevant to the basic sectoral develop-ment objectives of the project and, if possible, to overall country objectives.
* Selectivity. The indicators chosen for monitoring purposes should be few and mean-ingful. It is recommended that the Bank monitor no more than a dozen indicators,at least half of them impact indicators that explicitly measure project impactagainst each major development objective.
* Practicality of indicators, borrower ownership, and data collection. If performanceindicators are to meaningfully reflect a project's objectives, they should be selectedjointly by the borrower and the Bank during participatory project preparation, andthe data they measure should be useful to both project and country. The datarequired to compile the key indicators must be easily available; if collecting thedata will require a special effort, this need should be identified early in the projectcycle and included in the project design. Data collection efforts can then be pro-grammed directly into project implementation or contracted to institutions that dosurvey work at the sectoral, regional, or national level.
* Intermediate and leading indicators. In the absence of more definite impact indica-tors, early pointers of development impact may be used during project implementa-tion to indicate progress toward achieving project objectives. In many casesoutcome indicators together with indicators of risk factors can serve as suitableintermediate or leading indicators of impact.
• Quantitative and qualitative indicators. To the extent possible, performance indica-tors should allow for quantitative measurement of development impact. For someproject objectives (for instance, capacity building) it may be necessary to developqualitative indicators to measure success, which should still allow credible and dis-passionate monitoring. (For details on converting qualitative indicators to quantita-tive measures of the qualitative aspects being investigated, see pages 16--17.)
Problems with defining indicatorsA previous section described the different types of indicators used to measure levels ofperformance. However, it is sometimes difficult to distinguish between a project's out-puts and outcomes, for example, or between outcomes and impacts. When definingindicators, it is important to think of the typology of indicators as a continuum mirror-ing the logical means-end relationship of the project: inputs to various activities, whichyield outputs, all of which contribute to outcomes and impacts. A particular measure'slogical relation to the project's strategic objective will define the type of indicator thatit represents.
Consider an agricultural extension project. Two possible indicators are the numberof farmers trained and the number of farmers adopting the recommended techniques.
18

The second indicator is obviously an outcome, but what about the first? Training is anoutput of the project, but it is also an input into improving agricultural practices. Thisexample demonstrates the need to think of indicators in terms of a continuum, withinputs leading through activities to certain outputs that lead to desired outcomes andimpacts. It is not always easy to distinguish between outputs and outcomes orimpacts, whereas inputs are usually straightforward. Consider a project that hopes toimprove girl's employment prospects by improving their access to formal and voca-tional education. An output indicator would be the number of girls graduating fromsecondary and vocational schools, an outcome indicator would be the number of girlsemployed from project schools, and an impact indicator would be their earnings rela-tive to earlier levels or relative to average cohort earnings.
Problems with measuring impactImpact indicators are the most difficult to measure and collect, mainly because of lagsbetween project implementation and impact or, put another way, between the time ofimpact and the time it is feasible to collect data relating to impact. But the monitoringof project impact during implementation is one of the main motivations for using per-formance monitoring indicators. Using leading indicators and intermediate indicatorsas proxies for impact is a way to tackle the measurement problem. Beneficiary assess-ments, rapid rural appraisals, and focus group interviews are useful ways of collect-ing qualitative impact data. Before and after household and community surveys areexcellent tools for collecting comprehensive impact data, but the time and costrequired make them impractical for regular project monitoring. They are more oftenused during project identification, intermediate checkpoints (such as midterm reviews),implementation completion, and ex post evaluation.
When selecting indicators during project preparation and appraisal, the borrower Indicator benchmarks(with the Bank's assistance, as needed) should use baseline data and comparative and internationaldata from other programs to set targets for the indicators it will monitor-that is, the comparatorsminimum values that it expects to aim for. Some of the indicator menus issued by theBank's Central Vice Presidencies provide comparator values as an indication of whatis high and low for a given variable. Bank staff should consult the relevant sectordepartments of the Central Vice Presidencies on the selection of indicators for a pro-ject and should seek their advice on targets.
How do performance monitoring indicators affect the Bank's work?
Indicators play an integral role in the Bank's work, from economic and sector work,through the entire project cycle, to ex post evaluation.
Indicators of sector performance can be both derived from and used in the analysis Economic anddone as part of economic and sector work and used later to inform project develop- sector workment, project impact monitoring, and sector monitoring. Besides providing a frame-work for evaluating sector performance, sector-specific performance indicators can
19
help policymakers, task managers, and Bank staff rationalize a country assistanceand lending strategy, select project strategies, and create a framework for monitoringproject activities (see below). Sectoral indicators, obtained from sector work or fromgenerally available sector data, are especially useful during project identification andappraisal to clarify project objectives and later to assess impact.
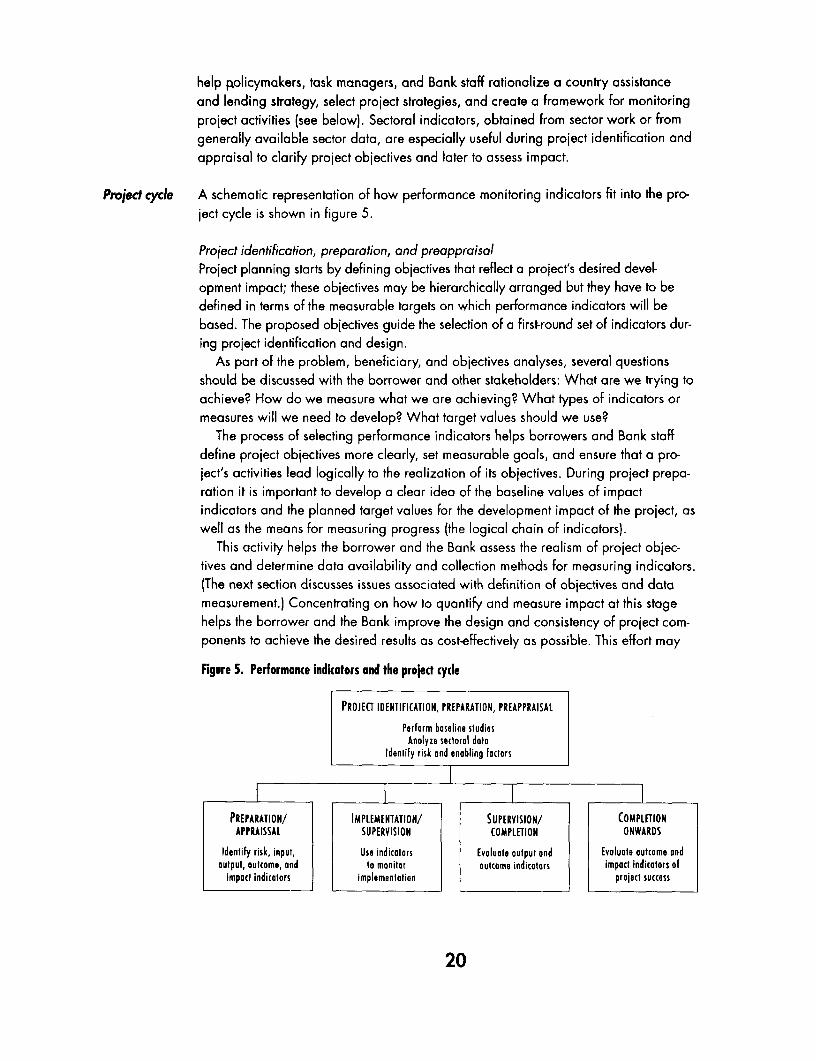
Project cycle A schematic representation of how performance monitoring indicators fit into the pro-ject cycle is shown in figure 5.
Project identification, preparation, and preappraisalProject planning starts by defining objectives that reflect a project's desired devel-opment impact; these objectives may be hierarchically arranged but they have to bedefined in terms of the measurable targets on which performance indicators will bebased. The proposed objectives guide the selection of a first-round set of indicators dur-ing project identification and design.
As part of the problem, beneficiary, and objectives analyses, several questionsshould be discussed with the borrower and other stakeholders: What are we trying toachieve? How do we measure what we are achieving? What types of indicators ormeasures will we need to develop? What target values should we use?
The process of selecting performance indicators helps borrowers and Bank staffdefine project objectives more clearly, set measurable goals, and ensure that a pro-ject's activities lead logically to the realization of its objectives. During project prepa-ration it is important to develop a clear idea of the baseline values of impactindicators and the planned target values for the development impact of the project, aswell as the means for measuring progress (the logical chain of indicators).
This activity helps the borrower and the Bank assess the realism of project objec-tives and determine data availability and collection methods for measuring indicators.(The next section discusses issues associated with definition of objectives and datameasurement.) Concentrating on how to quantify and measure impact at this stagehelps the borrower and the Bank improve the design and consistency of project com-ponents to achieve the desired results as cost-effectively as possible. This effort may
Figure 5. Performance indicators and the project cycle
PROJECT IDENTIFIEATION, PREPARATION, PREAPPRAISAL
Perform baseline studiesAnalyze sectoral doat
Idenlify risk and enabling factors
PREPARATION/ IMPLEMENTATION/ SUPERVISION/ COMPLETIONAPPRAISSAL SUPERVISION OOMPLETION ONWARDS
Identify risk, input, Use indicators Evaluate output and Evoluate outcome andoutput, outcome, and lo monitor outcome indicators impact indicators of
impact indicalors implemenitlion project success
20
also point to the need to develop monitoring capacity before implementing the-projector to build monitoring and evaluation capacity development into the project.
Appraisal and negotiationsAs project planning is finalized, project objectives are translated into specific projectcomponents. Indicators for measuring progress toward each objective and for monitor-ing the provision of project inputs and the state of risk and enabling factors identified inthe economic and risk sensitivity analyses are also finalized during appraisal.
The implementation plan developed by the borrower and appraised by the Bankmust include the performance monitoring indicators-inputs, outputs, outcome, andimpact indicators-for each aspect of project implementation. During appraisal the bor-rower and the Bank agree on no more than about a half-dozen of the most importantinput and output indicators and about the same number of outcome and impact indica-tors-key performance indicators that the Bank will monitor. These indicators-asagreed performance benchmarks, not covenanted targets-are set out in the projectappraisal documentation and in the Bank's legal agreement with the entity responsiblefor project implementation (see Bank Procedure 10.00, Annex B and relatedOperational Memorandums). In cases where target values are critical to the attainmentof project objectives, the borrower and the Bank may also want to make them acovenant of the loan agreement (see page 26).
Implementation and supervisionDuring project implementation the borrower and project implementation unit monitorthe indicators developed during project design, following the schedule of the imple-mentation plan. During regular supervision missions and the midterm review the Bankmonitors the key indicators defined and agreed with the borrower at appraisal. Theseindicators form the basis for the Bank's measures of implementation performance (IPratings) and impact (development objective, or DO ratings) on Form 590. If the indi-cators originally developed for the project become inappropriate because externalconditions change or project design is restructured, the Bank and borrower developnew indicators to reflect the changed circumstances.
EvaluationAfter implementation is completed, the achievement of project objectives is assessedusing measurable indicators-the outcome and impact indicators developed during pro-ject design-that compare the project's actual impact with its intended impact. The use ofindicators removes subjectivity from evaluations, giving them a more objective basis.
The logic of project design governs the logic of monitoring: the implementation unit Performancemonitors inputs and outputs in greater detail than does the borrowing government or indicators andthe Bank. Implementation managers are primarily concerned with the tactics of pro- project managementgram implementation, while borrowers and Bank staff are more concerned with thestrategic implications of project implementation and alternatives for realizing projectobjectives.
21
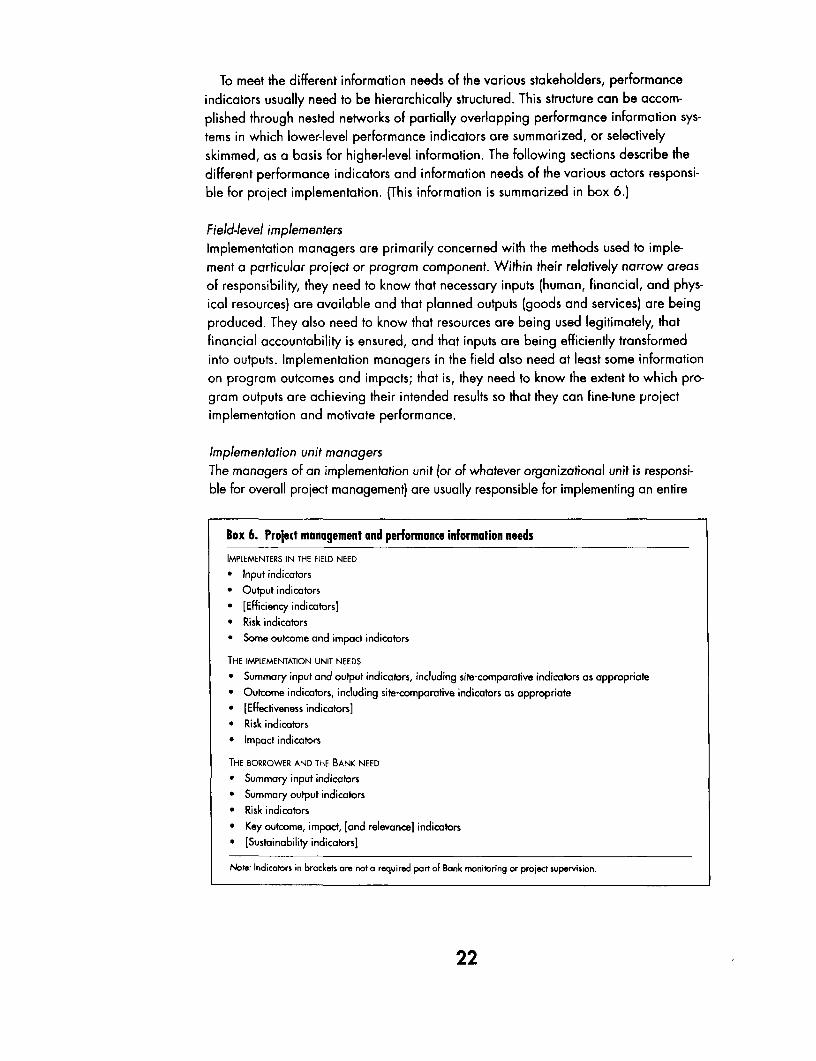
To meet the different information needs of the various stakeholders, performanceindicators usually need to be hierarchically structured. This structure can be accom-plished through nested networks of partially overlapping performance information sys-tems in which lower-level performance indicators are summarized, or selectivelyskimmed, as a basis for higher-level information. The following sections describe thedifferent performance indicators and information needs of the various actors responsi-ble for project implementation. (This information is summarized in box 6.)
Field-level implementersImplementation managers are primarily concerned with the methods used to imple-ment a particular project or program component. Within their relatively narrow areasof responsibility, they need to know that necessary inputs (human, financial, and phys-ical resources) are available and that planned outputs (goods and services) are beingproduced. They also need to know that resources are being used legitimately, thatfinancial accountability is ensured, and that inputs are being efficiently transformedinto outputs. Implementation managers in the field also need at least some informationon program outcomes and impacts; that is, they need to know the extent to which pro-gram outputs are achieving their intended results so that they can fine-tune projectimplementation and motivate performance.
Implementation unit managersThe managers of an implementation unit (or of whatever organizational unit is responsi-ble for overall project management) are usually responsible for implementing an entire
Box 6. Project management and performance information needsIMPLEMENTERS IN THE FIELD NEED
* Input indicatorsa Output indicators* [Efficiency indicators]e Risk indicators* Some outcome and impact indicators
THE IMPLEMENTATION UNIT NEEDS
* Summary input and output indicators, including site-comparative indicators as appropriate* Outcome indicators, including site-comparative indicators as appropriate* [Effectiveness indicators]* Risk indicatorsa Impact indicators
THE BORROWER AND THE BANK NEED
* Summary input indicators* Summary output indicatorsa Risk indicators* Key outcome, impact, [and relevance] indicatorse [Sustainability indicators]
Note: Indicators in brackets are not a required part of Bank monitoring or project supervision.
22
program or a major project component. This responsibility involves a range of activities,often across a number of sites, aimed at achieving some strategic objective. Becausethese managers have a primary responsibility for project implementation, they shouldplay a supporting role in defining strategic objectives, choosing among them or articulat-ing the underlying policies from which these objectives derive during project preparation.
Implementation unit managers are concerned with managing their program better,selecting and fine-tuning project activities to improve outcomes, and enhancing projectimpact. Thus they need summary information on project inputs and outputs, particularlycomparative information across sites, so that they can identify emerging problems anddirect managerial attention and resources to solving them. More important, they needcomparative information on project outcomes. Implementation managers also need atleast some information on project impact to validate the significance of their projectstrategy.
Borrower officials and Bank staffRepresentatives of the borrower and Bank staff are primarily concerned with strategicmanagement. They have participated in articulating the policy assumptions that underliethe project and the strategic objectives the project is intended to achieve. Moreover,they must continue to push these objectives in the context of a dynamic external environ-ment. Thus they need summary information on project inputs and outputs to be sure thatany emerging implementation or outcome problems are being identified and addressedat appropriate project management levels and to be able to answer questions about theproject. To manage strategically, however, borrowers and Bank staff most need compar-ative information on project outcomes and impacts and risk factors. When impact ismeasured in relation to the cost of project inputs, this information can also feed directlyinto a performance-based budget system. In addition, in the context of the Country Port-folio Performance Review or Country Assistance Strategy update, the borrower andBank managers need information on the national trends to which projects are expectedto contribute.
Some related issues
Several factors that are part of good practice in monitoring and evaluation are integralto the effective use of project performance data, in particular data collection and man-agement, the institutional arrangements for managing information, and the use of feed-back from monitoring and evaluation. In addition, users need to be aware of thedifference between loan covenants and indicators and potential pitfalls in the definitionof indicators. For performance monitoring indicators to work, a management structureand incentives that value results must be in place. Performance indicators are a tool: ontheir own they can do nothing, but in the proper environment they inspire action.
It is critical that managers-Bank, borrower, and project managers-regard perfor- Good practice inmance measurement as an integral part of their institution's mission and strategic monitoring andplan.10 Often they do not; instead, they see it as an adjunct to the plan, in the same evaluation
23
way that they may see evaluation as a requirement to be satisfied after the moreimportant work of project implementation is done."l To be effective monitoring andevaluation must be addressed during project design. Once project planners havecarefully defined the strategic objectives and selected logical indicators, their nextconsideration should be the requirements for data collection and management, institu-tional arrangements and capacity building, and the use of feedback from the data.
Data collection and managementThe nature of a variable determines the logical source of data about it. Indicators ofinputs and of some outputs of project activities are derived primarily from projectrecords; however, indicators of some outputs, outcomes, and impacts may require thatdata be collected using surveys or special studies, including those that use participa-tory methods. Where it is possible, it is almost always better to piggyback regular sur-veys onto existing nationally or internationally supported surveys (such as the LivingStandards Measurement Study) than to create a data collection facility. Special stud-ies may be managed by the project unit directly or subcontracted to a private entity.
Any proposal to collect data for an indicator requires a discussion of:
* Objectives of the study or survey* Sources of data* Choices and proposed method of collection* Likely reliability of the data.
Collection of some indicators, particularly outcome and impact indicators (such asmorbidity and mortality rates, educational achievement, or crop production) maydepend on the existence and quality of national census or survey systems. Beforechoosing such project indicators, the borrower and the Bank must confirm that thenecessary systems are in place and reliable and that the available data are statisti-cally valid for the population or area covered by the project. The complexity of statis-tics and the problems of attributing causality mean that in many cases it is better touse service delivery and beneficiary response as proxy measures than to attempt tomeasure impact directly.
Many output indicators are derived from records kept by the participating agen-cies, often at project field sites. For this reason, for purposes of project monitoringand evaluation design (including indicator selection), project planners should examinethe implementer's record-keeping and reporting procedures to assess its capacity togenerate data.
The essential points are that data should be collected and used close to the sourceand that data collection be cost-effective and reliable. It is important not to create aseparate measurement bureaucracy within a project structure. Having such a bureau-cratic home for data production is not usually cost-effective and presents the risk thatthose responsible for producing the data may have little contact with those responsi-ble for using it. Thus the data users do not fully understand what is behind the num-bers they are given to use, and the data collectors have little appreciation for the
24
issues that stakeholders and senior project managers face, for which performancedata would be useful. Just as performance measurement should be fully integratedwith project design, information generated should be integrated with the project'smanagement structure. As with any other project component, the benefits of using per-formance data must at least equal the cost of collecting them. A project can providethe best information at the least cost by using existing data, sampling techniques,rapid appraisal methods, and other creative collection methods.
A few other considerations about data collection should guide the design of indica-tors. Above all, the data should measure results, not just processes. The performancemeasured by the data should focus on what the project is accomplishing, especially interms of its impact on people. The point is not only to know what projects are doing,but to know whether they are doing any good.
Selectivity is desirable. Performance analysis should be limited to the few areasthat are directly relevant to the project's strategic objectives, as defined by theborrower and Bank.
Finally, performance measurement systems should use data that are not construedas threatening by those who are reporting it. Simply telling project managers-whether borrowers, Bank staff, or those working for them-to report data on their pro-jects without actively involving them in the performance measurement process, withoutexplaining how and by whom the data are going to be used, and without assuringthem that the data will not be used to judge them personally is likely to be viewed asthreatening. Relying on such a compliance mode of performance measurement islikely to backfire, not only minimizing manager ownership but also likely producingbureaucratic resistance and possibly data corruption.
Institutional arrangements and capacity buildingData collection arrangements have implications for the institutional arrangementsbetween the implementation unit, the borrower, and the Bank. The rationale for indica-tors demands that the indicator data be of value to the borrower, not just to the Bank.A project's overall monitoring and evaluation design should build on the reportingarrangements already used by the implementation unit and the borrower, while furtherdeveloping the technical skills they need to plan information needs, design data collec-tion, execute studies and surveys, analyze data, and report results in a format that isrelevant to project management. If necessary, the Bank can finance technicalassistance and equipment required to design and implement monitoring and evalua-tion systems and to meet training needs.
Feedback from monitoring and evaluation efforts and interpreting indicatorsCare should be taken to time data collection activities so that information will beavailable when it is needed, for example at the time of the Bank's portfolio ormidterm reviews. Projects for which operating performance standards are specified asan objective, or for which decentralized processes call for local capacity to plan andmanage work programs and budgets, will need special consideration of how indica-tor findings are used to inform decisions.
25
Project indicators are best interpreted through comparison. Ideally, impact is evalu-ated by comparing baseline data with project outcomes, to provide an idea of what theindicators would be if the project had not been carried out. But because such analysis issometimes not practical, analysis of indicators can use other kinds of comparisons:actual results relative to targets, before and after analysis, time series (more illustrativethan simple before and after comparisons), or comparisons of control groups.
Trends or fluctuations are common in the values that are used to measure outputs oroutcomes and impacts. If this is the case, time series or control groups should beused. Time series data capture trends or fluctuations, and control groups help verifyattribution of causality. For example, the control group chosen is critical for compar-ing the increase in average educational attainment or income among a project's ben-eficiaries with the increase in a nonproject area: the control group must be identicalto the project sample in all respects other than the presence of the project. Finally, anyinterpretation of indicators must consider the relationship between exogenous factorsand the indicators they may influence. This is one reason why the monitoring of riskfactors is so important.
Relation to loan Indicators are facts about project implementation results, not actions. Thus standardcovenants practice by the Bank and borrowers is to consider performance targets as indicative
and not legally binding. The understanding is that the agreed targets are used primarilyto gauge progress in project implementation and in realizing development objectives.However, in instances where attainment of certain indicators or targets is consideredessential to the attainment of a project's objectives (for example, in the case of certainfinancial indicators of a profit-making entity supported by a project), these indicators(target values) should be incorporated in the legal documents not only as performancebenchmarks but also as a loan covenant (see page 21).
Working at cross Projects sometimes lack well-defined objectives because the borrower and the Bankpurposes cannot agree on what a project's purposes are or should be. For example, it is some-
times unclear whether a project's ultimate objective is to transfer resources or to trulyalleviate poverty. A project's purposes and strategic objectives must be agreed onearly, and performance indicators provide the clearest guide for management actionwhen they logically reflect clear program priorities. In practice, however, programsmay encompass multiple and even conflicting objectives. While it is difficult to portraymultiple strategic purposes within a single objectives tree or logical framework, it maysometimes be possible to define parallel objectives trees reflecting these multiple pur-poses. The performance data could then be useful in making decisions that result intradeoffs among competing objectives, especially if such objectives can be prioritizedor weighted. 12
Another difficulty is that clearly defined objectives bring a measure of accountabil-ity that may make some officials uncomfortable. In some cases ambiguous projectobjectives may, in fact, be politically desirable. Delineating useful performance indi-cators may prove difficult if this is the case; and in the absence of willingness to com-mit to clearly defined objectives, the Bank should dissociate itself from the project.
26
In the end performance monitoring indicators and the feedback they provide are only Last wordas good as the underlying analysis (economic and financial analysis, economic andsector work, social and environmental assessment) supporting the project design, andthe data to be assessed over time. The logical framework approach to project formu-lation is only a structure for project design and evaluation, not the full extent of projectdesign or evaluation. None of the tools described in this handbook can replacesound economic, financial, social, environmental, and risk and sensitivity analysis orcomprehensive monitoring and evaluation. Together, the analysis, the logical frame-work, and the indicators form a system for continuous analysis and a holisticapproach to project design, monitoring, and evaluation.
Notes
1. Effective Implementation: Key to Development Impact, September 1992.2. An Overview of Monitoring and Evaluation in the World Bank, OED Report 13247, June 30, 1994,
and Monitoring and Evaluation Plans in Projects Approved in Fiscal Year 1995, OED draft report, October
6, 1995.3. The logical framework approach and indicator typology described in this section draw extensively
from material prepared by R. Moses Thompson, Team Technologies Inc.; Gerald M. Britan, 'Measuring
Program Performance for Federal Agencies: Issues and Options for Performance Indicators,' prepared forthe U.S. General Accounting Office, 1991; and 'Guidelines for Result-Based Planning, Management andMonitoring," preliminary version, from the Swedish International Development Agency, January 1995.
4. Several formal techniques for collaborative project planning and management are variations on theoverall logical framework concept described here: Logical frameworks, ZOPP, and TeamUP, for example.Appendix 1 of the World Bonk Porticipation Sourcebook (February 1996) describes ZOPP (objectives-oriented project planning), TeamUP, and other methods and tools that support participatory development,
and provides additional references.5. The relationship among project objectives may also involve aggregation across spoce, with results in
different project locations added to yield regional objectives and achievements. Hierarchically linked andspatially aggregated objectives often exist in tandem. For instance, a notional child health project whose
overall objective is to reduce child mortality may have a subobjective of reducing the incidence ofpreventable disease by educating and inoculating a certain number of individuals nationwide-that is, the
sum of the individuals reached by individual clinics throughout the notion.
6. See also Handbook on Economic Analysis of Investment Operations (Washington, D.C.:World Bank,1996), Chapter 10, "Risk and Sensitivity Analysis."
7. Various formal logical framework techniques use tools such as problem and objective trees, situation
and SWOT (strengths-weaknesses-opportunities-threats) analyses, and project planning matrixes to graphi-
cally represent the problem, beneficiary, and objectives analysis.
8. Even if a borrower is not explicitly aware of or does not follow the logical framework approach in
designing a project, the Bank can follow the approach to appraise the project.9. This discussion draws heavily on a report of the East Asia Working Group on Project Performance
Monitoring Indicators prepared for consideration by the East Asia Regional Management Group. The work-
ing group included staff from the East Asia Region, the Asia Technical Department, Human Resources Ser-
vices, OED, and Operations Policy.
10. For additional discussion, see Monitoring and Evaluotion Plans in Staff Appraisol Reports Issued in
Fiscal Year 1995: A Follow-up to OED's Report 'An Overview of Monitoring and Evaluation in the World
Bank,' OED Report 15222, December 29, 1995.
11. Thomas J. Cook, Jerry VanSant, Leslie Stewart, and Jamie Adrian, "Performance Measurement:
Lessons Learned for Development Management," World Development 23(8): 1303-15 (1995).
12. Briton, p. 20.
27
SECTORAL NOTES ON INDICATORS
To help Bank staff and borrowers select and use performance indicators, the Bank isdeveloping sectoral notes that discuss the use of indicators in relation to the majorobjectives or categories of problems normally addressed in Bank-financed projects.Each note includes menus of possible indicators.
What topics do the notes cover?
Eighteen sectoral notes will eventually be prepared. They will cover each sector inwhich the Bank works and areas of emphasis that cross economic and social sectors,such as environmental concerns, poverty reduction, public sector management, andtechnical assistance. Of the sector performance indicator notes planned, seventeenhave been issued:
Agriculture Poverty reductionEconomic adjustment PowerEducation Private sector developmentEnvironment Technical assistanceFinancial sector TelecommunicationsHousing TransportIndustry and mining Urban developmentOil and gas Water and wastewaterPopulation, health, and nutrition
The only note that remains to be issued is public sector management (expected inJune 1996). All of the notes except one are in their first edition, that is, they will berevised as the Bank and its clients gain experience with the use of indicators. (Theeducation note is in its second edition and is considered to be an example of bestpractice.) Further work on these notes will:
• Standardize them to make them more consistent with the methodologicalframework described earlier
* Incorporate more best practices and lessons learned* Incorporate international comparator data at the global and regional levels to facil-
itate benchmarking among countries, provinces, regions, and so on, to appreciatewhat is high or low in a given instance.
28
How were the notes developed?
As part of the Next Steps Action Plan, the Central Vice Presidencies, sector depart-ments, and Development Economics Vice Presidency were asked to develop sector-specific performance monitoring indicators. The Operations Policy Department (OPR)coordinated the efforts to develop the indicator notes, facilitating the exchange ofideas among sector departments and reviewing the product. After severaldepartments had produced drafts, OPR formed a quality review group comprisingsenior staff from the Regions, the Central Vice Presidencies, and OED. The groupreviewed all of the notes and developed a framework for consistency in approach.
From these initial efforts, the Bank developed the framework for performance indi-cators that has been applied in most of these notes. Most of the sector notes:
* Follow a typology of indicators based on a logical framework approach to projectdesign (indicators of project inputs, outputs, outcomes, impacts, risk and enablingfactors, efficiency, effectiveness, and relevance); and
• Provide an executive summary, a menu of recommended key indicators, and realexamples of indicators used in Bank-financed projects.
How are indicators selected from the notes?
The notes are reference materials to specific sectors and to overarching concernssuch as poverty reduction, macroeconomic adjustment, and environmental issues.They are meant to guide task managers and borrowers in applying performancemonitoring indicators. They are not, however, intended to replace the judgment orknowledge of task managers or borrowers. The notes provide menus of indicatorsthat are neither exhaustive nor mandatory-indicators are project-specific and mustbe customized by the borrower and task manager to project, sector, and countrycircumstances. Since every project has its own unique objectives, task managersand borrowers must develop indicators that correspond to these objectives, and notrestrict themselves to the menus provided in the notes. Conversely, care should betaken not to "order the entire menu;" rather, it should be treated as an indicative listfrom which to choose the most appropriate selections.
Where are the notes available?
The notes are issued by the originating Central Vice Presidencies to all Senior Opera-tions Advisers, directors, project advisers, and sector division chiefs. Staff membersshould have received copies of the notes pertaining to the sectors that their departmentcovers or have been notified that the notes are available. Additional copies are avail-able from the originating departments. The notes will also be available in electronicform through the Bank's Enterprise Network (contact the relevant task manager listedbelow to confirm a note's electronic availability). The departments, task monagers forthe notes, and persons to contact for a copy of the note are
29
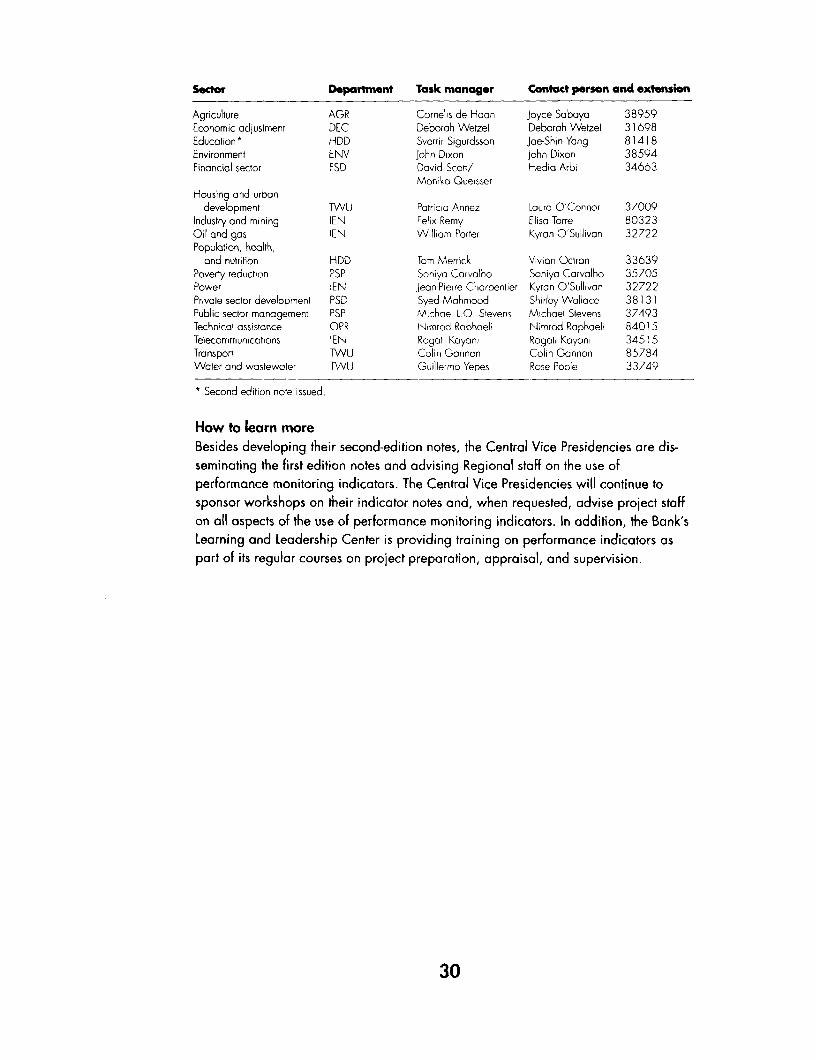
Sector Department Task manager Contact person and extension
Agriculture AGR Cornelis de Haan Joyce Saboya 38959Economic adjustment DEC Deborah Wetzel Deborah Wetzel 31698Education* HDD Sverrir Sigurdsson Joe-Shin Yang 81418Environment ENV John Dixon John Dixon 38594Financial sector FSD David Scott/ Hedia Arbi 34663
Monika QueisserHousing ond urban
development TWVU Patricia Annez Laura O'Connor 37009Industry and mining IEN Felix Remy Elisa Torre 80323Oil and gas IEN VVilliam Porter Kyran O'Sullivan 32722Population, health,
and nutrition HDD Tom Merrick Vivion Octran 33639Poverty reduction PSP Soniyo Carvalho Soniya Carvalho 35705Power IEN Jean-Pierre Charpenlier Kyran O'Sullivan 32722Private sector development PSD Syed Mahmood Shirley Wallace 38 1 3 1Public sector management PSP Michael L.O Steven.s Michael Stevens 37493Technical assistance OPR Nimrod Raphoeli Nimrod Raphaeli 84015Telecommunications IEN Rogati Koyani Rogati Koyani 34515Transport TWU Colin Gannon Colin Gannon 85784Water and wastewater TWU Guillermo Yepes Rose Poole 33749
* Second edition note issued.
How to learn moreBesides developing their second-edition notes, the Central Vice Presidencies are dis-seminating the first edition notes and advising Regional staff on the use ofperformance monitoring indicators. The Central Vice Presidencies will continue tosponsor workshops on their indicator notes and, when requested, advise project staffon all aspects of the use of performance monitoring indicators. In addition, the Bank'sLearning and Leadership Center is providing training on performance indicators aspart of its regular courses on project preparation, appraisal, and supervision.
30
EXAMPLES OF INDICATORS
The following examples of key performance indicators were developed for severalBank-financed projects. These projects represent current best practice in the use ofperformance monitoring indicators; most were highlighted in OED's fiscal 1995follow-up review of monitoring and evaluation (Monitoring and Evaluation Plans inStaff Appraisal Reports Issued in Fiscal Year 95, Report 15222). For each project, amatrix presents the project's objectives, with indicators of inputs, outputs, risk factors,outcomes, and impacts. The matrixes do not list all the detailed indicators listed in theborrower's Project Implementation Plan; they only show the key indicators that theBank will monitor as the basis for project supervision and evaluation.
These matrixes were devised by the project's task managers with OPR's guidance.The information set out in these matrixes was also given in the Staff Appraisal Reportfor each of the projects, although not in this format. In the future the most importantproject outcome and impact indicators, such as those presented in these matrixes,should be listed in every project appraisal document and monitored using Form 590.
31
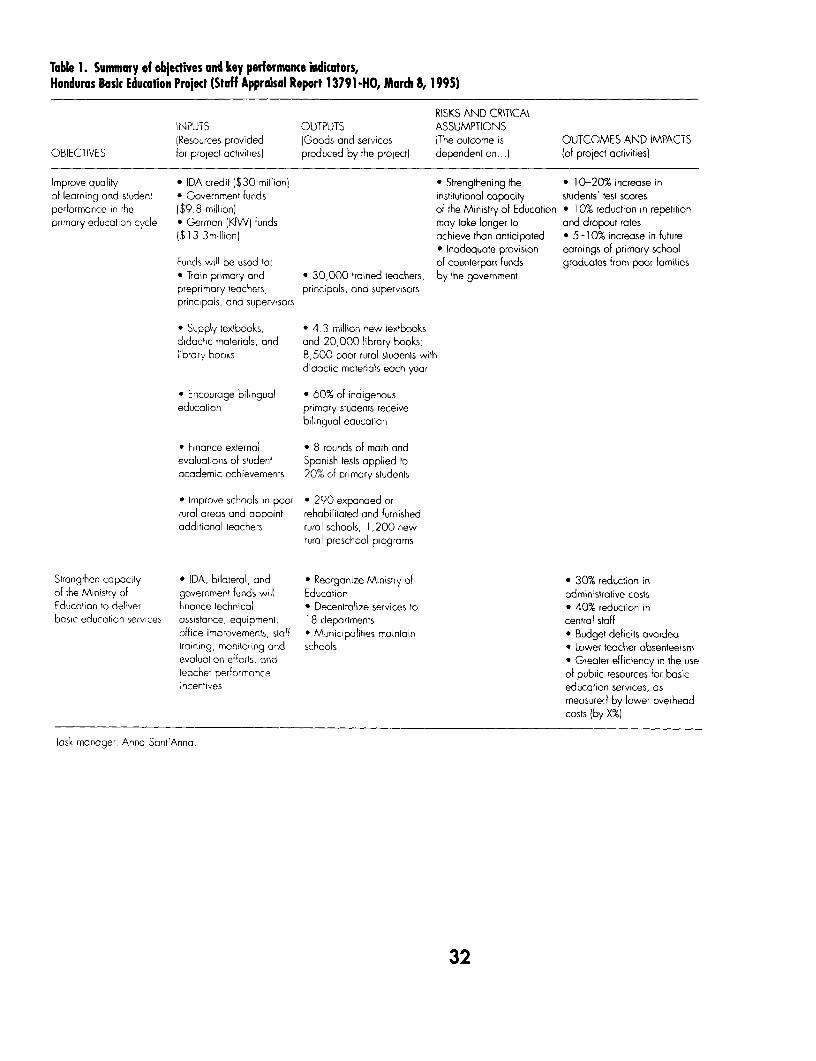
Table 1. Summary of objectives and key performance indicators,Honduras Basic Education Project (Staff Appraisal Report 1 3791 -HO, March 8, 1 995)
RISKS AND CRITICALINPUTS OUTPUTS ASSUMPTIONS(Resources provided (Goods and services (The outcome is OUTCOMES AND IMPACTS
OBJECIIVES for project activities) produced by the project) dependent on ...) (of project activities)
Improve quality * IDA credit ($30 million) * Strengthening the * 10-20% increase inof lecirning and student * Government funds institutional capacity students' test scoresperformance in the ($9.8 million) of the Ministry of Education * I 0% reduction in repetitionprimary education cycle * German lKfW) funds may take longer to and dropout rates
($1 3 3million) achieve than anticipated * 5-10% increase in futureInadequate provision earnings of primary school
Funds will be uised to~ of counterpart funds graduates from poor families* Train primary and *30,000 trained teachers, by the governmentpreprimary teachers, principals, and supervisorsprincipals, and supervisors
* Supply textbooks., 4.3 million new textbooksdidactic materials, and and 20,000 library books,~ibrory books 8,500 poor rural students with
didactic materials each year
*Encourage bilingual - 60% of indigenouseducation primary students receive
bilingual education
* Finance external - 8 rounds of math aindevaluations of student Spani-sh te5st applied toacademic achievements 20% of primary students
* Improve schools ini poor * 290 expanded orrural areas and appoint rehabilitated and furnishedadditionail teachers rural schools; 1, 200 new
rural preschool programs
Strengthen capacity *IDA, bilateral, and * Reorganize Ministry of *30% reduction inof the Ministry of government funds will Education administrative costsEducation to deliver finance technical * Decentralize services to * 40% reduction inbasic education services assistance, equipment, 1 8 departments central staff
office improvements5, staff * Municipalities maintain * Budget deficits avoidedtraining, monitoring and schools * Lower teacher absenteeismevaluation efforts, and * Greater efficiency in the useteacher performance of public resources for basicincentives educaition services, as
mneasured by lower overheadcosts (by X%)
Task manager. Anna Sant'Anna.
32
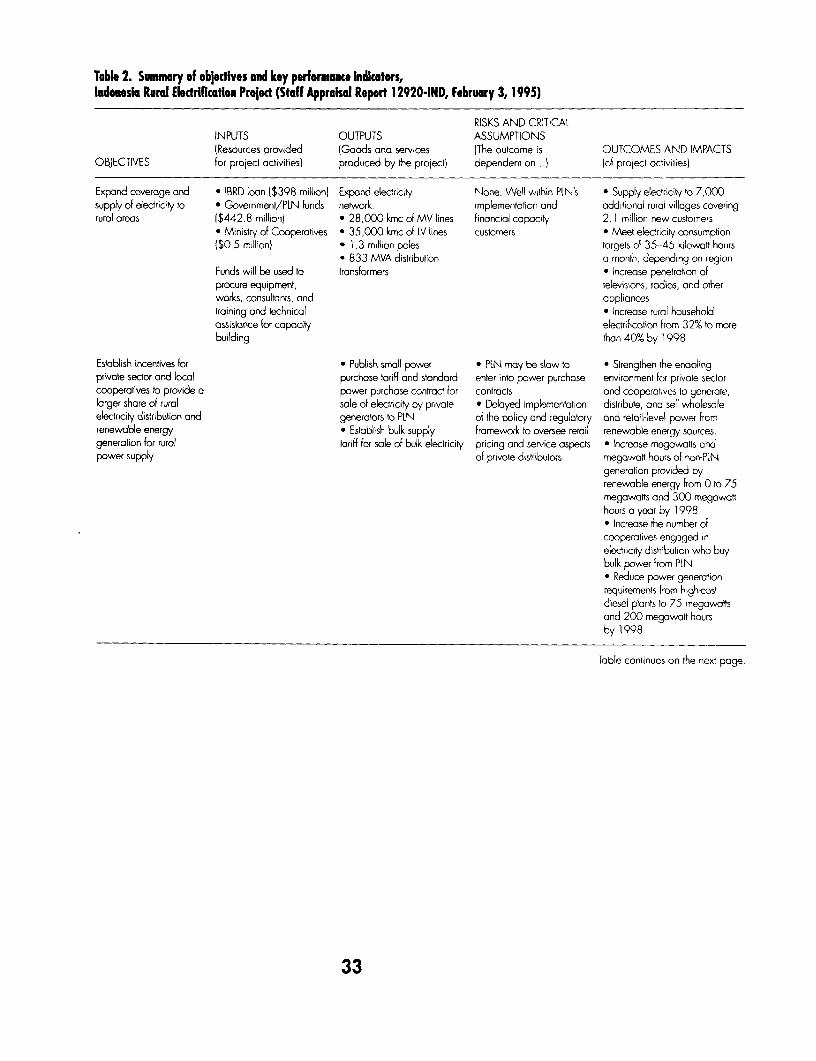
Table 2. Summary of objectives and key performoance Indicotors,Indonesia Rural Electrification Prolect (Staff Appraisal Report 12920-IND, February 3, 1995)
RISKS AND CRITICALINPUTS OUTPUTS ASSUMPTIONS(Resources provided (Goods and services (The outcome is OUTCOMES AND IMPACTS
OBJECTIVES for project activities) produced by the prolect) dependent on. .. iof project octivities)
Expand coverage and * IBRD loan ($398 miliion) Expand electricity None. Well within PLN's * Supply electricity to 7,000supply of electricity to * Government/PLN funds network implementation and additional rural villages coveringrural areas ($442.8 million) * 28,000 kmc of MV lines financial capacity 2. 1 million new customers
* Ministry of Cooperotives * 35,000 kmc of LV lines customers * Meet electricity consumption($0.5 million) * 1.3 million poles targets of 35-45 kilowott hours
* 833 MVA distribution a month, depending on regionFunds will be used to transformers * Increase penetration ofprocure equipment, televisions, radios, and otherworks, consultants, and appliancestraining and technical * Increase rural householdassistance for capacity electrification from 32% to morebuilding than 40% by 1998
Establish incentives for * Publish small power * PLN may be slow to * Strengthen the enablingprivate sector and local purchase tariff and stondard enter into power purchase environment for private sectorcooperatives to provide a power purchase contract for contracts and cooperatives to generate,larger share of rural sale of electricity by private * Delayed implementation distribute, and sell wholesaleelectricity distribution and generators to PLN of the policy and regulotory and retail-level power fromrenewable energy * Esiablish bulk supply framework to oversee retail renewable energy sources.generation for rural tariff for sale of bulk electricity pricing and service aspects * Increase megawaits andpower supply of private distributors megawatt hours of non-PLN
generation provided byrenewable energy from 0 to 75megawatts and 300 megawatthours a year by 1998e Increase the number ofcooperatives engaged inelectricity distribution who buybulk power from PLN* Reduce power generationrequirements from high-costdiesel plants to 75 megawattsand 200 megawatt hoursby 1998
Table continues on the next page.
33
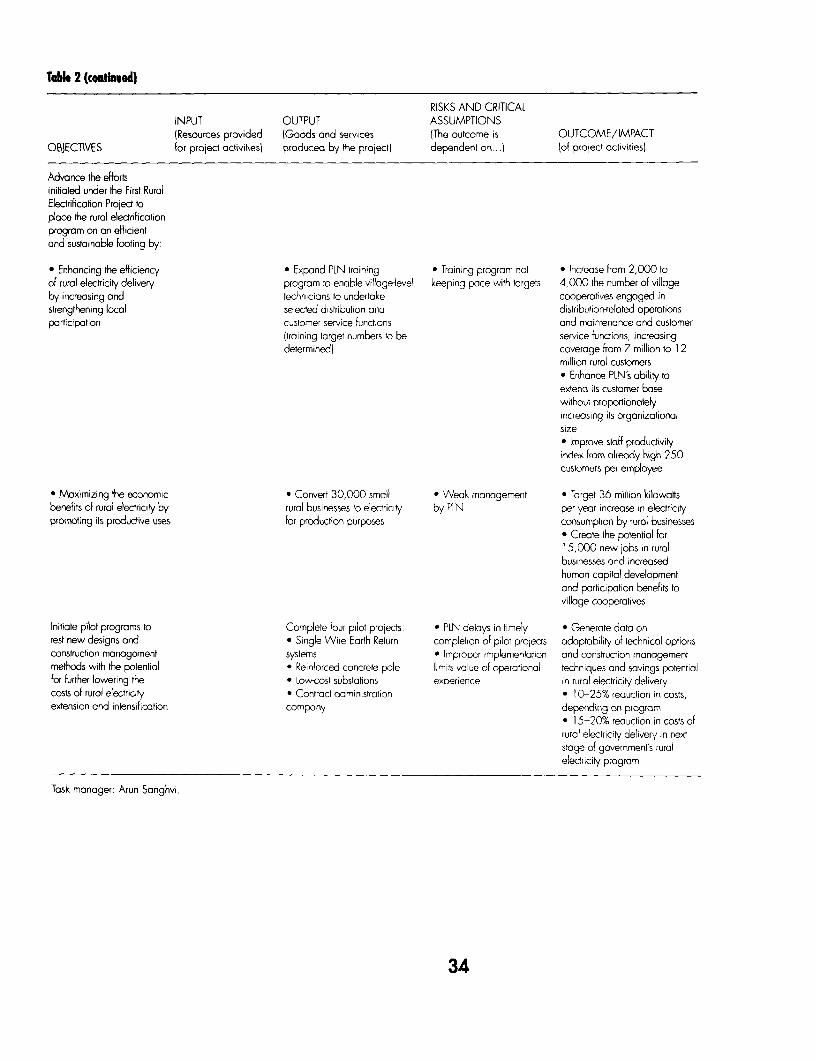
Table 2 (continued)
RISKS AND CRITICALINPUT OUTPUT ASSUMPTIONS(Resources provided (Goods and services (The outcome is OUTCOME/IMPACT
OBJECTIVES for project activitiesl produced by the projectl dependent on. .. (of project activities)
Advance the effortsinitiated under the First RuralElectrification Project toplace the rural electrificationprogram on an efficientand sustainable footing by
* Enhancing the efficiency * Expand PLN raining * Training program not * Increase from 2,000 toof rural electricity delivery program to enable village-level keeping pace with targets 4,000 the number of villageby increasing and technicians to undertake cooperatives engaged instrengthening local selected distribution and distribution-related operationsparticipation customer service functions and maintenance and customer
Itroining target numbers to be service functions, increasingdetermined) coverage from 7 million to 1 2
million rural customers* Enhance PLN's ability toextend its customer basewithout proportionatelyincreasing its organizationalsizea Improve staff productivityindex from already high 250customers per employee
Maximizing the economic * Convert 30,000 small * Week management * Target 36 million kilowattsbenefits of rural electricity by rural businesses to electricity by PIN per year increase in electricitypromoting its productive uses for production purposes consumption by rurol businesses
* Create the potential for15,000 new jobs in ruralbusinesses and increasedhuman capital developmeniand participation benefits tovillage cooperatives
Initiate pilot programs to Complete four pilot projects: * PLN delays in timely * Generate data ontest new designs and * Single Wire Earth Return completion of pilot projects adaptability of lechnical optionsconstruction management systems * Improper implementation and construction managementmethods with the potenlial * Reinforced concrete pole limits value of operational techniques and savings potentiolfor further lowering the * Low-cost substations experience in rural electricity deliverycosts of rural electricity * Contract administration * 10-25% reduction in costs,extension and intensifioation company depending on program
* 15-20% reduction in costs ofrural electricity delivery in nextstage of government's ruralelectricity program
Task manager: Arun Sanghvi.
34
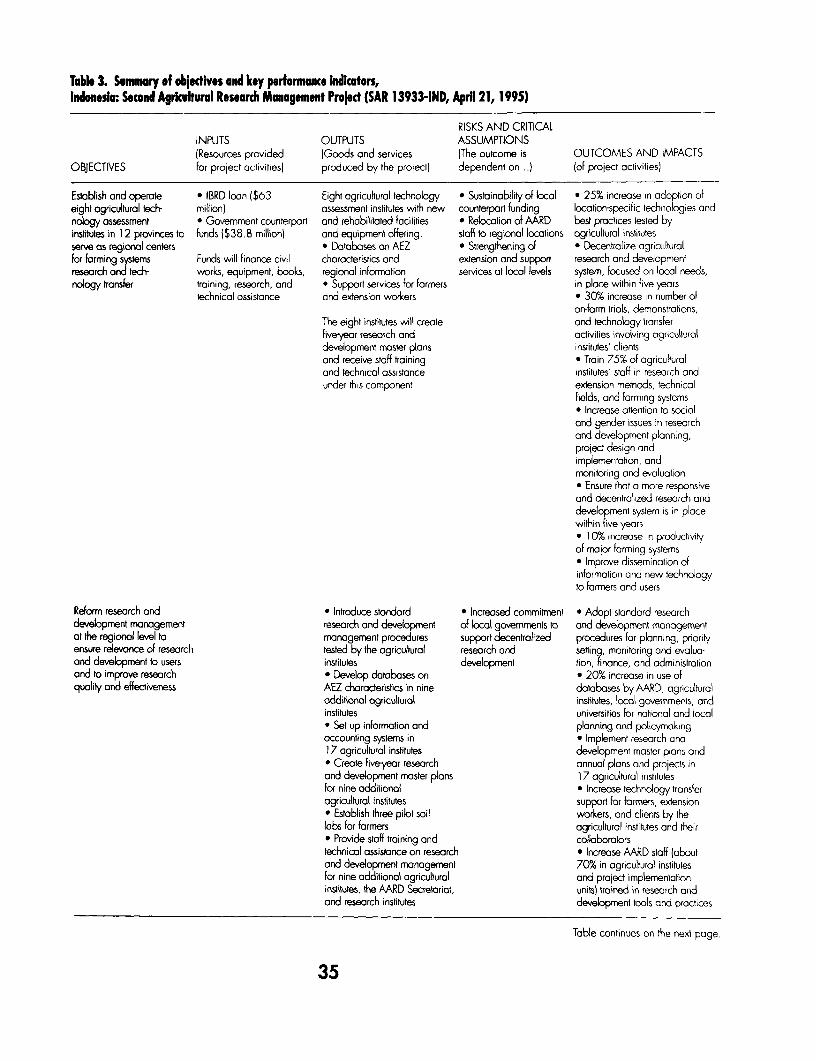
Table 3. Summary of objedtives and key performance Indicators,Indonesia: Second Agrickutural Research Management Proled (SAR 13933-IND, April 21, 1995)
RISKS AND CRITICALINPUTS OUTPUTS ASSUMPTIONS(Resources provided (Goods and services (The outcome is OUTCOMES AND IMPACTS
OBJECTIVES For project activities) produced by the project) dependent on .) (of project activities)
Establish ond operate * IBRD loan ($63 Eight agricultural technology * Sustainability of local * 25% increase in adoption ofeight agricultural tech- million) assessment institutes with new counterpart funding locahon-specific techinologies andnology assessment * Government counterpart and rehabilitated facilities * Relocation of MRD best practices tested byinstitutes in 12 provinces to funds J$38.8 million) and equipment offering. staff to regional locations agricultural institutesserve as regional centers * Dotabases on AEZ * Strengthening of * Decentralize agriculturalfor farming systems Funds will finance civil characteristics and extension and support research and developmentresearch and tech- works, equipment, books, regional information services at local levels system, focused on local needs,nology transfer training, research, and * Support services for farmers in place within five years
technical assistance and extension workers * 30% increase in number ofon-farm triols, demonstrations,
The eight institutes will create and technology tronsferfive year research and activities involving agriculturaldevelopment master plans institutes' clientsand receive staff training * Train 75% of agriculturaland technical assistance institutes' staff in research andunder this component extension methods, technical
fields, and farming systems* Increase arlention to socialand gender issues in researchand development planning,project design andimplementation, andmonitoring and evaluationa Ensure that o more responsiveand decentralized research anddevelopment system is in placewithin five yearse 10% increase in productivityof major farming systems* Improve dissemination ofinformation and new technologyto farmers and users
Reform research and * Introduce standard * Increased commitment * Adopt slandard researchdevelopment management research and development of local governments to and development managementat the regional level to management procedures support decentralized procedures for planning, priorityensure relevance of research tested by the agricultural research and seiting, monitoring and evalua-and development to users institutes development tion, finance, and administrolionand to improve research * Develop databases on * 20% increose in use ofquality and effectrveness AEZ characteristics in nine databases by MRD, agricultural
additional agricultural institutes, local governments, andinstitutes universities for national and local* Set up information and planning and policymakingaccounting systems in * Implement research and1 7 agricultural institutes development master plans and* Create fiveyear research annual plans and projects inand development master plans 1 7 agricultural institutesfor nine odditional * Increase technology transferagricultural institutes support for farmers, extension* Establish three pilot soil workers, and clients by thelabs for farmers agricultural institutes and their* Provide staff training and colfboratorstechnical assistance on research * Increose AARD staff l(boutand development management 70% in agricultural institutesfor nine additional agricultural and project implementationinstitutes, the MRD Secretariat, units) trained in research andand reseorch institutes development tools and practices
Table continues on the next page.
35
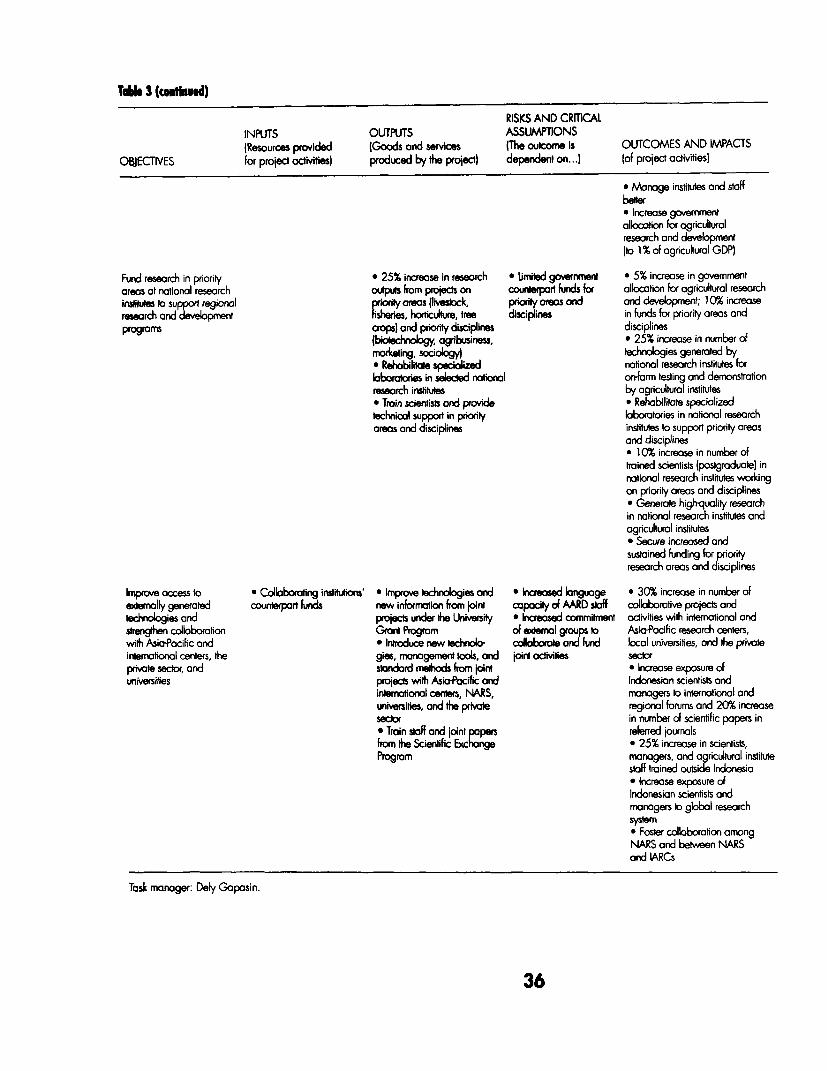
T . 3 (citued)
RISKS AND CRMCALINPUTS OUTPUTS ASSUM?P1ONS(Resources provided (Goods and services (The outcome is OUTCOMES AND MPACTS
OBJECTIVES for project octvities) produced by the project) dependen on ... (of project activities)
* Manage insituts and staffbeher* Increase gavernmentallocation for agriculturalresearch and development(to 1 % of agricukural GDP)
Fund research in priority * 25% increase in reseorch * L.inted government * 5% increase in governmrentareas at national reseorch outputs from projects on courhrpart funds for allocation for agricultural researchinstitutes to support regional pnority areas (livestck, priority areas and and development; 10% increaseresech and development hsheries horticuiture, tree disciplines in funds for priority areos andprograms craops) and priority disciplines disciplines
fbioiechnolpg, agribusiness, * 25% increase in number ofmorketing, sociobogy) technologies generated by* Rehobilitate speciolized national research institutes forloboratories in selected national on-farm testing and demonstrationresearch insritutes by agncultural institutes* Train scientisb ond provide * Rehabilitate specializedtachnicol support in priority loboratories in national researchareas and discipines institutes to support priority areas
and disciplines* 10% increase in number oftrained scientists (posigroduate) innotional research institutes vwvrkingon priority areas and disciplines* Generate high-quolity researchin nraional research insfHtutes andagriculural institutes* Secure increased andsustained funding for priorityresearch areas and disciplines
Improve access to * Colloborating inslituions' * Improve technologies and * Iaeased language * 30% increase in number ofeenmaly generated counterpart funds new information from joinl capacity of AARD staff colobortive projects andtechnobgies and projects under the University * Icreased commiment activihes vith intemational andstrengthen collaboration Grant Program of ensemnl groups to Asio-Pocific research oenterswith Asia-Pocific and * Inroduce nevw echnolo- colaborate and fund local universities, and the privoteinternational centers, the gies, monagement tools, and joird octivilies sectorprivate sector; and stondard methods from joirt * increase exposure ofuniversihes projects vwith Asia-Pacific and Indonesian scientists ond
international centers, NARS, monagers to international anduniversities, and the privte regional forums and 20% increasesectr in number of scientific papers in* Trin staf and joint popers referred journalsfrom the Scientific Echange * 25% increase in scientists,Program managers, and agriculturol institute
staff trained outside Indonesia* Increase exposure ofIndonesian scientists andmanagers to global researchsystem* Foster collaboration amongNARS and between NARSand IARCs
Task manager: Defy Gaposin.
36
Table 4. Summary of obectives ii key perfonrmce hWktos,Uthuonla Slaulal Envlunnt Proedt (Stuff Appraisal Reort 1498l-IT, Nvovmbw 9, 1995)
RISKS AND CRITICAlINPUTS OUTPUTS ASSUMPTIONS(Resources provided (Goods and services [The outcome is OUTCOMES AND MPACTS
OBJECTIVES for project activities) produced by the project) dependent on .. I (of project activitiesl
Reduce pollutant * IBRD loan ($6.2 million) * Rehabilitate sewer network * Problems with securing * Increase treated waste-loads from the Siouliai * Bilateral gronts ($8.54 * Rehabilitate wastewater locol funding water from 40,000 cubicarea into the Upper million) treatment plant meters a day to 50,000Lielupe River Basin * Government funds * Construct new wastewater cubic meters a day
1$7.6 millioni treatment plant * Reduce nitrogen,M Municipality funds * Implement pollution control phosphorus, and other
($0.4 million) measures at pig farms pollution at the trectment* Implement pollution control plants' outlets, at the mouth
Funds will be used to measures for agricultural runoff of the Lielupe River, and atprocure equipment, works, the wastewater treatmentconsultants, and technical plant, from X tons a year toassistance itrainingl Y tons o year
* Reduce pollution levels atselected points downstreamfrom agricultural pilot sitesand pig farms9 Lower (by XX} health carecosts* Increase (by X%) tourismrevenues* Increose internationalpolitical goodwill
Improve quality, * Rehabilitate equipment * Ability to adjust tariffs * Improve drinking waterreliability, and cost * Provide new equipment * Revenue collection quality (lower iron contentefficiency of water * Restructure water utility difficulties and softer potable water)supply and wastewater * Troin people * Political difficulties * Ensure fewer breaks andservices in Siauliai with organizational trouble calls on the water
restructuring (staff supply and distribution systemreduction) and the wastewater
collection and conveyancesystem* Provide an adequateoperating ratio (less than85%) and odequate workingratio (less than 70%X forthe water utility
Improve local and * Provide monitoring and * Potential coordination * Ensure regular andregional environmental laboratory equipment difficulties between accurale monitoring of waterquality monitoring and * Provide other equipment concerned parties qualityenforcement system in * Train people * Ensure regular enforcementthe Upper Lielupe River * Develop management plans visits at pollution sourcesBasin to reduce industrial pollution
and sludge* Develop emergencymanagement plan
Task manager: Sari Soderstrom.
37
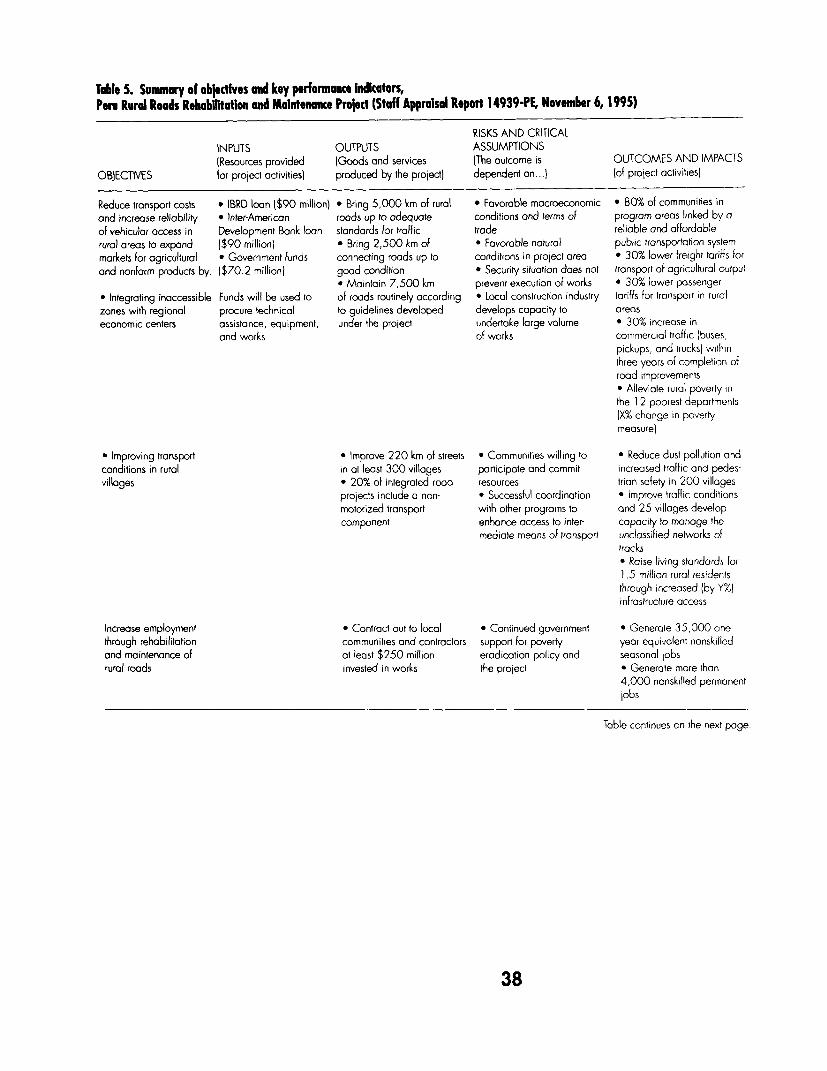
Table 5. Summary of obledives and key performance indicators,Pon Rural Roads Rehabilitation and Maintenacne Project (Staff Appraisal Report 1 4939-PE, November 6, 1995)
RISKS AND CRITICALINPUTS OUTPUTS ASSUMPTIONS(Resources provided (Goods and services (The outcome is OUTCOMES AND IMPACTS
OBJECTIVES for project activities) produced by the project) dependent on ... (of project octivities(
Reduce tronsport costs * IBRD loan ($90 million) * Bring 5,000 km of rural * Favorable macroeconomic * 80% of communities inond increase reliability ' Inter-American roads up to adequate conditions and terms of program areas linked by aof vehicular access in Development Bank loan standards for traffic trade reliable and affordablerural areas to expand ($90 million) * Bring 2,500 km of * Favoroble natural public transportation systemmarkets for ogricultural * Government funds connecting roads up to conditions in project area * 30% lower freight toriffs forand nonfarm products by: ($70.2 million) good condition * Security situation does not transport of agricultural output
* Maintain 7,500 km prevent execution of works * 30% lower possenger* Integrating inaccessible Funds will be used to of roads routinely according * Local construction industry tariffs for transport in ruralzones with regional procure technical to guidelines developed develops capacity to areaseconomic centers assistance, equipment, under the project undertake large volume * 30% increase in
and works of works commercial traffic (buses,pickups, and trucks) withinthree years of completion ofroad improvements* Alleviate rural poverty inthe 1 2 poorest departments(X% change in povertymeasure)
* Improving transport * Improve 220 km of streets * Communities willing to * Reduce dust pollution andconditions in rural in at least 300 villages participote and commit increased traffic and pedes-villages * 20% of iniegrated rood resources trian safety in 200 villoges
projects include a non- * Successful coordination * Improve traffic conditionsmotorized transport with other programs to and 25 villages developcomponent enhance access to inter- capacity to manage the
mediate means of transport unclassified neKworks oftrocks* Raise living standards for.5 million rural residents
through increased Iby Y%)infrastructure access
Increase employment * Contract out to local * Continued government * Generate 35,000 one-through rehabilitation communities and contractors support for poverty year equivalent nonskilledand maintenance of at least $250 million eradication policy and seosonal jobsrural roads invested in works the project * Generate more than
4,000 nonskilled permanentjobs
Table continues on the next page.
38
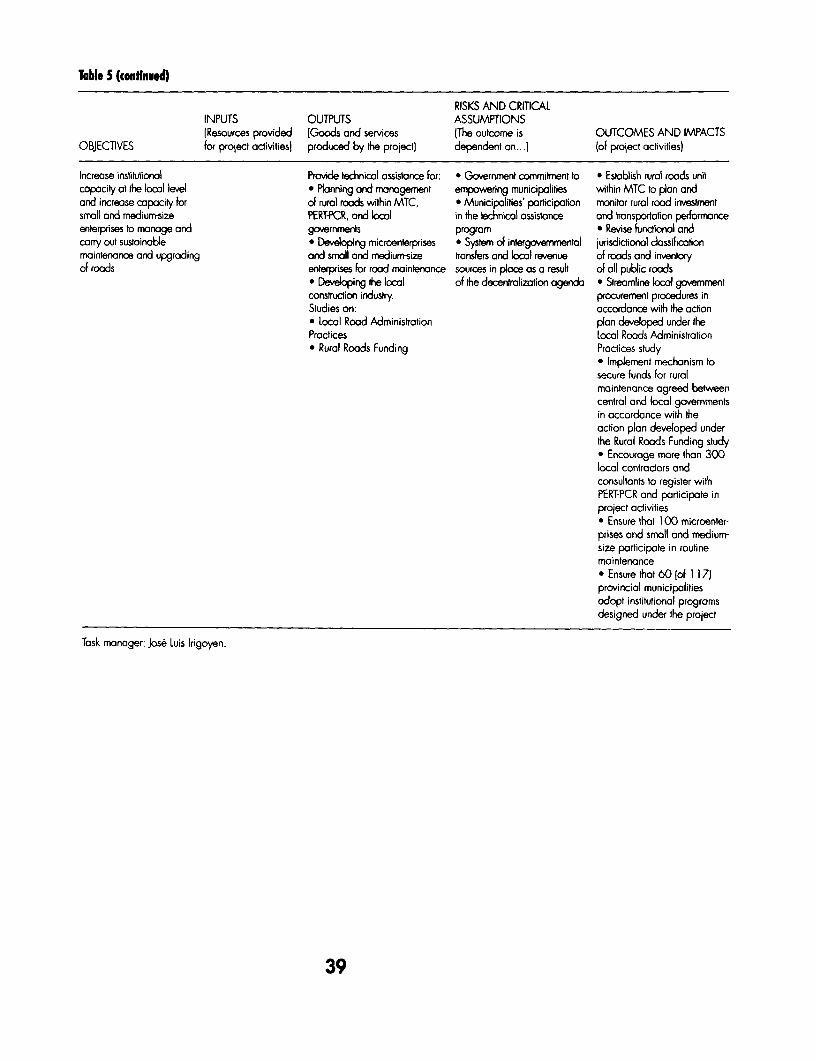
Table 5 (confloed)
RISKS AND CRlTICALINPUTS OUTPUTS ASSUMPTIONS(Resources provided (Goods and services (The outcome is OUTCOMES AND IMPACTS
OBJECTIVES for project activities) produced by the projectl dependent on ... I (of project activities)
Increase institutional Provide technical assistance for: * Government commitment to * Establish rural roads unitcopocity at the local level * Planning and manogement empowering municipalities within MTC to plan andand increase capacity for of rural roads within MTC, * Municipalities' porticipation monitor rurol rood invesinmentsmall and medium-size PERT-PCR, and lcol in the technical assistance and transporafion performanceenterprises to manage and governments program * Revise fundional andcarry out sustainable * Developing microenterprises * System of intergavernmental jurisdictional classificationmaintenance and upgrading and small and medium-size iransfers and local revenue of roads and inventoryof roods enterprises for road maintenance sources in place as a resuh of all public roods
* Developing the local of the decentralization agenda * Streamline local governmentconstruction industry. procurement procedures inStudies on: accordance with the action* Local Road Administration plan developed under thePractices Local Roods Administration* Rural Roads Funding Practices study
* Implement mechanism tosecure funds for ruralmaintenance agreed betweencentral and local governmentsin accordance with theaction plan developed underthe Rural Roads Funding study* Encourage more than 300local contradors andconsultants to register withPERT-PCR and participote inprojec activities* Ensure that 100 microenter-prises and small and medium-size participate in routinemaintenance* Ensure that 60 lof 1 17)provincial municipalitiesadopt institutional programsdesigned under the project
Task manager: Jose Luis Irigoyen.
39
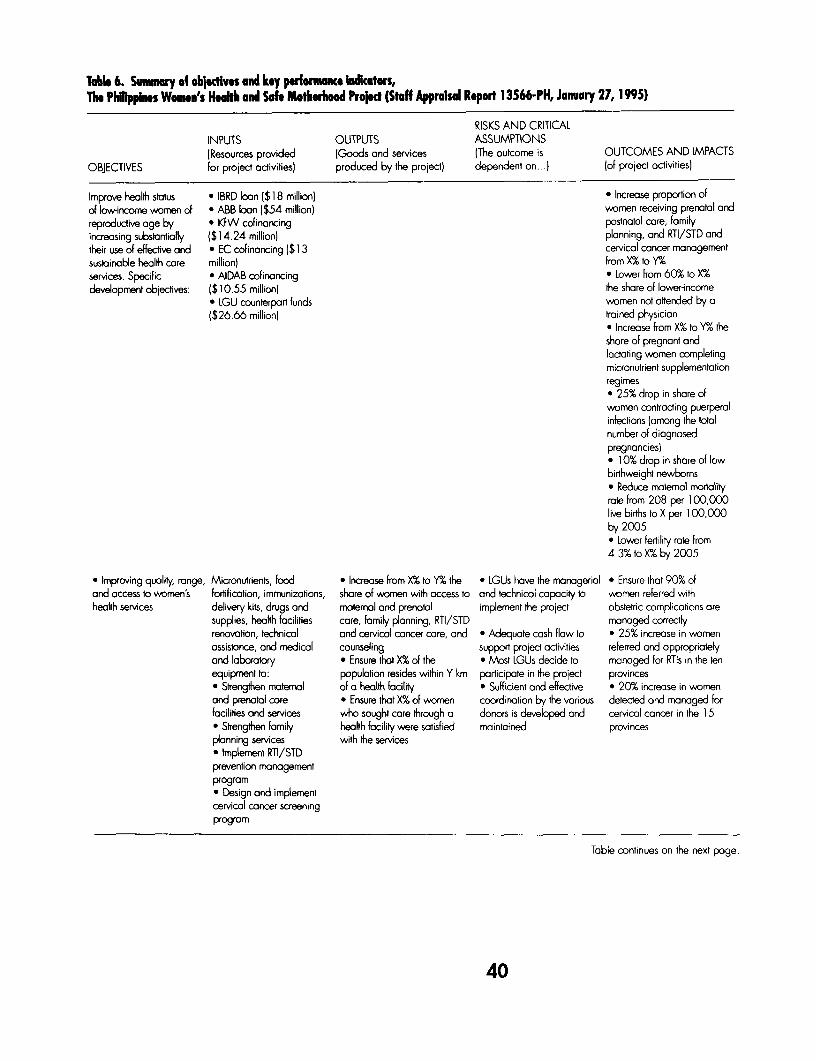
Table 6. Summry of objedives and key performace Indacators,The Philippires Womn's Hotho and Saf Motherhood Prolet (Staff Appraisal Report 13566-PH, January 27, 1995)
RISKS AND CRITICALINPUTS OUTPUTS ASSUMPTIONSiResources provided iGoods and services (The outcome is OUTCOMES AND IMPACTS
OBJECTIVES for project activities) produced by the project) dependent on... j (of project activities)
Improve health status * IBRD loan ($18 million) * Increase proportion ofof low-income women of * ABB loan ($54 million) women receiving prenatal andreprodudive age by * KfW cofinancing postnatal care, familyincreasing substantially ($14.24 million) planning, and RTI/STD andtheir use of effective and * EC cofinancing ($1 3 cervical cancer managementsustainable health care million) from X% to Y%services. Specific * AIDAB cofinancing * Lower from 60% to X%development objectives: ($10.55 million) the share of lowerincome
* LGU counterpart funds women not attended by a($26.66 million) trained physician
* Increase from X% to Y% theshare of pregnant andlactating women completingmicronutrient supplementationregimes* 25% drop in share ofwvomen contracting puerperalinfections (among the totalnumber of diagnosedpregnancies)* 10% drop in share of lowbirthweight newborns* Reduce matemal mortalityrate from 208 per 100,000live births to X per 100,000by 2005* Lower fertility rate from4.3% to X% by 2005
* Improving quality range, Micronutrients, food * Increase from X% to Y% the * LGUs have the managerial * Ensure that 90% ofand access to women's fortifioation, immunizations, share of women with access to and technical capocity to women referred withhealth services delivery kits, drugs and motemal and prenatal implement the project obstetric complications ore
supplies, health facilities care, family planning, RTI/STD monaged correctlyrenovation, technical and cervicol cancer oore, and * Adequate cash flow to * 25% increase in womenassistance, and medical counseling support project acfivities referred and appropriatelyand laboratory * Ensure that X% of the * Most LGUs decide to managed for RTls in the tenequipment to: population resides within Y km porticipate in the project provinces* Strengthen maternal of a health facility * Sufficient and effective * 20% increase in womenand prenatal core * Ensure that X% of women coordination by the various detected and managed forfacilities and services who sought care through a donors is developed and cervical cancer in the 1 5* Strengthen family heolth facility were satisfied maintained provincesplOanning services with the services* Implement RTI/STDprevention managementprogram* Design and implementcervical cancer screeningprogram
Table continues on the next page.
40
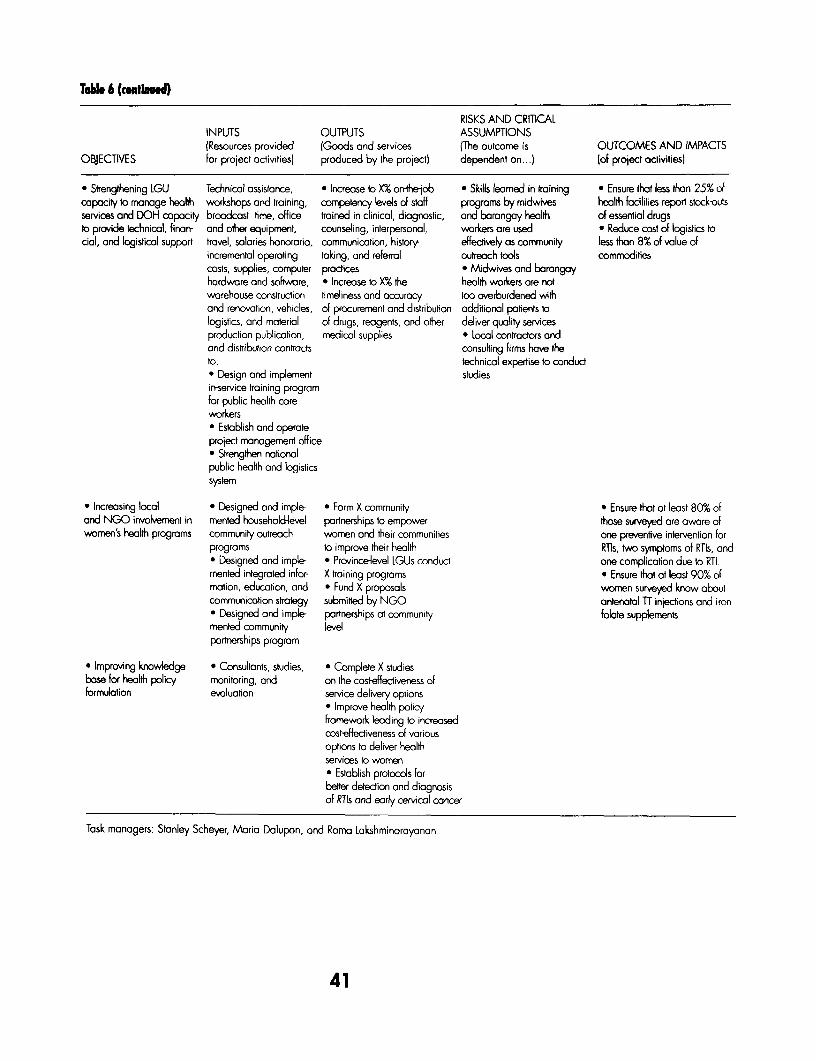
Thbl 6 (continu.d)
RISKS AND CRITICALINPUTS OUTPUTS ASSUMPTIONS(Resources provided (Goods and services (The outcome is OUTCOMES AND IMPACTS
OBJECTIVES for project activities) produced by the project) dependent on ...) (of project activities)
* Strengthening LGU Technical assistance, * Increase to X% onthe-job * Skills leamed in training * Ensure that less fhan 25% ofcapocity to manage health workshops and training, competency levels of staff programs by midwives health focilities report stock-outsservices and DOH capacity broadcast time, office trained in clinical, diagnostic, and barangay health of essential dwugsto provide technical, finon- and other equipment, counseling, interpersonal, workers are used * Reduce cost of logistics tocial, and logistical support travel, salaries honoraria, communication, historr effectively as community less than 8% of value of
incremental operating taking, and referral outreoch tools commoditiescosts, supplies, computer practices * Midwives and barangayhardware and software, * Increase to X% the health workers are notwarehouse construction timeliness and accuracy too averburdened withand renovation, vehicles, of procurement and distribution additional patients tologistics, and material of drugs, reagents, and other deliver quality servicesproduction publication, medical supplies * Local contractors andand distribution contracts consulting firms have theto: technical expertise to conduct* Design and implement studiesin-service training programfor public health careworkers* Establish and operateproject monagement office* Strengthen notionolpublic health and logisticssystem
* Increasing local * Designed and imple- * Form X community * Ensure that at least 80% ofand NGO involvement in mented household-evel partnerships to empower those surveyed are aware ofwomen's health programs community outreach women and their communities one preventive intervention for
programs to improve their health RTls, two symptoms of RTIs, and* Designed and imple- * Provincelevel LGUs conduct one complication due to RTI.mented integrated infor- X training programs * Ensure that at least 90% ofmation, education, and * Fund X proposals women surveyed know aboutcommunication strategy submiffed by NGO antenatal Tr injections and iron* Designed and imple- partnerships at community folate supplementsmented community levelpartnerships program
* Improving knowledge * Consultants, studies, * Complete X studiesbose for health policy monitoring, and on the costeffectiveness offormulation evaluation service delivery options
* Improve health policyframework leading to increasedcost-effectiveness of variousoptions to deliver healthservices to women* Establish protocols forbetter detection and diagnosisof RTIs and eorly cervical cancer
Task managers: Stanley Scheyer, Maria Dalupon, and Rama Lakshminarayanan.
41
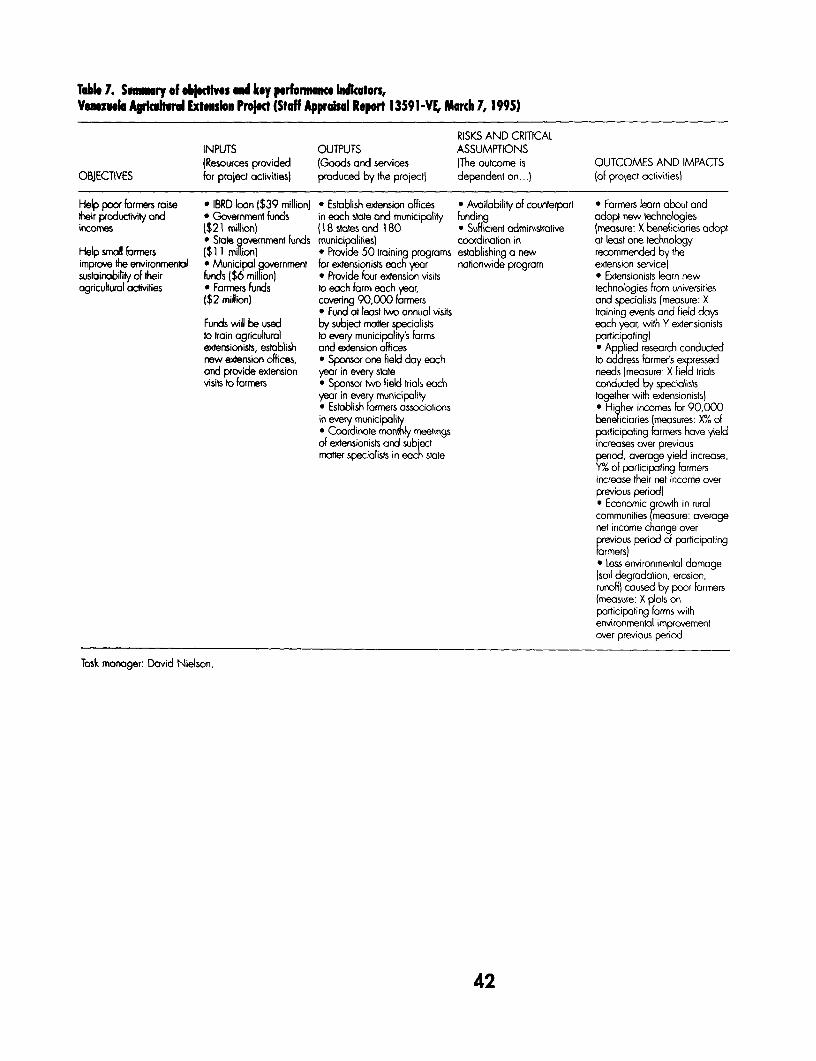
Tab 7. Sommnry of obletWvs _I key perfomance idiators,Venezuela Aglcultural Extension Proec (Staff Appraisal Report 13591-VE, March 7, 1995)
RISKS AND CRITICALINPUTS OUTPUTS ASSUMPTIONS(Resources provided (Goods and services (The outcome is OUTCOMES AND IMPACTS
OBJECTIVES for project activities) produced by the project) dependent on ...) (of project activitiesl
Help poor farmers raise * IBRD loon 1$39 million) * Establish extension offices * Availability of counterpart * Farmers learn about andtheir productivity and * Government funds in each state and municipality funding adopt new technologiesincomes ($21 million) (18 states and 180 * Sufficient administrative (measure: X beneficiaries adopt
* State government funds municipalities) coordination in at least one technologyHelp small famiers ($1 1 milionl * Provide 50 training programs establishing a new recommended by theimprove the environmental * Municipal government for extensionists each year nationwide program extension servicelsustainability of their funds ($6 millionl * Provide four extension visits * Extensionists learn newagricultural activities * Farmers funds to each form each year, technologies from universities
($2 million) covering 90,000 farmers and specialists (measure: X* Fund at least twm annual visits training events and field days
Funds will be used by subject motter specialists each year, with Y extensioniststo train agricultural to every municipality's farms participating)extensionists, establish and extension offices * Applied research conductednew extension offices, * Sponsor one field day each to address farmer's expressedand provide extension year in every state needs (measure: X field trialsvisits to farmers * Sponsor two field trials each conducted by specialists
yeor in every municipality together with extensionistsl* Establish Farmers associations * Higher incomes for 90,000in every municipality beneficiaries (measures: X°h0 of* Coordinate montly meetings participating farmers have yieldof extensionists and subject increases over previousmatter specialists in each stae period, average yield increase
Y/ of participating farmersincrease their net income overprevious period)* Economic growth in ruralcommunities (measure: averagenet income change overpevious period of participating
famers)* Less environmental domage(soil degradation, erosion,runoff) caused by poor farmers(measure: X pots onparticipating farms withenvironmental improvementover previous period
Task manager: David Nielson.
42
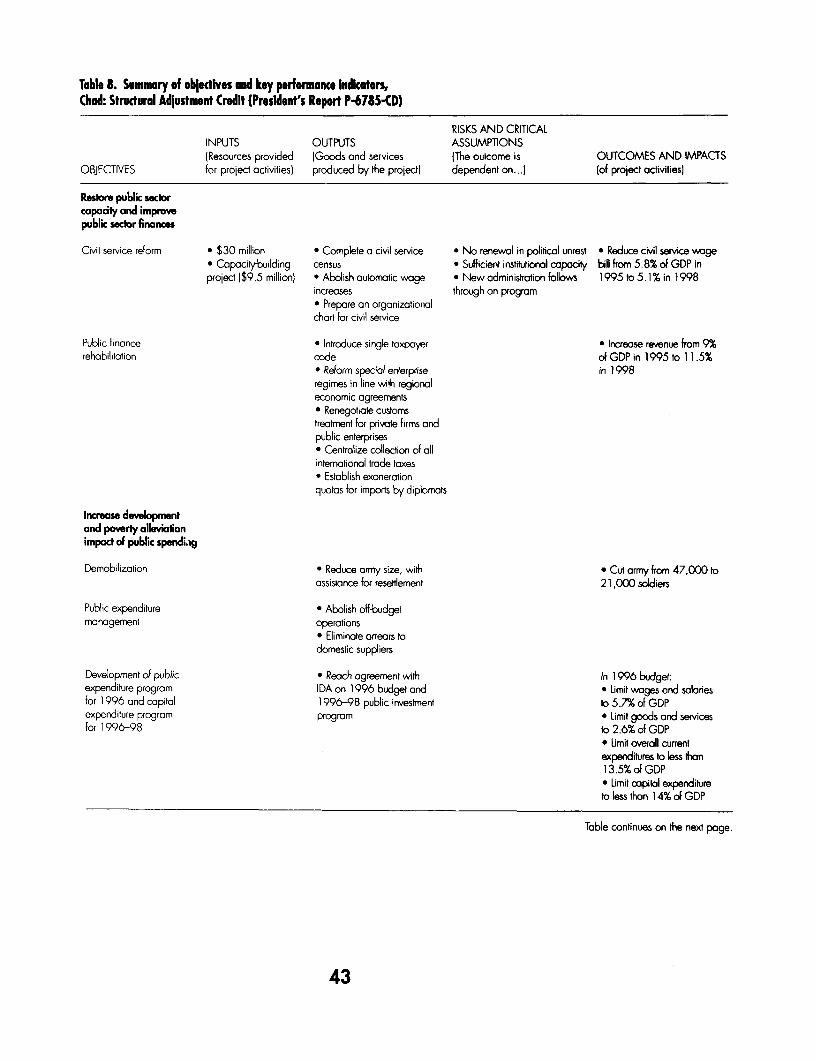
Table S. Summary of obledives and key perfonmance indiktors,Chad: Strudural Adjustment Credit (President's Report P-6785-CD)
RISKS AND CRITICALINPUTS OUTPUTS ASSUMPTIONS(Resources provided IGoods and services iThe outcome is OUTCOMES AND IMPACTS
OBJECTIVES for project activities) produced by the project) dependent on ...) (of project activities)
Resbore publik sectorcapacity and improvepubik secor finances
Civil service reform * $30 million * Complete a civil service * No renewal in political unrest * Reduce civil service vmge* Capocity-building census * Sufficient institutionol capocity bill from 5.8% of GDP inproject ($9.5 million) * Abolish automoaic wage * New administration follows 1995 to 5.1 % in 1998
increases through on program* Prepare an organizationalchort for civil service
Public finance * Introduce single taxpayer * Increase revenue from 9%rehabiliiation code of GDP in 1995 to 11.5%
* Reform special enterprise in 1998regimes in line with regionaleconomic agreements* Renegotiate customstreatment for private firms andpublic enterprisese Centralize collection of allinternational trade taxese Establish exonerationquotas for imports by diplomats
Increase developmentand poverty alleviationimpact of public spending
Demobilization * Reduce army size, with * Cut army from 47,000 toassistance for resettlement 21,000 soldiers
Public expenditure * Abolish off-budgetmanagement operations
* Eliminate arrears todomestic suppliers
Development of public * Reach agreement with In 1996 budget:expenditure program IDA on 1996 budget and * Limit wages and salariesfor 1996 and capital 1996-98 public investment to 5.7% of GDPexpenditure program program * Limit goods and servicesfor 1996-98 to 2.6% of GDP
* Lmit overall currentexpenditures to less than13.5%ofGDP* Limit capitol expenditureto less than 14% of GDP
Table continues on the next page.
43
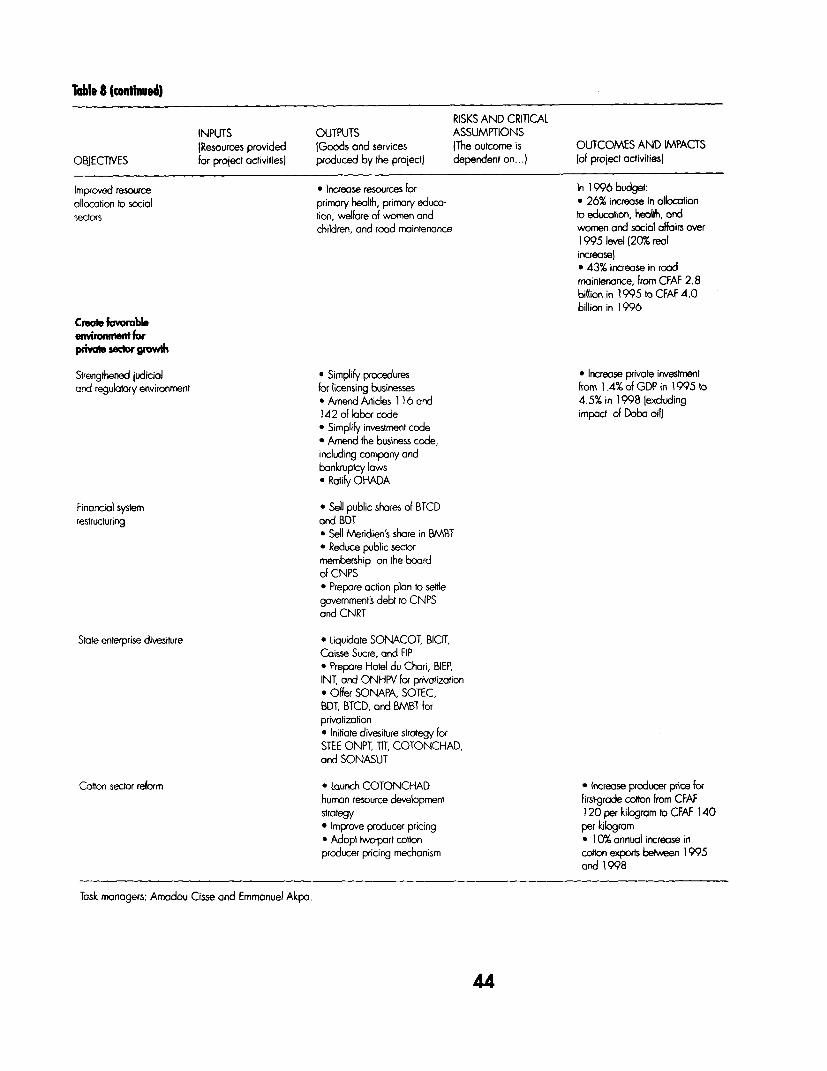
Taleb 8 (cont0Ined)
RISKS AND CRITICALINPUTS OUTPUTS ASSUMPTIONS[Resources provided IGoods and services (The outcome is OUTCOMES AND IMPACTS
OBJECTIVES for project activities) produced by the project) dependent on ...) (of project activitiesj
Improved resource * Increase resources for In 1996 budget:allocation to social primary health, primary educa- * 26% increase in allocationsectors tion, welfare of women and to educotion, heolth, ond
children, and road maintenance women and social affairs over1995 level (20% realincrease(* 43% increase in roadmaintenance, from CFAF 2.8billion in 1995 to CFAF 4.0billion in 1996
Create favomblenvironmient for
prisvte seor gwth
Strengthened judicial * Simplify procedures * Increase pivate investmentand regulatory environment fr licensing businesses from 1.4% of GDP in 1995 to
* Amend Articles 116 and 4.5% in 1998 (excluding142 of labor code impact of Doba oil)- Simplify investment code* Amend the business code,including compony andbankruptcy laws* Ratify OHADA
Financial system * Sell public shares of BTCDrestructuring and BDT
* Sell Meridien's share in BMBT* Reduce public sectormembership on the boardof CNPS* Prepore action plan to settlegovernment's debt to CNPSand CNRT
State enterprise divesiture * Liquidate SONACOT, BICITCoisse Sucre, and FIP* Prepore Hotel du Chari, BIEP,INT, and ONHPV for privatization* Offer SONAPA, SOTEC,BDT, BTCD, and BMBT forprivotization* Initiate divesiture strategy forSTEE ONPT, TIT, COTONCHAD,and SONASUT
Cotton sector reform * Launch COTONCHAD * Increase producer price forhuman resource development firstgrade cotton from CFAFstrategy 1 20 per kilogram to CFAF 140* Improve producer pricing per kilogram* Adopt twopart cotton * 10% annual increase inproducer pricing mechanism cotton exports between 1995
and 1998
Task managers: Amadou Cisse and Emmanuel Akpa.
44
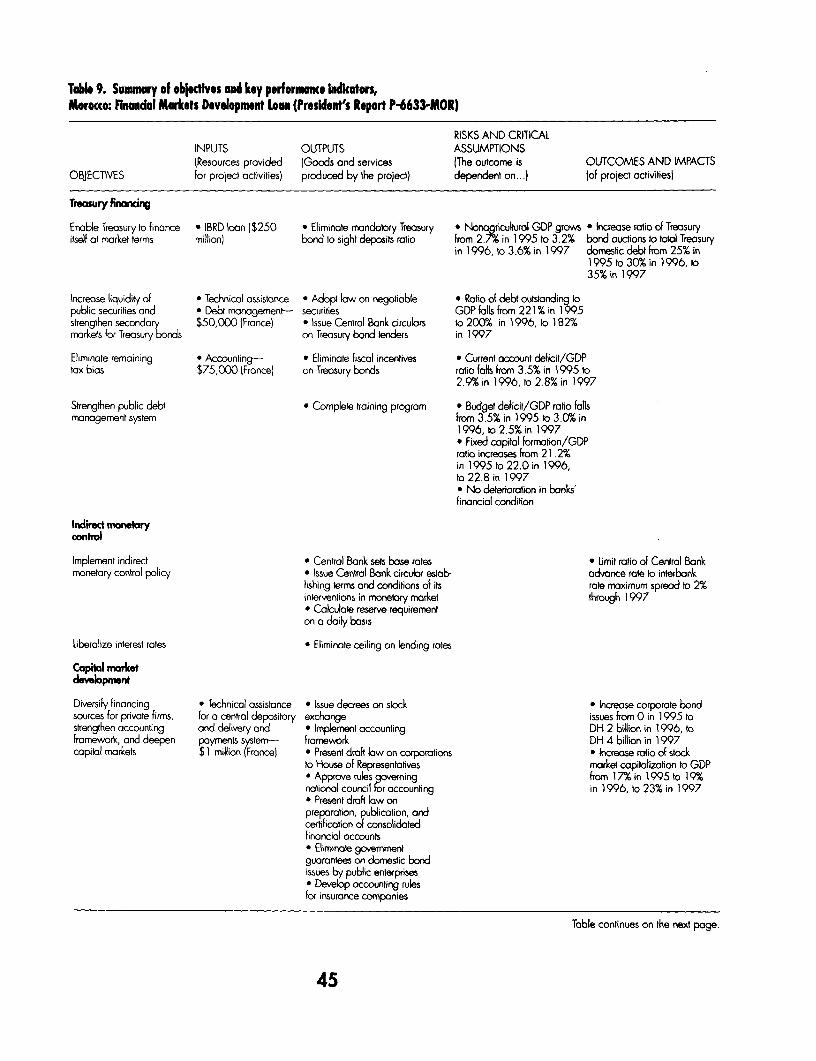
Table 9. Summary of obledives and key performace Indiators,Morocco: Finandal Markets Development Loam (President's Report P-6633-MOR)
RISKS AND CRITICALINPUTS OUTPUTS ASSUMPTIONS(Resources provided (Goods and services (The outcome is OUTCOMES AND LMPACTS
OBJECTIVES for projed activities) produced by the project) dependent on ...) lof project activities)
Treasury financing
Enoble Treasury to finance * IBRD loon ($250 * Eliminate mandatory Treasury * Nonagricultural GDP grows * Increase ratio of Treasuryitself at market terms million) bond to sight deposits ratio from 2. in 1995 to 3.2% bond auctions to total Treasury
in 1996, to 3.6% in 1997 domes6c debt from 25% in1995 to 30% in 1996, to35%in 1997
Increase liquidity of * Technical assistance * Adopt lw on negotiable * Ratio of debt outstanding topublic securities and * Debt management-- securities GDP falls from 221 % in 1995strengthen secondary $50,000 (France; * Issue Central Bank circulars to 200% in 1996, to 182%markets for Treasury bonds on Treasury bond tenders in 1997
Eliminate remaining * Accounting- * Eliminate fiscal incentives * Current account deficit/GDPtax bias $75,000 (Froncel on Treasury bonds ratio falls from 3.5% in 1995 to
2.9% in 1996, to 2.8% in 1997
Strengthen public debt * Complete training program * Budget deficit/GDP ratio fallsmanagement system from 3.5% in 1995 to 3.0% in
1996, to 2.5% in 1997* Fixed capital Formation/GDPratio increases from 21.2%in 1995 t 22.0 in 1996,to 22.8 in 1997* No deterioration in banks'Finoncial condition
Indirect monetoryconto
Implement indirect * Central Bank sets bose rates * Limit ratio of Central Bankmonetary control policy * Issue Central Bank circular estob- advance rate to interbonk
lishing terms and conditions of its rate maximum spread to 2%interventions in monetary market through 1997* Calculate reserve requirementon a daily basis
Liberalize interest rates * Eliminate ceiling on lending rates
Capital marketdeveloprmnt
Diversify financing * Technical assistance * Issue decrees on stack * Increase corporate bondsources for private firms, for a central depository exchange issues from 0 in 1995 tostrengthen accounting and delivery and * Implement accounting DH 2 billion in 1996, tofromework, and deepen poyments system- framework DH 4 billion in 1997capital markets $1 million (Francel * Present draft low on corporations * Incrrease ratio of stock
to House of Representatives market capitalization to GDP* Approve rules governing from 17% in 1995 to 19%national council for accounting in 1996, to 23% in 1997* Present drah law onpreporation, publication, andcerfification of consolidotedfinancial accounts* Eliminote governmentguarantees on domestic bondissues by public enterprises* Develop occounting rulesfor insurance companies
Table continues on the next poge.
45
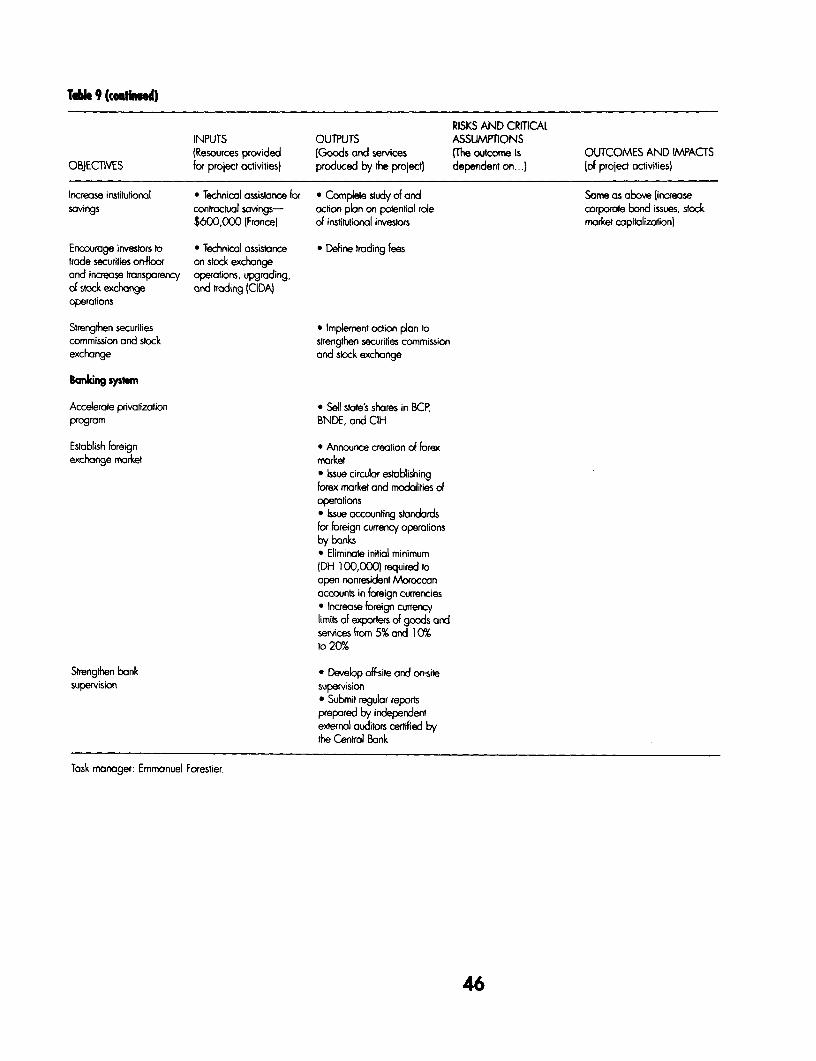
Te 9 (Cethied)
RISKS AND CRmCALINPUTS OUTPUTS ASSUMPTIONS(Resources provided (Goods and services (The outcome is OUTCOMES AND IMPACTS
OBJECTIVES for project activities) produced by the project) dependent on ...) (of project activities)
Increase institutional * Technical assistance for * Compete study of and Same as above (increasesavings contractual savings- achon plan on potential role corporate bond issues, stock
$600,000 (Francel of institutional investors market capitalization)
Encourage investors to * Technical assistance * Define trading feestrode securities onrfloor on stock exchangeand increase transparency operations, upgrading,of stock exchange and troding (CIDA)operations
Strengthen securities * Implement action plan tocommission and stock strengthen securifies commissionexchange and stock exchange
Bknmng syslen
Accelerate prvatization * Sell state's shares in BCP,program BNDE, and CIH
Establish foreign * Announce creation of forexexchange market market
* Issue circular establishingforex market and modalities ofoperafions* Issue accounting standardsfor foreign currency operationsby banks* Eliminate initial minimumIDH 100,000) required toopen nonresident Moroccanaccounts in foreign currencies* Increase foreign currencylimits of exporters of goods andsrvices from 5% and 10%to 20%
Strengthen bonk * Develop offsite and on-sitesupervision supervision
* Submit regular reportsprepored by independentexternal auditors oertified bythe Central Bank
Task manager: Emmonuel Forestier.
46

Distributors Oi ~ F.wCHNA P&aarroc SA L CosrruTocnau Sansor SPA Navesan hronrnabn Center SINGAPORE, TAIWAK Van Diarrms E r WerMDiShibUtors of Chra Frralciat6Eronox 35 StnamStr. Vla Du D Carasbr 1/1 Book Depnmarnte tYANMAR BRUN Ch. de Laa 41W orld Bank PuthAng HoLsce 106 82 AEhenri Ctle PosWeS52 PO. Bo er.ad A Pa12tMeEtsahaP W"Asia CH18D7Ebnv ." n 8~~~~~~~~S Da Fo SiDonsgJA Tel. (1) %4-IM2 50125 Frrene N48D020dso6 Pacific Pie. Lid Tel (021) 943 267Publications Beyaqo Fx: (1) 364-8254 Tel: (55) 645-415 Tel (22)57-3300 41 KA"rPdds Road#04-03 Fax. (021) 943 38S
Prircs nd redt cutersvry. Tel (56) 10-333-8257 FaGKNdAL F(55)641U257 Fax (22}68-1901 G aok Whee BiidingPrices and credit terms wry Fac (56)10-401-7345 HONG KONG, MtACAG Swngapore 349316 TANZANIAfToam country to country. Asia 25 Ltd JAMAICA PAKISTAN Tel. (65) 741-5166 Ordod Ureausit PressConsult your local distributor COLOMBIA Seles & C4culabon Depeatrnt Ian Rardte PLbtshs Lid MArza Book Agasey Fax (65) 742-9356 mottia Strebefore placing an order kdocanwe Ltea. Seabrd House. unil 1101-02 206 Old Hope Road 65, Shrlerah-ea e -Azemn a-mae. arhgaleOas riaors cOn PO Box 5298
Apetado Aersa 34270 22-28 Wrdne Streea Cenate Kinslon 6 P.O. Box No 729 Dar es SaealraTel (1) 205-2790 Horg Kong Tel: 809-927-2095 Laxare 540D SLOVAK REPUBLIC Tel: (51) 292D
ALBANIA Fax (1) 285-2798 Tel: 952253D-1409 Fu 809-977-0243 Tel (42) 7353661 Sovalr G.TG. Lid Fax (51)46922Adnm Lid. Farx 852 2526-1107 Fax (42) 7565263 pnttWea 4Plerl Rexheip Slr. COTE DW1OIRE URL: [email protected] JAPAN PO Box 152 THAIANDPal 98 StLI Ap1 4 Cante cEdism at de Ddilom Easterrn Bok Servce Ontord Urw ty Press 85299 6bsdeva S Carel Batooks L3b6tnTeam Kte s (CEODA) HUNGARY Hrsgo 3-CSane, Bangoa lor"n Tel: (7) 39472 306 Silom RoadTa (42) 27419 22172 04 B.P.541 Founat tor t4aet Burkyo-ku l3 Sharae Faisat Faxa (7639485 BwtkokFax (42) 27419 Abeae 04 Platu Ecorny Tokyo PC Box 13633 Tel. (2) 235-540
Tel: 225-24t610 D)ardbsal ( 17-19 Tel (03)3918-1966 Karaehi-75350 SOUTH AFRCA, BOTSWAANA Fea (2)237-8321ARGENTWA Fee 225-25-0567 H-ll BII7 iBudvpt Fax (03) 3018-0664 Tel (21) 446307 For me eas.Oticina del Lie trternrtorat Tel: 36 1 204 2951 or UFL hItpiMwbekko&.or.p(/-svI-ebs Fax: (21) 454-7640 Oxtord Unsereny Press TRtNIDAD & TOBAGO, JAILAv CordoalSi7 CYPRUS 3612042948 E0-mad: oapO p kIeccm coot pk SnAham Atrnc Syl ah Saedis UIndIl2DBurmnAkes Canrl or Appbed Farch Fu: 3601 204 2953 KEYA PO Box1l41 tl9WadsSbreelTtL (I) S1543156 Cyprus Carge Atrica Beak Samoc (EA) Ud. PERU Cape Tossn W CurepeFax (1) 8154-4 6, DiogesesStt Engo tIA CUrs House, Wna o Sueet Eddonit DesamrcoSA TexI (21)45-7266 Tbi, West lAn
P.O. Boo 2DD Abed Putus Ltd. PO Box 45245 Apest 3824 Fa- (21)45-7265 Tel W6-68-5654AUSTRALIA, RJ, AMPUA NEW GLKNEA, Naesi 751 Mouril Rad Natob Lman I Fax: 80966625654SOLOMON SLAND, VAt41ATU, AND Tl: (2) 44-1730 Madas -50002 Tel: (2)23641 Td4 (14) 2830 For ebtc n orders.WESTERN SAMOA Fax (2)46-2051 Tat: (44)852-393 Fax: (2)330272 Fax: (14) 28626 ntnMeralitDa SArdcnpbon Serve UGANDADA Ilotrukalon Srces Fax (44) 852-649 P.O. Bax 41095 GLAso Ltd648 6Wtalho Road CZECH RE BLtC KOREA, REUBLIC Of PItIJltES Crall" MaCrar Bi*dglcartn 3132 NaIselo trsmaori CantWr tNDONESSA Deo Tdhivg Co. Ltd. hlerninla BODIsotare Calmer oc Jarrebg 2024 PO Box 9897Vire POd*i, K rska 5 p1 ksdeLiniLed P.O. Br 34 SLAG 720 iyland 10 Tet. (11)88D 844 PM 16/4 Jqa Fd.Td. (61)39210 77T7 CS - 113 57 Prague I Jalan BomabudLr 20 YaDida Caxmorerhn Tower 2 Fax: (11) 880-6248 KrrabFax (61)3921O 7788 TeL (2) 2422-9433 PO. Boa 181 Seiu H.V deda Cos"a corner TeV/Fax: (41) 254763URL tlinpAtwaradret.corLeu Fax (2) 2422-1484 Jeana 10320 Tel: (2) 735-1631/4 Vaero SI. SPAIN
URL tipJAwMwMW.r2 Tel: (21)390-4240 Fa (2)784-0315 Matab, Mlts Mus Musni-Prrrea Lienos. SA UN1TED KV3 WMAUSTRIA Fax: (21)421-4289 Tat: (2)817-9676 CaslaloS37 Maods LtdGarld ansd Co DENMARK MALAYSIA Fax (2) 817-1741 28DD1 Maidd PO. Box 3Graben 31 SwnkAram tRAN Unrery at Maya Coopereli Te: (1) 431-3399 AMorl Hwalne GU34 2PGA-lOll Wb1 RoWF rerInr4 th K 11 Kra Putibs Rookiop, Ulred POLAND Fax (1)575-3998 EnglandTd (1(51247-31-0 OK-1970FradbrnrergC PO. Boo 19575-511 PO. Box1127 kieandiobrm Pddeg Serse ht9pJA BalasiArPesa Tel (1420)86840Fax (1) 512-47-31-29 Tel: (3l-351942 Talrs JaenP PbuamBr Ul. PoleAs311/37 Fax (1420)8 88M
Fax (31(357822 Te: (21) 258-3723 59700 Kuaea Luirpur 00-577 Werzrwe Matrd-Praen BardonaJIGLADEBH Fax 98(21)258-3723 Tel: (3)756-50D Tel. (2)62S-6089 Coarede Cerl, 391 ZAMBIA
Moo AstatO Deoeepmenwl EGYPT ARAB REPUBLIC OF Fax (3) 755-24 Fax (2)621-7255 0O9 BarO Uarsty BookshopAsAna SDiely (MIDAS) At Ahrrneu DOibm Agencry KOW Sae Ca. Puths Tat: (3) 4-30DM GrCt EaS Rood CUT
Hoa S. RoPd 16 Al Gae Sas Khaled EslasLb Ave - MEXCO PORTUGAL Fax (3(487-7659 PO. Box 32379DlwOs t FVArea Cairo 6tn Sbeel WFOTEC LAmed Poulpt Luab-kDhake 1209 Tel- (2) 57-0603 Kuarheh Deelmo ND. 8 Apauloo Postal 22-660 RoL Do Casino 70-74 SRI LANKA THE MALDES Td (1) 213221 EaL 482T. (2)326427 Fax: (2(576-633 Te*M 14060 Tiper, 120 LUsbo Lake Horse BookshpFua (2(81118I Td: 871719or8716104 MetxioD.F. Tel: (1)347-4982 PO. Box 244 ZIMBAt1E
The bddt East Oter Fax 8682479 TdW: (5)60-011 Fax: (1) 347-024 155, Se 9 rirtkA LA.rrnWTFZimabwe 0.)aWBELOWI 41, Start SIre E-rca. tralatseagneOdocdhr Fax: (5( 624-2822 Gaedinw Maretr Troule Road. AsbnarJaantDe Lmb x Cairo ROMAIA Cobnibo 2 PO.Bo. STl25A. duoir202 Tel: l2) (3973 tELAUND NETHERLANDS Coewd De Lbmrr Bucuresi SAk Tat. (1)32105 Sorenon10968Bet_ Faxr (2)393-9732 Gvae Suppiess Agency De Lnetboomt nOr-Pudbtkalad, Str. LcaO no. 26, ndra 3 Fax (1)432104 HarMuTit 2)5385169 Oftig an tSoM P.O. Box 22 Baucdrst Tel: (4) 6216617Fax (2) 531141 FAD 4-S Haro4r Road 7480 AE H-ksbaerge Ted: (1) 613 9645 SWEDEN Fax: (4) 621670
Akeerwan Keka;;ppa DrtAn 2 Te1: (53)574-604 Fax (1) 312 4000 Fdza Cua m ServiceIlAZL PO. Box 120 Tel: (1)461-3111 Far (53)572-9296 Regaking l2Putae cnlariciYatkfrr mis FSN40101 HeSsnli Fax (1)475-2670 RUSSIAN FEDERATION S-10647 Shddcir
WrL It. (0)12141 NEW ZEALAND dweabe ovs Mr, let )69D9089DRem Patb Gre,, 209 Fax: p) 121-4441 RAIEL EBSCO N12 Ld. go, Krovh* PereubL Fax () 2147 7701409 Sao PW, SP. URL ttpkoolinelztatln bal Yoresol LIa e Lbi Prva5b Mel Bag 89914 Moscw 101031Tt (11)2z94 P.O. Box 6056 New el Tel: (95)9178749 Wuweeal-WituirASFac III) 258-60 FRANCE Tel Aviv 61560 Aucland Fax (95) 917 62 59 P.O. Box 1306UFL ht.IpJawoLbk Wort Ban Preddte Tet: (3) 5281397 Tet: (9) 524-8119 S-171 25 Soae
66, ensu lire Fax (3) 5285-307 Fax 9) 524-8C67 SALD ARABIA, QATAR Tet: (8) 70F-7-50CAIIADA 75116 Paw Jari Book SUore Fax (8) 27-071Rard Pawt"ig C. it Tet (1)40-JI14-56V7 FO.Y. Ineren NIGERIA PO. Box 31961294 AJRom Fed Fax (1)40-88-30-56 PO Box 13056 Uriiseady Pre LUmed Riyadi 11471 SW6YZENLAOOnms0ChnsKRB3W8 TelAvri61130 TlseCwOwBuildingJetldro Tat: (1)477-3140 L4x iiePayolTdt61-74143 GERMANY Te()9 5461423 Priate Mod Bg 5095 Faxx (1)477-2940 Serniickub trSw9F&ac 613-741-5439 UNO-Vs Far (3) 541442 budan Ce4-brte 30URL, htMii1wabxrLC/-eufi Poppledler Ai 55 Tat: (22)41-13506 1002 LauttxW
53115 Brm Pattie Aedspib ES Fasx (22)41-2856 iat 028441-3229Tt MO 212940 tdres birrr enSie Fax (021(3414251Fax (228)217492 P0.B 19562 Jerral
Tel- 21271219


RECENT WORLD BANK TECHNICAL PAPERS (continued)
No. 295 Pohl, Jedrzejczak, and Anderson, Creating Capital Markets in Central and Eastern Europe
No. 296 Stassen, Small-Scale Biomass Gasifiersfor Heat and Power: A Global Review
No. 297 Bulatao, Key Indicatorsfor Family Planning Projects
No. 298 Odaga and Heneveld, Girls and Schools in Sub-Saharan Africa: From Analysis to Action
No. 299 Tamale, Jones, and Pswarayi-Riddihough, Technologies Related to Participatory Forestry in Tropicaland Subtropical Countries
No. 300 Oram and de Haan, Technologiesfor Rainfed Agriculture in Mediterranean Climates: A Review of World Bank Experiences
No. 301 Mohan, editor, Bibliography of Publications: Techinical Department, Africa Region, July 1987 to April 1995
No. 302 Baldry, Calamari, and Yameogo, Environmental Impact Assessment of Settlement and Developmenit in the Upper LerabaBasin
No. 303 Heneveld and Craig, Schools Count: World Bank Project Designs and the Quality of Primary Education inSub-Saharan Africa
No. 304 Foley, Photovoltaic Applications in Rural Areas of the Developing World
No. 305 Johnson, Education and Training of Accountants in Sub-Saharan Angloplhone Africa
No. 306 Muir and Saba, Improving State Enterprise Perfornance: The Role of Internal and External Incentives
No. 307 Narayan, Toward Participatory Research
No. 308 Adarnson and others, Energy Use, Air Pollution, and Environmental Policy in Krakow: Can Economic Incentives ReallyHelp?
No. 309 The World Bank/FOA/UNIDO/Industry Fertilizer Working Group, World and Regional Supply and Demand Balancesfor Nitrogen, Phosphate, and Potash, 1993/94-1999/2000
No. 310 Elder and Cooley, editors, Sustainable Settlement and Development of the Onchocerciasis ControlProgramme Area: Proceedings of a Ministerial Meeting
No. 311 Webster, Riopelle and Chidzero, World Bank Lendingfor Small Enterprises 1989-1993
No. 312 Benoit, Project Finance at the World Bank: An Overview of Policies and Instruments
No. 313 Kapur, Airport Infrastructure: The Emerging Role of the Private Sector
No. 314 Valdes and Schaeffer in collaboration with Ramos, Surveillance of Agricultural Price and Trade Policies: A HandbookforEcuador
No. 316 Schware and Kirnberley, Information Technology and National Trade Facilitation: Making the Most of Global Trade
No. 317 Schware and Kirnberley, Information Technology and National Trade Facilitation: Guide to Best Practice
No. 318 Taylor, Boukambou, Dahniya, Ouayogode, Ayling, Abdi Noor, and Toure, Strengtlening National Agricultural ResearchSystems in the Humid and Sub-humid Zones of West and Central Africa: A Frameworkfor Action
No. 320 Srivastava, Lambert and Vietmeyer, Medicinal Plants: An Expanding Role in Development
No. 321 Srivastava, Smith, and Forno, Biodiversity and Agriculture: Implicationsfor Conservation and Development
No. 322 Peters, The Ecology and Management of Non-Timber Forest Resources
No. 323 Pannier, editor, Corporate Governance of Public Enterprises in Transitionial Economies
No. 324 Cabraal, Cosgrove-Davies, and Schaeffer, Best Practicesfor Photovoltaic Household Electrification Programs
No. 325 Bacon, Besant-Jones, and Heidarian, Estimating Construction Costs and Schedules: Experience withi Power GenerationProjects in Developing Countries
No. 326 Colletta, Balachander, Liang, The Condition of Young Children in Sub-Saharan Africa: The Convergence of Health,Nutrition, and Early Education
No. 327 Valdes and Schaeffer in collaboration with Martin, Surveillance of Agricultural Price and Trade Policies: A HandbookforParaguay
No. 328 De Geyndt, Social Development and Absolute Poverty in Asia and Latin America
No. 329 Mohan, editor, Bibliography of Publications: Technical Department, Africa Region, July 1987 to April 1996
No. 332 Pohl, Djankov, and Anderson, Restructuring Large Industrial Firms in Central and Eastern Eunmpe: An Empirical Analysis
No. 333 Jha, Ranson, and Bobadilla, Measuring the Burden of Disease and the Cost-Effectiveness of Health Interventions: A CaseStudy in Guinea

i~~~~~~~~~~~~~~~~~~~~~~~~~~~~~~~~~~~~~~~~~~~~~~~~~~~~~~~~~~~~~~~~~~~~~~~~~~~~~~~~~~~~~~~~~~~~~~~~~~~~~~~~~~~~~~~~~~~~~~~~~~~~~~~~~~~~~~~~~~~~~~~~~~~~~~~~~~~~~~~~~~~~~~~~~~~~~~~~~~~~~~~~~~~~~
i%P~~~~~~
I I I
I ,i S . !I
-~~~~~~a -
:~~~~~~~~~~~~~~~~~~u.
I~~~~~~~~~~~~~~~~~~~~~~~~~~~~~~~~~~~~~~~ Ill ''ll, l