Embed Size (px)
Citation preview

Performance of Horizontal Roughing Filter forColour Removal of Palm Oil Mill E�uent UsingNatural AdsorbentArezoo Fereidonian Dashti ( [email protected] )
Universiti Sains MalaysiaHamidi Abdul Aziz
Universiti Sains Malaysia - Engineering Campus Seri Ampangan: Universiti Sains Malaysia - KampusKejuruteraan Seri AmpanganMohd Nordin Adlan
Universiti Sains Malaysia - Engineering Campus Seri Ampangan: Universiti Sains Malaysia - KampusKejuruteraan Seri AmpanganAli Huddin Ibrahim
Universiti Sains Malaysia - Engineering Campus Seri Ampangan: Universiti Sains Malaysia - KampusKejuruteraan Seri Ampangan
Research Article
Keywords: Calcination, Raw Limestone, Central Composite Design, Isotherm study, Palm Oil Mill E�uent
Posted Date: April 26th, 2021
DOI: https://doi.org/10.21203/rs.3.rs-252985/v1
License: This work is licensed under a Creative Commons Attribution 4.0 International License. Read Full License

1
1
2
Performance of Horizontal Roughing Filter for Colour Removal of Palm Oil Mill Effluent 3
Using Natural Adsorbent 4
Arezoo Fereidonian Dashti1*, Hamidi Abdul Aziz1, Mohd Nordin Adlan2, Ali Huddin Ibrahim1
1School of Civil Engineering, Engineering Campus, Universiti Sains Malaysia, 14300 Nibong Tebal,
Penang, Malaysia 2Solid Waste Management Cluster, Science and Technology Research Centre, Engineering Campus, Universiti
Sains Malaysia, 14300 Nibong Tebal, Penang, Malaysia
5 *Corresponding author at: School of Civil Engineering, Universiti Sains Malaysia, Nibong Tebal, Seberang Perai 6
Selatan, Pulau Pinang, 14300, Malaysia. E-mail address: [email protected] 7
8
9
Abstract 10
11
Palm oil wastewater treatment was investigated via a filtration process using raw and calcinated limestone. The 12
column studies were conducted using different limestone sizes (4, 12, and 20 mm), calcination temperature (800 13
°C and 600 °C) and various filtration rates (20, 60, and 100 mL/min) and a comparison was made with raw limestone 14
under similar conditions. The response surface methodology using central composite design was employed to 15
optimize the process parameter. The experimental data was analyzed via the analysis of variance to identify the 16
interaction between the parameters and the dependent parameter. The results showed that the colour removal 17
increased with an increase in temperature (800 ºC) for filtration rate of 20 mL/min, the retention time of 317 min 18
and the smaller size (4 mm) of limestone and decreased with an increase in the filtration rate and size of raw 19
limestone. Based on the achieved results, the optimum condition for colour removal was at temperature 800 °C (61%), 20
600 oC (56%) and raw limestone (49%) respectively with the same experimental setup (flow rate of 20 mL/min and 21
limestone size of 4 mm). According to the statistical analysis, quadratic models demonstrated significant values 22
(0.000) for the response (colour). Freundlich and Langmuir isotherms also provided good correlation coefficient for 23
the colour removal. The data conforms to the Langmuir isotherm with the best fit model (R2=0.7). 24
25
26
27
Keywords: Calcination; Raw Limestone, Central Composite Design, Isotherm study, Palm Oil Mill Effluent 28
29
30
1. Introduction 31
Palm oil industry is considered as an agro-based industry that provides positive economic impact worldwide 32
and to Malaysia specifically (Nasrullah et al. 2017; Bello and Raman 2017). It is reported that the worldwide 33
production of palm oil was over 70 million metric tonnes in 2018, and it is anticipated to exceed 75 million metric 34
tonnes in 2020 (Hayawin et al. 2020). The production of one tonne of crude palm oil needs 5-7.5 tonnes of water and 35
more than half of it is discharged as wastewater called palm oil mill effluent (POME) (Dashti et al. 2020; Sani et al. 36
2020; Bello et al. 2017). Palm Oil Mill Effluent (POME) is characterized as a thick liquid that contains high organic 37
contents with brownish colour and strong smell. It also contains Biochemical Oxygen Demand (BOD), Oil and Grease 38
(O&G), high concentration of Chemical Oxygen Demand (COD), Suspended Solid (SS) and total solids. The 39
discharge of POME without proper treatment imposes serious pollution to the environment (Hossain et al. 2019; 40

2
Bashir et al. 2019; Fereidonian et al. 2018). The colour is formed by refractory compounds of natural organic matter, 41
such as tannins, phenolic compounds, and melanoidin (generated by heating organic oil from the extraction process) 42
(Limkhuansuwan and Chaiprasert 2010). The discharge of brownish colour wastewater into the water bodies can cause 43
adverse effects to aquatic lives by filtering the light passing through which results in less photosynthesis activity and 44
less dissolved oxygen in the water (Ratpukdi 2012). The most usual technology to treat POME is the biological 45
treatments using aerobic or an anaerobic ponding process, due to its low operating cost (Lawal et al. 2020). On the 46
other hand, the biological treatment is a long process, since it requires an extended treatment time to degrade the 47
organic particles (Kim et al. 2020; Chung et al.,2018; Lek et al. 2018). Moreover, lack of regulative control on 48
emission of greenhouse gases caused by biological treatment process is the main drawback of the available and 49
existing POME treatment process (Khadaroo et al. 2019). The process of biological wastewater treatment is ranked as 50
the second-largest producer of greenhouse gases in Malaysia. Gases produced by the biological treatment process are 51
odorous and corrosive as they contain ammonia and hydrogen sulfide (Mat et al. 2020; Hossain et al. 2019; Bakar et 52
al. 2018). The ponding system is also influenced because of the excessive organic load and low pH in addition to the 53
colloidal nature of the suspended solids in POME (Nahrul et al. 2017). Consequently, COD, residual BOD, turbidity 54
and SS concentration in treated POME do not meet the standard discharge constraints for industrial effluents provided 55
by Department of Environment (DOE), Malaysia (Jagaba et al. 2020; Bashir et al. 2019; Dashti et al. 2019). Alternative 56
methods were applied on POME treatment such as membrane, membrane bioreactor, physicochemical, ozonation, and 57
aerobic systems. However, these systems were not implemented in large scale due to operational problems such as 58
scum formation, sludge flotation, or high-energy requirements from the treatment system (Saeed et al. 2015). In this 59
research, we used POME from a polishing pond. After measuring the parameters, it was confirmed that physical 60
treatment could be used because the amount of BOD over COD was less than 0.1. 61
62
The features such as being chemical-free, being high solid retention capacity, having simple management and 63
low-cost maintenance are the highlighted benefits of Roughing Filter (RF) (Khazaei et al.,2016). Usually, RFs are 64
filled with the media of diameter ranging from 4 mm to 30 mm and operate at low hydraulic load varying from 0.3 m 65
h−1 to 1.5 m h−1 (Zeng et al. 2018; Khezri et al. 2015). During RF process, particles are removed if they are smaller 66
than the filter media. The particle removal is efficient when particles are successfully transported and attached on the 67
surface area of the media (or collector). This is defined by the approach to design deep-bed filters and is an estimate 68
using colloid filtration theory (CFT) (Watanabe et al 2002). When a particle is carried by gravitational settling from 69
its fluid streamline to a collector surface, sedimentation (ŋG) takes place. Sedimentation can be calculated by (1) 70
(Watanabe et al. 2002): 71
72
ŋ" =$%&'%()+,&
-
./0ʋ (1) 73
In (1), the fluid density, particle density, gravitational constant and the average particle diameter are presented by 74
𝜌3(gm/𝑐𝑚:), 𝜌<(gm/𝑐𝑚:), g (cm/ s2) and 𝑑<(cm) respectively. µ (gm/cm/s) is the fluid dynamic viscosity and v 75
(cm/s) is the fluid approach velocity. 76
Due to porosity, various physicochemical properties and particularly surface area of the filter media plays an important 77
role on RFs process (Lin et al. 2008). Various materials have been used as filter media, such as broken brick, various 78
gravel, charcoal (Ochieng et al. 2006), sand (Lin et al.,2008) and plastic (Nkwonta 2010). Limestone is one of the 79
most well-known media utilized in RF. The physical structure of limestone deteriorates quickly when it is calcinated 80
at the temperature of 600 °C. Under mentioned condition, both the peak stress and the coefficient of elasticity decrease 81
quickly which results in more cracks, porosities and enlargement of the surface area (Dashti et al. 2019; Zhang et al. 82
2017), and finally, leads to more absorption ability. This research aims to reduce the colour in polishing pond of 83
POME using calcinated limestone. Hence, the conditions for calcinating various sizes of limestone in different flow 84
rates were optimized using Central Composite Design (CCD) and Response Surface Methodology (RSM). The novelty 85
of this research lies in the use of the calcinated limestone to improve adsorption capabilities. Filter performance was 86

3
also systematically studied with the aim of developing an effective new treatment technology for POME polishing 87
pond. 88
89
90
2. Materials and Methods 91
2.1 POME Sampling, Analysis and Preservation 92
The final discharge effluent of an open anaerobic pond (polishing pond), belonging to MALPOM Industries 93
located in Malaysia, was selected to be used in this research. Hanna HI8314 portable pH meter was used to measure 94
the pH of the POME on-the-location of MALPLM. During the process of sampling and transporting POME to the 95
laboratory, in order to keep it away from light exposure, 25-L black and air-tight container was used. In the laboratory, 96
the POME was immediately stored in cooling room (4 ºC) to be preserved for future biological activities. The COD 97
removal was evaluated based on APHA Standard Method 5220D, program 435 COD HR, HACH DR/ 2800 98
spectrophotometer while turbidity was measured by the method 2130B (APHA 2005) using HACH 2100Q 99
Turbidimeter. The colour was determined by the method 2120C (APHA 2005), Platinum-Cobalt Standard. Ammonia 100
nitrogen-Nessler method coupled with HACH DR/ 2800 spectrophotometer were used to measure Ammonia nitrogen. 101
102
103
2.2 Filter Design and Operation 104
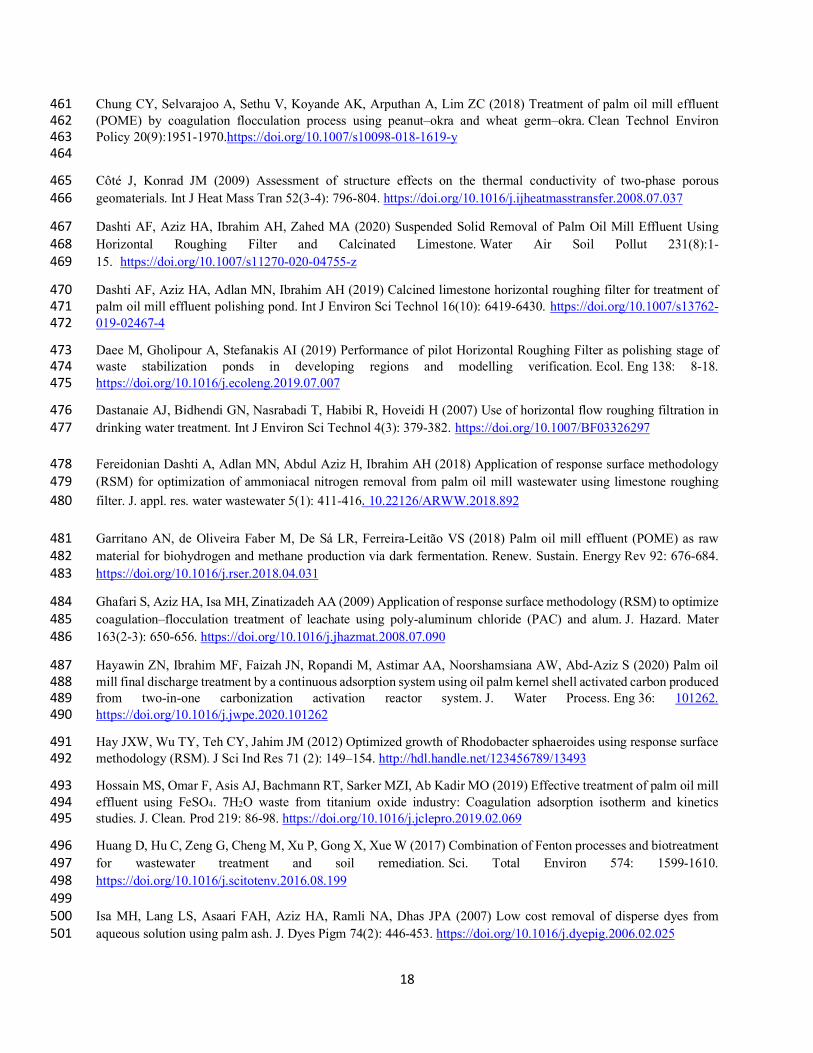
The horizontal filter is an acrylic column which is 75 cm wide, 20 cm long, and 9 cm high (Table 1). Raw and 105
calcinated limestones with various sizes are used as a filter media during the process. The column study was run by 106
passing the POME through the horizontal filter (Fig. 1a) with 3 different filtration rates of 100, 60 and 20 mL/min. In 107
order to create different flow rates, Masterflex pump with capacity of 2000 mL/min was used to carry POME from 108
the tank to the horizontal roughing filter. The filtration process was carried out by taking samples from the inlet and 109
the outlet both prior to and after the retention time for different filter media sizes and flow rates over seven successive 110
days. 111
Colour removal efficiency percentage from POME was calculate by the following equation: 112
113
P = @A'@B@A
× 100 (2) 114
115
where C0 (PtCo) and C1(PtCo) represent the concentration of colour in influent and effluent of POME, respectively. 116
117
118
2.3 Calcination Limestone Process 119
The natural limestone used in the experiment was produced by a marble factory in Ipoh, Malaysia. The limestone 120
is crushed into 3 different small sizes of 20, 12 and 4 mm. After that, they were sieved to be uniform in terms of size, 121
between 4 mm and 20 mm using a sieve. They were washed to remove any impurities and then dried at room 122
temperature for 24 hours. By means of a stainless-steel furnace with inner length and diameter of 1.5 cm and 2.5 cm, 123
respectively, and outer length of 50 cm. The furnace was equipped with 2 different gauges. One for adjusting gas flow 124
and the other one for controlling the temperature (Fig. 1b). A Teflon tube piped the furnace to the gas tank. In the 125
course of the calcination process, nitrogen gas (Well Gas Company) with the flowrate of 200 cm3/min was flowing to 126
the tank. A scanning electron microscope (SEM) (Carl Zeiss Supra -35 VP, Germany) was used to measure 127
morphology of the surface area for both raw and calcinated limestone. Moreover, to evaluate the total surface area 128
metrics such as pore volume and pore size, the Brunauer-Emmett-Teller (BET) process (ASTM D3037) was applied 129
for the three media. X-ray fluorescence (XRF) was also used to measure the elemental composition of all three media. 130
131
132

4
133
(a) 134
135
(b) 136
Fig. 1. Horizontal roughing filter schematic (a) and calcination experimental diagram (b). 137
138
2.4 Data Analysis 139
RSM was used to analyse the colour removal efficiency of POME. Two independent variables namely, the flow 140
rate (20-100 mL/min) and the limestone size (4-20 mm) were selected to obtain the colour removal efficiency. Each 141
experiment was run 13 times. Experimental range of each variable was between their minimum and maximum level 142
as requested by CCD. The colour removal efficiency was treated as the dependent response (Y). To recognize the 143
sufficiency of the models, both independent factors and dependent response were optimized using analysis of variance 144
(ANOVA). Similar to previous works, for quantifying the effects of two different factors, a second-order polynomial 145
quadratic model (3) was used (Fereidonian Dashti et al. 2018; Zhong et al. 2014; Hay et al. 2012). 146
147
𝑌 = 𝛽H +∑ 𝛽K𝑋K +∑ 𝛽KK𝑋KM +∑ ∑ 𝛽KN𝑋K𝑋N +⋯+ 𝑒Q
NQKRSN
QKT.
QKT. (3) 148
149
In (3), Y is the dependent parameter (colour) and 𝑋K and 𝑋N represent the independent parameters. Subscript 0 is a fixed 150
coefficient while the coefficients of higher order are denoted by i, ii, and ij. 151

5
3 Results and Discussion 152
3.1 POME Properties 153
154
The POME used was characterized by 4000 Pt Co colour, 2750 mg/L COD, pH 8.3 and 652 mg/L SS, and 155
collected from United Palm Oil Mill Sdn. Bhd in Nibong Tebal, Pulau Pinang of polishing pond (last pond of 156
biological treatment) as presented in Table 3. Generally, raw palm mill wastewater is acidic (pH 3 - 4) and high in 157
temperature. COD and BOD of fresh POME are in the range of 50,000 mg/L and 25,000 mg/L, respectively. Moreover, 158
SS and Dissolved Solids (DS) are remarkably high value components of POME (Garritano et al. 2018). Hence, the 159
polishing pond characteristics in the current work was different from the conventional raw POME. All the parameters 160
evaluated in this work were measured following the Standard Methods for Water and Wastewater Examination (APHA 161
2005). The temperature and the pH were measured in the field while ammonia nitrogen, turbidity, BOD, COD, colour 162
and SS were analyzed via laboratory analyses. Measuring the mentioned parameters supported physical treatment due 163
to the amount of BOD over COD which was less than 0.1 (UVW
XVW< 0.1). The concentration of
UVW
XVW revealed the rate of 164
degradation and biodegradability of wastewater organic components. To determine proper strategies for the 165
wastewater treatment plan, stable zone, biodegradable area, toxic region and finally the UVW
XVW zones proposed by 166
Samudro and Mangkoedihardjo (2010) were used. The amount of BOD and COD in the wastewater helps evaluate 167
the organic matter content in effluent, where an elevated UVW
XVW ratio demonstrates the incidence of biodegradation 168
(Huang et al. 2017; Aziz 2011). 169
170
171
3.2 Media Properties 172
Chemical components shown in Table 4 belong to XRF results of raw and calcinated limestone. According to 173
Table 4, the two main components of limestone are calcium oxide and magnesium oxide (Dashti et al. 2019). It is 174
concluded that calcinated limestone has fewer impurities (iron, silica) in comparison with raw limestone. The findings 175
of this work agree with the results from previous works (Wang et al. 2016; Ramezani et al. 2017). 176
177
178
3.3 Morphology Analysis of the Surface Area 179
A previous study (Côté and Konrad 2009) showed that the mechanical and porous properties of limestone are 180
quickly changed when the temperature rises from 200 °C to 500 °C. This is because, in the mentioned temperature 181
range, decomposition and expansion occur in minerals which cause water evaporation inside the stone. This 182
evaporation results in physical and chemical changes among some minerals (Cai et al. 2017; Ozguven and Ozcelik 183
2014) and these changes cause new cracks in the stone which generate, propagate and coalesce pores. When the 184
temperature rises from 500 °C to 600 °C, almost all amount of moisture in the limestone evaporates. A huge number 185
of stomata, cracks and powder are created, and only few unbroken crystal ribbons remain both during and at the end 186
of calcination process in 800 °C temperature (Chen et al. 2009; Kavosh 2015) as shown in Fig. 2. Furthermore, Chen 187
et al. (2009) validated that the occurrence of coalescence during the calcination process converted the smaller pores 188
into larger pores which improved the adsorption capability of the limestone. The porosity of the limestone was 189
reduced, and its apparent weight was increased in the temperature of above 1000 °C as validated by Kilic (2014). Fig. 190
2 depicts the morphologies of the raw and calcinated limestone in the temperature of 600°C and 800°C. BET results 191
show that surface area and total pore volume in calcinated limestone were higher than raw limestone as shown in 192
Table 5. These findings agree with previous research (Fereidonian Dashti et al. 2018; Chen et al. 2017). 193
194
195
196

6
197
(a) (b) 198
199
200
(c) 201
Fig. 2. The SEM images of (a) raw limestone; (b) calcinated limestone at 600 °C; and (c) calcinated limestone at 202
800 °C 203
204
3.4 Process Optimization of Colour Removal 205
In this study, the quadratic model was used to measure colour removal efficiency. The results of the Analysis 206
of Variance (ANOVA) for POME colour removal under different flowrates and sizes for raw and calcinated limestone 207
are shown in Tables 6, 7 and 8, respectively. The mean squares were afforded by dividing the sum of squares of every 208
two variations by the error of variance shown by the Degrees of Freedom (DF). The F-value of the different models 209
was assessed by dividing the mean squared of models by residual mean. The R2 coefficient represents the ratio of the 210
regression sum of squares to the total sum of squares. A R2 value close to 1 is a favourable and agrees with previous 211
research (Ghafari et al. 2009). A desired model could be achieved by minimum R2 value of 0.80 (Dashti et al. 2020 212

7
and Fereidonian Dashti et al. 2018). Meanwhile, the Lack-of-Fit (LoF) was insignificant. An insignificant LoF is 213
preferable because the primary objective of this study is to create a model that fits the experimental data (Dashti et al. 214
2019; Pambi and Musonge 2016). In this research due to pure error, all three models were insignificant for both the 215
calcinated and raw limestone response. Tables 6 to 8 report that the Coefficient of Variance (CV) ratio is less than 216
10% for all three quadratic models. It should be kept in mind that a CV more than 10 percent imply a reproducible 217
model. Comparing the average prediction error to the range of the predicted values at the design points is called 218
Adequate Precision (AP) and ratios greater than 4 indicate an adequate model discrimination. Moreover, predicted 219
models can be used to navigate the design space defined by the CCD when AP values are higher than 4 for the achieved 220
responses. According to the findings and based on (4) to (6), A (raw and calcinated limestone (mm), B (flow rate 221
ml/min) , and A2 were significant for all three models. Actual factors of models and trace the effect of their changes 222
in the process on removal efficiency of the colour in POME can be calculated by (4) to (6). Model adequacy is normally 223
evaluated by applying diagnostic plots provided by Design Expert software, such as the predicted versus actual value 224
and the normal residual probability plots in Fig. 3. The expected colour removal efficiency values achieved from the 225
actual experimental data and that of the model were in good agreement with 3 models (Bhatti et al. 2011; Wang et al. 226
2014). Fig. 4 illustrates the plot of disruption of the comparative effects of two independent variables on the efficiency 227
of colour removal for 3 models. In Fig. 4, a sharp curvature for the flow rate (mL/min) (A) and limestone particle size 228
(mm) (B) is observed, showing that the colour removal efficiency response was slightly sensitive to both process 229
variables. 230
231
Colour Removal %= 53.52 - 0.07A - 0.52B - 1.74A2 - 0.02B2 + 3.90AB (4) 232
Colour Removal% =54.97 + 0.57A - 3.19B - 5.32A2 + 0.10B2 - 3.90AB (5) 233
Colour Removal %= 67.66 + 0.12A - 2.46B - 2.39A2 + 0.04B2 + 3.12AB (6) 234
235
236
237
(a) (b) 238
333
Actual
Pre
dic
ted
Predicted vs. Actual
18.00
25.83
33.66
41.49
49.32
18.00 25.83 33.66 41.49 49.32
22
Actual
Pre
dic
ted
Predicted vs. Actual
27.00
34.84
42.67
50.51
58.34
27.00 34.84 42.67 50.51 58.34

8
239
(c) 240
Fig. 3. Actual predicted plot of colour removal using: (a) raw limestone; (b) calcinated limestone at 600 °C; and (c) 241
calcinated limestone at 800 °C 242
243
244
(a) (b) 245
22
Actual
Pre
dic
ted
Predicted vs. Actual
33.00
40.00
47.00
54.00
61.00
33.00 40.00 47.00 54.00 61.00
Perturbation
Deviation from Reference Point
Co
lou
r
-1.000 -0.500 0.000 0.500 1.000
18
26
34
41
49
A
A
B
B
Perturbation
Deviation from Reference Point
Colo
ur
-1.000 -0.500 0.000 0.500 1.000
27
35
43
51
58
A
A
B
B

9
246
(c) 247
Fig. 4. Colour removal plot using: (a) raw limestone; (b) calcinated limestone at 600 °C; and (c) calcinated 248
limestone at 800 °C 249
250
251
3.5 Performance of Filters 252
Table 2 lists the results of 36 runs for the CCD experimental design of all 3 models. 3-D plots are created to 253
investigate the effect of two factors namely, size and flow rate on the colour removal efficiency. According to the 254
results and based on (4) to (6), both particle size of limestone and flow rate have a significant effect on response. Fig. 255
5 shows that the colour removal efficiency increased with the reduction of flow rate and limestone particle size, which 256
agrees with the results reported by Daee et al. (2019) and Maung (2006). The optimum colour removal efficiencies 257
obtained by applying roughing filter with particle size of 4 mm and flow rate of 20 mL/min were 49% for raw 258
limestone, and 58% at 600 °C and 61% C at 800 °C for calcinated limestone, respectively. Therefore, increasing the 259
pore volume, the surface area of limestone and the temperature improve the colour removal efficiency, as also 260
validated by Chen et al. (2009). In the course of the roughing filter process some suspended particles were settled 261
through the settling process due to their gravity. A particle requires less time to travel along the settling distance and 262
stick to or absorb onto the media layer if the flow rate is faster (Khezri et al. 2015; Dastanai et al. 2007). Nkwonta 263
(2010) pointed out that the flow rate has a significant influence on colour removal. Effective colour removal in 264
roughing filters are achieved with low flow rates because low flow rates are critical to retain particles that are 265
gravitationally deposited to the surface of the media. Affam and Adlan (2013) investigated the removal of colour from 266
leachate using vertical up-flow filtration technique by combination of three different media sizes (i.e., 4-8 mm, 8-12 267
mm and 12-18 mm) and five different filtration rates (100 mL/min, 80 mL/min, 60 mL/min, 40 mL/min and 20 268
mL/min). The filter media were stacked in descending sizes from bottom to top for all experiments. The results showed 269
that removal efficiency was improved from 36% to 62% for colour removal at flow rate of 20 mL/min. 270
271
272
273
Perturbation
Deviation from Reference Point
Co
lou
r
-1.000 -0.500 0.000 0.500 1.000
33
40
47
54
61
A
A
B
B

10
274
275
(a) 276
277
278
(b) 279
280
e
18
26
34
42
49
C
olo
ur
20
40
60
80
100
4
8
12
16
20
A: Flow rate
B: Limestone
ne
28
35
43
51
59
C
olo
ur
20
40
60
80
100
4
8
12
16
20
A: Flow rate
B: Limestone

11
281
(c) 282
Fig. 5. Response surface for colour removal efficiency using: (a) raw limestone; (b) calcinated limestone at 600 °C; 283
and (c) calcinated limestone at 800 °C 284
285
286
3.6 Numerical Optimization 287
In this work, some parameters such as limestone size, temperature and flow rate have significant effects on 288
POME treatment and can improve colour removal efficiency for certain conditions. Therefore, in order to find the best 289
values of independent variables that present optimum values for colour removal, RSM was applied. Each of the 290
independent factors is exclusively tuned in an attempt to earn the optimum value for colour removal (Bashir et al. 291
2010; Hosseini 2012; Aziz et al. 2011; Ahmad et al. 2005). Table 9 shows the limitations of each variable and the 292
desired response. When desirability is 1 or close to 1, the best outcome of the experiment and the most optimum 293
conditions for each solution can be selected for further validation (Hosseini 2012). In this work, the range of flow rate 294
and size of limestone were from 20 to 100 mL/min and from 4 to 20 mm, respectively. As Table 9 reports, optimum 295
removal efficiency and desirability were achieved by the lower range of limestone size (4 mm) and flow rate (20 296
mL/min). Table 9 also reports that the responses of different model predictions are closely agreeing with the results 297
of laboratory experiment. 298
299
300
3.7 Adsorption Isotherms 301
Qualitative information of the special relation between the amount of adsorbate mass on the surface of 302
adsorbent and the concentration of adsorbent in addition to the kind of solute-surface interaction are described by 303
adsorption isotherms (Khandaker et al. 2020). The current work used two different isotherms, namely Freundlich and 304
Langmuir, to fit the equilibrium data acquired from the actual experiments. Theoretically, the assumption of the 305
Langmuir isotherm is that the adsorbate covers the homogeneous surface of adsorbent in a monolayer (Jawad et al. 306
2020). The Langmuir isotherm is presented in (7): 307
33
40
47
54
61
C
olo
ur
20
40
60
80
100
4
8
12
16
20 A: Flow rate
B: Limestone

12
.
[/\= .
]^X_+ .
] (7) 308
309
In (7), the rate of adsorption, adsorption capacity, adsorbate equilibrium concentration and the quantity of adsorbate 310
are denoted by b (L/mg), Q (mg/g), Ce (mg/L) and x/m (qe) (mg/g), respectively. According to Table 10, the Langmuir 311
model sufficiently fits the equilibrium data. The equilibrium parameter (RL) (Balark et al. 2017) can also be used to 312
explain the Langmuir isotherm features (8): 313
𝑅a =.
(.b^XA) (8) 314
315
In (8), the initial colour concentration and the Langmuir constant are denoted by C0 (mg/L) and b, respectively. 316
Isotherms can be categorized into three different categories based on the value of favorable (RL<1), linear (RL = 1), 317
and unfavorable (RL>1) (Isa et al. 2007). Table 10 shows favorable adsorption process for colour for all types of 318
limestone. The main underlying theory of the Freundlich isotherm model is the assumption that the adsorption process 319
occurs on heterogeneous surfaces and can be presented as the empirical (9) (Dashti et al. 2020): 320
321
322
𝑙𝑜𝑔 𝑞g = 𝑙𝑜𝑔𝐾 + .i𝑙𝑜𝑔 𝐶g (9) 323
324
where, qe = colour amount adsorbed per unit of mass adsorbent (mg/g); Ce = adsorbate equilibrium (mg/L); n = 325
adsorption intensity; and K = adsorption capacity (mg/g). A favorable adsorption mechanism (.
i < 1) increases 326
adsorption capacity while a weak adsorption capacity is the result of an unfavorable adsorption mechanism (.
i > 1) 327
(Aziz et al. 2008 and Hossain et al. 2019). R2 and K values for the Freundlich isotherm based on linear regression 328
correlation (9) are listed in Table 11 and are shown in Fig. 7. Findings of this work validated that the Langmuir 329
isotherm model fits the experimental data better than the other model (Fig 6). Another outcome is that the colour 330
coated the surface of the adsorbent in a monolayer fashion and homogenously. This is caused by the higher R2 value 331
acquired using Langmuir isotherm (0.735) compared with the Freundlich isotherm (0.622) (Fig. 6 and 7). Keong 332
(2012) achieved colour removal of leachate (Q) equal to 1.070 Pt Co/g and 0.065 Pt Co/g; and b values of 5.36×10⁻³ 333
/Pt Co and 5.44×10⁻³ /Pt Co for calcinated limestone at 400 ̊ C and 200 ̊ C, respectively. The values of R2 for Freundlich 334
model were 0.751 and 0.605 in comparison to Langmuir model which were 0.502 and 0.376 for calcinated limestone 335
at 400 ˚C and 200 ˚C. Pala and Erden (2004) used lime for leachate treatment. They found out that Langmuir isotherm 336
was more satisfactory (R2=0.97) for colour removal compared to Freundlich model. 337
338

13
339
(a) 340
341
(b) (c) 342
Fig 6. Langmuir Isotherm for Colour adsorption: (a) raw limestone, calcinated limestone at 600 ˚C; (b) 343
and calcinated limestone at 800 ˚C; (c) 344
345
y = -794855x + 1442.6
R² = 0.6411
10801090110011101120113011401150116011701180
0.0000 0.0001 0.0002 0.0003 0.0004 0.0005
1/q
e
1/Ce
y = -493978x + 1103.8
R² = 0.7085
850
860
870
880
890
900
910
920
930
0.0000 0.0002 0.0004 0.0006
1/q
e
1/Ce
y = -356460x + 888.74
R² = 0.735
680
690
700
710
720
730
740
750
760
770
0.0000 0.0002 0.0004 0.0006
1/q
e
1/Ce

14
346
(a) 347
348
(b) (c) 349
Fig 7. Freundlich Isotherm for colour adsorption: (a) raw limestone, calcinated limestone at 600 ˚C; 350
(b) and calcinated limestone at 800 ˚C; (c) 351
352
353
y = -0.2486x - 2.2047
R² = 0.6053
-3.07
-3.07
-3.06
-3.06
-3.05
-3.05
-3.04
-3.04
3.34 3.36 3.38 3.40 3.42 3.44
Log x
/m
Log Ce
y = -0.1046x - 2.513
R² = 0.6065
-2.89
-2.88
-2.87
-2.86
-2.85
-2.84
-2.83
3.00 3.10 3.20 3.30 3.40 3.50
Log x
/m
Log ce
y = -0.2422x - 2.1351
R² = 0.6229
-2.97
-2.96
-2.96
-2.95
-2.95
-2.94
-2.94
-2.93
3.30 3.35 3.40 3.45
Log x
/m
Log ce

15
4. Conclusions 354
This research focused on development of a low-cost, eco-friendly and functionalized material to remove colour 355
from palm oil mill effluent (POME). More specifically, the optimum conditions of colour removal from polished 356
POME were investigated using calcinated and raw limestone in a horizontal roughing filter process as filter media. 357
The interaction between the variables (flow rate and limestone size) and experimental parameter had been used to 358
enhance the colour removal using response surface methodology. Optimum variables, according to the model, 359
consisted of calcinated limestone at 800 ℃ with the size of 4 mm and a flow rate of 20 mL/min. The mentioned settings 360
led to 61% colour removal, while only 18% was achieved when using raw limestone with the size of 20 mm and flow 361
rate of 100 mL/min. A particle requires less time to travel along the settling distance and stick to or absorb onto the 362
media layer if the flow rate is fast. According to the achieved results, when the size of filter media is small and the 363
flow rate is low, more colour removal is achieved. Furthermore, the Langmuir isotherm yielded R2 of 0.735 and fitted 364
well the adsorption data in this study. 365
366
367
368
Acknowledgements 369
370
This research was awarded Universiti Sains Malaysia Short-Term Grant (Grant No. 304/ PAWAM/60311001). 371
which is belong to the Solid Waste Management group, Engineering Campus, USM. 372
373
Conflict of Interest 374
The authors notify that there are no conflicts of interest. 375
376
Availability of data and materials 377
All authors agreed that all data and materials as well as software support our published and comply with 378
field standards 379
380
Declarations 381
382
The authors declare that they have no known competing financial interests or personal relationships that 383
could have appeared to influence the work reported in this paper. The research leading to these results 384
received funding from Universiti Sains Malaysia Short-Term Grant under Grant Agreement No (304/ 385
PAWAM/60311001) 386
387
Authors' contributions 388
Formal analysis and investigation; Writing - original draft preparation: Dr. Arezoo Fereidonian Dashti 389
Supervisor and co-supervisor: Prof. Mohd Nordin Adlan; Prof. Hamidi Abdul Aziz 390
Methodology: Ali Huddin Ibrahim 391
392

16
393
Abbreviations and Chemical Symbols 394
395
396
397
398
399
400
401
402
403
404
405
406
407
408
409
410
411
412
413
414
415
416
417
418
419
420
421
422
423
ANOVA Analysis of variance
AP Adequate Precision APHA American Public Health Association
AWWA American Water Works Association
BET Brunauer-Emmett-Teller
BOD Biological oxygen demand CaO Lime
CaCo3 Calcium Carbonate
COD Chemical oxygen demand ºC Degrees celsius
CCD Central composite design
CL Calcinated limestone
CV Coefficient of variance DOE Department of Environment
Fe2O3 Ferric oxide
Fig Figure g Grams
ha Hectare
HRF Horizontal roughing filter HRT Hydraulic retention time
Kg Kilogram
L Liters
LOF Lack of Fit LS Limestone
Mm Millimeters
Mg/L Milligrams per liter MgO Magnesium oxide
m2/g Square meter per gram
% Percent POME Palm oil mill effluent
pH Potential hydrogen
RL Raw Limestone
RSM Response Surface Methodology SD Standard deviation
SEM Scanning electron microscopy
SiO2 Silicon dioxide SS Suspended Solid
XRD X-Ray Diffraction
Cc/g Cubic centimeter per gram

17
References 424
Affam AC, Adlan MN (2013) Operational performance of vertical up flow roughing filter for pre-treatment of leachate 425
using limestone filter media. J. Urban. Environ. Eng 7(1):117-125. https://www.jstor.org/stable/26203395 426
APHA AWWA WPCF, Standard Methods for Examination of Water and Wastewater, Washington, DC (2005). 427
Ahmad A, Ismail S, Bhatia S (2005) Membrane treatment for palm oil mill effluent: effect of transmembrane pressure 428
and crossflow velocity. Desalination 179 (1-3): 245-255. https://doi.org/10.1016/j.desal.2004.11.071 429
Aziz SQ, Aziz HA, Yusoff MS, Bashir MJ (2011) Landfill leachate treatment using powdered activated carbon 430
augmented sequencing batch reactor (SBR) process: Optimization by response surface methodology. J. Hazard. Mater 431
189 (1-2): 404-413. https://doi.org/10.1016/j.jhazmat.2011.02.052 432
Aziz HA, Adlan MN, Ariffin KS (2008) Heavy metals (Cd, Pb, Zn, Ni, Cu and Cr (III)) removal from water in 433
Malaysia: Post treatment by high quality limestone Bioresour. Technol 99 (6): 1578-1583. 434
https://doi.org/10.1016/j.biortech.2007.04.007 435
Bakar SNHA, Hasan HA, Mohammad AW, Abdullah SRS, Haan TY, Ngteni R, Yusof KMM (2018) A review of 436
moving-bed biofilm reactor technology for palm oil mill effluent treatment. J. Clean. Prod 171: 1532-1545. 437
https://doi.org/10.1016/j.jclepro.2017.10.100 438
Balark D, Mostafapour FK, Azarpira H, Joghataei A (2017) Langmuir, Freundlich, Temkin and Dubinin– 439
radushkevich isotherms studies of equilibrium sorption of ampicilin unto montmorillonite nanoparticles. J. Pharm. 440
Res. Int 20 (2): 1-9. 10.9734/JPRI/2017/38056 441
442
Bashir MJ, Lim JH, Amr SSA, Wong LP, Sim YL (2019) Post treatment of palm oil mill effluent using electro-443
coagulation-peroxidation (ECP)technique. J.Clean. Prod 208: 716-727. https://doi.org/10.1016/j.jclepro.2018.10.073 444
Bashir MJ, Aziz HA, Yusoff MS, Adlan MN (2010) Application of response surface methodology (RSM) for 445
optimization of ammoniacal nitrogen removal from semi-aerobic landfill leachate using ion exchange resin. 446
Desalination 254 (1-3): 154-161. https://doi.org/10.1016/j.desal.2009.12.002 447
Bello MM, Raman AAA (2017) Trend and current practices of palm oil mill effluent polishing: Application of 448
advanced oxidation processes and their future perspectives. J. Environ. Manage 198: 170-182. 449
https://doi.org/10.1016/j.jenvman.2017.04.050 450
Bhatti MS, Kapoor D, Kalia RK, Reddy AS, Thukral AK (2011) RSM and ANN modeling for electrocoagulation of 451
copper from simulated wastewater: Multi objective optimization using genetic algorithm 452
approach. Desalination 274(1-3): 74-80. https://doi.org/10.1016/j.desal.2011.01.083 453
Cai J, Wang S, Kuang C (2017) A modified random pore model for carbonation reaction of CaO-based limestone with 454
CO2 in different calcination-carbonation cycles. Energy Procedia 105:1924-1931. 455
https://doi.org/10.1016/j.egypro.2017.03.561 456
Chen LJ, Jun H, Chao JQ, Qin BD (2009) Swelling and breaking characteristics of limestone under high temperatures. 457
J Min Sci Technol (China) 19 (4): 503-507. https://doi.org/10.1016/S1674-5264(09)60094-6 458
Chen L, Wang C, Wang Z, Anthony EJ (2017) The kinetics and pore structure of sorbents during the simultaneous 459
calcination/sulfation of limestone in CFB. Fuel 208: 203-213. https://doi.org/10.1016/j.fuel.2017.07.018 460
18
Chung CY, Selvarajoo A, Sethu V, Koyande AK, Arputhan A, Lim ZC (2018) Treatment of palm oil mill effluent 461
(POME) by coagulation flocculation process using peanut–okra and wheat germ–okra. Clean Technol Environ 462
Policy 20(9):1951-1970.https://doi.org/10.1007/s10098-018-1619-y 463
464
Côté J, Konrad JM (2009) Assessment of structure effects on the thermal conductivity of two-phase porous 465
geomaterials. Int J Heat Mass Tran 52(3-4): 796-804. https://doi.org/10.1016/j.ijheatmasstransfer.2008.07.037 466
Dashti AF, Aziz HA, Ibrahim AH, Zahed MA (2020) Suspended Solid Removal of Palm Oil Mill Effluent Using 467
Horizontal Roughing Filter and Calcinated Limestone. Water Air Soil Pollut 231(8):1-468
15. https://doi.org/10.1007/s11270-020-04755-z 469
Dashti AF, Aziz HA, Adlan MN, Ibrahim AH (2019) Calcined limestone horizontal roughing filter for treatment of 470
palm oil mill effluent polishing pond. Int J Environ Sci Technol 16(10): 6419-6430. https://doi.org/10.1007/s13762-471
019-02467-4 472
Daee M, Gholipour A, Stefanakis AI (2019) Performance of pilot Horizontal Roughing Filter as polishing stage of 473
waste stabilization ponds in developing regions and modelling verification. Ecol. Eng 138: 8-18. 474
https://doi.org/10.1016/j.ecoleng.2019.07.007 475
Dastanaie AJ, Bidhendi GN, Nasrabadi T, Habibi R, Hoveidi H (2007) Use of horizontal flow roughing filtration in 476
drinking water treatment. Int J Environ Sci Technol 4(3): 379-382. https://doi.org/10.1007/BF03326297 477
Fereidonian Dashti A, Adlan MN, Abdul Aziz H, Ibrahim AH (2018) Application of response surface methodology 478
(RSM) for optimization of ammoniacal nitrogen removal from palm oil mill wastewater using limestone roughing 479
filter. J. appl. res. water wastewater 5(1): 411-416. 10.22126/ARWW.2018.892 480
Garritano AN, de Oliveira Faber M, De Sá LR, Ferreira-Leitão VS (2018) Palm oil mill effluent (POME) as raw 481
material for biohydrogen and methane production via dark fermentation. Renew. Sustain. Energy Rev 92: 676-684. 482
https://doi.org/10.1016/j.rser.2018.04.031 483
Ghafari S, Aziz HA, Isa MH, Zinatizadeh AA (2009) Application of response surface methodology (RSM) to optimize 484
coagulation–flocculation treatment of leachate using poly-aluminum chloride (PAC) and alum. J. Hazard. Mater 485
163(2-3): 650-656. https://doi.org/10.1016/j.jhazmat.2008.07.090 486
Hayawin ZN, Ibrahim MF, Faizah JN, Ropandi M, Astimar AA, Noorshamsiana AW, Abd-Aziz S (2020) Palm oil 487
mill final discharge treatment by a continuous adsorption system using oil palm kernel shell activated carbon produced 488
from two-in-one carbonization activation reactor system. J. Water Process. Eng 36: 101262. 489
https://doi.org/10.1016/j.jwpe.2020.101262 490
Hay JXW, Wu TY, Teh CY, Jahim JM (2012) Optimized growth of Rhodobacter sphaeroides using response surface 491
methodology (RSM). J Sci Ind Res 71 (2): 149–154. http://hdl.handle.net/123456789/13493 492
Hossain MS, Omar F, Asis AJ, Bachmann RT, Sarker MZI, Ab Kadir MO (2019) Effective treatment of palm oil mill 493
effluent using FeSO4. 7H2O waste from titanium oxide industry: Coagulation adsorption isotherm and kinetics 494
studies. J. Clean. Prod 219: 86-98. https://doi.org/10.1016/j.jclepro.2019.02.069 495
Huang D, Hu C, Zeng G, Cheng M, Xu P, Gong X, Xue W (2017) Combination of Fenton processes and biotreatment 496
for wastewater treatment and soil remediation. Sci. Total Environ 574: 1599-1610. 497
https://doi.org/10.1016/j.scitotenv.2016.08.199 498
499
Isa MH, Lang LS, Asaari FAH, Aziz HA, Ramli NA, Dhas JPA (2007) Low cost removal of disperse dyes from 500
aqueous solution using palm ash. J. Dyes Pigm 74(2): 446-453. https://doi.org/10.1016/j.dyepig.2006.02.025 501

19
Jagaba AH, Kutty SRM, Hayder G, Latiff AAA, Aziz NAA, Umaru I, Ghaleb AA, Abubakar S, Lawal IM, Nasara 502
MA (2020) Sustainable use of natural and chemical coagulants for contaminants removal from palm oil mill effluent: 503
A comparative analysis. Ain Shams Eng. J 11(4): 951-960. https://doi.org/10.1016/j.asej.2020.01.018 504
505
Jawad AH, Mubarak NSA, Abdulhameed AS (2020) Hybrid Crosslinked Chitosan-Epichlorohydrin/TiO 2 506
Nanocomposite for Reactive Red 120 Dye Adsorption: Kinetic, Isotherm, Thermodynamic, and Mechanism Study. J 507
Polym Environ 28(2): 624-637. https://doi.org/10.1007/s10924-019-01631-8 508
509
Kavosh M, Patchigolla K, Oakey JE, Anthony EJ, Champagne S, Hughes R (2015) Pressurised calcination–510
atmospheric carbonation of limestone for cyclic CO2 capture from flue gases. Chem Eng Res Des 102: 116-123. 511
https://doi.org/10.1016/j.cherd.2015.06.024 512
Keong CW (2012) Treatment of Semi Aerobic Leachate by Calcinated Limestone. M.Sc, Universiiy sains Malaysia. 513
Khazaei M, Nabizadeh R, Mahvi AH, Izanloo H, Ansari Tadi R, Gharagazloo F (2016) Nitrogen and phosphorous 514
removal from aerated lagoon effluent using horizontal roughing filter (HRF). Desalination Water Treat 57(12): 5425-515
5434. https://doi.org/10.1080/19443994.2014.1003100 516
517
Khezri SM, Majidi G, Jafari Mansoorian H, Ansari M, Atabi F, Tohidi Mogaddam T, Rashtchi N (2015) Efficiency 518
of horizontal roughing filter in removing nitrate, phosphate and chemical oxygen demand from effluent of waste 519
stabilization pond. Environ. Health Eng. Manag 2(2): 87-92. https://ssrn.com/abstract=2662795 520
Khandaker S, Toyohara Y, Saha GC, Awual MR, Kuba T (2020) Development of synthetic zeolites from bio-slag for 521
cesium adsorption: Kinetic, isotherm and thermodynamic studies. J. Water Process. Eng 33: 101055. 522
https://doi.org/10.1016/j.jwpe.2019.101055 523
Kilic O (2014) Application of ultrasonic velocity measurement and thermal analysis for determination of limestone 524
quality. J. Physicochem. Probl. Miner. Process. 50(2): 525-534. 10.5277/ppmp140209 525
Kim ITS, Sethu V, Arumugasamy SK, Selvarajoo A (2020) Fenugreek seeds and okra for the treatment of palm oil 526
mill effluent (POME)–Characterization studies and modeling with backpropagation feed forward neural network 527
(BFNN). J. Water Process. Eng 37: 101500. https://doi.org/10.1016/j.jwpe.2020.101500 528
529
Lawal AA, Hassan MA, Farid MAA, Yasim-Anuar TAT, Yusoff MZM, Zakaria MR, Roslan AM, Mokhtar MN, 530
Shirai Y (2020) Production of biochar from oil palm frond by steam pyrolysis for removal of residual contaminants 531
in palm oil mill effluent final discharge. J. Clean. Prod 265: 121643. https://doi.org/10.1016/j.jclepro.2020.121643 532
533
Lek BLC, Peter AP, Chong KHQ, Ragu P, Sethu V, Selvarajoo A, Arumugasamy SK (2018) Treatment of palm oil 534
mill effluent (POME) using chickpea (Cicer arietinum) as a natural coagulant and flocculant: Evaluation, process 535
optimization and characterization of chickpea powder. J. Environ. Chem. Eng 6(5): 6243-6255. 536
https://doi.org/10.1016/j.jece.2018.09.038 537
Limkhuansuwan V, Chaiprasert P (2010) Decolorization of molasses melanoidins and palm oil mill effluent phenolic 538
compounds by fermentative lactic acid bacteria. J Environ Sci 22(8): 1209-1217. https://doi.org/10.1016/S1001-539
0742(09)60240-0 540
Lin E, Page D, Pavelic P (2008) A new method to evaluate polydisperse kaolinite clay particle removal in roughing 541
filtration using colloid filtration theory. Water Res 42(3): 669-676. https://doi.org/10.1016/j.watres.2007.08.018 542

20
Mat Yasin NMF, Hossain M, HPS AK, Zulkifli M, Al-Gheethi A, Asis AJ, Yahaya ANA (2020) Treatment of Palm 543
Oil Refinery Effluent Using Tannin as a Polymeric Coagulant: Isotherm, Kinetics, and Thermodynamics 544
Analyses. Polymer 12(10): 2353. https://doi.org/10.3390/polym12102353 545
Maung (2006) A Study on The Performance of Limestone Roughing Filter For the Removal of Turbidity, Suspended 546
Solids, Biochemical Oxygen Demand and Coliform Organisms Using Wastewater from The Inlet of Domestic 547
Wastewater Oxidation Pond. M.Sc, University Sains Malaysia. 548
Nkwonta O (2010) A comparison of horizontal roughing filters and vertical roughing filters in wastewater treatment 549
using gravel as a filter media. Phys. Sci. Int. J 5(8): 1240-1247. http://www.academicjournals.org/IJPS 550
Nasrullah M, Singh L, Mohamad Z, Norsita S, Krishnan S, Wahida N, Zularisam AW (2017) Treatment of palm oil 551
mill effluent by electrocoagulation with presence of hydrogen peroxide as oxidizing agent and polialuminum chloride 552
as coagulant-aid. Water Resour. Ind 17: 7-10. https://doi.org/10.1016/j.wri.2016.11.001 553
Nahrul HZ, Nor FJ, Ropandi M, Astimar AA (2017) A review on the development of palm oil mill effluent (POME) 554
final discharge polishing treatments. J. Oil Palm Res 29(4): 528-540. 10.21894/jopr.2017.00012 555
Ochieng GM, Otieno FAO (2006) Verification of Wegelin's design criteria for horizontal flow roughing filters (HRFs) 556
with alternative filter material. Water SA 32(1): 105-109. 10.4314/wsa.v32i1.5230 557
Ozguven A, Ozcelik Y (2014) Effects of high temperature on physico-mechanical properties of Turkish natural 558
building stones. Eng. Geol 183: 127-136. https://doi.org/10.1016/j.enggeo.2014.10.006 559
Pala A, Erden G (2004) Chemical pretreatment of landfill leachate discharged into municipal biological treatment 560
systems. Environ. Eng. Sci 21(5): 549-557. https://doi.org/10.1089/ees.2004.21.549 561
Pambi R, Musonge P (2016) Application of response surface methodology (RSM) in the treatment of final effluent 562
from the sugar industry using Chitosan. WIT Trans. Ecol. Environ 209: 209-219. 563
Ramezani M, Tremain P, Doroodchi E Moghtaderi B (2017) Determination of carbonation/calcination reaction 564
kinetics of a limestone sorbent in low CO2 partial pressures using TGA experiments. Energy Procedia 114: 259-270. 565
https://doi.org/10.1016/j.egypro.2017.03.1168 566
Ratpukdi T (2012) Decolorization of anaerobically treated palm oil mill wastewater using combined coagulation and 567
vacuum ultraviolet-hydrogen peroxide. Int. J. Chem. Eng 3(5), 333. DOI:10.7763/IJCEA 568
Saeed MO, Azizli K, Isa MH, Bashir MJ (2015) Application of CCD in RSM to obtain optimize treatment of POME 569
using Fenton oxidation process. J. Water Process. Eng 8: e7-e16. https://doi.org/10.1016/j.jwpe.2014.11.001 570
Samudro G, Mangkoedihardjo S (2010) Review on Bod, Cod And BOD/COD Ratio: A Triangle Zone for Toxic, 571
Biodegradable and Stable Levels. Int. J. Acad. Res 2(4). 572
Sani S, Dashti AF, Adnan R (2020) Applications of Fenton oxidation processes for decontamination of palm oil mill 573
effluent: A review. Arab. J. Chem 13(10): 7302-7323. https://doi.org/10.1016/j.arabjc.2020.08.009 574
Wang G, Wen Z, Lou G, Dou R, Li X, Su F (2016) Mathematical modeling and combustion characteristic evaluation 575
of a flue gas recirculation iron ore sintering process. Int. J. Heat Mass Transf 97: 964–974. 576
https://doi.org/10.1016/j.ijheatmasstransfer.2016.02.087 577
Wang J, Yang T, Tian J, Liu W, Jing F, Yao J, Lei Z (2014) Optimization of reaction conditions by RSM and structure 578
characterization of sulfated locust bean gum. Carbohydr. Polym 114: 375-383. 579
https://doi.org/10.1016/j.carbpol.2014.08.035 580

21
Watanabe Y, Kawamoto A, Matsuda K (2002) Particle size distributions in functionally graded materials fabricated 581
by the centrifugal solid-particle method. Composites science and Technology, 62(6), 881-888. 582
https://doi.org/10.1016/S0266-3538(02)00023-4 583
Zhang W, Sun Q, Zhu S, Wang B (2017) Experimental study on mechanical and porous characteristics of limestone 584
affected by high temperature. Appl. Therm. Eng 110: 356-362. https://doi.org/10.1016/j.applthermaleng.2016.08.194 585
Zeng J, Chen S, Wan K, Li J, Hu D, Zhang S, Yu X (2018) Study of biological up-flow roughing filters designed for 586
drinking water pretreatment in rural areas: using ceramic media as filter material. Environ. Technol 41(10): 1256-587
1265 https://doi.org/10.1080/09593330.2018.1530304 588
Zhong J, Zhang X, Ren Y, Yang J, Tan H, Zhou J (2014) Optimization of Bacillus subtilis cell growth effecting jiean-589
peptide production in fed batch fermentation using central composite design. Electron. J. Biotechnol 17: 132–136. 590
http://dx.doi.org/10.1016/j.ejbt 591
592
Figures
Figure 1
Horizontal roughing �lter schematic (a) and calcination experimental diagram (b).

Figure 2
The SEM images of (a) raw limestone; (b) calcinated limestone at 600 °C; and (c) calcinated limestone at800 °C

Figure 3
Actual predicted plot of colour removal using: (a) raw limestone; (b) calcinated limestone at 600 °C; and(c) calcinated limestone at 800 °C

Figure 4
Colour removal plot using: (a) raw limestone; (b) calcinated limestone at 600 °C; and (c) calcinatedlimestone at 800 °C

Figure 5
Response surface for colour removal e�ciency using: (a) raw limestone; (b) calcinated limestone at 600°C; and (c) calcinated limestone at 800 °C

Figure 6
Langmuir Isotherm for Colour adsorption: (a) raw limestone, calcinated limestone at 600 ˚C; (b) andcalcinated limestone at 800 ˚C; (c)

Figure 7
Freundlich Isotherm for colour adsorption: (a) raw limestone, calcinated limestone at 600 ˚C; (b) andcalcinated limestone at 800 ˚C; (c)
Supplementary Files

This is a list of supplementary �les associated with this preprint. Click to download.
ListofTables.docx