Embed Size (px)
Citation preview
Performance of the National Air Quality Performance of the National Air Quality Forecast Capability, Urban vs. Rural Forecast Capability, Urban vs. Rural
and Other Comparisonsand Other ComparisonsJerry Gorline and Jeff McQueenJerry Gorline and Jeff McQueen
Jerry Gorline, NWS/OST/MDLJerry Gorline, NWS/OST/MDL
Meteorological Development LaboratoryMeteorological Development Laboratory
NOAA, Silver Spring, MarylandNOAA, Silver Spring, Maryland
Jeff McQueen, NWS/NCEPJeff McQueen, NWS/NCEP
National Centers for Environmental PredictionNational Centers for Environmental Prediction
NOAA, Camp Springs, MarylandNOAA, Camp Springs, Maryland
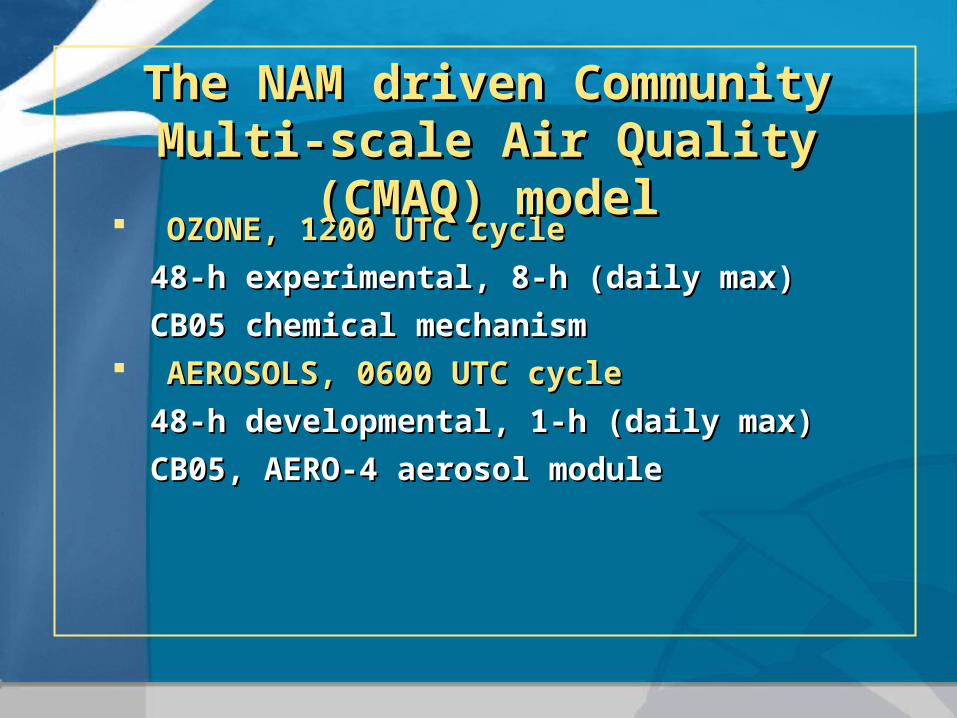
OZONE, 1200 UTC cycleOZONE, 1200 UTC cycle
48-h experimental, 8-h (daily max)48-h experimental, 8-h (daily max)
CB05 chemical mechanismCB05 chemical mechanism AEROSOLS, 0600 UTC cycleAEROSOLS, 0600 UTC cycle
48-h developmental, 1-h (daily max)48-h developmental, 1-h (daily max)
CB05, AERO-4 aerosol moduleCB05, AERO-4 aerosol module
The NAM driven Community Multi-The NAM driven Community Multi-scale Air Quality (CMAQ) modelscale Air Quality (CMAQ) model
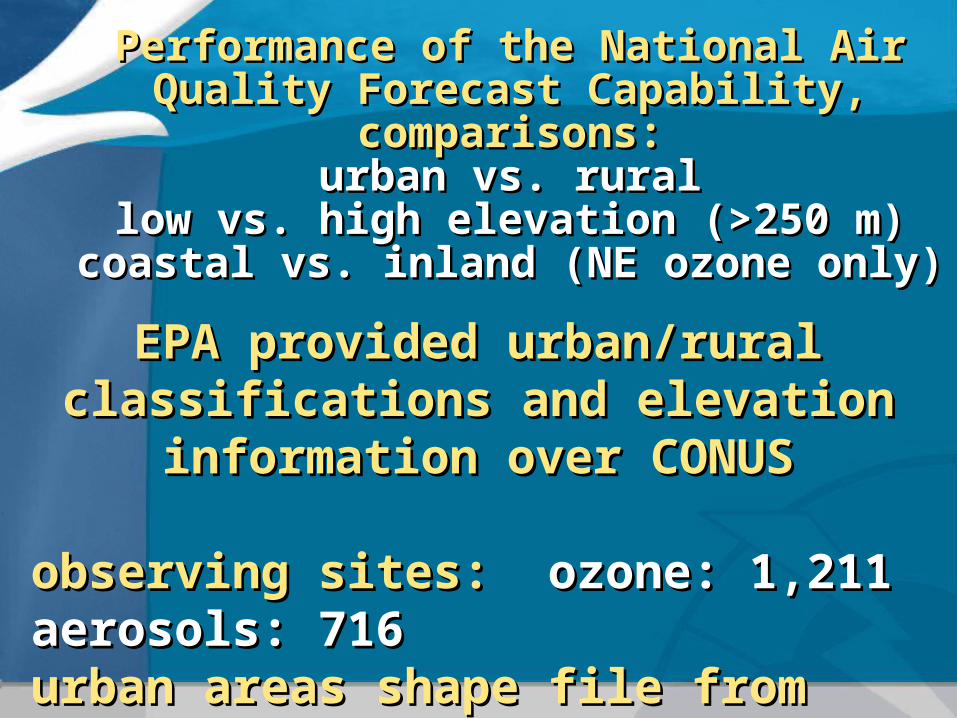
EPA provided urban/rural classifications EPA provided urban/rural classifications and elevation information over CONUSand elevation information over CONUS
observing sites: observing sites: ozone: 1,211 aerosols: 716ozone: 1,211 aerosols: 716urban areas shape file from U.S. Censusurban areas shape file from U.S. Census note: these results are preliminarynote: these results are preliminary
Performance of the National Air Quality Performance of the National Air Quality Forecast Capability, comparisons:Forecast Capability, comparisons:
urban vs. ruralurban vs. rurallow vs. high elevation (>250 m)low vs. high elevation (>250 m)
coastal vs. inland (NE ozone only)coastal vs. inland (NE ozone only)
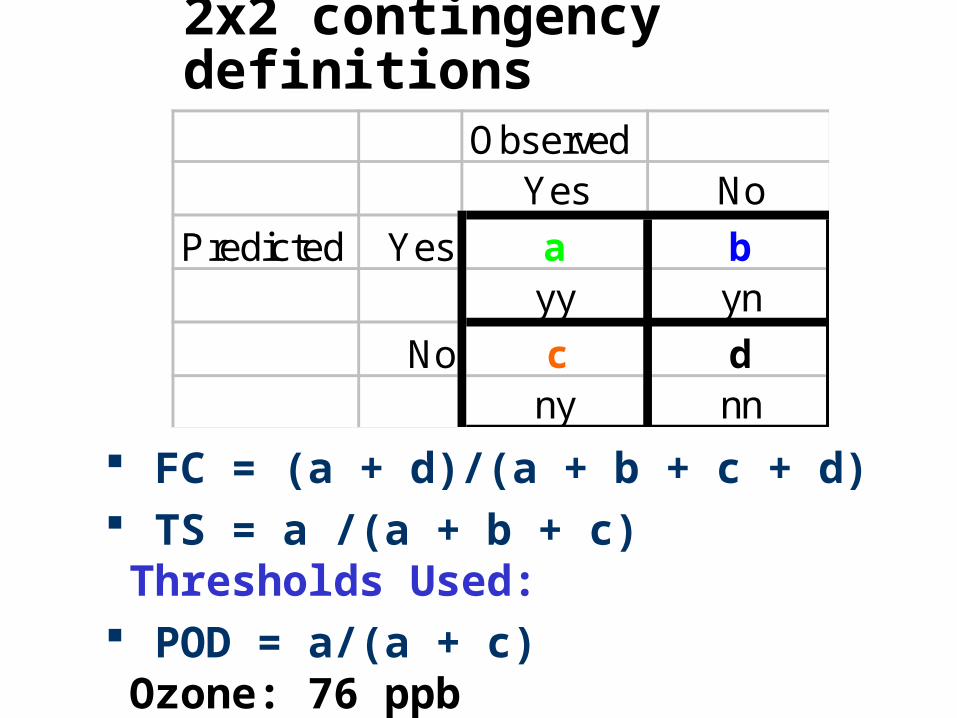
2x2 contingency definitions
ObservedYes No
Predicted Yes a byy yn
No c dny nn
FC = (a + d)/(a + b + c + d) TS = a /(a + b + c) Thresholds Used: POD = a/(a + c) Ozone: 76 ppb FAR = b/(a + b) Aerosols: 35 ug/m3
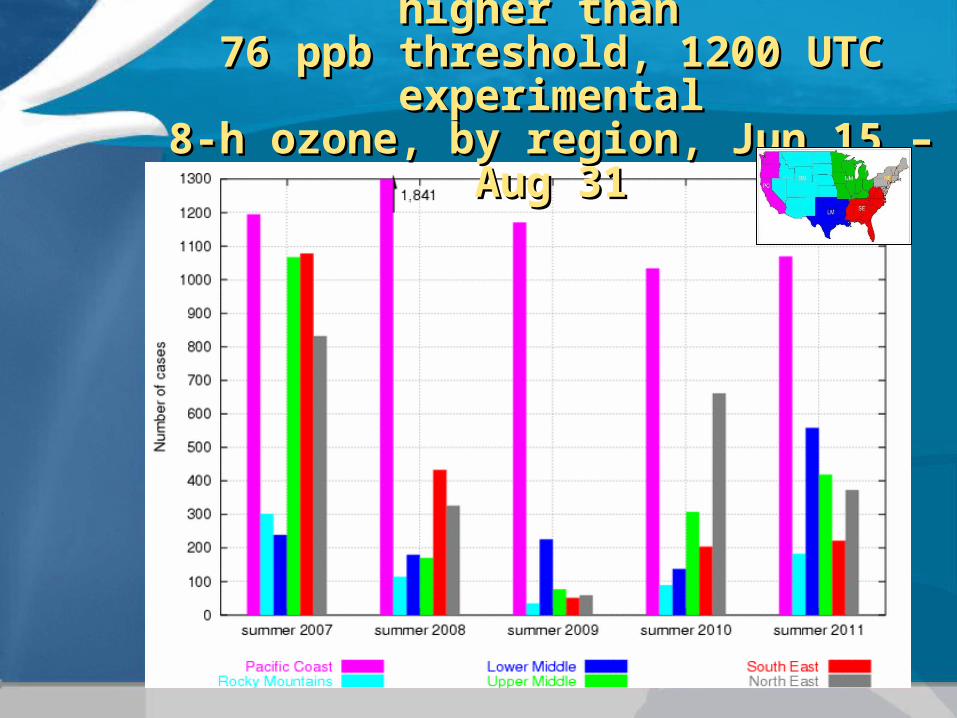
Number of observed values higher than Number of observed values higher than 76 ppb threshold, 1200 UTC experimental76 ppb threshold, 1200 UTC experimental
8-h ozone, by region, Jun 15 – Aug 318-h ozone, by region, Jun 15 – Aug 31
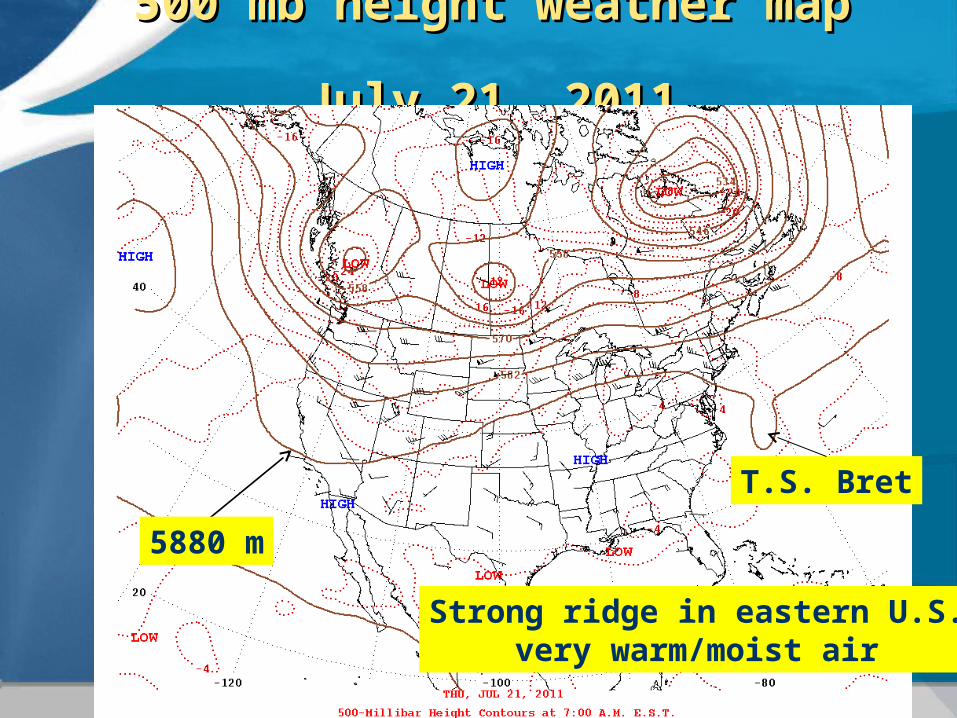
500 mb height weather map 500 mb height weather map July 21, 2011July 21, 2011
Strong ridge in eastern U.S.very warm/moist air
T.S. Bret
5880 m
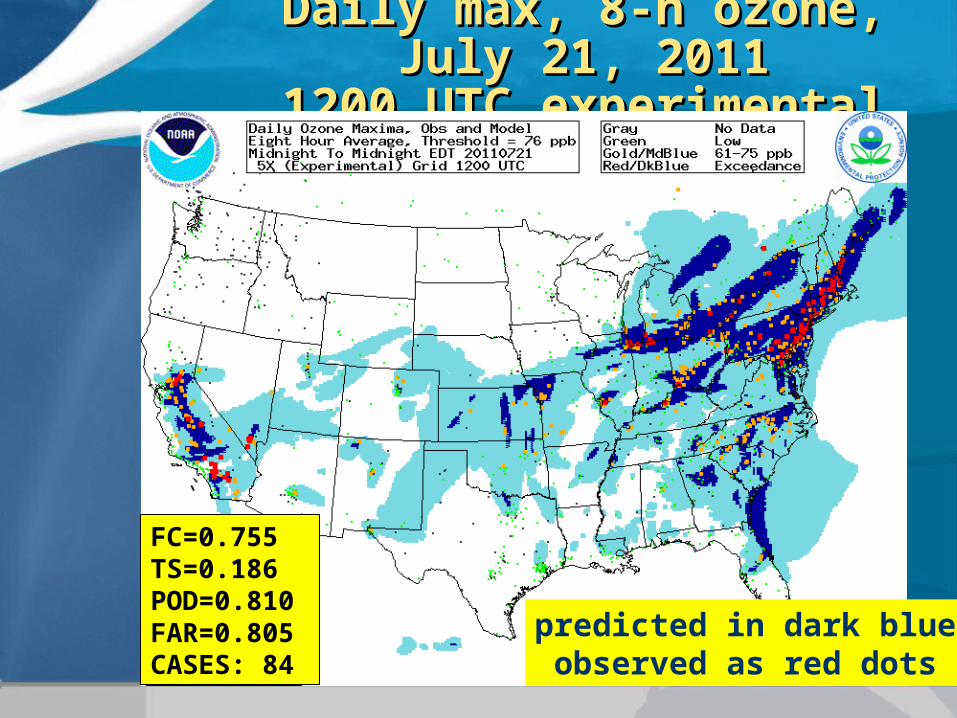
Daily max, 8-h ozone, July 21, 2011Daily max, 8-h ozone, July 21, 20111200 UTC experimental1200 UTC experimental
predicted in dark blueobserved as red dots
FC=0.755TS=0.186POD=0.810FAR=0.805CASES: 84
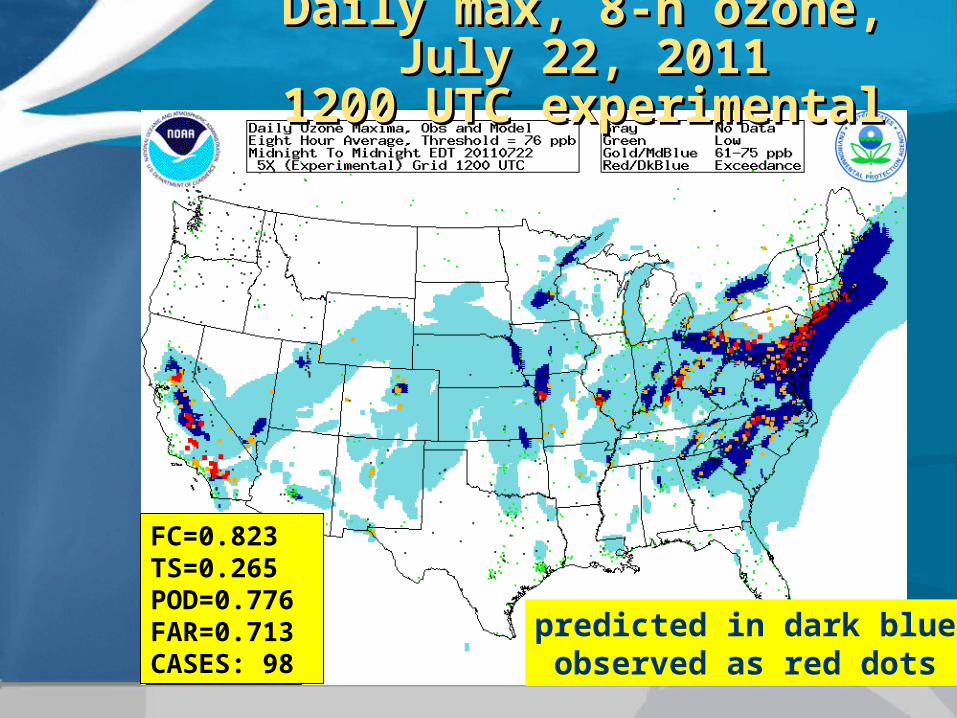
Daily max, 8-h ozone, July 22, 2011Daily max, 8-h ozone, July 22, 20111200 UTC experimental1200 UTC experimental
predicted in dark blueobserved as red dots
FC=0.823TS=0.265POD=0.776FAR=0.713CASES: 98
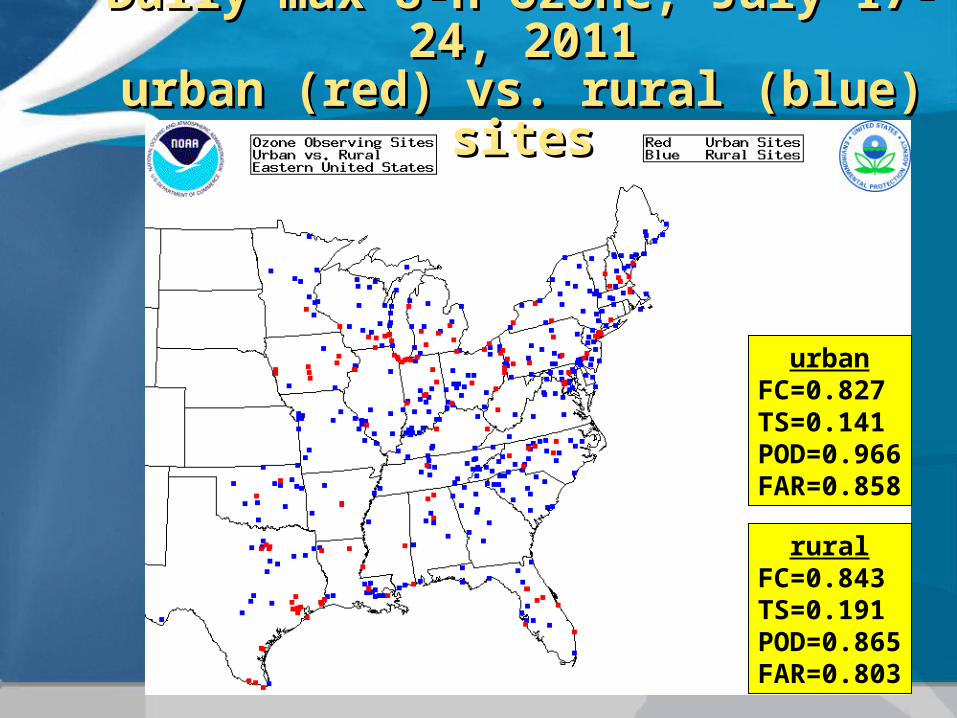
Daily max 8-h ozone, July 17-24, 2011Daily max 8-h ozone, July 17-24, 2011urban (red) vs. rural (blue) sitesurban (red) vs. rural (blue) sites
ruralFC=0.843TS=0.191POD=0.865FAR=0.803
urbanFC=0.827TS=0.141POD=0.966FAR=0.858
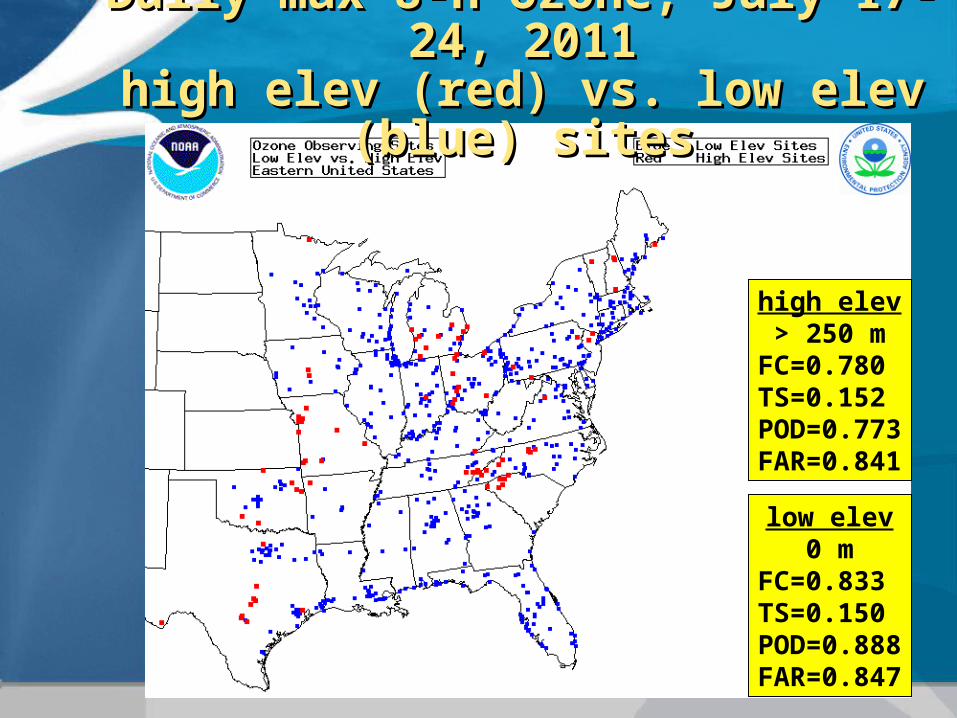
Daily max 8-h ozone, July 17-24, 2011Daily max 8-h ozone, July 17-24, 2011high elev (red) vs. low elev (blue) siteshigh elev (red) vs. low elev (blue) sites
high elev> 250 m
FC=0.780TS=0.152POD=0.773FAR=0.841
low elev0 m
FC=0.833TS=0.150POD=0.888FAR=0.847
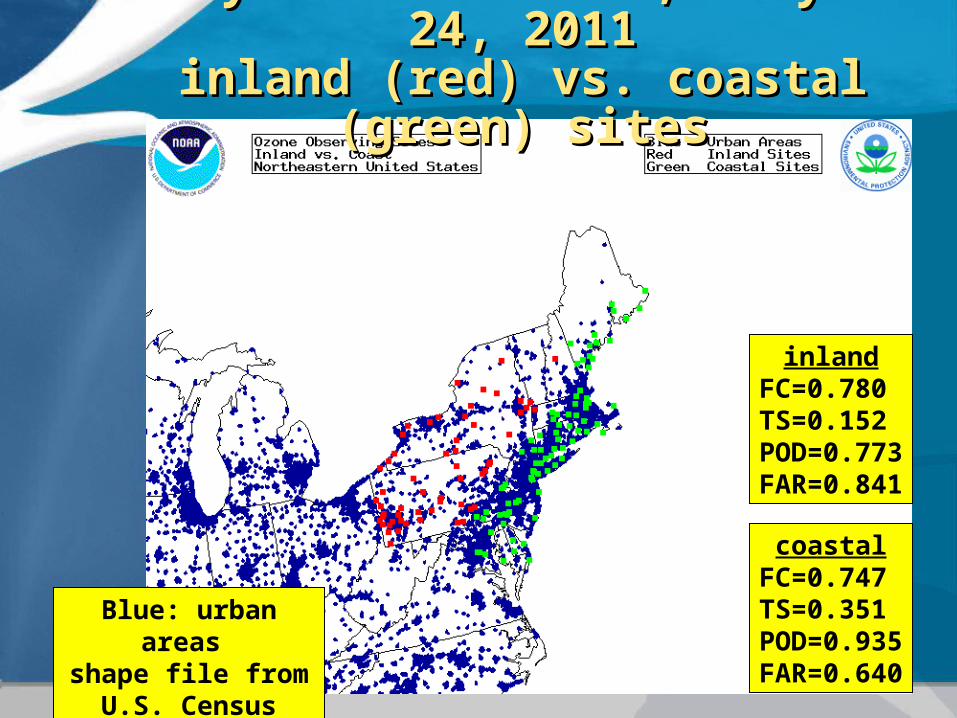
Daily max 8-h ozone, July 17-24, 2011Daily max 8-h ozone, July 17-24, 2011inland (red) vs. coastal (green) sitesinland (red) vs. coastal (green) sites
coastalFC=0.747TS=0.351POD=0.935FAR=0.640
inlandFC=0.780TS=0.152POD=0.773FAR=0.841
Blue: urban areas shape file from
U.S. Census
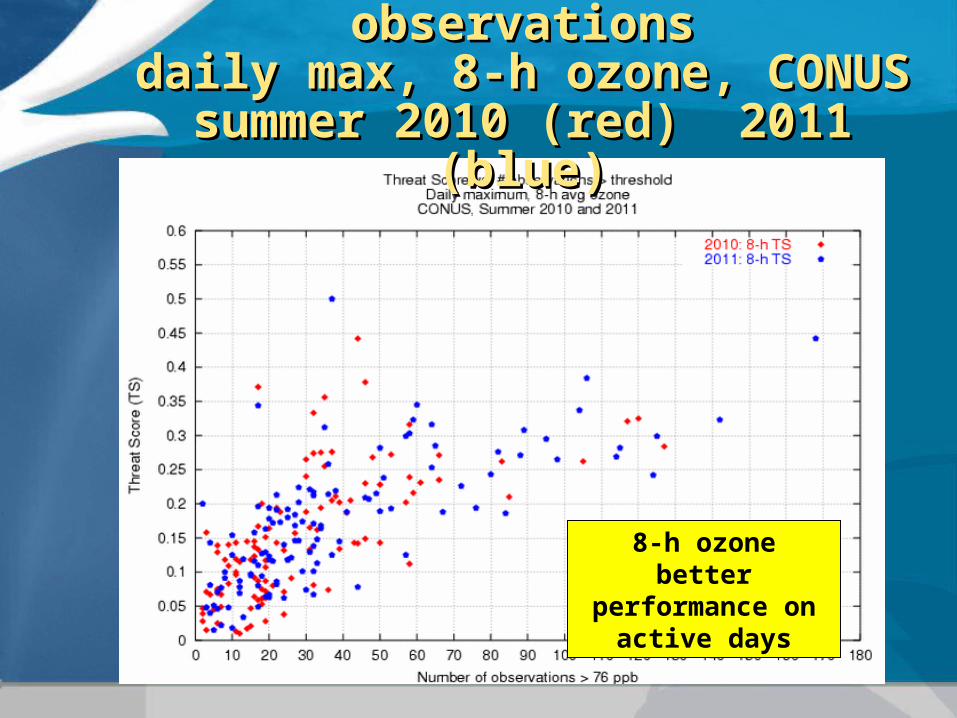
Threat Score vs. # observationsThreat Score vs. # observationsdaily max, 8-h ozone, CONUSdaily max, 8-h ozone, CONUSsummer 2010 (red) 2011 (blue)summer 2010 (red) 2011 (blue)
8-h ozonebetter performance
on active days
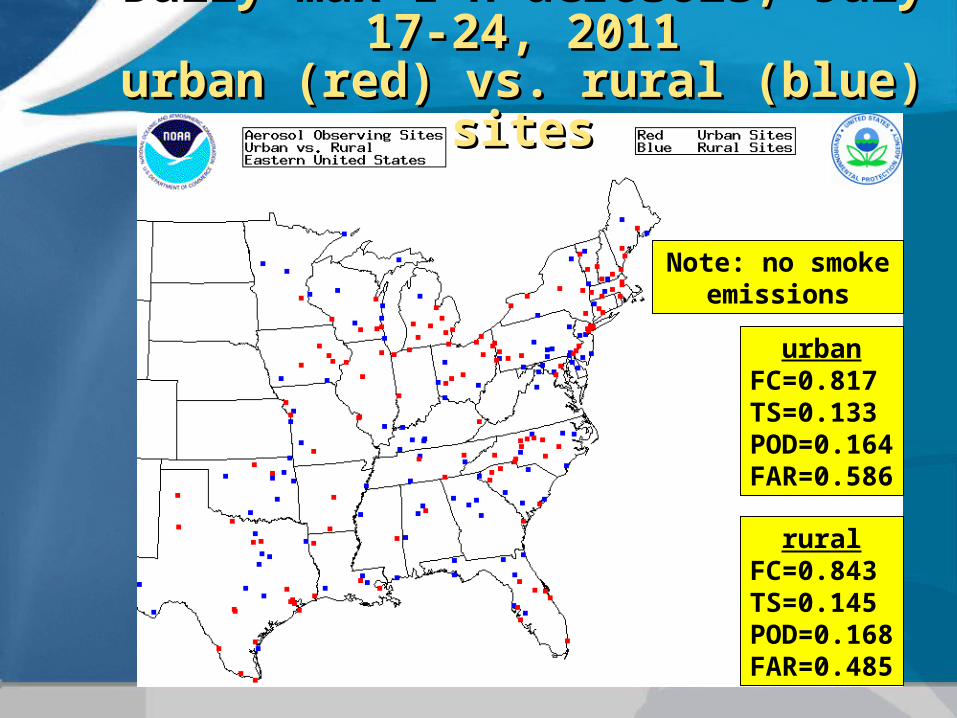
Daily max 1-h aerosols, July 17-24, 2011Daily max 1-h aerosols, July 17-24, 2011urban (red) vs. rural (blue) sitesurban (red) vs. rural (blue) sites
urbanFC=0.817TS=0.133POD=0.164FAR=0.586
ruralFC=0.843TS=0.145POD=0.168FAR=0.485
Note: no smoke emissions
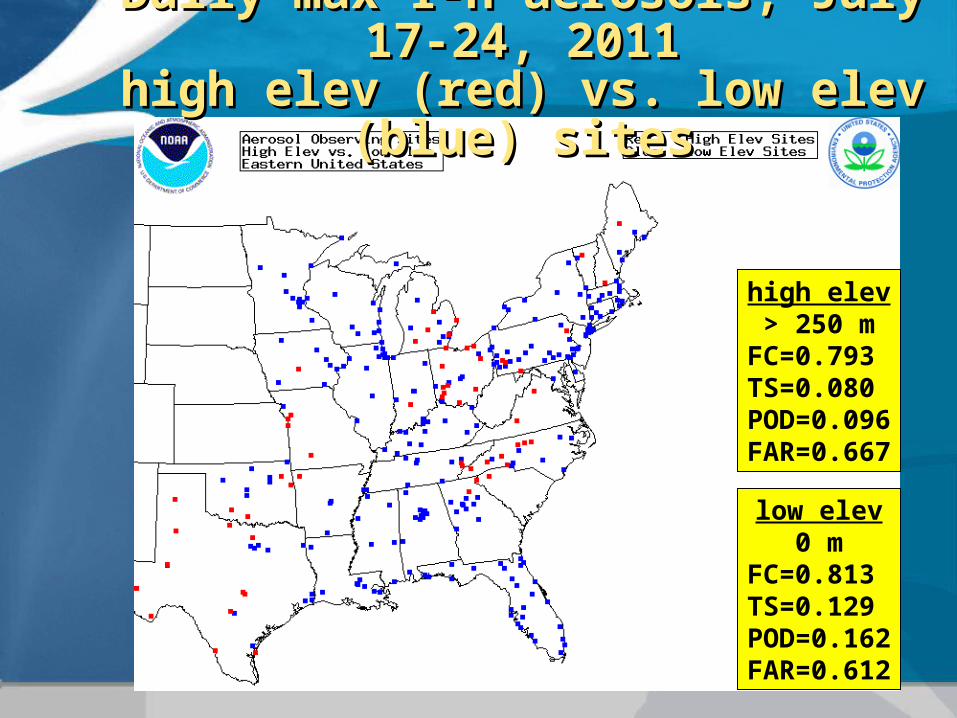
Daily max 1-h aerosols, July 17-24, 2011Daily max 1-h aerosols, July 17-24, 2011high elev (red) vs. low elev (blue) siteshigh elev (red) vs. low elev (blue) sites
low elev0 m
FC=0.813TS=0.129POD=0.162FAR=0.612
high elev> 250 m
FC=0.793TS=0.080POD=0.096FAR=0.667
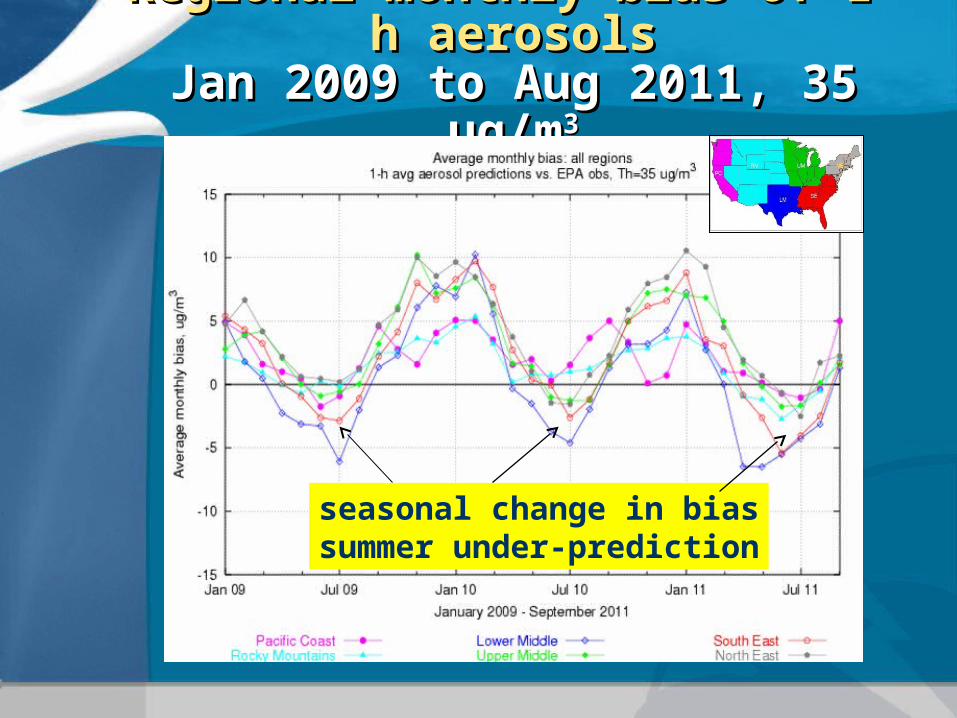
Regional monthly bias of 1-h aerosolsRegional monthly bias of 1-h aerosolsJan 2009 to Aug 2011, 35 ug/mJan 2009 to Aug 2011, 35 ug/m33
Seasonal change in bias Seasonal change in bias summer under-predictionsummer under-prediction
seasonal change in biassummer under-prediction
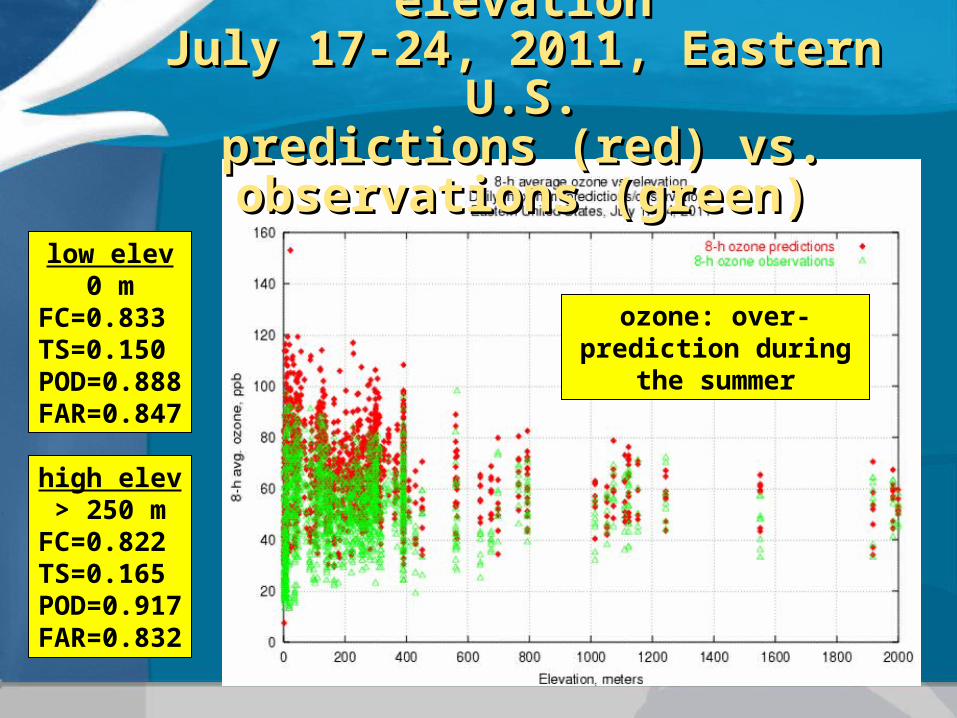
Daily max 8-h ozone vs. elevationDaily max 8-h ozone vs. elevationJuly 17-24, 2011, Eastern U.S.July 17-24, 2011, Eastern U.S.
predictions (red) vs. observations (green)predictions (red) vs. observations (green)
high elev> 250 m
FC=0.822TS=0.165POD=0.917FAR=0.832
ozone: over-prediction during the summer
low elev0 m
FC=0.833TS=0.150POD=0.888FAR=0.847
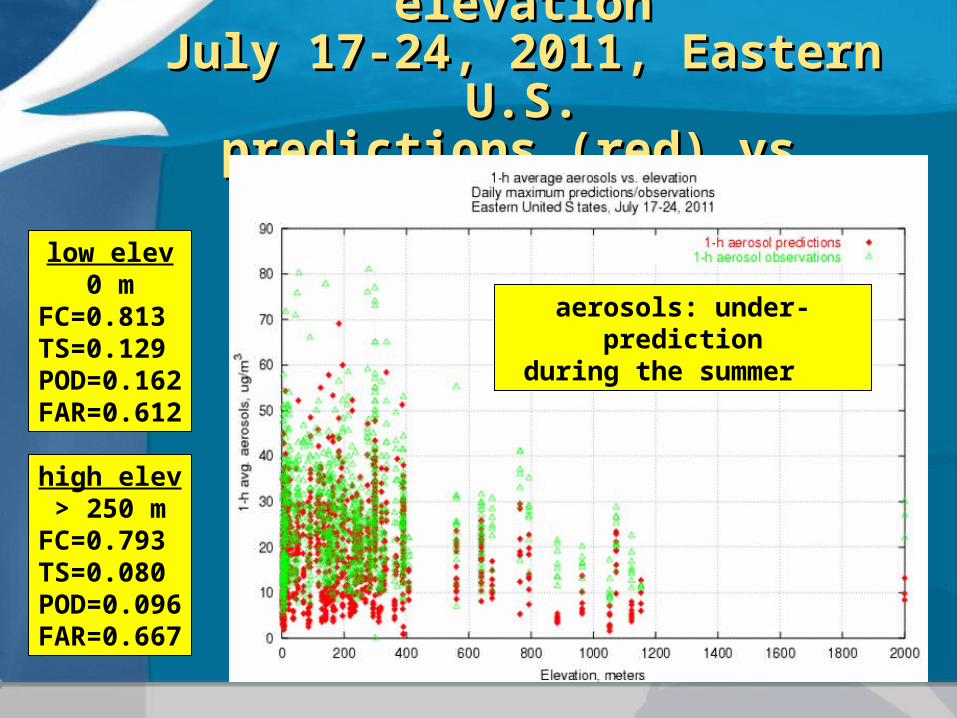
Daily max 1-h aerosols vs. elevationDaily max 1-h aerosols vs. elevationJuly 17-24, 2011, Eastern U.S.July 17-24, 2011, Eastern U.S.
predictions (red) vs. observations (green)predictions (red) vs. observations (green)
low elev0 m
FC=0.813TS=0.129POD=0.162FAR=0.612
high elev> 250 m
FC=0.793TS=0.080POD=0.096FAR=0.667
aerosols: under-predictionduring the summer
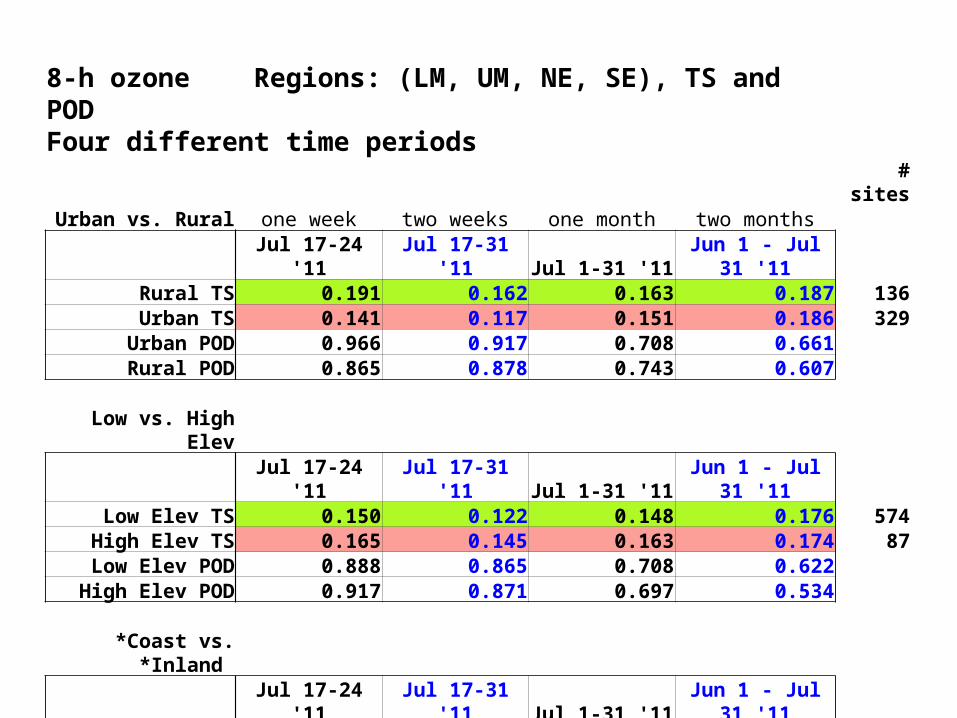
8-h ozone Regions: (LM, UM, NE, SE), TS and PODFour different time periods
# sitesUrban vs. Rural one week two weeks one month two months
Jul 17-24 '11 Jul 17-31 '11 Jul 1-31 '11Jun 1 - Jul 31
'11 Rural TS 0.191 0.162 0.163 0.187 136Urban TS 0.141 0.117 0.151 0.186 329
Urban POD 0.966 0.917 0.708 0.661Rural POD 0.865 0.878 0.743 0.607
Low vs. High Elev
Jul 17-24 '11 Jul 17-31 '11 Jul 1-31 '11Jun 1 - Jul 31
'11 Low Elev TS 0.150 0.122 0.148 0.176 574High Elev TS 0.165 0.145 0.163 0.174 87
Low Elev POD 0.888 0.865 0.708 0.622High Elev POD 0.917 0.871 0.697 0.534
*Coast vs. *Inland
Jul 17-24 '11 Jul 17-31 '11 Jul 1-31 '11Jun 1 - Jul 31
'11Coastal TS 0.351 0.293 0.270 0.316 84 Inland TS 0.152 0.131 0.109 0.145 60
Coastal POD 0.935 0.922 0.792 0.758Inland POD 0.773 0.773 0.500 0.524
*NE region only
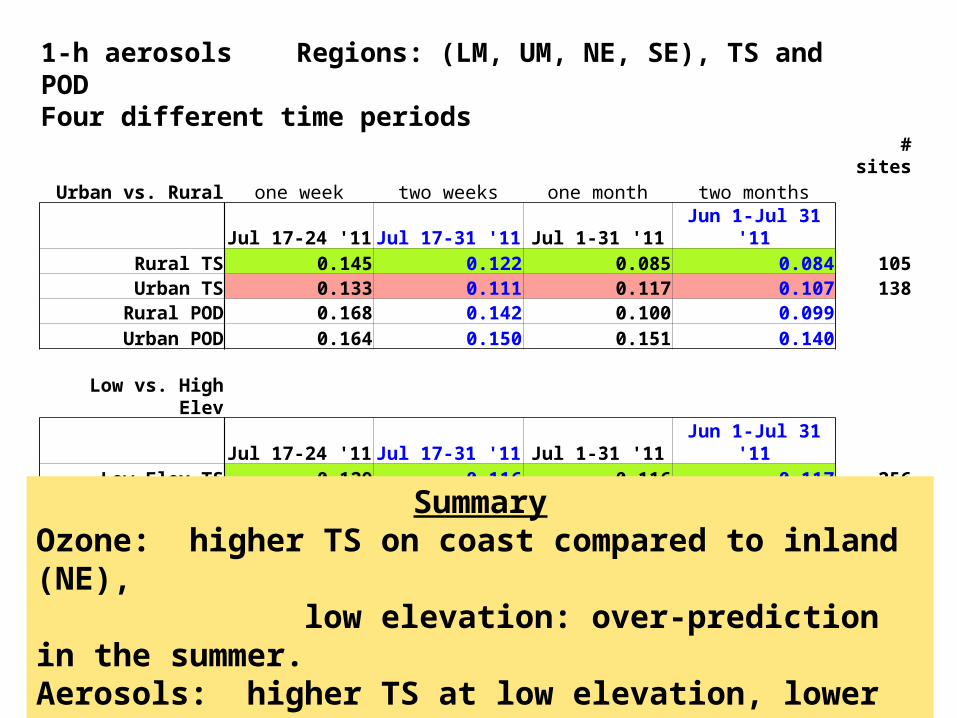
1-h aerosols Regions: (LM, UM, NE, SE), TS and PODFour different time periods
# sitesUrban vs. Rural one week two weeks one month two months
Jul 17-24 '11 Jul 17-31 '11 Jul 1-31 '11 Jun 1-Jul 31 '11 Rural TS 0.145 0.122 0.085 0.084 105Urban TS 0.133 0.111 0.117 0.107 138
Rural POD 0.168 0.142 0.100 0.099Urban POD 0.164 0.150 0.151 0.140
Low vs. High Elev
Jul 17-24 '11 Jul 17-31 '11 Jul 1-31 '11 Jun 1-Jul 31 '11 Low Elev TS 0.129 0.116 0.116 0.117 256High Elev TS 0.080 0.063 0.124 0.106 62
Low Elev POD 0.162 0.160 0.154 0.153High Elev POD 0.096 0.078 0.145 0.124
SummaryOzone: higher TS on coast compared to inland (NE), low elevation: over-prediction in the summer. Aerosols: higher TS at low elevation, lower POD than w/ ozone, under-prediction in the summer.
remove rural sites that are too close to remove rural sites that are too close to urban areas, may have affected results.urban areas, may have affected results.
compare by region, especially for the compare by region, especially for the Pacific Coast (PC) region.Pacific Coast (PC) region.
for aerosols, compare winter vs. for aerosols, compare winter vs. summer, urban/rural, low/high elev.summer, urban/rural, low/high elev.
compare different model compare different model configurations, NMM-B, 4 km.configurations, NMM-B, 4 km.
expand inland vs. coast comparison to expand inland vs. coast comparison to include entire U.S. east coast.include entire U.S. east coast.
Suggestions for future work: Suggestions for future work: