Embed Size (px)
Citation preview
166 TELEMEDICINE and e-HEALTH MARCH 2009 DOI: 10.1089/tmj.2008.0071
O R I G I N A L R E S E A R C H
Sungyoup Hong, M.D.,1 Yougmo Yang, M.D.,1 Seunghwan Kim, Ph.D.,2 Seungcheol Shin, Ph.D.,2 Inbum Lee, Ph.D.,2 Yongwon Jang, M.S.,2 Kiseong Kim, M.S.,3 Hwayeon Yi, M.D.,4 and Jangyoung Lee, M.D.1
1 Department of Emergency Medicine, Eulji University Hospital, Daejeon, Republic of Korea.
2 Electronics and Telecommunications Research Institute, U-Health Research Team, Daejeon, Republic of Korea.
3Laxtha, Laxtha Institute, Daejeon, Republic of Korea.4 Department of Emergency Medicine, Chungnam University Hospital, Daejeon, Republic of Korea.
AbstractThis study attempts to compare and assess the performance of a wearable electrocardiogram (ECG) using a sensing fabric electrode and a Bluetooth® network with a conventional ECG. A one-lead ECG examination was performed using Bioshirt and an iWorx® 214 while walking or running at 3, 6, and 9 km per hour. A correlation coefficient of a heart rate variability (HRV) between these two devices was higher than 0.96 and power spectral density of HRV measured also showed an excellent agreement. Thus, both of these two ECG devices showed similar detection capability for R peaks. The measured values for wave duration and intervals of both devices concur with each other. The intensity of noise is controversial. The ECG device using a sensing fabric electrode and a wireless network showed an ECG signal detection and transmission capability similar to that of a conventional ECG device.
Key words: home health monitoring, telemedicine, telehealth
Introductionwing to advances in modern medicine, the life expectan-cy of humans has rapidly increased. The population that requires observations and assistance such as the elderly, people with a chronic disease, and disabled persons, has
gradually increased. Currently, the demand for home-care services or remote medical services using a wire or wireless environment is rapidly on the rise.
The majority of sudden deaths in adults are due to ventricular arrhythmia. Remote electrocardiographic (ECG) monitoring would allow immediate detection of such a life-threatening arrhythmia. Together with an early alarm system, it could invigorate emergency medical services or promote the safety of seriously ill patients in hospital and out-of-hospital environments.
Attempts have been made to transmit the ECG signals of critical patients in real time using a wearable system based on wireless body surface network and wireless communications.1–4
A recent study—a simulation research that enabled transmissions of vital signs as well as triage and tracing of patients in disaster set-tings containing a large number of patients and using a body surface network and a network—revealed not only simultaneous tracings of a large number of sensor nodes but also stable data transmissions owing to much less overall data yields during the drill.5 Furthermore, in another study, a technology was developed that can transmit ECG signal from a wearable ECG transmitter to a mobile phone, and then the signal is analyzed to activate emergency medical system.6
In order to implement comfortable, continuous telemonitoring, the wearable system should be worn easily and should not interfere with daily activities.7
In order to produce a wearable device and sensors, they should have high patient compliance, be lightweight, and should be pro-
Performance Study of the Wearable One-Lead Wireless Electrocardiographic Monitoring System
O
© MARY ANN LIEBERT, INC. • VOL. 15 NO. 2 • MARCH 2009 TELEMEDICINE and e-HEALTH 167
WEARABLE WIRELESS ECG MONITORING SYSTEM
cessed easily in various forms. A number of materials have been developed over the past 10 years. Fabric electrodes are produced by weaving very thin metal threads, in which metal was processed in a micron unit, with textile fabrics. Another form of fabric elec-trodes have conductivity by coating the metal or metallic salts on the textiles.8 Metallic fibers have excellent conductivity, but have a disadvantage of being expensive and having difficulty in producing a uniform fabric structure. On the other hand, electrically conductive fibers have disadvantages, including weak resistance to corrosion.
Studies on sensing fabric electrodes that could be worn like clothes and collect biosignals while carrying out one’s daily life have been conducted.9–14 Previous studies on wearable systems capable of obtaining multiparameter biomedical signals such as ECG data, blood pressure, respiration rate, and oxygen saturation and others have been conducted.9–12
However, not many studies have been conducted on transmission capability of biosignals of wearable systems for which both sensing fabric electrodes and a wireless network are applicable. The reality of inadequacy was that most studies (1) did not perform statistical analysis for the measured data and only did visual analysis, (2) lacked
conventional control using adhesive electrodes and cables, and (3) did not assess various physical activity modes.
Thus, the authors obtained an ECG signal in real-time using a wearable system with sensing fabric electrode and a Bluetooth® (Motorola, Inc., Schaumburg, IL) network and assessed reliability of the wearable ECG system compared to ECG signals using a conven-tional method with patch electrodes and cables in various analytical ways. Also, we did literature reviews and assessment in the area of possible applications of wearable ECG data.
Materials and MethodsCONSTRUCTION AND PRINCIPLES OF BIOSHIRT
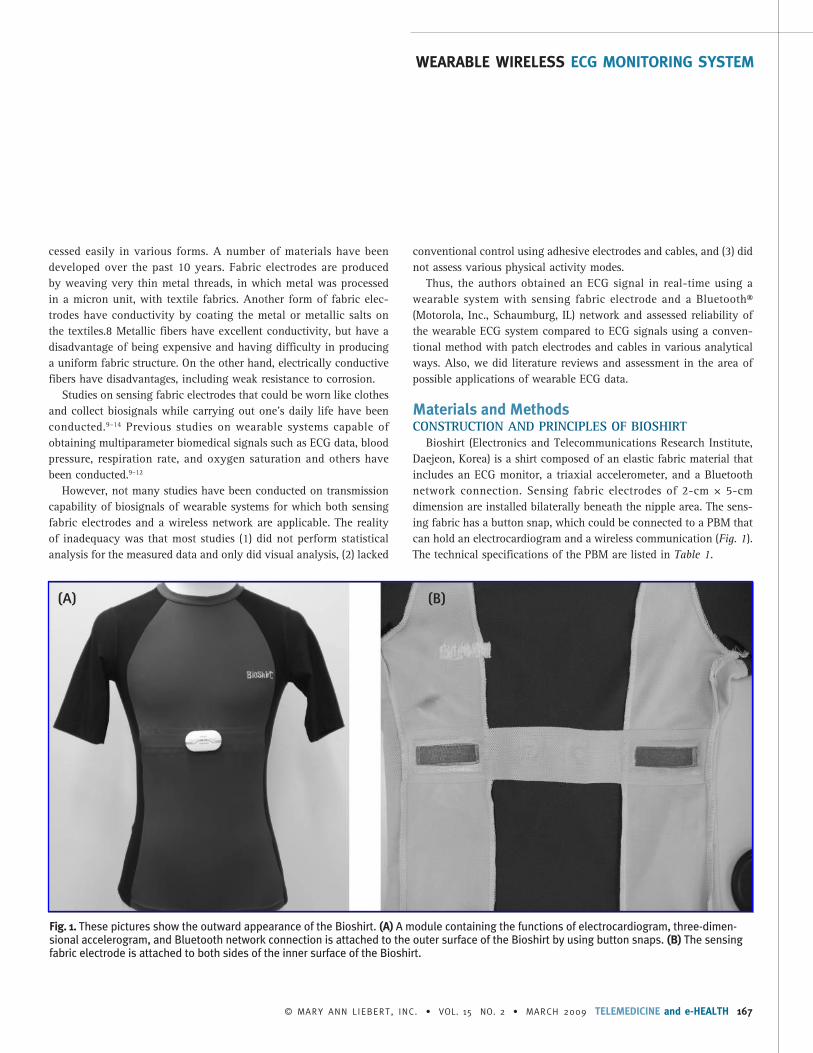
Bioshirt (Electronics and Telecommunications Research Institute, Daejeon, Korea) is a shirt composed of an elastic fabric material that includes an ECG monitor, a triaxial accelerometer, and a Bluetooth network connection. Sensing fabric electrodes of 2-cm × 5-cm dimension are installed bilaterally beneath the nipple area. The sens-ing fabric has a button snap, which could be connected to a PBM that can hold an electrocardiogram and a wireless communication (Fig. 1). The technical specifications of the PBM are listed in Table 1.
Fig. 1. These pictures show the outward appearance of the Bioshirt. (A) A module containing the functions of electrocardiogram, three-dimen-sional accelerogram, and Bluetooth network connection is attached to the outer surface of the Bioshirt by using button snaps. (B) The sensing fabric electrode is attached to both sides of the inner surface of the Bioshirt.
(A) (B)
168 TELEMEDICINE and e-HEALTH MARCH 2009
HONG ET AL.
SUBJECTSThis study targeted healthy adult males with an age of 18 years or
older without history of cardiac disease. Subjects were selected from applications through public recruitment. A signed informed consent was obtained from all who participated in this study.
OBTAINING ECG DATAAll experiments were performed at a normal temperature in a
comfortable environment. Standard Ag/AgCl electrodes (Red Dot, 3M, Minneapolis, MN) were attached to the standard precordial three-lead positions. The ECG signals were amplified with an ECG amplifier (ECG100C, Biopac, Goleta, CA), which passed through a filter band-width of 0.1–100 Hz and then stored at a sampling rate of 200 Hz
with an iWorx 214 four-channel data acquisition system (IX/214, iWorx®/CB Sciences Inc., Dover, NH). All electrodes and wires were affixed to the skin using adhesive bandages to minimize noise.
After subjects wore a Bioshirt on top of a bare chest onto which electrodes and cables were attached, ECG signals were amplified 1,000-fold, filtered with a 1–100-Hz bandpass filter, and then sam-pled at 200 Hz with 10-bit resolution. The Bluetooth network was used for transmission and storing on a personal computer.
All subjects underwent two ECG tests simultaneously by walking or running for 5 minutes on a treadmill (Stairmaster, Nautilus Inc., Switzerland) at variable speeds of 3 km/hr, 6 km/hr, and 9 km/hr.
ECG ANALYSISAfter converting the ECG data from two devices into text files, the
text files were combined, imported to a PC-based time-series analysis software, Complexity (Laxtha, Daejeon, Korea), and then analyzed.
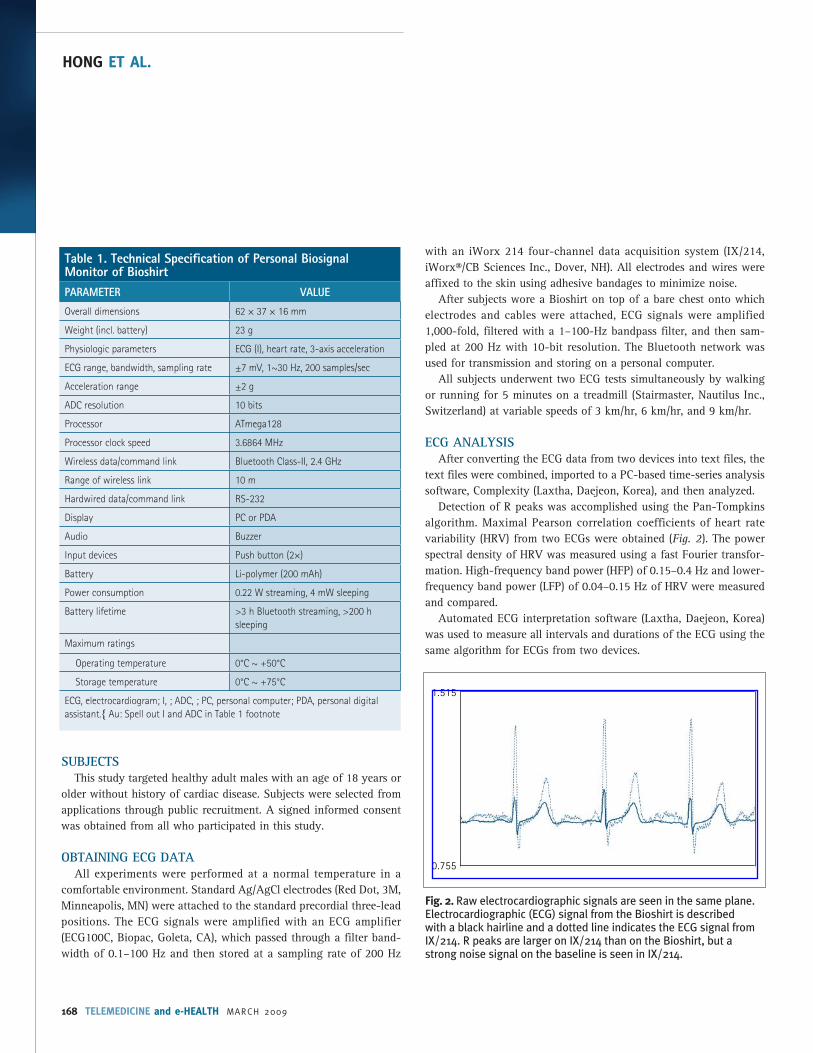
Detection of R peaks was accomplished using the Pan-Tompkins algorithm. Maximal Pearson correlation coefficients of heart rate variability (HRV) from two ECGs were obtained (Fig. 2). The power spectral density of HRV was measured using a fast Fourier transfor-mation. High-frequency band power (HFP) of 0.15–0.4 Hz and lower-frequency band power (LFP) of 0.04–0.15 Hz of HRV were measured and compared.
Automated ECG interpretation software (Laxtha, Daejeon, Korea) was used to measure all intervals and durations of the ECG using the same algorithm for ECGs from two devices.
Table 1. Technical Specification of Personal Biosignal Monitor of BioshirtPARAMETER VALUE
Overall dimensions 62 × 37 × 16 mm
Weight (incl. battery) 23 g
Physiologic parameters ECG (I), heart rate, 3-axis acceleration
ECG range, bandwidth, sampling rate ±7 mV, 1~30 Hz, 200 samples/sec
Acceleration range ±2 g
ADC resolution 10 bits
Processor ATmega128
Processor clock speed 3.6864 MHz
Wireless data/command link Bluetooth Class-II, 2.4 GHz
Range of wireless link 10 m
Hardwired data/command link RS-232
Display PC or PDA
Audio Buzzer
Input devices Push button (2×)
Battery Li-polymer (200 mAh)
Power consumption 0.22 W streaming, 4 mW sleeping
Battery lifetime >3 h Bluetooth streaming, >200 h sleeping
Maximum ratings
Operating temperature 0°C ~ +50°C
Storage temperature 0°C ~ +75°C
ECG, electrocardiogram; I, ; ADC, ; PC, personal computer; PDA, personal digital assistant.{ Au: Spell out I and ADC in Table 1 footnote
Fig. 2. Raw electrocardiographic signals are seen in the same plane. Electrocardiographic (ECG) signal from the Bioshirt is described with a black hairline and a dotted line indicates the ECG signal from IX/214. R peaks are larger on IX/214 than on the Bioshirt, but a strong noise signal on the baseline is seen in IX/214.
0.755
1.515
© MARY ANN LIEBERT, INC. • VOL. 15 NO. 2 • MARCH 2009 TELEMEDICINE and e-HEALTH 169
WEARABLE WIRELESS ECG MONITORING SYSTEM
The crest factor (the ratio of the peak value of a signal to its room mean square [RMS] values) and the ratio between in-band (5–40 Hz) and out-of-band spectral power (RIO) were used to mea-sure the noise intensity of ECG.15
STATISTICAL ANALYSISThe consistency of P-wave duration, QRS duration, T duration,
PR interval, corrected QT interval, and power spectral density were analyzed with the Passing and Bablok regression of MedCalc ver. 9.1.0.1 (MedCalc Software, Mariakerke, Belgium). A p > 0.1 was regarded as having a significant linear relationship.
Analysis of variance of the SAS version 9.0 (SAS Institute, Cary, NC) was used to compare the intensities of noise, and p < 0.05 was regarded as having a significant difference.
ResultsA total of 18 subjects participated in this study with ages of
29.700 ± 6.82 (range 23–39). Heights and weights were 170.80 ± 6.82 cm (range 158–185) and 69.35 ± 5.42 kg (range 58–92), respectively.
CORRELATION ANALYSIS OF HRV AND ANALYSIS OF THE CONSISTENCY OF FREQUENCY DOMAIN VARIABLES
Samples of ECG signals obtained from two devices are shown in Figure 2. The R-peak of the ECG in the Bioshirt was significantly smaller than that of the control device at all speeds (p < 0.001). The speed of exercises did not make much difference in the size of R-peak between two devices (p = 0.539).
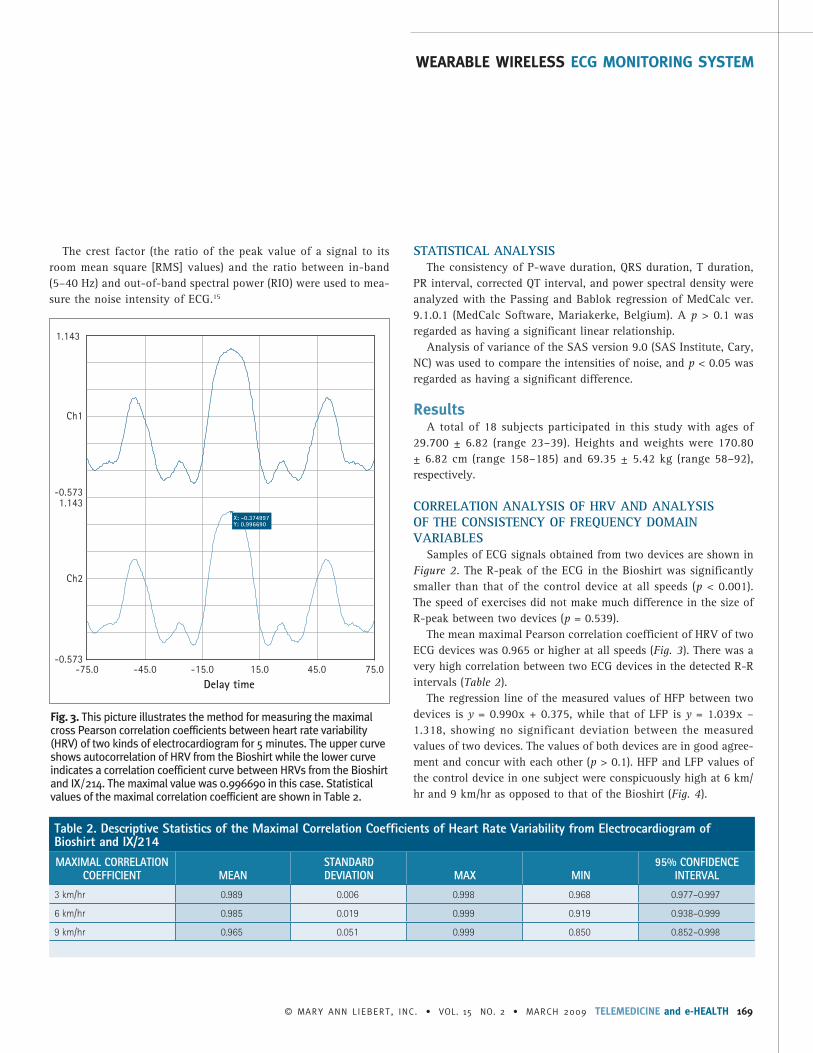
The mean maximal Pearson correlation coefficient of HRV of two ECG devices was 0.965 or higher at all speeds (Fig. 3). There was a very high correlation between two ECG devices in the detected R-R intervals (Table 2).
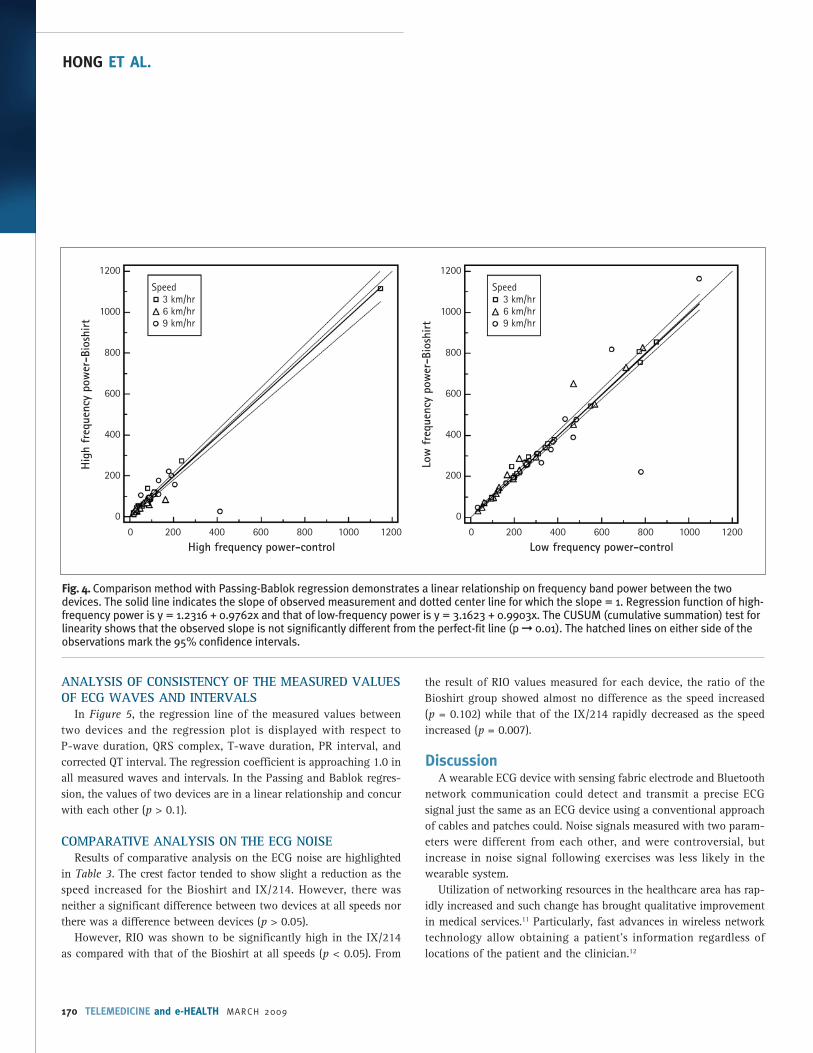
The regression line of the measured values of HFP between two devices is y = 0.990x + 0.375, while that of LFP is y = 1.039x – 1.318, showing no significant deviation between the measured values of two devices. The values of both devices are in good agree-ment and concur with each other (p > 0.1). HFP and LFP values of the control device in one subject were conspicuously high at 6 km/hr and 9 km/hr as opposed to that of the Bioshirt (Fig. 4).
Table 2. Descriptive Statistics of the Maximal Correlation Coefficients of Heart Rate Variability from Electrocardiogram of Bioshirt and IX/214MAXIMAL CORRELATION
COEFFICIENT MEANSTANDARD DEVIATION MAX MIN
95% CONFIDENCE INTERVAL
3 km/hr 0.989 0.006 0.998 0.968 0.977–0.997
6 km/hr 0.985 0.019 0.999 0.919 0.938–0.999
9 km/hr 0.965 0.051 0.999 0.850 0.852–0.998
Fig. 3. This picture illustrates the method for measuring the maximal cross Pearson correlation coefficients between heart rate variability (HRV) of two kinds of electrocardiogram for 5 minutes. The upper curve shows autocorrelation of HRV from the Bioshirt while the lower curve indicates a correlation coefficient curve between HRVs from the Bioshirt and IX/214. The maximal value was 0.996690 in this case. Statistical values of the maximal correlation coefficient are shown in Table 2.
-0.573-75.0 -45.0 -15.0 15.0 45.0 75.0
Ch1
1.143
-0.5731.143
Ch2
Delay time
X: -0.374997Y: 0.996690
170 TELEMEDICINE and e-HEALTH MARCH 2009
HONG ET AL.
ANALYSIS OF CONSISTENCY OF THE MEASURED VALUES OF ECG WAVES AND INTERVALS
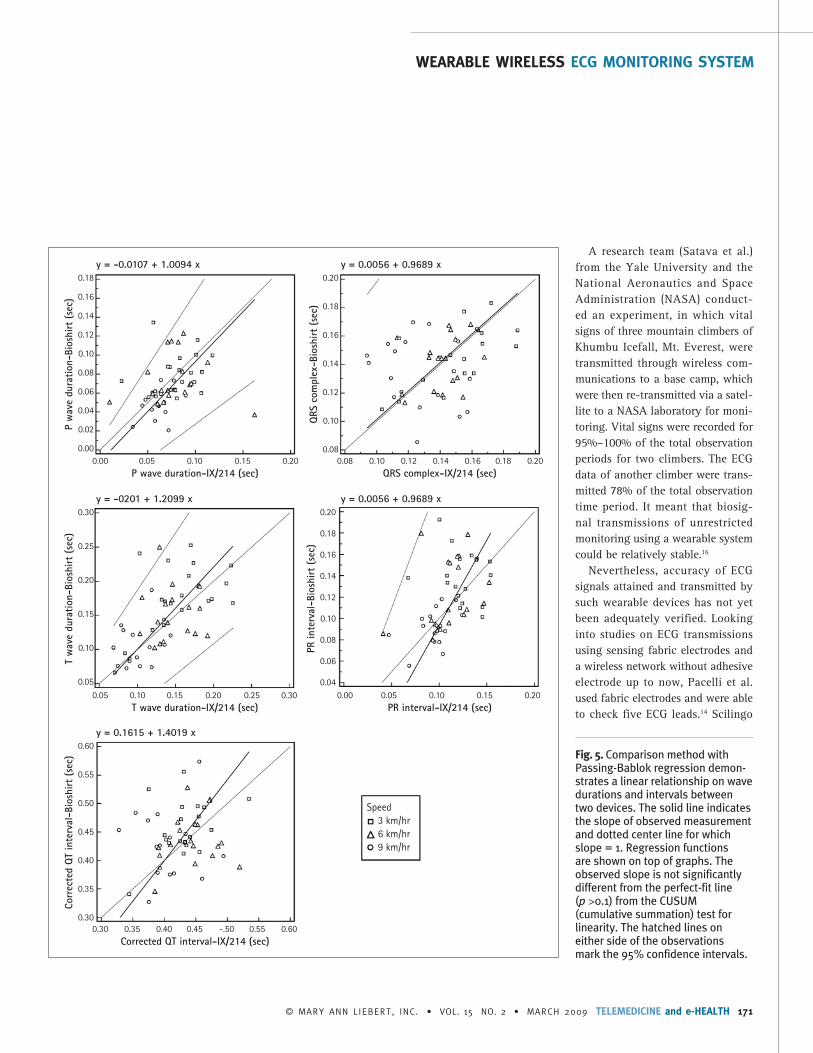
In Figure 5, the regression line of the measured values between two devices and the regression plot is displayed with respect to P-wave duration, QRS complex, T-wave duration, PR interval, and corrected QT interval. The regression coefficient is approaching 1.0 in all measured waves and intervals. In the Passing and Bablok regres-sion, the values of two devices are in a linear relationship and concur with each other (p > 0.1).
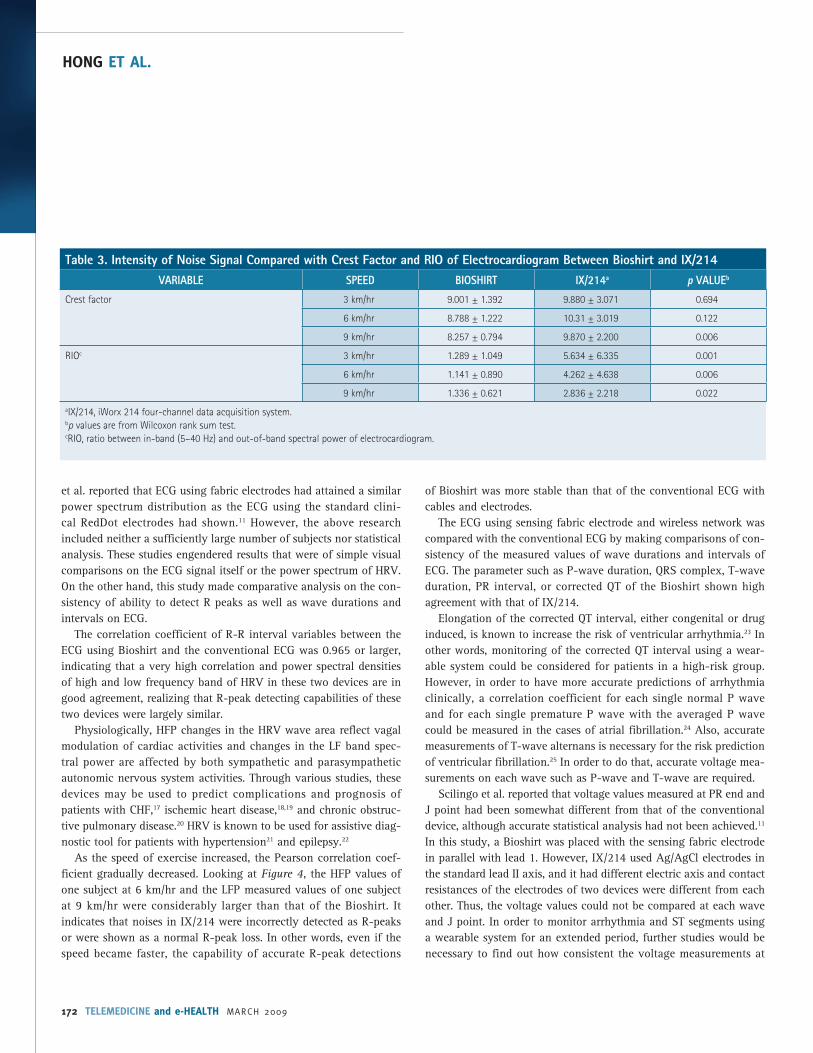
COMPARATIVE ANALYSIS ON THE ECG NOISEResults of comparative analysis on the ECG noise are highlighted
in Table 3. The crest factor tended to show slight a reduction as the speed increased for the Bioshirt and IX/214. However, there was neither a significant difference between two devices at all speeds nor there was a difference between devices (p > 0.05).
However, RIO was shown to be significantly high in the IX/214 as compared with that of the Bioshirt at all speeds (p < 0.05). From
the result of RIO values measured for each device, the ratio of the Bioshirt group showed almost no difference as the speed increased (p = 0.102) while that of the IX/214 rapidly decreased as the speed increased (p = 0.007).
DiscussionA wearable ECG device with sensing fabric electrode and Bluetooth
network communication could detect and transmit a precise ECG signal just the same as an ECG device using a conventional approach of cables and patches could. Noise signals measured with two param-eters were different from each other, and were controversial, but increase in noise signal following exercises was less likely in the wearable system.
Utilization of networking resources in the healthcare area has rap-idly increased and such change has brought qualitative improvement in medical services.11 Particularly, fast advances in wireless network technology allow obtaining a patient’s information regardless of locations of the patient and the clinician.12
Fig. 4. Comparison method with Passing-Bablok regression demonstrates a linear relationship on frequency band power between the two devices. The solid line indicates the slope of observed measurement and dotted center line for which the slope = 1. Regression function of high-frequency power is y = 1.2316 + 0.9762x and that of low-frequency power is y = 3.1623 + 0.9903x. The CUSUM (cumulative summation) test for linearity shows that the observed slope is not significantly different from the perfect-fit line (p ➞ 0.01). The hatched lines on either side of the observations mark the 95% confidence intervals.
Speed 3 km/hr 6 km/hr 9 km/hr
1200
1000
800
600
400
200
0
1200
1000
800
600
400
200
0
0 200 400 600 800 1000 1200 0 200 400 600 800 1000 1200
Hig
h fr
eque
ncy
pow
er-B
iosh
irt
Speed 3 km/hr 6 km/hr 9 km/hr
Low
fre
quen
cy p
ower
-Bio
shirt
High frequency power-control Low frequency power-control
© MARY ANN LIEBERT, INC. • VOL. 15 NO. 2 • MARCH 2009 TELEMEDICINE and e-HEALTH 171
WEARABLE WIRELESS ECG MONITORING SYSTEM
A research team (Satava et al.) from the Yale University and the National Aeronautics and Space Administration (NASA) conduct-ed an experiment, in which vital signs of three mountain climbers of Khumbu Icefall, Mt. Everest, were transmitted through wireless com-munications to a base camp, which were then re-transmitted via a satel-lite to a NASA laboratory for moni-toring. Vital signs were recorded for 95%–100% of the total observation periods for two climbers. The ECG data of another climber were trans-mitted 78% of the total observation time period. It meant that biosig-nal transmissions of unrestricted monitoring using a wearable system could be relatively stable.16
Nevertheless, accuracy of ECG signals attained and transmitted by such wearable devices has not yet been adequately verified. Looking into studies on ECG transmissions using sensing fabric electrodes and a wireless network without adhesive electrode up to now, Pacelli et al. used fabric electrodes and were able to check five ECG leads.14 Scilingo
Fig. 5. Comparison method with Passing-Bablok regression demon-strates a linear relationship on wave durations and intervals between two devices. The solid line indicates the slope of observed measurement and dotted center line for which slope = 1. Regression functions are shown on top of graphs. The observed slope is not significantly different from the perfect-fit line (p >0.1) from the CUSUM (cumulative summation) test for linearity. The hatched lines on either side of the observations mark the 95% confidence intervals.
0.18
0.16
0.14
0.12
0.10
0.08
0.06
0.04
0.02
0.00
P w
ave
dura
tion-
Bios
hirt
(se
c)
0.00 0.05 0.10 0.15 0.20P wave duration-IX/214 (sec)
y = -0.0107 + 1.0094 x0.20
0.18
0.16
0.14
0.12
0.10
0.08
QRS
com
plex
-Bio
shirt
(se
c)
0.08 0.10 0.12 0.14 0.16 0.18 0.20QRS complex-IX/214 (sec)
y = 0.0056 + 0.9689 x
0.30
0.25
0.20
0.15
0.10
0.05
T w
ave
dura
tion-
Bios
hirt
(se
c)
0.05 0.10 0.15 0.20 0.25 0.30T wave duration-IX/214 (sec)
y = -0201 + 1.2099 x0.20
0.18
0.16
0.14
0.12
0.10
0.08
0.06
0.04
PR in
terv
al-B
iosh
irt (
sec)
0.00 0.05 0.10 0.15 0.20PR interval-IX/214 (sec)
y = 0.0056 + 0.9689 x
0.60
0.55
0.50
0.45
0.40
0.35
0.30
Corr
ecte
d Q
T in
terv
al-B
iosh
irt (
sec)
0.30 0.35 0.40 0.45 -.50 0.55 0.60Corrected QT interval-IX/214 (sec)
y = 0.1615 + 1.4019 x
Speed 3 km/hr 6 km/hr 9 km/hr
172 TELEMEDICINE and e-HEALTH MARCH 2009
HONG ET AL.
et al. reported that ECG using fabric electrodes had attained a similar power spectrum distribution as the ECG using the standard clini-cal RedDot electrodes had shown.11 However, the above research included neither a sufficiently large number of subjects nor statistical analysis. These studies engendered results that were of simple visual comparisons on the ECG signal itself or the power spectrum of HRV. On the other hand, this study made comparative analysis on the con-sistency of ability to detect R peaks as well as wave durations and intervals on ECG.
The correlation coefficient of R-R interval variables between the ECG using Bioshirt and the conventional ECG was 0.965 or larger, indicating that a very high correlation and power spectral densities of high and low frequency band of HRV in these two devices are in good agreement, realizing that R-peak detecting capabilities of these two devices were largely similar.
Physiologically, HFP changes in the HRV wave area reflect vagal modulation of cardiac activities and changes in the LF band spec-tral power are affected by both sympathetic and parasympathetic autonomic nervous system activities. Through various studies, these devices may be used to predict complications and prognosis of patients with CHF,17 ischemic heart disease,18,19 and chronic obstruc-tive pulmonary disease.20 HRV is known to be used for assistive diag-nostic tool for patients with hypertension21 and epilepsy.22
As the speed of exercise increased, the Pearson correlation coef-ficient gradually decreased. Looking at Figure 4, the HFP values of one subject at 6 km/hr and the LFP measured values of one subject at 9 km/hr were considerably larger than that of the Bioshirt. It indicates that noises in IX/214 were incorrectly detected as R-peaks or were shown as a normal R-peak loss. In other words, even if the speed became faster, the capability of accurate R-peak detections
of Bioshirt was more stable than that of the conventional ECG with cables and electrodes.
The ECG using sensing fabric electrode and wireless network was compared with the conventional ECG by making comparisons of con-sistency of the measured values of wave durations and intervals of ECG. The parameter such as P-wave duration, QRS complex, T-wave duration, PR interval, or corrected QT of the Bioshirt shown high agreement with that of IX/214.
Elongation of the corrected QT interval, either congenital or drug induced, is known to increase the risk of ventricular arrhythmia.23 In other words, monitoring of the corrected QT interval using a wear-able system could be considered for patients in a high-risk group. However, in order to have more accurate predictions of arrhythmia clinically, a correlation coefficient for each single normal P wave and for each single premature P wave with the averaged P wave could be measured in the cases of atrial fibrillation.24 Also, accurate measurements of T-wave alternans is necessary for the risk prediction of ventricular fibrillation.25 In order to do that, accurate voltage mea-surements on each wave such as P-wave and T-wave are required.
Scilingo et al. reported that voltage values measured at PR end and J point had been somewhat different from that of the conventional device, although accurate statistical analysis had not been achieved.11 In this study, a Bioshirt was placed with the sensing fabric electrode in parallel with lead 1. However, IX/214 used Ag/AgCl electrodes in the standard lead II axis, and it had different electric axis and contact resistances of the electrodes of two devices were different from each other. Thus, the voltage values could not be compared at each wave and J point. In order to monitor arrhythmia and ST segments using a wearable system for an extended period, further studies would be necessary to find out how consistent the voltage measurements at
Table 3. Intensity of Noise Signal Compared with Crest Factor and RIO of Electrocardiogram Between Bioshirt and IX/214VARIABLE SPEED BIOSHIRT IX/214a p VALUEb
Crest factor 3 km/hr 9.001 ± 1.392 9.880 ± 3.071 0.694
6 km/hr 8.788 ± 1.222 10.31 ± 3.019 0.122
9 km/hr 8.257 ± 0.794 9.870 ± 2.200 0.006
RIOc 3 km/hr 1.289 ± 1.049 5.634 ± 6.335 0.001
6 km/hr 1.141 ± 0.890 4.262 ± 4.638 0.006
9 km/hr 1.336 ± 0.621 2.836 ± 2.218 0.022aIX/214, iWorx 214 four-channel data acquisition system.bp values are from Wilcoxon rank sum test.cRIO, ratio between in-band (5–40 Hz) and out-of-band spectral power of electrocardiogram.
© MARY ANN LIEBERT, INC. • VOL. 15 NO. 2 • MARCH 2009 TELEMEDICINE and e-HEALTH 173
WEARABLE WIRELESS ECG MONITORING SYSTEM
each wave and specific points could be in comparison with the con-ventional method.
Reduction of noise signals, which could mask normal waves, would be important in order to have accurate ECG readings. A previ-ous study showed that the quality of signals from a fabric electrode drops dramatically during walking.26
However, in this study, there was no difference between two devices in the comparison of noise signals using the crest factor. The crest factor is equal to the peak amplitude of a wave divided by the RMS value and is an important parameter for accurate measurements of low frequency signals. The crest factor is 1.41 in case of a sine wave and if the crest factor is greater than that, it would show a pointy appearance of the voltage of a wave. In other words, in the case where an R-peak is larger than that of the baseline shift, the crest factor would be larger. The R-peak of IX/214 was shown to be twice as pointy as that of the Bioshirt in this study, because signals were measured for the Bioshirt in the lead I axis and IX/214 in the lead II axis (Fig. 2). Nevertheless, the reason the crest factors did not show significant difference between two devices means that the baseline of the Bioshirt had been less likely affected by noise signals. These authors thought it is the reflection of advanced technology of the sensing fabric electrode in Bioshirt as opposed to that of previous wearable devices. In addition, it showed that the Bioshirt could be used to assess changes of the ST segment during resting and exercise.
RIO denotes the ratio of the to 5–40-Hz power spectral density, which is the principal component in the power spectral distribution of ECG signals of healthy human to the sum of the spectral power density outside of the range. Accordingly, an increase in RIO value would indicate increase in signal-to-noise ratio of the ECG signals. In the comparisons of noise signals using RIO, the noise signal of the Bioshirt was significantly greater than that of the IX/214 in this study. In other words, it meant that either the in-band spectral power of the Bioshirt was smaller than the IX214 or the out-of-band spectral power, which was shown to be larger, or both of these were shown simultaneously. The consideration is that a small R-peak of the Bioshirt largely contributed to lower measurements of in-band spectral power.
Small R-peaks in the Bioshirt originate from the short polar dis-tance of about 10 cm and the same axis as that of precordial lead I; in contrast, larger R-peaks are checked at the same axis and distance of the conventional precordial lead II in using the IX/214.
Also, another reason for small R-peaks is that a large contact impedance of a sensing fabric electrode of the Bioshirt affected measurements. Looking into resistance and impedance of sensing fabric electrodes, generally, the mean resistance value of the sensing
fabric electrode was 0.03 Ω/cm, which was not much different from general wires. The contact impedance was also reported to be similar to that of the Ag/AgCl electrode.11 However, one other study reported that the contact impedance of a sensing fabric electrode would be high initially and then decrease slowly up to 20 minutes.26 Such a difference might be due to utilization of hydrogel membranes for the skin-electrode coupling on top of the fabric electrode in the first study and nonutilization of coupling materials in the second study mentioned. In this study, the coupling material was not used and the sensing fabric electrode contacts directly to the skin. Thus, it showed larger contact impedance than that of Ag/AgCl, and the R-peaks in the Bioshirt were checked and found to be small.
In comparisons of the effect of noises depending on the running speed, the RIO value of IX/214 drops rapidly, but that of the Bioshirt was almost not affected. In the case of a conventional ECG device using cables, patient–electrode motion artifacts following cable shake and frictions would further increase during exercises. On the other hand, the Bioshirt does not use adhesive electrodes and cables, so exercise would not greatly add such noise. Generally, a bicycle exer-cise test is performed to increase the heart rate for the measurements of microscopic T-wave alternans in detecting arrhythmia or in the assessment of ventricular arrhythmia or a sudden cardiac death in patients suspected of having arrhythmia. The Bioshirt has tolerance to noise during exercises and does not use electric poles and wires that could interfere with exercises. In this aspect, the Bioshirt would be quite useful during exercise tests.27
Owing to characteristics of the Bioshirt, which has a high contact impedance, it may induce a larger low-frequency noise such as the baseline drift, developed by respiration and chest wall movement. Thus, it may mimic an ischemic change or there may be a possibility of masking an ST-segment change that actually exists. However, in the comparative analysis using a crest factor, it was revealed that there was almost no difference in low-frequency noise, and a technology was developed that allowed effective elimination of the baseline wander while preserving ST-segment change using digital technology. Thus, clinically, larger low-frequency noise would not be a problem.28
The wearable biosignal monitoring system is available first in the health and fitness area as chest bands, arm bands, and clothing. The Polar Electro of Sweden takes the lead in the wearable system’s mar-ket and the scope is gradually expanding.29 Nevertheless, these devic-es do not transmit ECG waveforms, but display heart rates through a peak detection process. Since data are stored in a memory bank and retrieved from a personal computer later on, they are largely applicable to sporting activities. Thus, it has limitations in real-time monitoring of high-risk patients.
174 TELEMEDICINE and e-HEALTH MARCH 2009
HONG ET AL.
The Vital jacket30 overcame this disadvantage. It is a commercially available wearable vital sign monitor that was developed for the first time to transmit vital signs and ECG data to a personal digital assis-tant (PDA) or a computer in real time. The Vital jacket, developed by IEETA (Institute of Electronics and Telematics Engineering of Aveiro/University of Aveiro, Aveiro, Portugal), would measure ECG, respira-tion, body temperature and body activity, and posture as well as store in secure digital (SD) memory or transmit to a PDA in a short distance (local area network [LAN]). This device uses disposable electrodes and is connected to a LAN module using wires. However, the Bioshirt is different from this device as follows: (1) The Bioshirt uses semiper-manent washable fabric electrode, (2) could be worn in few seconds, (3) does not use wires, and (4) was designed with much effort to cut various noises that develop in the wires at its outset. A precise com-parison of the Vital Jacket could not be made since detailed specifica-tions for the Vital jacket had not been known or reported.
This experiment was performed on a treadmill using ECG mod-ules in a fixed distance of Bluetooth dongle. It is necessary to have continuous studies to find out ECG transmission capability in actual moving situations, in an in-hospital environment where there are interferences such as the wall, and various wireless and medical devices present in the hospital as well as extreme situations such as the scene of a fire, or mountainous regions.
This experiment was performed on males only due to the conve-nience of shirt production; thus, it is necessary to conduct further investigations for various sexes and ages. A stable power supply must be provided in order to have monitoring for an extended period with analysis of limited duration of 5 minutes.
What are the problems that need to be solved first in order to apply the wearable system to the e-health service area? First, a wearable system should be applicable to the existing platform without using an additional hardware and should provide an easy access by any-one using a convenient user interface.31 Also, in cases where there are many residents in one place, resident identifying technology is required. Since health-related data are extremely private information, a high level of information security is necessary. A certain level of encryption is absolutely necessary during data transmission through data storage and gateway.32
In this study, ECG using a fabric electrode and Bluetooth wire-less network showed similar capacities in attaining and transmitting ECG data, during resting and exercises, as that of the conventional ECG using cables and standard Ag/AgCl electrodes. Notwithstanding various limits, a real-time monitoring of vital signs for the safety of subjects could be utilized effectively in observations of serious patients and in a high-risk working environment. Also, if it could be
connected to an early warning system, the efficiency of emergency medical services as well as the level of patient and family satisfaction might increase.
AcknowledgmentsThis study was supported by the IT R&D program of MKE/IITA
(A1100-0802-0112, Ubiquitous Health Monitoring Module and System Development).
Disclosure StatementNo competing financial interests exist.
REFERENCES
Ng JWP, Lo BPL, Wells O, Sloman M, Peters N, Darzi A, Toumazou C, Yang GZ. 1. Ubiquitous monitoring environment for wearable and implantable sensors. In: Proceedings of the 6th International Conference Ubiquitous Computing. Nottingham, UK, 2004.
Lorincz K, Malan DJ, Fulford-Jones TRF, Nawoj A, Clavel A, Shnayder V, 2. Mainland G, Welsh M, Moulton S. Sensor networks for emergency response: Challenges and opportunities. IEEE Pervasive Comput 2004;3:16–23.
Jea D, Srivastava MB. A remote medical monitoring and interaction sys-3. tem. In: Proceedings of the 4th International Conference on Mobile Systems, Applications and Services. Uppsala, Sweden, 2005.
Wood A, Virone G, Wu Y, Selavo L, Cao Q, Stoleru R, Lin S, He Z, Stankovic J, 4. Doan T, Fang L. ALARM-NET: Wireless sensor networks for assisted-living and residential monitoring. In: Proceedings of the 5th International Conference on Mobile Systems. San Juan, Puerto Rico, 2007.
Chen B, Peterson G, Mainland G, Welsh M. LiveNet: Using passive monitoring 5. to reconstruct sensor network dynamics. In: Proceedings of the 4th IEEE/ACM International Conference on Distributed Computing in Sensor Systems (DCOSS 2008). Santorini Island, Greece, 2008.
Thulasi BV, Srivatsa SK. Design of wearable cardiac telemedicine system. 6. Int J Electron Healthc 2007;3:303–316.
Park S, Jayaraman S. Enhancing the quality of life through wearable 7. technology. IEEE Eng Med Biol Mag 2003;22:41–48.
Carpi F, De Rossi D. Electroactive polymer-based devices for e-textiles in 8. biomedicine. IEEE Trans Inf Technol Biomed 2005;9:295–318.
Mundt CW, Montgomery KN, Udoh UE, Barker VN, Thonier GC, Tellier AM, Ricks 9. RD, Darling RB, Cagle YD, Cabrol NA, Ruoss SJ, Swain JL, Hines JW, Kovacs GT. A multiparameter wearable physiologic monitoring system for space and terrestrial applications. IEEE Trans Inf Technol Biomed 2005;9:382–391.
Paradiso R, Loriga G, Taccini N. A wearable health care system based on knitted 10. integrated sensors. IEEE Trans Inf Technol Biomed 2005;9:337–344.
Scilingo EP, Gemignani A, Paradiso R, Taccini N, Ghelarducci B, De Rossi D. 11. Performance evaluation of sensing fabrics for monitoring physiological and biomechanical variables. IEEE Trans Inf Technol Biomed 2005;9:345–352.
Loriga G, Taccini N, Pacelli M, Paradiso R. Flat knitted sensors for respiration 12. monitoring [From mind to market]. IEEE Ind Electron Mag 2007;1:4–7.
© MARY ANN LIEBERT, INC. • VOL. 15 NO. 2 • MARCH 2009 TELEMEDICINE and e-HEALTH 175
WEARABLE WIRELESS ECG MONITORING SYSTEM
Fulford-Jones TR, Wei GY, Welsh M. A portable, low-power, wireless two-lead 13. EKG system. Conf Proc IEEE Eng Med Biol Soc 2004;3:2141–2144.
Pacelli M, Loriga G, Taccini N, Paradiso R. Sensing fabrics for monitoring 14. physiological and biomechanical variable; E-textile solution. In: Proceedings of the 3rd IEEE-EMBS International Summer School and Symposium on Medical Devices and Biosensors. Boston: IEEE, 2006:1–4.
Clifford GD. ECG statistics, noise, artifacts, and missing data. In: Clifford GD, 15. Azuaje F, McSharry PE, eds. Advanced methods and tools for ECG data analysis. Norwood, MA: Artech House, 2006:69–71.
Satava R, Angood PB, Harnett B, Macedonia C, Merrell R. The physiologic cipher 16. at altitude: Telemedicine and real-time monitoring of climbers on Mount Everest. Telemed J e-Health 2000;6:303–313.
La Rovere MT, Pinna GD, Maestri R, Mortara A, Capomolla S, Febo O, Ferrari R, 17. Franchini M, Gnemmi M, Opasich C, Riccardi PG, Traversi E, Cobelli F. Short-term heart rate variability strongly predicts sudden cardiac death in chronic heart failure patients. Circulation 2003;107:565–570.
Dekker JM, Crow RS, Folsom AR, Hannan PJ, Liao D, Swenne CA, Schouten 18. EG. Low heart rate variability in a 2-minute rhythm strip predicts risk of coronary heart disease and mortality from several causes: The ARIC Study. Atherosclerosis Risk in Communities. Circulation 2000;102:1239–1244.
Lombardi F, Sandrone G, Pernpruner S, Sala R, Garimoldi M, Cerutti S, Baselli G, 19. Pagani M, Malliani A. Heart rate variability as an index of sympathovagal inter-action after myocardial infarction. Am J Cardiol 1987;60:239–241.
Tükek T, Yildiz P, Atilgan D, Tuzcu V, Eren M, Erk O, Demirel S, Akkaya V, 20. Dilmener M, Korkut F. Effect of diurnal variability of heart rate on development of arrhythmia in patients with chronic obstructive pulmonary disease. Int J Card 2003;88:199–206.
Pumprla J, Howorka K, Groves D, Chester M, Nolan J. Functional assessment of 21. heart rate variability: Physiological basis and practical applications. Int J Card 2002;84:1–14.
Massetani R, Strata G, Galli R, Gori S, Gneri C, Limbruno U, Di Santo D, Mariani 22. M, Murri L. Alteration of cardiac function in patients with temporal lobe epilepsy: Different roles of EEG-ECG monitoring and spectral analysis of RR variability. Epilepsia 1997;38:363–369.
Ahmad K, Dorian P. Drug-induced QT prolongation and proarrhythmia: 23. An inevitable link? Europace 2007;9(suppl 1):iv16–iv22.
Gencel L, Poquet F, Gosse P, Haissaguerre M, Margus FI, Clementy J. 24. Correlation of signal-averaged P wave with electrophysiologic testing for atrial vulnerability in stroke of unexplained etiology. Pacing Clin Electrophysiol 1994;17:2118–2124.
Verrier RL, Nearing BD. Electrophysiologic basis for T wave alternans as an 25. index of vulnerability to ventricular fibrillation. J Cardiovasc Electrophysiol 1994;5:445–461.
Ishijima M. Cardiopulmonary monitoring by textile electrodes without subject-26. awareness of being monitored. Med Biol Eng Comput 1997;35:685–690.
Raatikainen MJP. Microvolt T-wave alternans during exercise and pac-27. ing in patients with acute myocardial infarction. Pacing Clin Electrophysiol 2005;28(suppl 1):S193–S197.
Bailey JJ. The triangular wave test for electrocardiographic devices: A historical 28. perspective. J Electrocardiol 2004;37(suppl):71–73.
Polar Electro. http://www.polar.fi/, 29. 2008. (Last accessed March 28, 2008).
Vital Jacket. http://www.vitaljacket.com/, 30. 2008. (Last accessed June 28, 2008).
Economaks G, Koulouris A, Thanos A, Papakontantinou G, Tsanakas P. ECG han-31. dling on a telemedicine platform. J Telemed Telecare 1996;2:71–74.
E-health, security, and the new breed of practice management systems. 32. http://www.ubiquitymd.com/NMSWeb/company/WhitePaper.aspx, 2007. (Last accessed March 28, 2008).
Address reprint requests to:Jangyoung Lee, M.D.
Department of Emergency MedicineEulji University Hospital
1306, Dunsandong Seogu Daejeon 302799
Republic of Korea
E-mail: [email protected]
Received: May 15, 2008Accepted: July 15, 2008


![Biometric User Authentication on Smartphone …csis.pace.edu/~ctappert/it691-projects/techreports/2014...accelerometer-based biometric analysis for gait recognition [2][10][14][22]](https://img.pdfslide.net/doc/110x75/5f4d0f2f6cdd9c7fd650e094/biometric-user-authentication-on-smartphone-csispaceeductappertit691-projectstechreports2014.jpg)