Embed Size (px)
Citation preview
Perinatal and Maternal Mortality in New Zealand 2007
Third Report to the Minister of Health – July 2008 to June 2009
Perinatal and Maternal Mortality Review Committee
He matenga ohorere, he wairua uiui, wairua mutunga-kore
O eternal spirit – the grief of a sudden, untimely death but we will not stop our pursuit and endeavours to seek answers
Acknowledgements
The Perinatal and Maternal Mortality Review Committee (PMMRC) is grateful to the following groups and individuals for their assistance in the production of this report:
the lead maternity carers and District Health Board clinicians throughout New Zealand and the local coordinators • within each District Health Board who completed the rapid reporting forms that provided the data for this report
Vicki Masson, the national coordinator of the PMMRC, who ensured that the lists of mothers and infants and the • data set as a whole were complete and accurate to the greatest extent possible
the New Zealand Health Information Service (NZHIS) (now the information directorate within the Ministry of Health), • and especially Simon Ross (NZHIS) and Anne Howard (Population Statistics Unit Christchurch, which is part of Statistics New Zealand), for providing denominator data for births in 2007
the University of Otago’s Mortality Review Data Group, which established and maintained websites, collated the • data and produced the tables for this report
Dr Lynn Sadler, epidemiologist at Auckland District Health Board and the University of Auckland, who undertook • additional analyses and added figures and commentary
the members of the PMMRC who provided advice and guidance for the analysis, determined recommendations and • assisted with editing of the final report
the members of the Maternal Mortality Review Working Group (MMRWG) who worked on the maternal mortality • report
Associate Professor Elizabeth Sullivan (National Perinatal Statistics Unit, Australia), Professor Jeremy Oats (Chair of • the Victorian Consultative Council on Obstetric and Paediatric Mortality and Morbidity), Dr Pat Tuohy, and Dr Barry Taylor (Ministry of Health), who peer reviewed the report
the Ministry of Health secretariat, including Shelley Hanifan and Deon York, who have been involved in all stages of • this report.
Citation: PMMRC. 2009. Perinatal and Maternal Mortality in New Zealand 2007:Third Report to the Minister of Health July 2008 to June 2009.
Wellington: Ministry of Health.
Published in November 2009 by the Perinatal and Maternal Mortality Review Committee
PO Box 5013, Wellington, New Zealand
ISBH 978-0-478-33909-3 (Book)ISBN 978-0-478-33910-9 (Online)
HP 4964
This document is available on the Perinatal and Maternal Mortality Review Committee’s website at: http://www.pmmrc.health.govt.nz
Perinatal and Maternal Mortality in New Zealand 2007: Third Report to the Minister of Health – July 2008 to June 2009 iii
Perinatal and Maternal Mortality Review Committee (PMMRC)
The PMMRC committee members are:
Jacqueline Anderson, midwife •
Vicki Culling, Stillbirth and Neonatal Death Society (Sands)•
Dr Dawn Elder, paediatrician •
Professor Cynthia Farquhar (chair), obstetrician and gynaecologist and clinical epidemiologist •
Anja Hale, neonatal nurse specialist •
Deborah Harris, neonatal nurse practitioner •
Dr Ted Hughes, anaesthetist •
Associate Professor Lesley McCowan, obstetrician and maternal fetal medicine specialist •
Dr Stephanie Palmer, Màori health researcher •
Dr Jane Zuccollo, perinatal pathologist •
Maternal Mortality Review Working Group (MMRWG)
The MMRWG members are:
Jacqui Anderson, midwife•
Alison Eddy, midwife•
Professor Cynthia Farquhar, obstetrician and gynaecologist and clinical epidemiologist•
Dr Cathy Hapgood, perinatal psychiatrist•
Dr Al Haslam, obstetrician and gynaecologist•
Dr Jeanette McFarlane, pathologist•
Dr Claire McLintock (chair), obstetric physician •
Dr John Walker, anaesthetist •
Mollie Wilson, health manager•
Neonatal Encephalopathy Working Group (NEWG)
The NEWG members are:
Dr Malcolm Battin, neonatal paediatrician •
Professor Cynthia Farquhar, obstetrician and gynaecologist and clinical epidemiologist•
Dr Dawn Elder, paediatrician •
Anja Hale, neonatal nurse specialist•
Deborah Harris, neonatal nurse practitioner •
Associate Professor Lesley McCowan, obstetrician and maternal fetal medicine specialist•
Tomasina Stacey, midwife•
Dr Thorsten Stanley, paediatrician •
Rachel Taylor, team manager for the Accident Compensation Corporation•
Dr Alex Wallace, paediatrician •

Perinatal and Maternal Mortality in New Zealand 2007: Third Report to the Minister of Health – July 2008 to June 2009 v
Contents
Acknowledgements . . . . . . . . . . . . . . . . . . . . . . . . . . . . . . . . . . . . . . . . . . . . . . . . . . . . . . . . . . . .ii
Perinatal and Maternal Mortality Review Committee (PMMRC) members . . . . . . . . . . . . . . . . iii
Maternal Mortality Review Working Group (MMRWG) members . . . . . . . . . . . . . . . . . . . . . . . . iii
Neonatal Encepalopathy Working Group (NEWG) members . . . . . . . . . . . . . . . . . . . . . . . . . . . iii
Chair’s introduction .. . . . . . . . . . . . . . . . . . . . . . . . . . . . . . . . . . . . . . . . . . . . . . . . . . . . .1
Executive summary and recommendations .. . . . . . . . . . . . . . . . . . . . . . . . . . . . . . . .2
1 Perinatal mortality 2007. . . . . . . . . . . . . . . . . . . . . . . . . . . . . . . . . . . . . . . . . . . . . . .6
1.1 Introduction . . . . . . . . . . . . . . . . . . . . . . . . . . . . . . . . . . . . . . . . . . . . . . . . . . . . . .6
1.2 Methodology. . . . . . . . . . . . . . . . . . . . . . . . . . . . . . . . . . . . . . . . . . . . . . . . . . . . . .6
1.3 Births in New Zealand . . . . . . . . . . . . . . . . . . . . . . . . . . . . . . . . . . . . . . . . . . . . .11
1.4 Perinatal mortality 2007. . . . . . . . . . . . . . . . . . . . . . . . . . . . . . . . . . . . . . . . . . . .15
1.5 Investigation of perinatal related mortality . . . . . . . . . . . . . . . . . . . . . . . . . . . .17
2 New Zealand maternal mortality 2007 .. . . . . . . . . . . . . . . . . . . . . . . . . . . . . .43
2.1 Introduction . . . . . . . . . . . . . . . . . . . . . . . . . . . . . . . . . . . . . . . . . . . . . . . . . . . . .43
2.2 Methodology. . . . . . . . . . . . . . . . . . . . . . . . . . . . . . . . . . . . . . . . . . . . . . . . . . . . .44
2.3 Findings. . . . . . . . . . . . . . . . . . . . . . . . . . . . . . . . . . . . . . . . . . . . . . . . . . . . . . . . .44
3 PMMRC national coordinator report .. . . . . . . . . . . . . . . . . . . . . . . . . . . . . . . 47
4 Neonatal Encephalopathy Working Group report . . . . . . . . . . . . . . . . . . . . . . 48
5 Issues for parents, families and whànau. . . . . . . . . . . . . . . . . . . . . . . . . . . . . . 49
Appendix A: Classifications of the Perinatal Society of Australia and New Zealand . . . . . . . .50
Appendix B: Additional tables . . . . . . . . . . . . . . . . . . . . . . . . . . . . . . . . . . . . . . . . . . . . . . . . . .54
Appendix C: PMMRC DHB local coordinators July 2009 . . . . . . . . . . . . . . . . . . . . . . . . . . . . . .64
Appendix D: List of abbreviations . . . . . . . . . . . . . . . . . . . . . . . . . . . . . . . . . . . . . . . . . . . . . . . .66
References . . . . . . . . . . . . . . . . . . . . . . . . . . . . . . . . . . . . . . . . . . . . . . . . . . . . . . . . . . . . . . . . . .67
Perinatal and Maternal Mortality in New Zealand 2007: Third Report to the Minister of Health – July 2008 to June 2009vi
List of tables
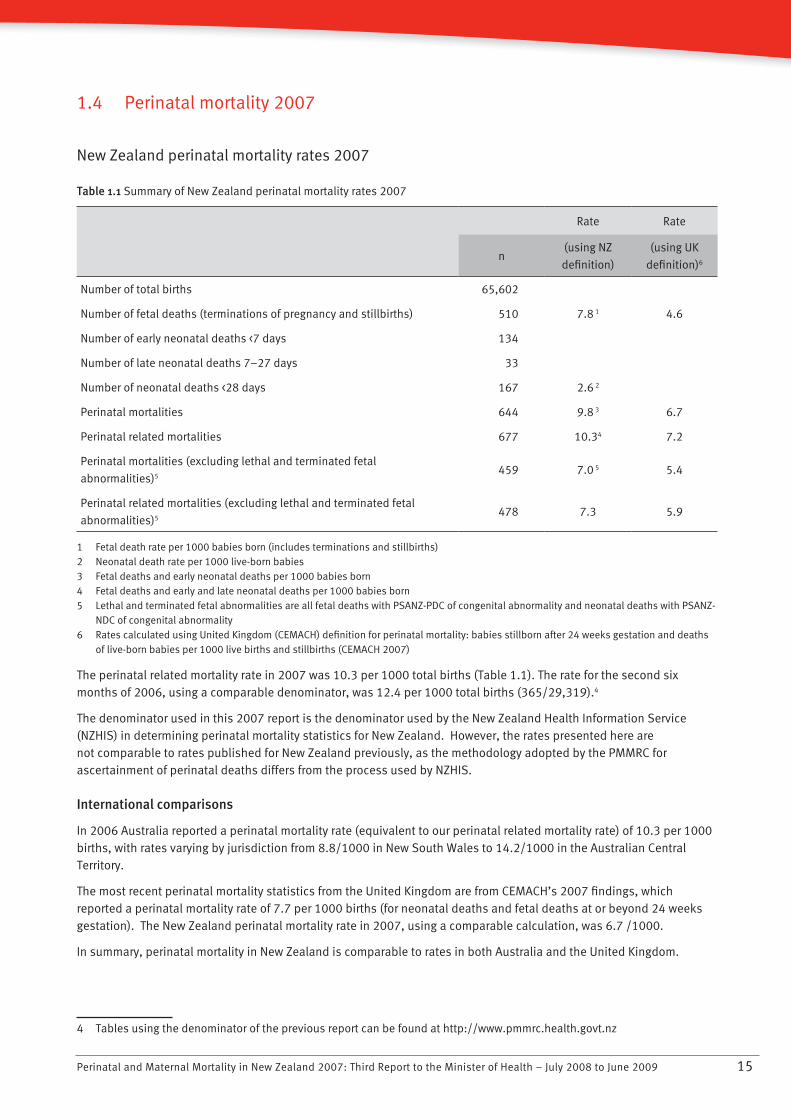
Table 1.1 Summary of New Zealand perinatal mortality rates 2007 15
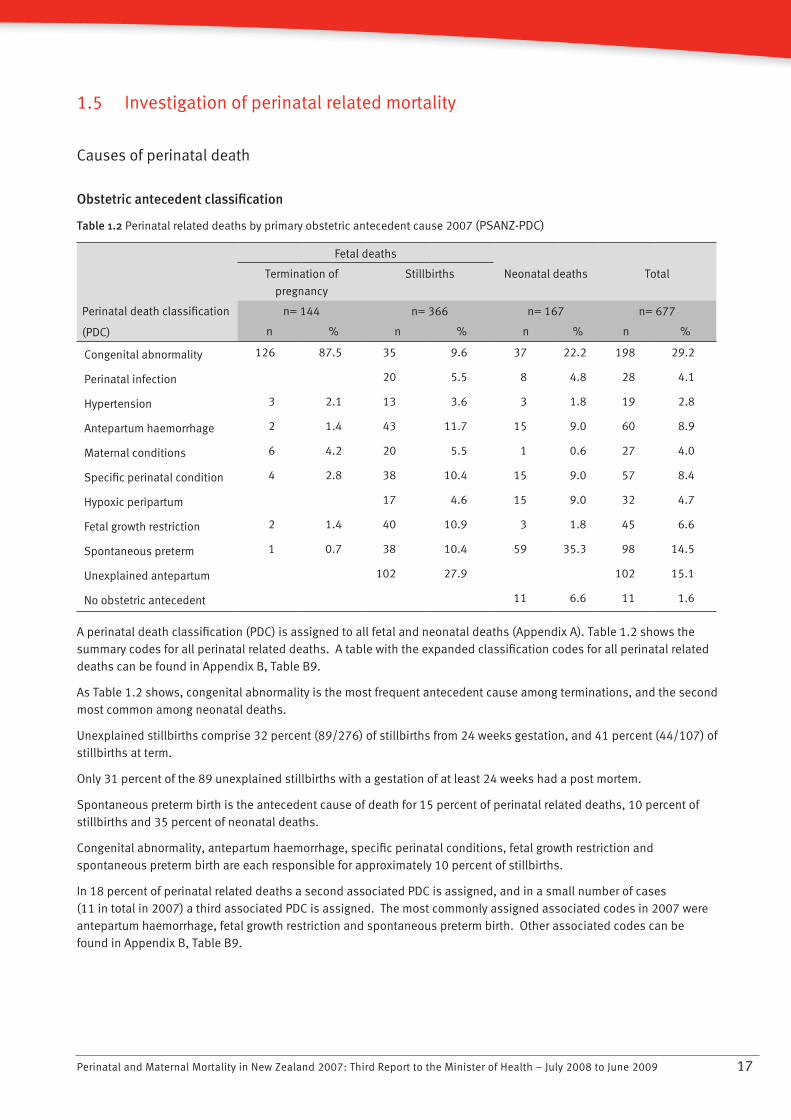
Table 1.2 Perinatal related deaths by primary obstetric antecedent cause 2007 17
Table 1.3 Timing of stillbirth relative to labour 2007 19
Table 1.4 Clinical details of neonatal deaths 2007 20
Table 1.5 Association between obstetric antecedent cause of death (PDC) and neonatal cause of death (NDC) among all neonatal deaths 2007 22
Table 1.6 Termination, stillbirth, neonatal and perinatal related mortality rates by gender and ethnicity 2007 24
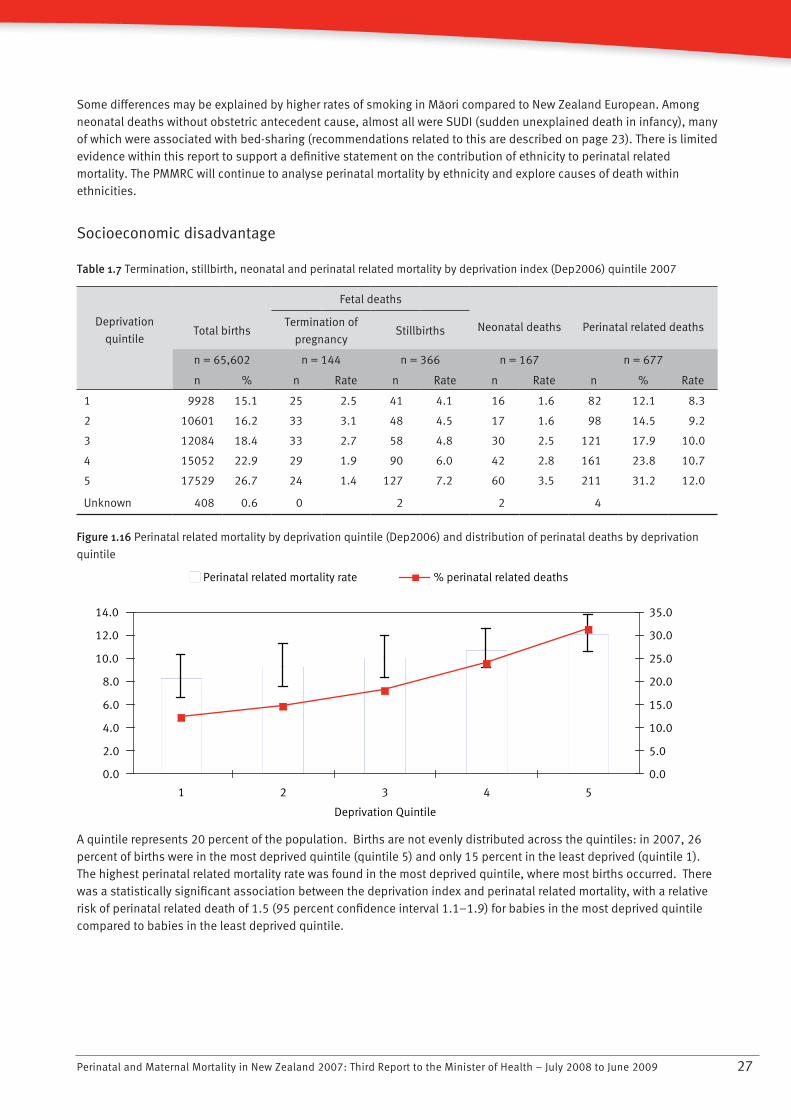
Table 1.7 Termination, stillbirth, neonatal and perinatal related mortality by deprivation index (Dep2006) quintile 2007 27
Table 1.8 Maternal age and perinatal related mortality 2007 30
Table 1.9 Multiple birth and perinatal related mortality 2007 31
Table 1.10 Maternal smoking at time of perinatal death and perinatal related mortality 2007 32
Table 1.11 Termination, stillbirth, neonatal and perinatal related death rates by gestation and birth weight 2007 33
Table 1.12 Primary obstetric antecedent cause (PDC) of fetal death by gestational age 2007 34
Table 1.13 Primary antecedent cause (PDC) of neonatal death and gestational age 2007 35
Table 1.14 Primary neonatal cause (NDC) of neonatal death by gestational age 2007 35
Table 1.15 Booking status of mothers of perinatal deaths 2007 36
Table 1.16 LMC at booking and LMC at birth (stillbirths and neonatal deaths) 2007 37
Table 1.17 Screening for diabetes among booked women with no pre-existing diabetes and where perinatal death occurred at or beyond 28 weeks gestation 2007 38
Table 1.18 Screening for family violence 2007 38
Table 1.19 Vaginal bleeding during pregnancy among perinatal deaths 2007 39
Table 1.20 SGA among perinatal related deaths 2007 40
Table 1.21 Antenatal diagnosis of SGA among stillbirths and neonatal deaths at 24 weeks gestation or more, excluding lethal congenital abnormalities 2007 40
Table 1.22 Intended place of birth versus actual place of birth among stillbirths and neonatal deaths 2007 41
Table 1.23 Maternal outcome associated with perinatal related mortalities 2007 41
Table 1.24 Completeness of perinatal investigations following perinatal death 2007 42
Table 2.1 Classification of maternal deaths 45
Table 2.2 Time of death related to pregnancy 45
Table 2.3 Place of birth of mother who died 45
Table 2.4 Place of death 45
List of appendix tables
Table B1 Perinatal related mortality by DHB of maternal domicile 2007 54
Table B2 Distribution of births by deprivation decile (Dep 2006) 2007 55
Table B3 Perinatal related mortality by maternal ethnicity 2007 55
Table B4 Màori and New Zealand European PDC-specific perinatal related mortality rates 2007 56
Table B5 PDC-specific perinatal related mortality rate by deprivation quintile (Dep 2006) 2007 56
Table B6 Perinatal related deaths by primary and associated obstetric antecedent cause of death (PDC) 2007 57
Table B7 Neonatal deaths by primary and associated neonatal death classification (NDC) 2007 57
Table B8 Optimal investigation of perinatal related death by DHB of maternal residence 2007 58
Table B9 Complete primary perinatal death classification (PDC) by type of perinatal related death 2007 59
Table B10 Complete primary neonatal death classification (NDC) for neonatal death 2007 63
Perinatal and Maternal Mortality in New Zealand 2007: Third Report to the Minister of Health – July 2008 to June 2009 vii
List of figures
Figure 1.1 Flow of information in the PMMRC’s perinatal data collection process 7
Figure 1.2 Births in New Zealand 1991–2007 11
Figure 1.3 Distribution of maternal age among births in New Zealand 2007 11
Figure 1.4 Distribution of ethnicity (baby) among births in New Zealand 2007 12
Figure 1.5 Distribution of deprivation deciles among births in New Zealand 2007 12
Figure 1.6 Distribution of births by DHB of maternal residence 2007 13
Figure 1.7 Distribution of ethnicity by DHB of residence 2007 13
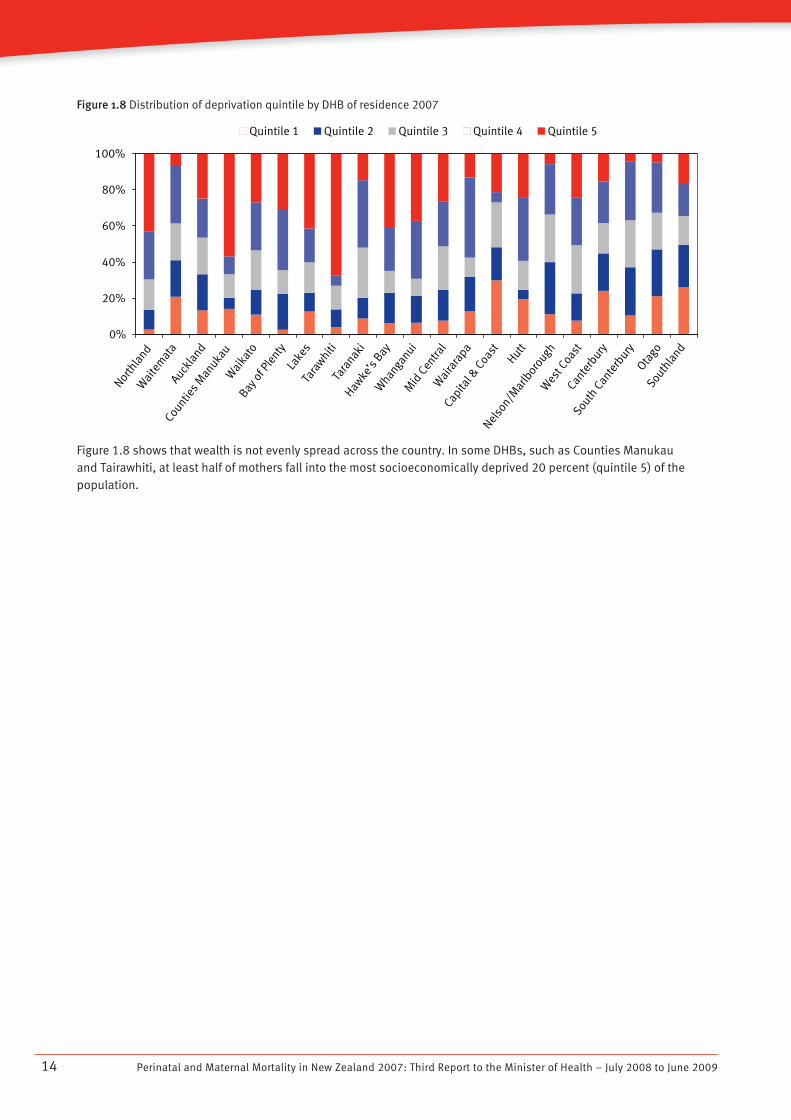
Figure 1.8 Distribution of deprivation quintile by DHB of residence 2007 14
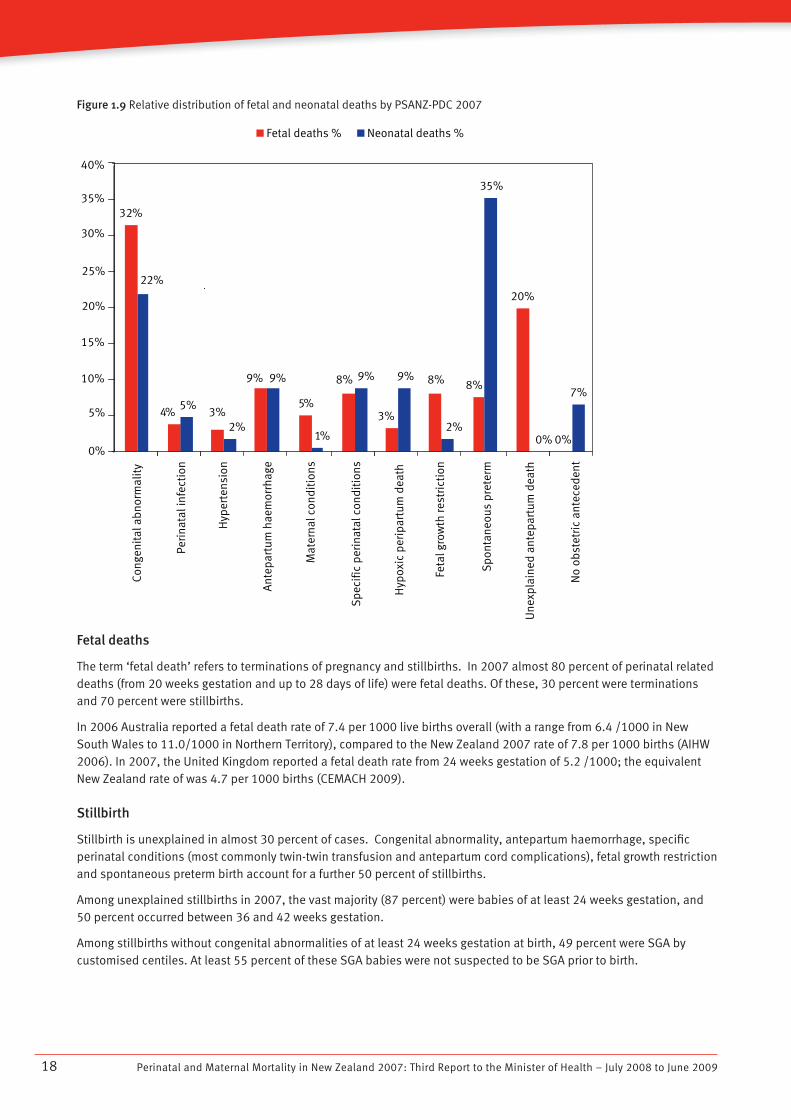
Figure 1.9 Relative distribution of fetal and neonatal deaths by PSANZ-PDC 2007 18
Figure 1.10 Primary neonatal death classification (PSANZ-NDC) 2007 21
Figure 1.11 Baby ethnic-specific late termination rates 2007 24
Figure 1.12 Baby ethnic-specific stillbirth rates 2007 25
Figure 1.13 Baby ethnic-specific neonatal death rates 2007 25
Figure 1.14 Baby ethnic-specific perinatal related mortality rates 2007 25
Figure 1.15 Màori and New Zealand European Perinatal death classification-specific perinatal related mortality rates 2007 26
Figure 1.16 Perinatal related mortality by deprivation quintile (Dep2006) and distribution of perinatal deaths by deprivation quintile 27
Figure 1.17 Perinatal death classification-specific perinatal related mortality rates by deprivation quintile 2007 28
Figure 1.18 Perinatal related mortality rates by DHB of residence compared to New Zealand perinatal related mortality 2007 29
Figure 1.19 Perinatal related mortality by maternal age (with 95 percent confidence intervals) and distribution of perinatal related deaths by maternal age 30

Perinatal and Maternal Mortality in New Zealand 2007: Third Report to the Minister of Health – July 2008 to June 2009 1
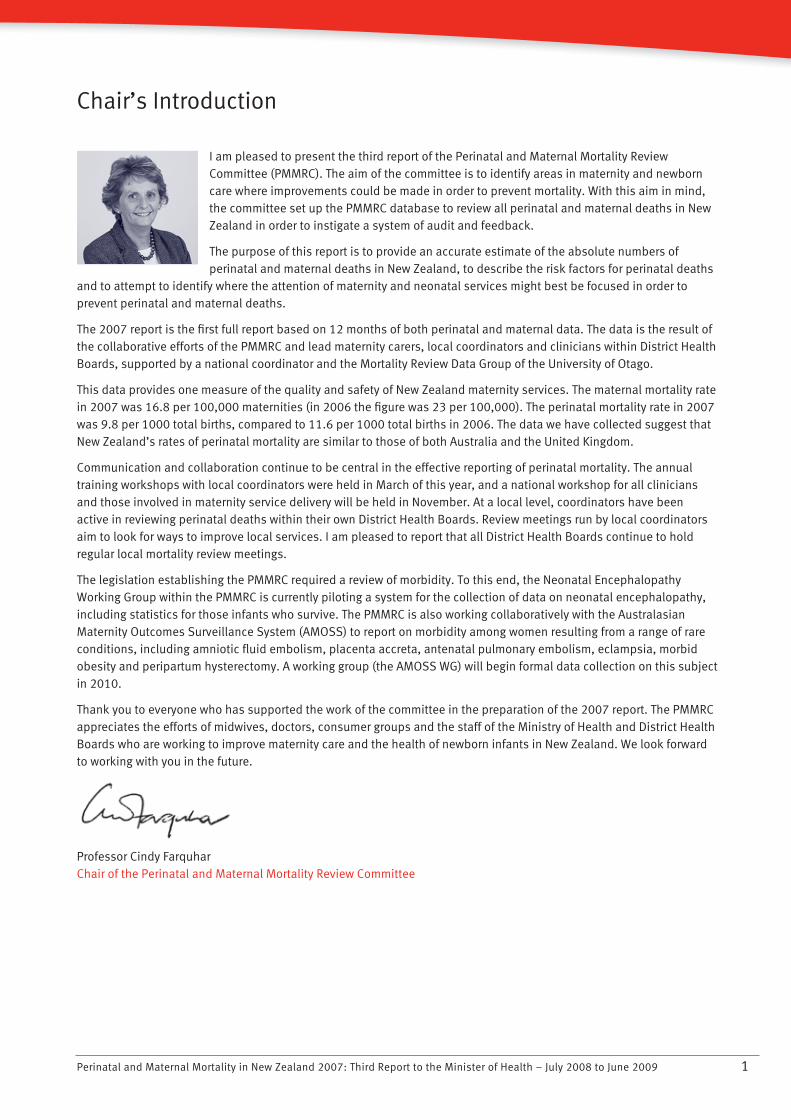
Chair’s Introduction
I am pleased to present the third report of the Perinatal and Maternal Mortality Review Committee (PMMRC). The aim of the committee is to identify areas in maternity and newborn care where improvements could be made in order to prevent mortality. With this aim in mind, the committee set up the PMMRC database to review all perinatal and maternal deaths in New Zealand in order to instigate a system of audit and feedback.
The purpose of this report is to provide an accurate estimate of the absolute numbers of perinatal and maternal deaths in New Zealand, to describe the risk factors for perinatal deaths
and to attempt to identify where the attention of maternity and neonatal services might best be focused in order to prevent perinatal and maternal deaths.
The 2007 report is the first full report based on 12 months of both perinatal and maternal data. The data is the result of the collaborative efforts of the PMMRC and lead maternity carers, local coordinators and clinicians within District Health Boards, supported by a national coordinator and the Mortality Review Data Group of the University of Otago.
This data provides one measure of the quality and safety of New Zealand maternity services. The maternal mortality rate in 2007 was 16.8 per 100,000 maternities (in 2006 the figure was 23 per 100,000). The perinatal mortality rate in 2007 was 9.8 per 1000 total births, compared to 11.6 per 1000 total births in 2006. The data we have collected suggest that New Zealand’s rates of perinatal mortality are similar to those of both Australia and the United Kingdom.
Communication and collaboration continue to be central in the effective reporting of perinatal mortality. The annual training workshops with local coordinators were held in March of this year, and a national workshop for all clinicians and those involved in maternity service delivery will be held in November. At a local level, coordinators have been active in reviewing perinatal deaths within their own District Health Boards. Review meetings run by local coordinators aim to look for ways to improve local services. I am pleased to report that all District Health Boards continue to hold regular local mortality review meetings.
The legislation establishing the PMMRC required a review of morbidity. To this end, the Neonatal Encephalopathy Working Group within the PMMRC is currently piloting a system for the collection of data on neonatal encephalopathy, including statistics for those infants who survive. The PMMRC is also working collaboratively with the Australasian Maternity Outcomes Surveillance System (AMOSS) to report on morbidity among women resulting from a range of rare conditions, including amniotic fluid embolism, placenta accreta, antenatal pulmonary embolism, eclampsia, morbid obesity and peripartum hysterectomy. A working group (the AMOSS WG) will begin formal data collection on this subject in 2010.
Thank you to everyone who has supported the work of the committee in the preparation of the 2007 report. The PMMRC appreciates the efforts of midwives, doctors, consumer groups and the staff of the Ministry of Health and District Health Boards who are working to improve maternity care and the health of newborn infants in New Zealand. We look forward to working with you in the future.
Professor Cindy Farquhar Chair of the Perinatal and Maternal Mortality Review Committee
Perinatal and Maternal Mortality in New Zealand 2007: Third Report to the Minister of Health – July 2008 to June 20092
Executive Summary and Recommendations
Terms of reference and mortality definitions for the purposes of this report
The Perinatal and Maternal Mortality Review Committee (PMMRC) is responsible for reviewing maternal deaths and • deaths of infants born between 20 weeks gestation (or weighing at least 400 g, if gestation is unknown) and 28 days of age.
A maternal death for the purposes of this report was defined as the death of a woman while pregnant or within 42 • days of termination of pregnancy, irrespective of the duration or site of the pregnancy, from any cause related to or aggravated by the pregnancy or its management, but not from accidental or incidental causes.
The maternal mortality ratio was calculated per 100,000 maternities. Maternities were defined as all live births • and fetal deaths at 20 weeks of gestation or beyond, or where the fetus weighed at least 400 g, if gestation was unknown.
The perinatal mortality rate was defined as fetal death (including terminations of pregnancy and stillbirths) and • early neonatal death (at up to seven days of age) per 1000 babies born at 20 weeks of gestation or beyond, or where the fetus weighed at least 400 g, if gestation was unknown.
Neonatal mortality was defined as all deaths from birth to 28 days of age inclusive.•
Key points
2007 was the first year the PMMRC could present a full set of perinatal mortality data.•
Perinatal mortality in 2007 was 9.8 per 1000 births and perinatal related mortality (fetal deaths and neonatal • deaths up to 28 days of age) 10.3 per 1000 births. 2007 rates were lower than those of 2006. The decrease should be interpreted with caution, given that the 2006 rates were calculated based on only six months of data.
The perinatal mortality rate in New Zealand in 2007 was comparable to rates in both Australia (based on 2006 • data) and the United Kingdom (based on 2007 data), although slightly different definitions are used in those countries.
In New Zealand in 2007, stillbirth was unexplained in 32 percent of deaths from 24 weeks gestation and 41 percent • of stillbirths at term. Sixty-nine percent of unexplained stillbirths from 24 weeks did not have a post mortem.
The intrapartum stillbirth rate was 0.44/1000 in 2007. More than 80 percent of these babies were born at term • and 80 percent were appropriately grown for gestational age. Only 41 percent had a post-mortem. International comparisons are difficult to make because of variations in the definition of intrapartum stillbirth. However, such deaths may be preventable. For this reason, the PMMRC are collecting prospective data from 2009 on potentially avoidable factors in perinatal death.
In 2007 there were 10 neonatal deaths of healthy babies recorded that were associated with unsafe sleeping • practices, including co-sleeping.
Although the point estimates are slightly higher for Màori, Pacific and Indian babies than for other ethnicities, • there were no significant differences in perinatal related mortality by ethnicity in 2007. While this is reassuring, the number of deaths in each ethnic group is small, and the scarcity of the data may mask a significant association between ethnicity and perinatal related mortality.
There is a statistically significant association between the deprivation index and perinatal related mortality, with a • relative risk of perinatal related death of 1.5 (95 percent confidence interval 1.1–1.9) for babies born to mothers in the most deprived quintile compared to babies born to mothers in the least deprived quintile.
Perinatal and Maternal Mortality in New Zealand 2007: Third Report to the Minister of Health – July 2008 to June 2009 3
In 2007, the perinatal related mortality rate among mothers residing in Counties Manukau exceeded the national • rate. This is not a new finding. Counties Manukau also reported a significantly higher perinatal mortality rate for the period 2000–2004 (NZHIS, 2007a).
The proportion of babies optimally investigated (post-mortem or karyotype confirming diagnosis) following • perinatal death in 2007 varied by ethnicity and by District Health Board (DHB) of residence.
There is some uncertainty over exactly how many babies are born in New Zealand each year because of the current • process for birth notification and registration. Unfortunately this means that exact rates of perinatal and maternal mortality cannot be calculated with complete accuracy.
Lack of detailed information about all women who give birth in New Zealand restricts our ability to analyse the • importance of potential predictors of perinatal death.
There were 14 maternal deaths in 2006 and 11 maternal deaths in 2007. It is not possible to comment on trends in • maternal mortality on the basis of only two years’ worth of data.
Recommendations relating to perinatal and maternal mortality
Recommendations for the Ministry of Health and DHBs
Birth information 1.
In order to report on the quality of all aspects of New Zealand maternity services, a national perinatal epidemiology • unit should be established.
The current birth registration dataset• 1 should be required to henceforth include maternity data. (For example, parity, major complications, mode of birth, history of smoking and previous obstetric history.)
New legislation should enable Births, Deaths and Marriages to accept National Health Index data and update the • routine National Health Index dataset with regard to ethnicity.
The Ministry of Health should continue to support and fund DHBs and lead maternity carers (LMCs) in their • collection of complete perinatal mortality statistics.
Sudden unexplained deaths in infancy (SUDI)2.
The Ministry of Health should prioritise the preparation and dissemination of a comprehensive statement for • parents and caregivers on risk factors and methods of prevention of SUDI to be provided to pregnant women.
National guidelines should be developed for safe sleeping arrangements in postnatal wards, to improve ward • safety and to model safe sleeping practices that parents can follow after discharge.
DHB disparities3.
Further research is warranted to understand the higher rate of perinatal related mortality in the Counties Manukau • region.
Early booking4.
The Ministry of Health, DHBs and professional colleges should collaboratively explore barriers to early booking, • with a view to increasing the number of women who book with an LMC before 10 weeks gestation.
A national media campaign should be considered.•
1 Currently compiled from notification by hospitals or LMCs within 5 days of birth and then completed when parents register birth.
Perinatal and Maternal Mortality in New Zealand 2007: Third Report to the Minister of Health – July 2008 to June 20094
Access to perinatal post mortems5.
The reasons for the differences in rates of optimally investigated perinatal deaths between DHBs need • investigation.
Hypertension in pregnancy6.
Obstetric units should adopt the evidence-based management of hypertension in pregnancy recommended by the • Society of Obstetric Medicine of Australia and New Zealand.2
Access to care7.
Strategies to improve awareness of antenatal care services and increase access among women who are isolated for • social, economic, cultural or language reasons should be developed.
Seat belts in pregnancy8.
There is a need for greater public awareness of the importance of wearing a seat belt during pregnancy. All • pregnant women should know that three-point seat belts should be worn throughout pregnancy, with the lap strap placed as low as possible beneath the ‘bump’, lying across the thighs, and the diagonal shoulder strap placed above the ‘bump’, lying between the breasts.
Support for parents, families and whànau.9.
Continued funding of support information to bereaved parents and families following perinatal death.•
Recommendations for clinicians and LMCs
Intrapartum stillbirths1.
Intrapartum deaths of babies at term without obvious congenital abnormality need full investigation, including a • post-mortem examination.
SUDI2.
Lead Maternity Carers should provide information to women and their family/whànau on SUDI prevention. This • information should include the following:
Smoking during pregnancy harms babies and increases the risk of Sudden Unexplained Death in Infancy • (SUDI), low birthweight and poor health. Women smoking during pregnancy should be supported to stop
Babies should be in a smoke-free environment•
Breastfeeding has many benefits for mothers and babies and should be encouraged and supported•
Babies should be placed to sleep face up in a safe place. The recommended safe sleeping environment is for • the baby to sleep in a cot or bassinet near the parents’ bed, on their back on a firm surface, positioned so that blankets or bedding cannot accidentally cover their face. Couches and sofas are very dangerous for babies to sleep on
Parents who have been using alcohol or other drugs or who are excessively tired should not sleep with their • babies
Babies who were born small or prematurely or whose mothers smoked during pregnancy should not sleep with • their parents.
2 This is available open-access through the Society’s website: http://www.somanz.org/pdfs/somanz_guidelines2008.pdf
Perinatal and Maternal Mortality in New Zealand 2007: Third Report to the Minister of Health – July 2008 to June 2009 5
Multiple pregnancies3.
All women with a multiple pregnancy should be offered an early specialist consultation, including ultrasound • diagnosis of chorionicity prior to 14 weeks gestation.
Women with high-risk monochorionic multiple pregnancies require fortnightly scans and specialist care. Advice is • available through the newly established New Zealand Fetal Medicine Network.
Antenatal care4.
Women should be encouraged to book with an LMC by 10 weeks gestation, so that the LMC is able to provide • timely prenatal advice and screening and facilitate referral to specialist services if appropriate.
Women and their family/whànau should be encouraged to attend smoking cessation programmes.•
Bleeding in pregnancy5.
Women who experience vaginal bleeding after 20 weeks gestation should have monthly serial growth scans and be • advised that there is an increased risk of spontaneous preterm birth.3
GROW (gestation related optimal weight) charts6. 3
In order to improve the detection and outcomes of small for gestational age (SGA) babies: •
LMCs should create GROW charts for women booking their services, and establish the existence or otherwise • of previous SGA pregnancies, in order to manage current risk
fundal height measurements should be plotted on a woman’s individualised growth chart (see, for example, • the Gestation Network’s website, www.gestation.net)
all women suspected to be carrying an SGA baby should have an ultrasound to check the baby’s growth, and • be referred appropriately if an SGA baby is confirmed.
Uptake of perinatal post mortems7.
Lead maternity carers should provide information for families and clinicians, including distribution of the recently • published pànui (information) for post-mortem examination.
Team approach to care8.
Women with complex medical conditions require a multidisciplinary approach to care, often across more than one • DHB. Each woman requiring such care should be assigned a key clinician to facilitate her care.
Use of seat belts in pregnancy9.
LMCs should advise pregnant woman that three-point seat belts should be worn throughout pregnancy with the • lap strap placed as low as possible beneath the ‘bump’, lying across the thighs, and the diagonal shoulder strap placed above the ‘bump’, lying between the breasts.
Recommendations for future PMMRC reporting
An analysis of each termination for congenital abnormality should be undertaken to determine whether earlier • diagnosis might have been possible.
An analysis into the preventability of intrapartum stillbirth should be undertaken.•
An analysis of perinatal mortality by ethnicity to explore causes of perinatal death should be undertaken. •
An analysis should be undertaken of key data items from all DHBs with 60 or more perinatal losses in their • residential area in a three-year period compared to national data, to facilitate local quality improvement.
3 A similar recommendation was made in the PMMRC 2006 report.
Perinatal and Maternal Mortality in New Zealand 2007: Third Report to the Minister of Health – July 2008 to June 20096
1. Perinatal Mortality 2007
1.1 Introduction
In New Zealand, maternity care is funded by the Ministry of Health. It is provided nationally by 21 District Health Boards (DHBs) and by lead maternity carers (LMCs), who receive funding from the Ministry of Health. LMCs may be self-employed midwives, general practitioners, private obstetricians or hospital-based midwives and obstetricians. Their services are free except in the case of private obstetricians, who have the right to charge for their services.
LMCs are required to sign access agreements with any maternity facility where they intend to provide care.
Women have the right to choose who they engage as their LMC. However, professional colleges and the Ministry of Health provide guidelines about appropriate care for mothers with risk factors.
1.2 Methodology
Data sources
The perinatal deaths presented in this report occurred between 1 January and 31 December 2007. The inclusion criteria for this report are based on date of death, not date of birth or of death registration.
An expanded description of data collection methods for this report is available in the first Perinatal and Maternal Mortality Review Committee (PMMRC) report (PMMRC 2007).
After establishment of the PMMRC, and following consultation with and agreement from stakeholders, it was agreed that reviewing all perinatal deaths would require the collection of detailed clinical information on each perinatal death with the assistance of the LMC and the DHBs.
The PMMRC approached all DHBs in New Zealand, requesting that they help to establish a network of local PMMRC coordinators. Individual coordinators within each DHB identified perinatal deaths and oversaw collection of the required data. These data were submitted to the Mortality Review Data Group at the University of Otago, which added them to a central national dataset. The coordinators were also responsible for initiating local clinical review of each case, including the assignation of classification codes, and for ensuring appropriate, timely follow-up with parents.
The dataset of perinatal deaths is a compilation of data submitted by the local coordinators, death notifications and some additional data from Births, Deaths and Marriages (BDM). A website commissioned by the PMMRC and run by the University of Otago enables web-based data entry. Lead maternity carers are required to complete rapid reporting forms within 48 hours of a perinatal death. One form contains information on the mother – for example, her past medical and obstetric history and details of the birth – and one form contains information on the baby. Improvements to the base questions on these forms are made annually to ensure the data collected is robust.
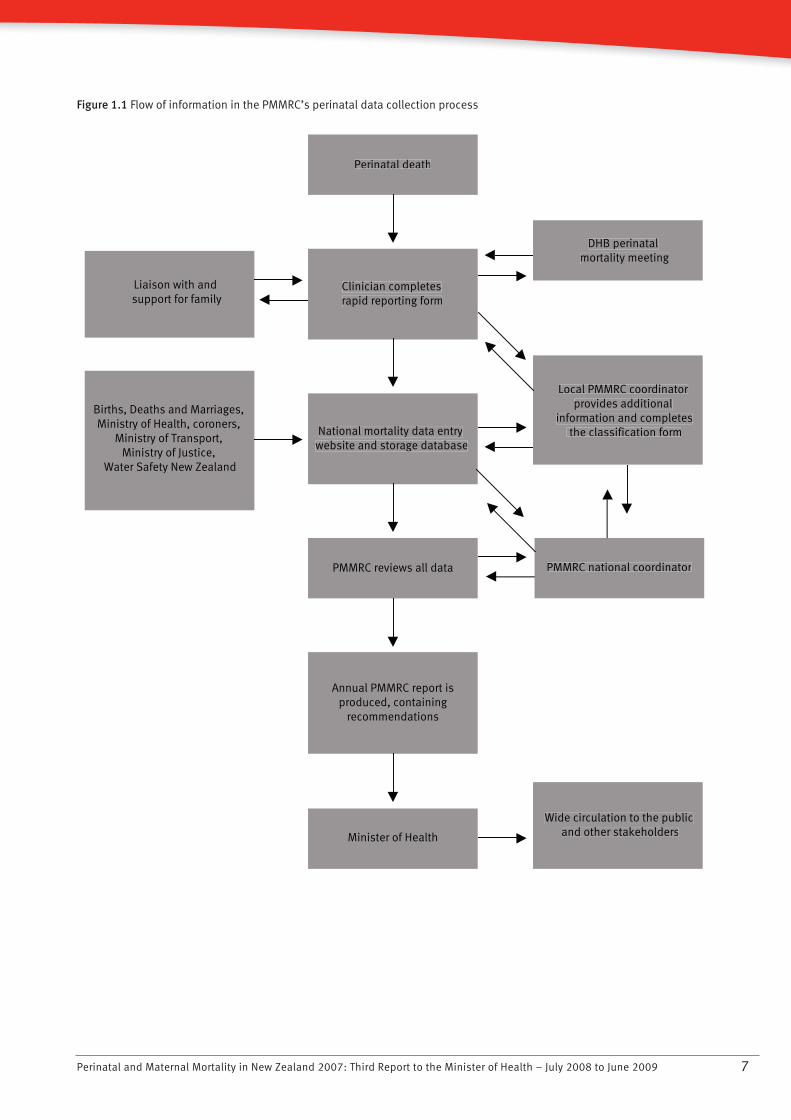
After local review, the local coordinator completes the PMMRC classification form. The classification system that has been adopted is the Perinatal Society of Australia and New Zealand (PSANZ) system of classification (PSANZ 2005). This system includes both perinatal and neonatal classifications (listed in Appendix A of this report). The local coordinator also attaches post mortem and histology reports to the classification form. Figure 1.1 describes the PMMRC process.
A user guide describing the definitions and data elements used by the PMMRC (PMMRC 2006) is available online (http://www.pmmrc.health.govt.nz).
Perinatal deaths that occur outside hospital are most often identified through the coroner or the BDM register. In this case the local coordinator arranges with the mother’s LMC for the completion of the rapid reporting forms and classification forms.
Perinatal and Maternal Mortality in New Zealand 2007: Third Report to the Minister of Health – July 2008 to June 2009 7
Figure 1.1 Flow of information in the PMMRC’s perinatal data collection process
Liaison with and support for family
Births, Deaths and Marriages, Ministry of Health, coroners,
Ministry of Transport, Ministry of Justice,
Water Safety New Zealand
PMMRC reviews all data
Annual PMMRC report is produced, containing
recommendations
Minister of Health
National mortality data entry website and storage databaseNational mortality data entry website and storage database
Clinician completes rapid reporting formClinician completes rapid reporting form
Perinatal deathPerinatal death
Local PMMRC coordinator provides additional
information and completes the classification form
Local PMMRC coordinator provides additional
information and completes the classification form
Wide circulation to the public and other stakeholders
Wide circulation to the public and other stakeholders
DHB perinatal mortality meeting
DHB perinatal mortality meeting
PMMRC national coordinatorPMMRC national coordinator
Perinatal and Maternal Mortality in New Zealand 2007: Third Report to the Minister of Health – July 2008 to June 20098
A national coordinator for the PMMRC was appointed in October 2006. This position was established to ensure timely completion of all rapid reporting forms and classification forms, and to provide support and education to local coordinators.
PMMRC data validation
Data are regularly cleaned to eliminate duplicate records, follow up missing mother or baby forms, clarify DHB of residence (where this is inconsistent with the given residential address) and rectify other inconsistencies.
All ‘cause of perinatal death’ classifications are reviewed by the national coordinator. Complicated cases are checked with Associate Professor Lesley McCowan (PMMRC member with expertise in stillbirth research and classifications), with advice from the PMMRC as required.
The national coordinator audits all data supplied on a random selection of 15 percent of perinatal deaths by comparing these data with clinical records from the relevant DHBs.
As part of the audit of data, the national coordinator assigns a perinatal death classification (PDC) and neonatal death classification (NDC) (as applicable) to all audited deaths and compares them with the original classification. In 2007 in 6 percent of cases the audited and original classification varied; in another 8 percent the subcategory varied. The remainder of the entered data fields on the rapid reporting forms was accurate in cases where data were entered, but available data had not been entered in some records.
Denominator data
The denominator in this report consists of New Zealand birth registrations during the 2007 calendar year. This dataset best approximates the number of births in a year in New Zealand. It is closer to the true number of births than the hospital discharge dataset used in the 2006 report, as it includes births outside of hospitals. Further, and more usefully for research purposes, it presents ethnicity data as notified by parents upon birth registration. Ethnicity in the hospital discharge dataset (otherwise known as the national minimum dataset (NMDS)) is also provided by mothers for themselves and for their babies, and becomes part of the National Health Index dataset (NHI). However, comparisons between the two datasets have shown significant ethnicity differences, and it is principally for this reason that the birth registration dataset has been used for the 2007 report.
The birth registration dataset of New Zealand births is collated by BDM from birth notifications supplied by public and private hospitals and by LMCs in the case of homebirths. These births are only added to the birth registration dataset when the birth is registered by the parents, which can occur up to some years following birth. The registration dataset is based on date of registration, and so includes births from previous years and less than all births from the current year. While this dataset is probably the most accurate representation of total number of births in a year, it does not truly represent denominator data.
A disadvantage of the birth registration dataset for reporting of maternity analyses in New Zealand is its limited scope of maternity data. The dataset does not include an individual’s unique NHI identification number, and so the data it contains cannot be linked to hospital discharge data or LMC data for further analyses.
Data analysis
Frequencies and discrete statistics were computed from the PMMRC database by the Mortality Review Data Group. Percentages have been displayed with one decimal place. In some cases, due to rounding, the percentages do not add to exactly 100 percent.
In figures where graphs have two axes, the data relating to the left-sided axis are presented as bars and the data relating to the right-sided axis are presented as points, joined by a line where they represent continuous or ordinal data.
Ninety-five percent confidence intervals for mortality rates have been computed using the ‘exact’ method. The confidence interval represents the degree of uncertainty around the point estimate of the rate for this particular
Perinatal and Maternal Mortality in New Zealand 2007: Third Report to the Minister of Health – July 2008 to June 2009 9
12-month period. This uncertainty depends on the absolute number of deaths and the number of births from which the deaths arose. If the number of births is large then the confidence interval (that is, the level of uncertainty) is generally small, while if the number of births is small the confidence interval is large. The confidence interval represents the limits within which the ‘true’ rate is most likely to lie. This calculation is necessary when numbers are small because the point estimate of the rate calculated from the data given may by chance have taken a wide range of values. The confidence interval describes this range.
It is possible to compare rates by looking at the confidence intervals. If the confidence intervals for two rates do not overlap it is likely the rates are different. This is equivalent to the rates being statistically significantly different at the p<0.05 level. If the confidence intervals do overlap, they may or may not be different.
In Figure 1.18, which shows perinatal related mortality by residence, the confidence intervals for perinatal related mortality by DHB of residence have been plotted along with the national perinatal related mortality rate. If the confidence interval for the DHB of residence rate does not include the national rate, then it is likely that this rate differs from the national average rate.
Where cases have missing data, they have been included in the data tables or discussed in the text. Percentages in the tables generally include missing data, though the text sometimes describes findings among women with complete data only. Where missing data exceeds 30 percent of all possible data points, the data have generally not been presented.
Definitions
Ethnicity
Ethnicity data on deaths were collected in two ways: from information supplied to the BDM Registrar, and from rapid reporting forms completed by LMCs. In both instances, ethnicity recorded is that identified by the mother/parents. There is no ‘validation’ of baby ethnicity in the deaths dataset (held by BDM). The death registration form is usually completed by either the parents or a funeral director.
Multiple ethnicities can be identified for both mother and baby. The PMMRC has followed the Ethnicity Data Protocols for the Health and Disability Sector guidelines (Ministry of Health, 2004) for prioritising ethnicity. The tables in this report prioritise ethnicity into the following groups: Màori, Pacific, Indian, Other Asian, Other and New Zealand European. The report uses one prioritised ethnicity for each individual when ethnicity data are given.
Ethnicity from the death dataset held by BDM was used where it was available. Data from PMMRC rapid reporting forms were only used if BDM data were missing, such as when deaths had not been registered by the time of analysis.
Ethnicity-specific perinatal related mortality rates in this report were primarily analysed using baby ethnicity. However, maternal ethnicity-specific perinatal related mortality rates are presented in Appendix B, Table B3.
Denominator maternal and baby ethnicities are those provided by the parent(s) to BDM at birth registration, and are thus consistent with numerator data.
Perinatal and Maternal Mortality in New Zealand 2007: Third Report to the Minister of Health – July 2008 to June 200910
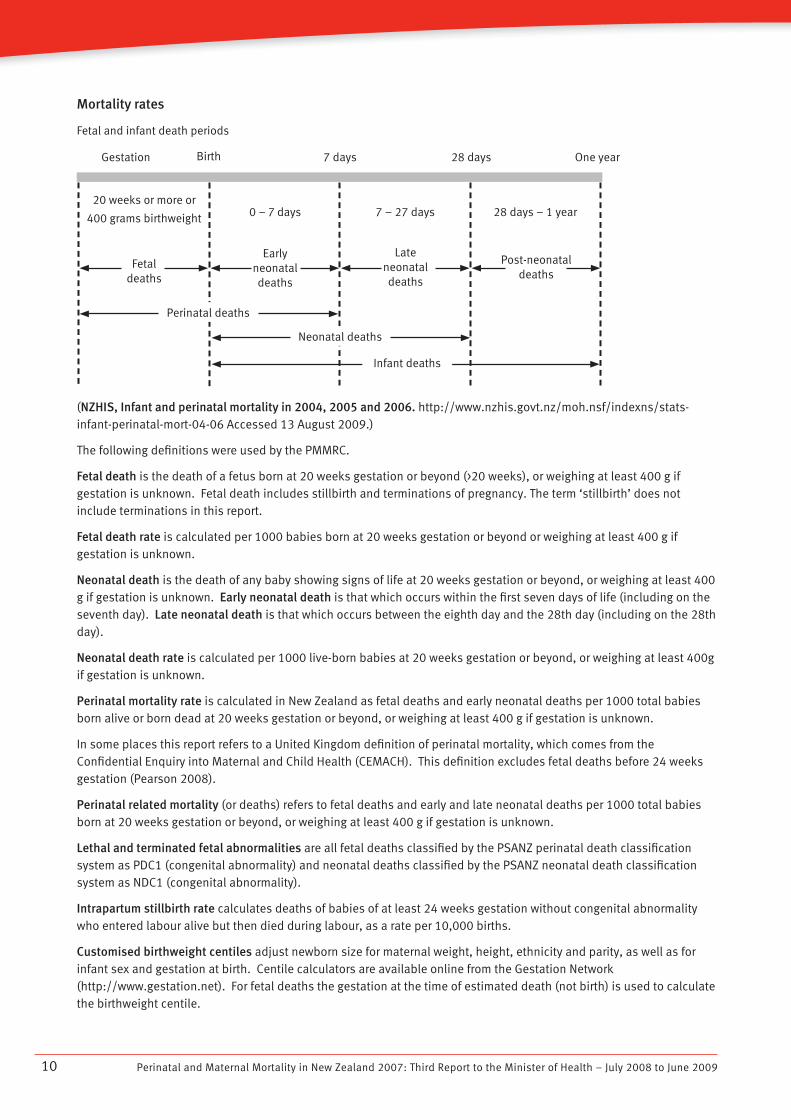
Mortality rates
(NZHIS, Infant and perinatal mortality in 2004, 2005 and 2006. http://www.nzhis.govt.nz/moh.nsf/indexns/stats-infant-perinatal-mort-04-06 Accessed 13 August 2009.)
The following definitions were used by the PMMRC.
Fetal death is the death of a fetus born at 20 weeks gestation or beyond (>20 weeks), or weighing at least 400 g if gestation is unknown. Fetal death includes stillbirth and terminations of pregnancy. The term ‘stillbirth’ does not include terminations in this report.
Fetal death rate is calculated per 1000 babies born at 20 weeks gestation or beyond or weighing at least 400 g if gestation is unknown.
Neonatal death is the death of any baby showing signs of life at 20 weeks gestation or beyond, or weighing at least 400 g if gestation is unknown. Early neonatal death is that which occurs within the first seven days of life (including on the seventh day). Late neonatal death is that which occurs between the eighth day and the 28th day (including on the 28th day).
Neonatal death rate is calculated per 1000 live-born babies at 20 weeks gestation or beyond, or weighing at least 400g if gestation is unknown.
Perinatal mortality rate is calculated in New Zealand as fetal deaths and early neonatal deaths per 1000 total babies born alive or born dead at 20 weeks gestation or beyond, or weighing at least 400 g if gestation is unknown.
In some places this report refers to a United Kingdom definition of perinatal mortality, which comes from the Confidential Enquiry into Maternal and Child Health (CEMACH). This definition excludes fetal deaths before 24 weeks gestation (Pearson 2008).
Perinatal related mortality (or deaths) refers to fetal deaths and early and late neonatal deaths per 1000 total babies born at 20 weeks gestation or beyond, or weighing at least 400 g if gestation is unknown.
Lethal and terminated fetal abnormalities are all fetal deaths classified by the PSANZ perinatal death classification system as PDC1 (congenital abnormality) and neonatal deaths classified by the PSANZ neonatal death classification system as NDC1 (congenital abnormality).
Intrapartum stillbirth rate calculates deaths of babies of at least 24 weeks gestation without congenital abnormality who entered labour alive but then died during labour, as a rate per 10,000 births.
Customised birthweight centiles adjust newborn size for maternal weight, height, ethnicity and parity, as well as for infant sex and gestation at birth. Centile calculators are available online from the Gestation Network (http://www.gestation.net). For fetal deaths the gestation at the time of estimated death (not birth) is used to calculate the birthweight centile.
Fetal and infant death periods
Gestation
20 weeks or more or
400 grams birthweight 0 – 7 days
Early neonatal deaths
Fetal deaths
Late neonatal deaths
Post-neonatal deaths
7 – 27 days 28 days – 1 year
Birth 7 days 28 days One year
Perinatal deaths
Neonatal deaths
Infant deaths
Perinatal and Maternal Mortality in New Zealand 2007: Third Report to the Minister of Health – July 2008 to June 2009 11
New Zealand Deprivation score (NZDep 2006) is a value within an index of socioeconomic deprivation based on variables from the Census of Population and Dwellings 2006. The score is assigned according to place of residence, and presented as a decile or quintile. Increasing deciles of deprivation, from least deprived at decile 1 to most deprived at decile 10, are associated with higher mortality and rates of many diseases (Salmond and Crampton 2002a, 2002b).
Lead maternity carer (LMC) is defined as the practitioner or caregiver service selected by the mother as the service that will have the legal, professional and practical responsibility for ensuring the mother and her baby receive clinically appropriate care up to and following birth.
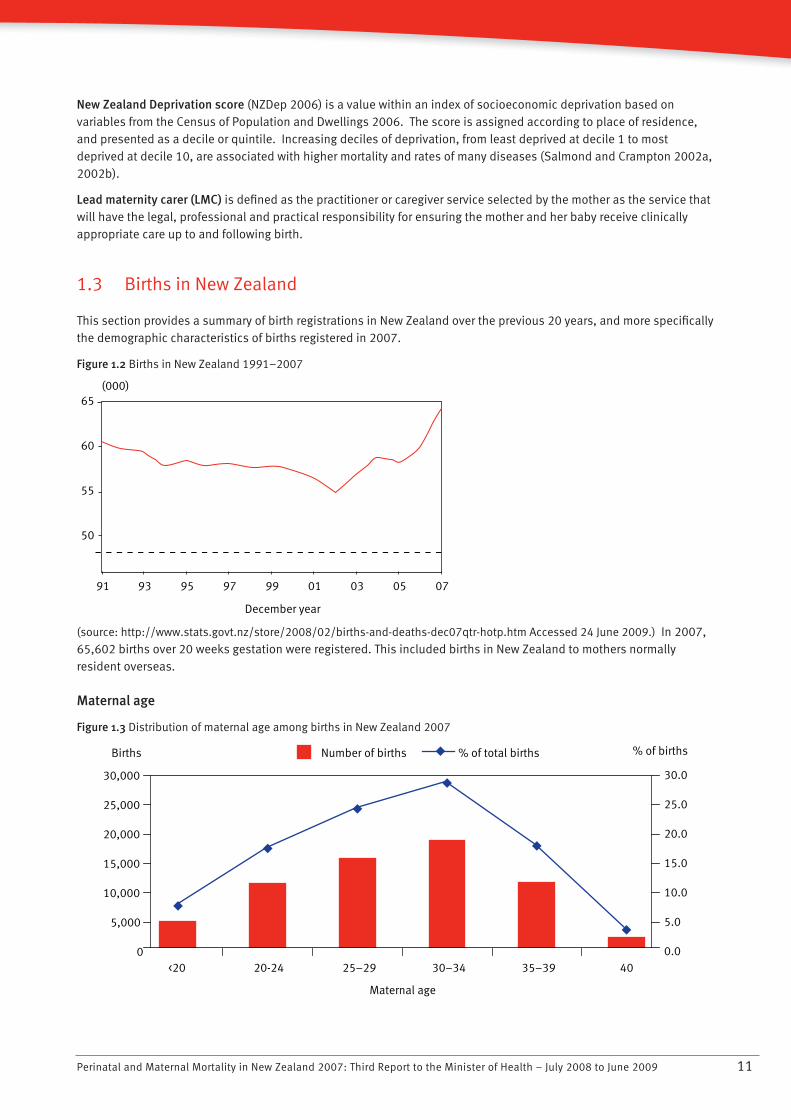
1.3 Births in New Zealand
This section provides a summary of birth registrations in New Zealand over the previous 20 years, and more specifically the demographic characteristics of births registered in 2007.
Figure 1.2 Births in New Zealand 1991–2007
070503019997959391
65(000)
December year
60
55
50
(source: http://www.stats.govt.nz/store/2008/02/births-and-deaths-dec07qtr-hotp.htm Accessed 24 June 2009.) In 2007, 65,602 births over 20 weeks gestation were registered. This included births in New Zealand to mothers normally resident overseas.
Maternal age
Figure 1.3 Distribution of maternal age among births in New Zealand 2007
0
5,000
10,000
15,000
20,000
25,000
30,000
<20 20-24 25–29 30–34 35–39 �40
Maternal age
0.0
5.0
10.0
15.0
20.0
25.0
30.0
Number of births % of total birthsBirths % of births
Perinatal and Maternal Mortality in New Zealand 2007: Third Report to the Minister of Health – July 2008 to June 200912
Maternal age has increased over recent years in New Zealand. The most common age group for mothers to give birth in 2007 was between 30 and 34 years. Almost 8 percent of babies were born to mothers aged less than 20 years, and almost 4 percent to women aged 40 years and over.
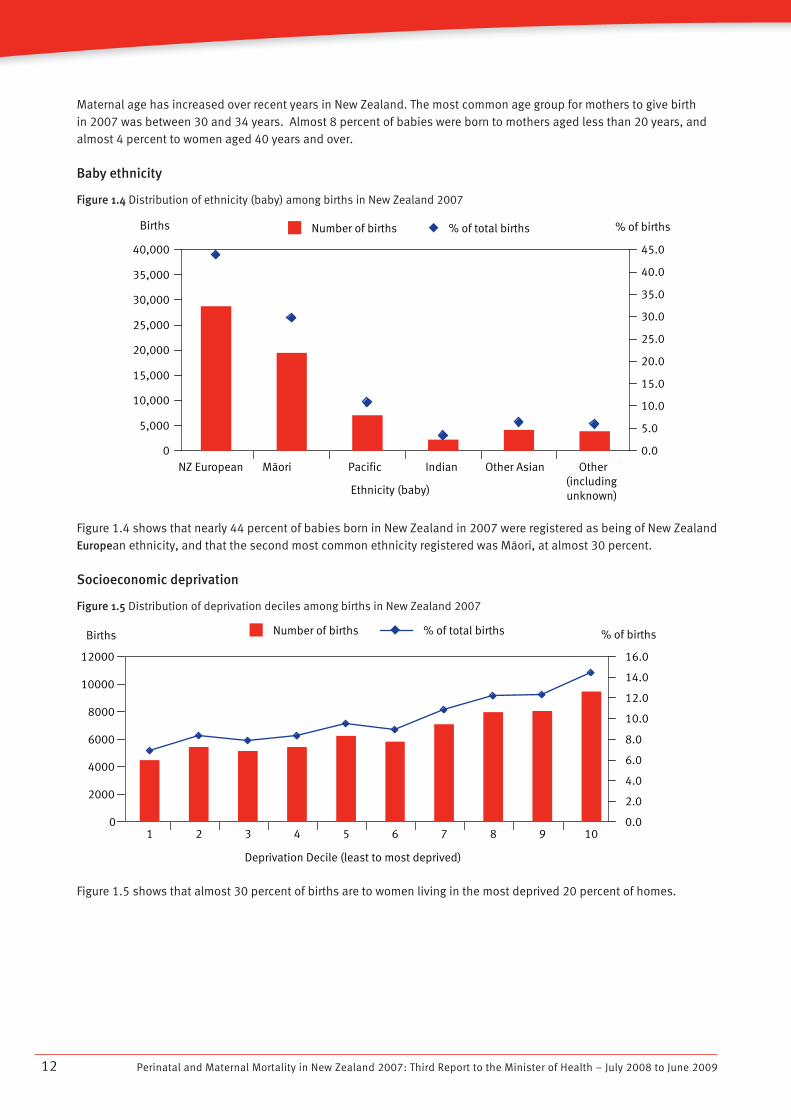
Baby ethnicity
Figure 1.4 Distribution of ethnicity (baby) among births in New Zealand 2007
0
5,000
10,000
15,000
20,000
25,000
30,000
35,000
40,000
NZ European Màori Pacific Indian Other Asian Other(includingunknown)Ethnicity (baby)
0.0
5.0
10.0
15.0
20.0
25.0
30.0
35.0
40.0
45.0
Number of births % of total birthsBirths % of births
Figure 1.4 shows that nearly 44 percent of babies born in New Zealand in 2007 were registered as being of New Zealand European ethnicity, and that the second most common ethnicity registered was Màori, at almost 30 percent.
Socioeconomic deprivation
Figure 1.5 Distribution of deprivation deciles among births in New Zealand 2007
Number of births % of total birthsBirths % of births
0
2000
4000
6000
8000
10000
12000
1 2 3 4 5 6 7 8 9 10
Deprivation Decile (least to most deprived)
0.0
2.0
4.0
6.0
8.0
10.0
12.0
14.0
16.0
Figure 1.5 shows that almost 30 percent of births are to women living in the most deprived 20 percent of homes.
Perinatal and Maternal Mortality in New Zealand 2007: Third Report to the Minister of Health – July 2008 to June 2009 13
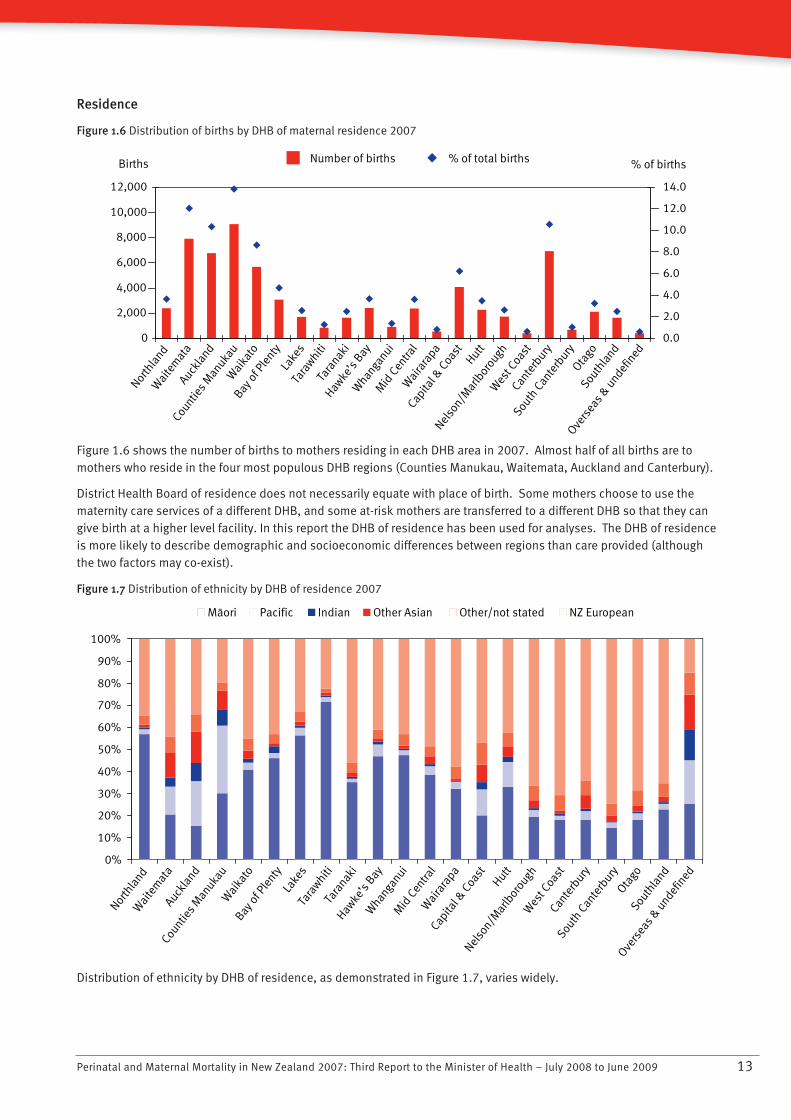
Residence
Figure 1.6 Distribution of births by DHB of maternal residence 2007
0
2,000
4,000
6,000
8,000
10,000
12,000
0.0
2.0
4.0
6.0
8.0
10.0
12.0
14.0
Number of births % of total birthsBirths % of births
North
land
Wai
tem
ata
Auckla
nd
Countie
s Man
ukau
Wai
kato
Bay o
f Ple
ntyLa
kes
Tara
whitiTa
ranak
i
Hawke
’s Bay
Whan
ganui
Mid
Cen
tral
Wai
rara
pa
Capita
l & C
oast
Hutt
Nelso
n/Mar
lbor
ough
Wes
t Coa
stCan
terb
ury
South
Can
terb
uryOta
goSou
thla
nd
Overs
eas &
undef
ined
Figure 1.6 shows the number of births to mothers residing in each DHB area in 2007. Almost half of all births are to mothers who reside in the four most populous DHB regions (Counties Manukau, Waitemata, Auckland and Canterbury).
District Health Board of residence does not necessarily equate with place of birth. Some mothers choose to use the maternity care services of a different DHB, and some at-risk mothers are transferred to a different DHB so that they can give birth at a higher level facility. In this report the DHB of residence has been used for analyses. The DHB of residence is more likely to describe demographic and socioeconomic differences between regions than care provided (although the two factors may co-exist).
Figure 1.7 Distribution of ethnicity by DHB of residence 2007
North
land
Wai
tem
ata
Countie
s Man
ukau
Auckla
nd
Wai
kato
Bay o
f Ple
ntyLa
kes
Tara
whitiTa
ranak
iHaw
ke’s
BayW
hanga
nuiM
id C
entra
lW
aira
rapa
Capita
l & C
oast
Nelso
n/Mar
lbor
ough
Hutt
Wes
t Coa
stCan
terb
ury
South
Can
terb
uryOta
goSou
thla
nd
Overs
eas &
undef
ined
0%
10%
20%
30%
40%
50%
60%
70%
80%
90%
100%
Màori Pacific Indian Other Asian Other/not stated NZ European
Distribution of ethnicity by DHB of residence, as demonstrated in Figure 1.7, varies widely.
Perinatal and Maternal Mortality in New Zealand 2007: Third Report to the Minister of Health – July 2008 to June 200914
Figure 1.8 Distribution of deprivation quintile by DHB of residence 2007Nor
thla
ndW
aite
mat
aAuck
land
Countie
s Man
ukau
Wai
kato
Bay o
f Ple
ntyLa
kes
Tara
whitiTa
ranak
iHaw
ke’s
BayW
hanga
nuiM
id C
entra
lW
aira
rapa
Capita
l & C
oast
Nelso
n/Mar
lbor
ough
Hutt
Wes
t Coa
stCan
terb
ury
South
Can
terb
uryOta
goSou
thla
nd
0%
20%
40%
60%
80%
100%
Quintile 1 Quintile 2 Quintile 3 Quintile 4 Quintile 5
Figure 1.8 shows that wealth is not evenly spread across the country. In some DHBs, such as Counties Manukau and Tairawhiti, at least half of mothers fall into the most socioeconomically deprived 20 percent (quintile 5) of the population.
Perinatal and Maternal Mortality in New Zealand 2007: Third Report to the Minister of Health – July 2008 to June 2009 15
1.4 Perinatal mortality 2007
New Zealand perinatal mortality rates 2007
Table 1.1 Summary of New Zealand perinatal mortality rates 2007
Rate Rate
n(using NZ
definition)
(using UK
definition)6
Number of total births 65,602
Number of fetal deaths (terminations of pregnancy and stillbirths) 510 7.8 1 4.6
Number of early neonatal deaths <7 days 134
Number of late neonatal deaths 7–27 days 33
Number of neonatal deaths <28 days 167 2.6 2
Perinatal mortalities 644 9.8 3 6.7
Perinatal related mortalities 677 10.34 7.2
Perinatal mortalities (excluding lethal and terminated fetal
abnormalities)5459 7.0 5 5.4
Perinatal related mortalities (excluding lethal and terminated fetal
abnormalities)5478 7.3 5.9
1 Fetal death rate per 1000 babies born (includes terminations and stillbirths)2 Neonatal death rate per 1000 live-born babies3 Fetal deaths and early neonatal deaths per 1000 babies born4 Fetal deaths and early and late neonatal deaths per 1000 babies born5 Lethal and terminated fetal abnormalities are all fetal deaths with PSANZ-PDC of congenital abnormality and neonatal deaths with PSANZ-
NDC of congenital abnormality6 Rates calculated using United Kingdom (CEMACH) definition for perinatal mortality: babies stillborn after 24 weeks gestation and deaths
of live-born babies per 1000 live births and stillbirths (CEMACH 2007)
The perinatal related mortality rate in 2007 was 10.3 per 1000 total births (Table 1.1). The rate for the second six months of 2006, using a comparable denominator, was 12.4 per 1000 total births (365/29,319).4
The denominator used in this 2007 report is the denominator used by the New Zealand Health Information Service (NZHIS) in determining perinatal mortality statistics for New Zealand. However, the rates presented here are not comparable to rates published for New Zealand previously, as the methodology adopted by the PMMRC for ascertainment of perinatal deaths differs from the process used by NZHIS.
International comparisons
In 2006 Australia reported a perinatal mortality rate (equivalent to our perinatal related mortality rate) of 10.3 per 1000 births, with rates varying by jurisdiction from 8.8/1000 in New South Wales to 14.2/1000 in the Australian Central Territory.
The most recent perinatal mortality statistics from the United Kingdom are from CEMACH’s 2007 findings, which reported a perinatal mortality rate of 7.7 per 1000 births (for neonatal deaths and fetal deaths at or beyond 24 weeks gestation). The New Zealand perinatal mortality rate in 2007, using a comparable calculation, was 6.7 /1000.
In summary, perinatal mortality in New Zealand is comparable to rates in both Australia and the United Kingdom.
4 Tables using the denominator of the previous report can be found at http://www.pmmrc.health.govt.nz

Perinatal and Maternal Mortality in New Zealand 2007: Third Report to the Minister of Health – July 2008 to June 200916
Recommendations for the Ministry of Health and DHBs
In order to report on the quality of all aspects of New Zealand maternity services, a national perinatal epidemiology • unit should be established.
The current birth registration dataset• 5 should be required to henceforth include maternity data. (For example, parity, major complications, mode of birth, history of smoking and previous obstetric history.)
New legislation should enable BDM to accept NHI data and update the routine NHI dataset with regard to ethnicity.•
The Ministry of Health should continue to support and fund DHBs and LMCs in their collection of complete perinatal • mortality statistics.
5 Currently compiled from notification by hospitals or LMCs within five days of birth and then completed when parents register birth.
Perinatal and Maternal Mortality in New Zealand 2007: Third Report to the Minister of Health – July 2008 to June 2009 17
1.5 Investigation of perinatal related mortality
Causes of perinatal death
Obstetric antecedent classification
Table 1.2 Perinatal related deaths by primary obstetric antecedent cause 2007 (PSANZ-PDC)
Fetal deaths
Termination of
pregnancy
Stillbirths Neonatal deaths Total
Perinatal death classification
(PDC)
n= 144 n= 366 n= 167 n= 677
n % n % n % n %
Congenital abnormality 126 87.5 35 9.6 37 22.2 198 29.2
Perinatal infection 20 5.5 8 4.8 28 4.1
Hypertension 3 2.1 13 3.6 3 1.8 19 2.8
Antepartum haemorrhage 2 1.4 43 11.7 15 9.0 60 8.9
Maternal conditions 6 4.2 20 5.5 1 0.6 27 4.0
Specific perinatal condition 4 2.8 38 10.4 15 9.0 57 8.4
Hypoxic peripartum 17 4.6 15 9.0 32 4.7
Fetal growth restriction 2 1.4 40 10.9 3 1.8 45 6.6
Spontaneous preterm 1 0.7 38 10.4 59 35.3 98 14.5
Unexplained antepartum 102 27.9 102 15.1
No obstetric antecedent 11 6.6 11 1.6
A perinatal death classification (PDC) is assigned to all fetal and neonatal deaths (Appendix A). Table 1.2 shows the summary codes for all perinatal related deaths. A table with the expanded classification codes for all perinatal related deaths can be found in Appendix B, Table B9.
As Table 1.2 shows, congenital abnormality is the most frequent antecedent cause among terminations, and the second most common among neonatal deaths.
Unexplained stillbirths comprise 32 percent (89/276) of stillbirths from 24 weeks gestation, and 41 percent (44/107) of stillbirths at term.
Only 31 percent of the 89 unexplained stillbirths with a gestation of at least 24 weeks had a post mortem.
Spontaneous preterm birth is the antecedent cause of death for 15 percent of perinatal related deaths, 10 percent of stillbirths and 35 percent of neonatal deaths.
Congenital abnormality, antepartum haemorrhage, specific perinatal conditions, fetal growth restriction and spontaneous preterm birth are each responsible for approximately 10 percent of stillbirths.
In 18 percent of perinatal related deaths a second associated PDC is assigned, and in a small number of cases (11 in total in 2007) a third associated PDC is assigned. The most commonly assigned associated codes in 2007 were antepartum haemorrhage, fetal growth restriction and spontaneous preterm birth. Other associated codes can be found in Appendix B, Table B9.
Perinatal and Maternal Mortality in New Zealand 2007: Third Report to the Minister of Health – July 2008 to June 200918
Figure 1.9 Relative distribution of fetal and neonatal deaths by PSANZ-PDC 2007
32%
4% 3%
9% 9%
5%
8%
3%
8% 8%
20%
0%
22%
5%
2%1%
9% 9%
2%
35%
0%
7%
0%
5%
10%
15%
20%
30%
25%
35%
40%
Fetal deaths % Neonatal deaths %Co
ngen
ital
abn
orm
alit
y
Peri
nata
l inf
ecti
on
Hyp
erte
nsio
n
Ant
epar
tum
hae
mor
rhag
e
Mat
erna
l con
diti
ons
Spe
cific
per
inat
al c
ondi
tion
s
Hyp
oxic
per
ipar
tum
dea
th
Feta
l gro
wth
rest
rict
ion
Spo
ntan
eous
pre
term
Une
xpla
ined
ant
epar
tum
dea
th
No
obst
etri
c an
tece
dent
Fetal deaths
The term ‘fetal death’ refers to terminations of pregnancy and stillbirths. In 2007 almost 80 percent of perinatal related deaths (from 20 weeks gestation and up to 28 days of life) were fetal deaths. Of these, 30 percent were terminations and 70 percent were stillbirths.
In 2006 Australia reported a fetal death rate of 7.4 per 1000 live births overall (with a range from 6.4 /1000 in New South Wales to 11.0/1000 in Northern Territory), compared to the New Zealand 2007 rate of 7.8 per 1000 births (AIHW 2006). In 2007, the United Kingdom reported a fetal death rate from 24 weeks gestation of 5.2 /1000; the equivalent New Zealand rate of was 4.7 per 1000 births (CEMACH 2009).
Stillbirth
Stillbirth is unexplained in almost 30 percent of cases. Congenital abnormality, antepartum haemorrhage, specific perinatal conditions (most commonly twin-twin transfusion and antepartum cord complications), fetal growth restriction and spontaneous preterm birth account for a further 50 percent of stillbirths.
Among unexplained stillbirths in 2007, the vast majority (87 percent) were babies of at least 24 weeks gestation, and 50 percent occurred between 36 and 42 weeks gestation.
Among stillbirths without congenital abnormalities of at least 24 weeks gestation at birth, 49 percent were SGA by customised centiles. At least 55 percent of these SGA babies were not suspected to be SGA prior to birth.
Perinatal and Maternal Mortality in New Zealand 2007: Third Report to the Minister of Health – July 2008 to June 2009 19
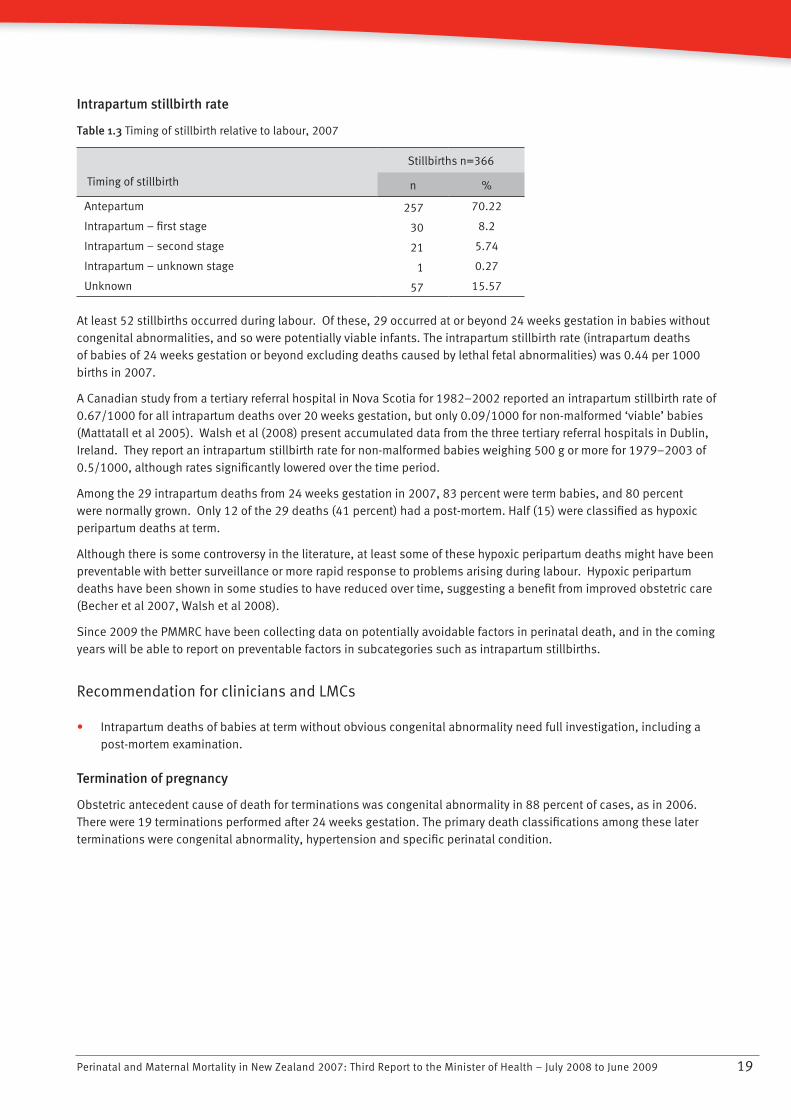
Intrapartum stillbirth rate
Table 1.3 Timing of stillbirth relative to labour, 2007
Stillbirths n=366
Timing of stillbirth n %
Antepartum 257 70.22
Intrapartum – first stage 30 8.2
Intrapartum – second stage 21 5.74
Intrapartum – unknown stage 1 0.27
Unknown 57 15.57
At least 52 stillbirths occurred during labour. Of these, 29 occurred at or beyond 24 weeks gestation in babies without congenital abnormalities, and so were potentially viable infants. The intrapartum stillbirth rate (intrapartum deaths of babies of 24 weeks gestation or beyond excluding deaths caused by lethal fetal abnormalities) was 0.44 per 1000 births in 2007.
A Canadian study from a tertiary referral hospital in Nova Scotia for 1982–2002 reported an intrapartum stillbirth rate of 0.67/1000 for all intrapartum deaths over 20 weeks gestation, but only 0.09/1000 for non-malformed ‘viable’ babies (Mattatall et al 2005). Walsh et al (2008) present accumulated data from the three tertiary referral hospitals in Dublin, Ireland. They report an intrapartum stillbirth rate for non-malformed babies weighing 500 g or more for 1979–2003 of 0.5/1000, although rates significantly lowered over the time period.
Among the 29 intrapartum deaths from 24 weeks gestation in 2007, 83 percent were term babies, and 80 percent were normally grown. Only 12 of the 29 deaths (41 percent) had a post-mortem. Half (15) were classified as hypoxic peripartum deaths at term.
Although there is some controversy in the literature, at least some of these hypoxic peripartum deaths might have been preventable with better surveillance or more rapid response to problems arising during labour. Hypoxic peripartum deaths have been shown in some studies to have reduced over time, suggesting a benefit from improved obstetric care (Becher et al 2007, Walsh et al 2008).
Since 2009 the PMMRC have been collecting data on potentially avoidable factors in perinatal death, and in the coming years will be able to report on preventable factors in subcategories such as intrapartum stillbirths.
Recommendation for clinicians and LMCs
Intrapartum deaths of babies at term without obvious congenital abnormality need full investigation, including a • post-mortem examination.
Termination of pregnancy
Obstetric antecedent cause of death for terminations was congenital abnormality in 88 percent of cases, as in 2006. There were 19 terminations performed after 24 weeks gestation. The primary death classifications among these later terminations were congenital abnormality, hypertension and specific perinatal condition.
Perinatal and Maternal Mortality in New Zealand 2007: Third Report to the Minister of Health – July 2008 to June 200920
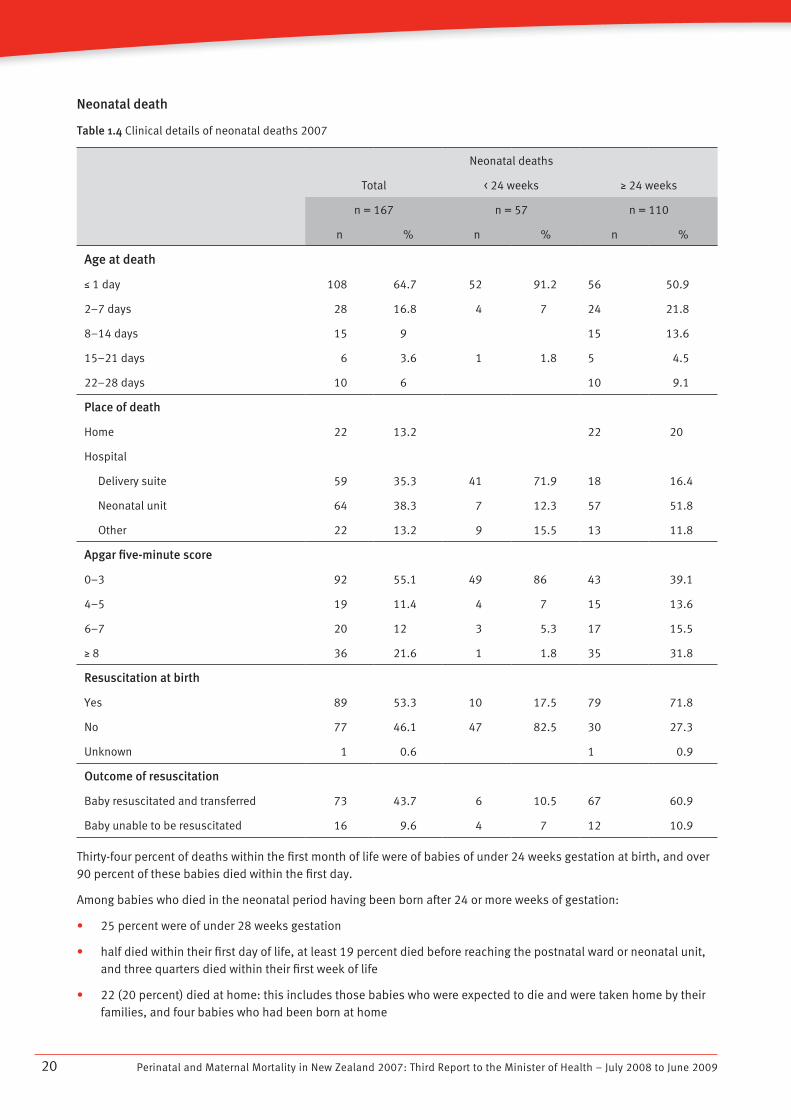
Neonatal death
Table 1.4 Clinical details of neonatal deaths 2007
Neonatal deaths
Total < 24 weeks N 24 weeks
n = 167 n = 57 n = 110
n % n % n %
Age at death
M 1 day 108 64.7 52 91.2 56 50.9
2–7 days 28 16.8 4 7 24 21.8
8–14 days 15 9 15 13.6
15–21 days 6 3.6 1 1.8 5 4.5
22–28 days 10 6 10 9.1
Place of death
Home 22 13.2 22 20
Hospital
Delivery suite 59 35.3 41 71.9 18 16.4
Neonatal unit 64 38.3 7 12.3 57 51.8
Other 22 13.2 9 15.5 13 11.8
Apgar five-minute score
0–3 92 55.1 49 86 43 39.1
4–5 19 11.4 4 7 15 13.6
6–7 20 12 3 5.3 17 15.5
N 8 36 21.6 1 1.8 35 31.8
Resuscitation at birth
Yes 89 53.3 10 17.5 79 71.8
No 77 46.1 47 82.5 30 27.3
Unknown 1 0.6 1 0.9
Outcome of resuscitation
Baby resuscitated and transferred 73 43.7 6 10.5 67 60.9
Baby unable to be resuscitated 16 9.6 4 7 12 10.9
Thirty-four percent of deaths within the first month of life were of babies of under 24 weeks gestation at birth, and over 90 percent of these babies died within the first day.
Among babies who died in the neonatal period having been born after 24 or more weeks of gestation:
25 percent were of under 28 weeks gestation•
half died within their first day of life, at least 19 percent died before reaching the postnatal ward or neonatal unit, • and three quarters died within their first week of life
22 (20 percent) died at home: this includes those babies who were expected to die and were taken home by their • families, and four babies who had been born at home
Perinatal and Maternal Mortality in New Zealand 2007: Third Report to the Minister of Health – July 2008 to June 2009 21
10 SUDI deaths occurred at home•
eight (7 percent) had been born at home; of these, home was the intended place of birth in two cases•
almost 40 percent were born in poor condition, with an Apgar score of between zero and three at five minutes•
30 were not resuscitated at birth; of these, 10 died within the first day of life (the cause of death being congenital • abnormality in seven, extreme prematurity (24 weeks) in two and infection in one) and the remainder were presumably well at birth and therefore did not require resuscitation.
The neonatal mortality rate of 2.7 per 1000 live births is consistent with a rate of 3.3/1000 reported in the PMMRC report on perinatal mortality in the last six months of 2006 and 3.0/1000 in the 2006 Australian report (AIHW 2008).
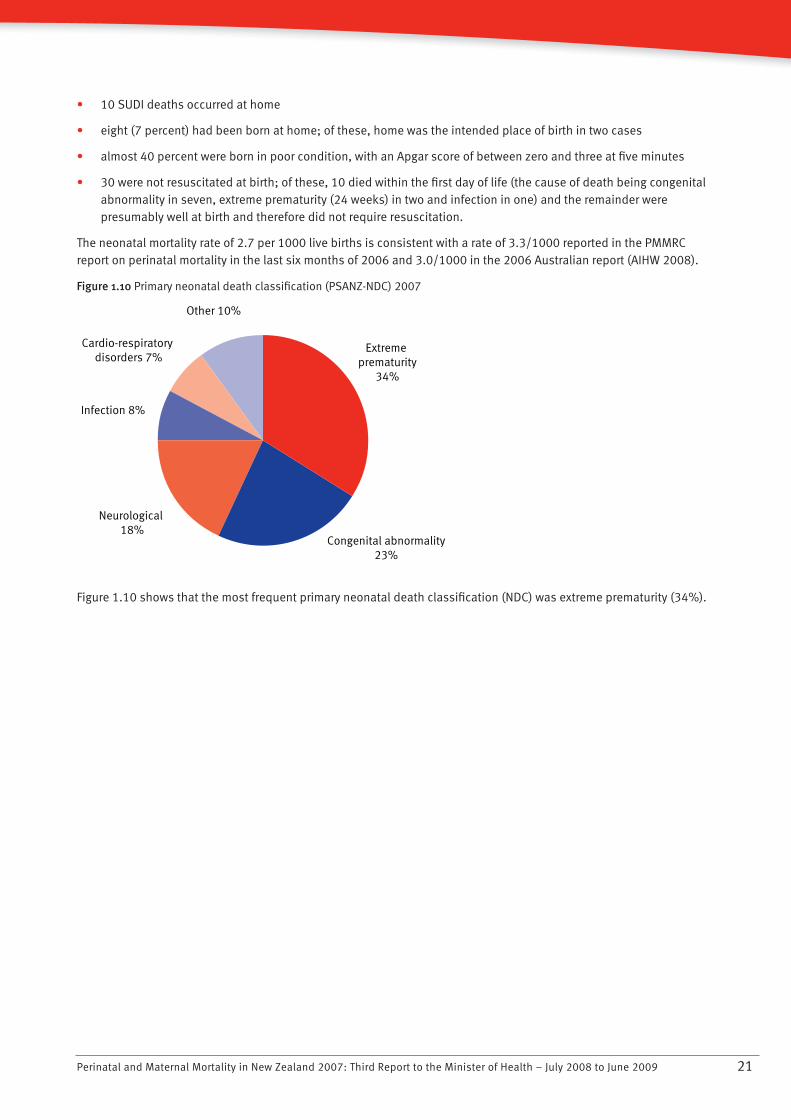
Figure 1.10 Primary neonatal death classification (PSANZ-NDC) 2007
Neurological 18%
Congenital abnormality23%
Extreme prematurity
34%
Other 10%
Cardio-respiratory disorders 7%
Infection 8%
Figure 1.10 shows that the most frequent primary neonatal death classification (NDC) was extreme prematurity (34%).
Perinatal and Maternal Mortality in New Zealand 2007: Third Report to the Minister of Health – July 2008 to June 200922
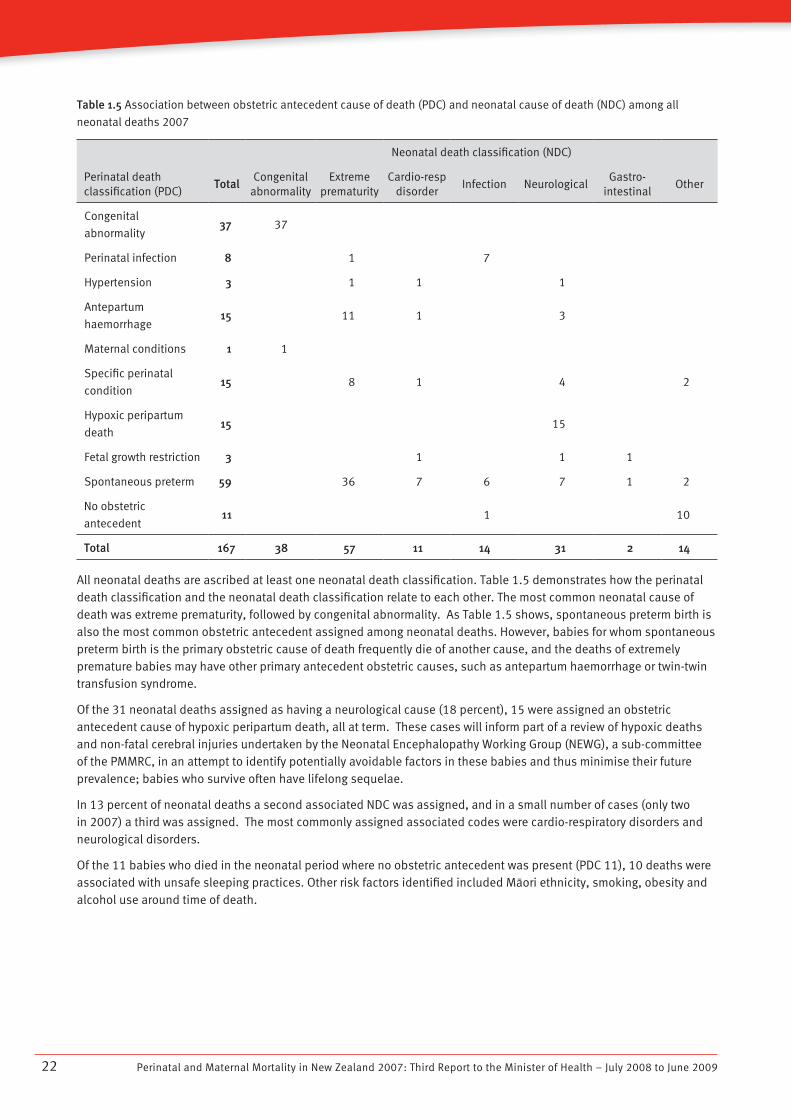
Table 1.5 Association between obstetric antecedent cause of death (PDC) and neonatal cause of death (NDC) among all
neonatal deaths 2007
Neonatal death classification (NDC)
Perinatal death classification (PDC)
TotalCongenital
abnormalityExtreme
prematurityCardio-resp
disorderInfection Neurological
Gastro-intestinal
Other
Congenital
abnormality37 37
Perinatal infection 8 1 7
Hypertension 3 1 1 1
Antepartum
haemorrhage15 11 1 3
Maternal conditions 1 1
Specific perinatal
condition15 8 1 4 2
Hypoxic peripartum
death15 15
Fetal growth restriction 3 1 1 1
Spontaneous preterm 59 36 7 6 7 1 2
No obstetric
antecedent11 1 10
Total 167 38 57 11 14 31 2 14
All neonatal deaths are ascribed at least one neonatal death classification. Table 1.5 demonstrates how the perinatal death classification and the neonatal death classification relate to each other. The most common neonatal cause of death was extreme prematurity, followed by congenital abnormality. As Table 1.5 shows, spontaneous preterm birth is also the most common obstetric antecedent assigned among neonatal deaths. However, babies for whom spontaneous preterm birth is the primary obstetric cause of death frequently die of another cause, and the deaths of extremely premature babies may have other primary antecedent obstetric causes, such as antepartum haemorrhage or twin-twin transfusion syndrome.
Of the 31 neonatal deaths assigned as having a neurological cause (18 percent), 15 were assigned an obstetric antecedent cause of hypoxic peripartum death, all at term. These cases will inform part of a review of hypoxic deaths and non-fatal cerebral injuries undertaken by the Neonatal Encephalopathy Working Group (NEWG), a sub-committee of the PMMRC, in an attempt to identify potentially avoidable factors in these babies and thus minimise their future prevalence; babies who survive often have lifelong sequelae.
In 13 percent of neonatal deaths a second associated NDC was assigned, and in a small number of cases (only two in 2007) a third was assigned. The most commonly assigned associated codes were cardio-respiratory disorders and neurological disorders.
Of the 11 babies who died in the neonatal period where no obstetric antecedent was present (PDC 11), 10 deaths were associated with unsafe sleeping practices. Other risk factors identified included Màori ethnicity, smoking, obesity and alcohol use around time of death.
Perinatal and Maternal Mortality in New Zealand 2007: Third Report to the Minister of Health – July 2008 to June 2009 23
Recommendations for clinicians and LMCs
Lead Maternity Carers should provide information to women and their family/whànau on SUDI prevention. This • information should include the following:
Smoking during pregnancy harms babies and increases the risk of Sudden Unexplained Death in Infancy • (SUDI), low birthweight and poor health. Women smoking during pregnancy should be supported to stop
Babies should be in a smoke-free environment•
Breastfeeding has many benefits for mothers and babies and should be encouraged and supported•
Babies should be placed to sleep face up in a safe place. The recommended safe sleeping environment is for • the baby to sleep in a cot or bassinet near the parents’ bed, on their back on a firm surface, positioned so that blankets or bedding cannot accidentally cover their face. Couches and sofas are very dangerous for babies to sleep on
Parents who have been using alcohol or other drugs or who are excessively tired should not sleep with their • babies
Babies who were born small or prematurely or whose mothers smoked during pregnancy should not sleep with • their parents.
Recommendations for the Ministry of Health and DHBs
The Ministry of Health should prioritise the preparation and dissemination of a comprehensive statement for • parents and caregivers on risk factors and prevention of SUDI to be provided to pregnant women.
National guidelines should be developed for safe sleeping arrangements for infants in postnatal wards, to improve • ward safety and to model safe sleeping practices that parents can follow after discharge.
Perinatal and Maternal Mortality in New Zealand 2007: Third Report to the Minister of Health – July 2008 to June 200924
Demography of perinatal deaths
Ethnicity and gender
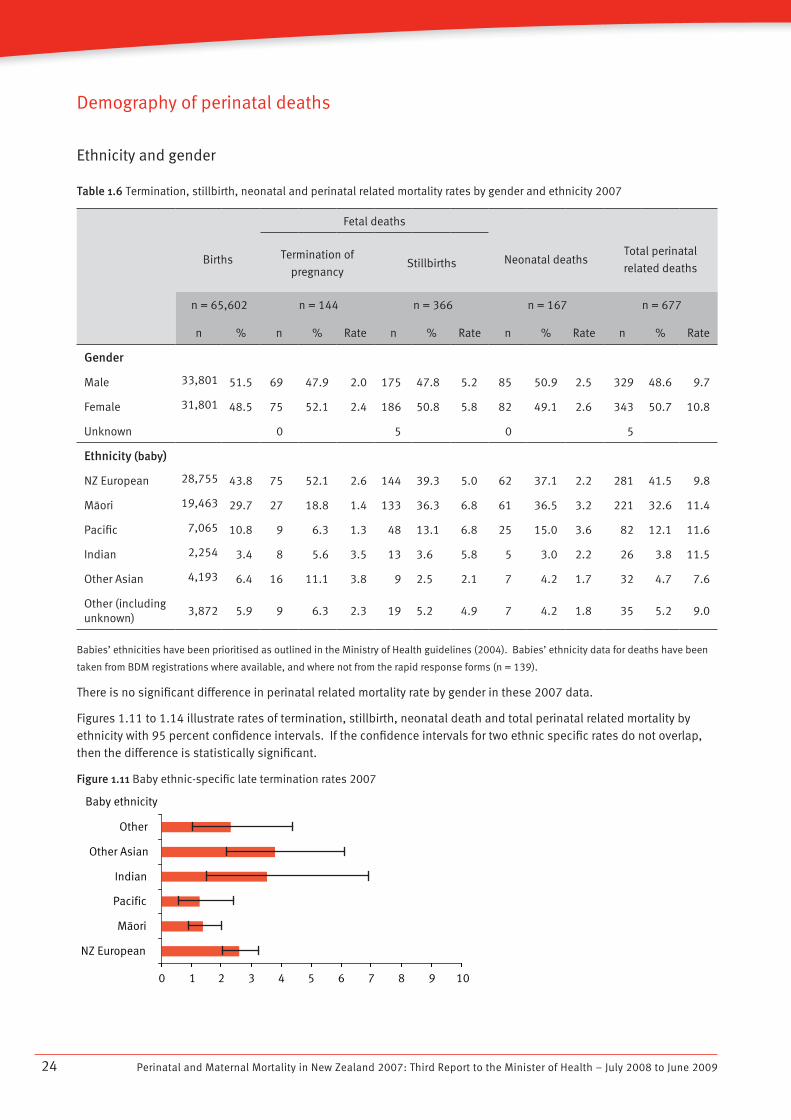
Table 1.6 Termination, stillbirth, neonatal and perinatal related mortality rates by gender and ethnicity 2007
Births
Fetal deaths
Neonatal deaths
Total perinatal
related deaths
Termination of
pregnancyStillbirths
n = 65,602 n = 144 n = 366 n = 167 n = 677
n % n % Rate n % Rate n % Rate n % Rate
Gender
Male 33,801 51.5 69 47.9 2.0 175 47.8 5.2 85 50.9 2.5 329 48.6 9.7
Female 31,801 48.5 75 52.1 2.4 186 50.8 5.8 82 49.1 2.6 343 50.7 10.8
Unknown 0 5 0 5
Ethnicity (baby)
NZ European 28,755 43.8 75 52.1 2.6 144 39.3 5.0 62 37.1 2.2 281 41.5 9.8
Màori 19,463 29.7 27 18.8 1.4 133 36.3 6.8 61 36.5 3.2 221 32.6 11.4
Pacific 7,065 10.8 9 6.3 1.3 48 13.1 6.8 25 15.0 3.6 82 12.1 11.6
Indian 2,254 3.4 8 5.6 3.5 13 3.6 5.8 5 3.0 2.2 26 3.8 11.5
Other Asian 4,193 6.4 16 11.1 3.8 9 2.5 2.1 7 4.2 1.7 32 4.7 7.6
Other (including unknown)
3,872 5.9 9 6.3 2.3 19 5.2 4.9 7 4.2 1.8 35 5.2 9.0
Babies’ ethnicities have been prioritised as outlined in the Ministry of Health guidelines (2004). Babies’ ethnicity data for deaths have been
taken from BDM registrations where available, and where not from the rapid response forms (n = 139).
There is no significant difference in perinatal related mortality rate by gender in these 2007 data.
Figures 1.11 to 1.14 illustrate rates of termination, stillbirth, neonatal death and total perinatal related mortality by ethnicity with 95 percent confidence intervals. If the confidence intervals for two ethnic specific rates do not overlap, then the difference is statistically significant.
Figure 1.11 Baby ethnic-specific late termination rates 2007
Baby ethnicity
NZ European
Màori
Pacific
Indian
Other Asian
Other
108 976543210
Perinatal and Maternal Mortality in New Zealand 2007: Third Report to the Minister of Health – July 2008 to June 2009 25
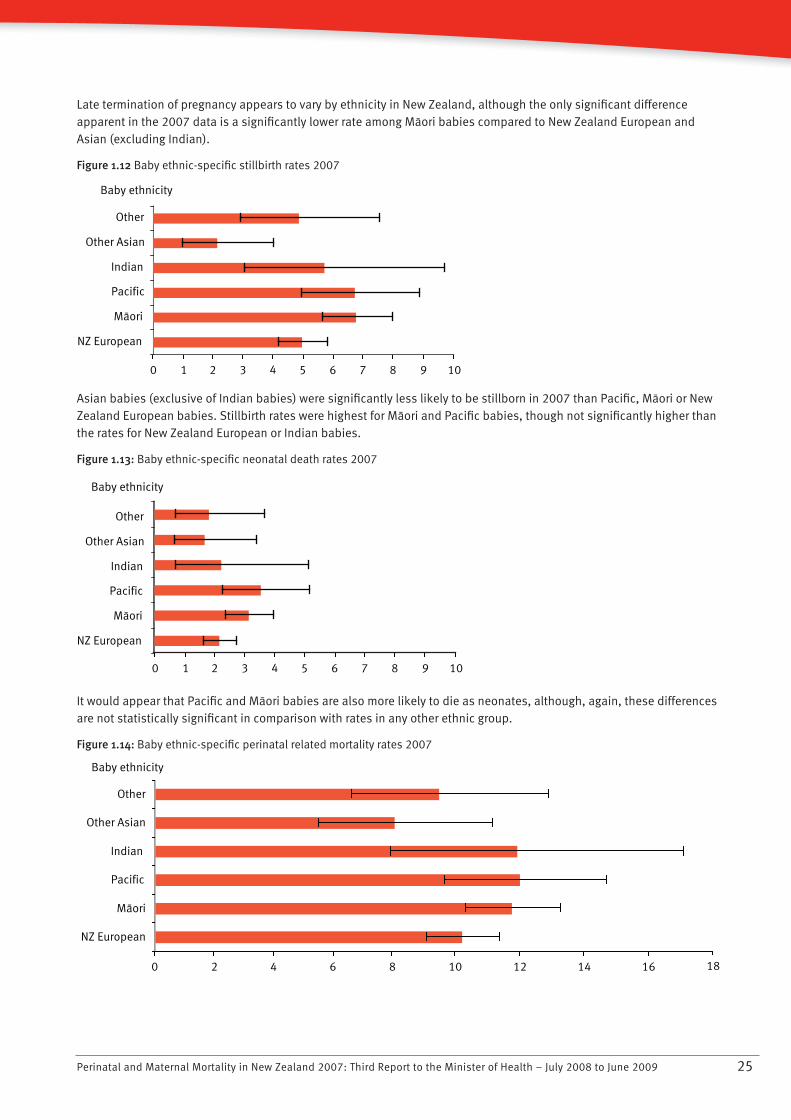
Late termination of pregnancy appears to vary by ethnicity in New Zealand, although the only significant difference apparent in the 2007 data is a significantly lower rate among Màori babies compared to New Zealand European and Asian (excluding Indian).
Figure 1.12 Baby ethnic-specific stillbirth rates 2007
Baby ethnicity
NZ European
Màori
Pacific
Indian
Other Asian
Other
108 976543210
Asian babies (exclusive of Indian babies) were significantly less likely to be stillborn in 2007 than Pacific, Màori or New Zealand European babies. Stillbirth rates were highest for Màori and Pacific babies, though not significantly higher than the rates for New Zealand European or Indian babies.
Figure 1.13: Baby ethnic-specific neonatal death rates 2007
Neonatal death rate/1000 live births
Baby ethnicity
NZ European
Màori
Pacific
Indian
Other Asian
Other
108 976543210
It would appear that Pacific and Màori babies are also more likely to die as neonates, although, again, these differences are not statistically significant in comparison with rates in any other ethnic group.
Figure 1.14: Baby ethnic-specific perinatal related mortality rates 2007
NZ European
Màori
Pacific
Indian
Other Asian
Other
Baby ethnicity
181614121086420
Perinatal and Maternal Mortality in New Zealand 2007: Third Report to the Minister of Health – July 2008 to June 200926
Death during pregnancy and up to one month of life is more common among Pacific, Màori, and Indian babies, although the rates are not significantly different from other ethnic groups. The perinatal related mortality rate in 2007 was approximately 11.5 per 1000 births for all of Pacific, Màori, and Indian babies, compared with 9.8 per 1000 births among New Zealand European and 7.6 per 1000 births for other Asian. Asian babies, excluding Indian, had the lowest perinatal related mortality rates in 2007. Data over several years will determine more accurately whether there are any significant differences in perinatal related mortality by ethnicity.
The findings shown here differ from the PMMRC report for July–December 2006, which reported a significantly higher perinatal related mortality rate for Màori and Pacific compared to the rates for New Zealand European. The difference between the data presented here and the data presented in the 2006 PMMRC report is due to a change in the denominator dataset used in this report. This year the PMMRC have used the birth registrations dataset compiled from the BDM register. This dataset is consistent with perinatal mortality rates reported by NZHIS in routine documents and on the Ministry of Health’s website.
The findings shown here differ from the routine national perinatal mortality data compiled by the NZHIS for 1996–2006. During that time period, the NZHIS perinatal mortality rate (excluding deaths among babies between seven and 28 days old) was not different for Màori and ‘other’ ethnicities.
The lack of any difference in rates of perinatal death among Màori in the Ministry of Health’s perinatal mortality reports over the previous 10 years may be due to a systematic reduction in the routine registration of Màori deaths. This is discussed in the NZHIS’s 2007 report Fetal and Infant Deaths 2003 and 2004 (2007a).
Perinatal death classification by ethnicity
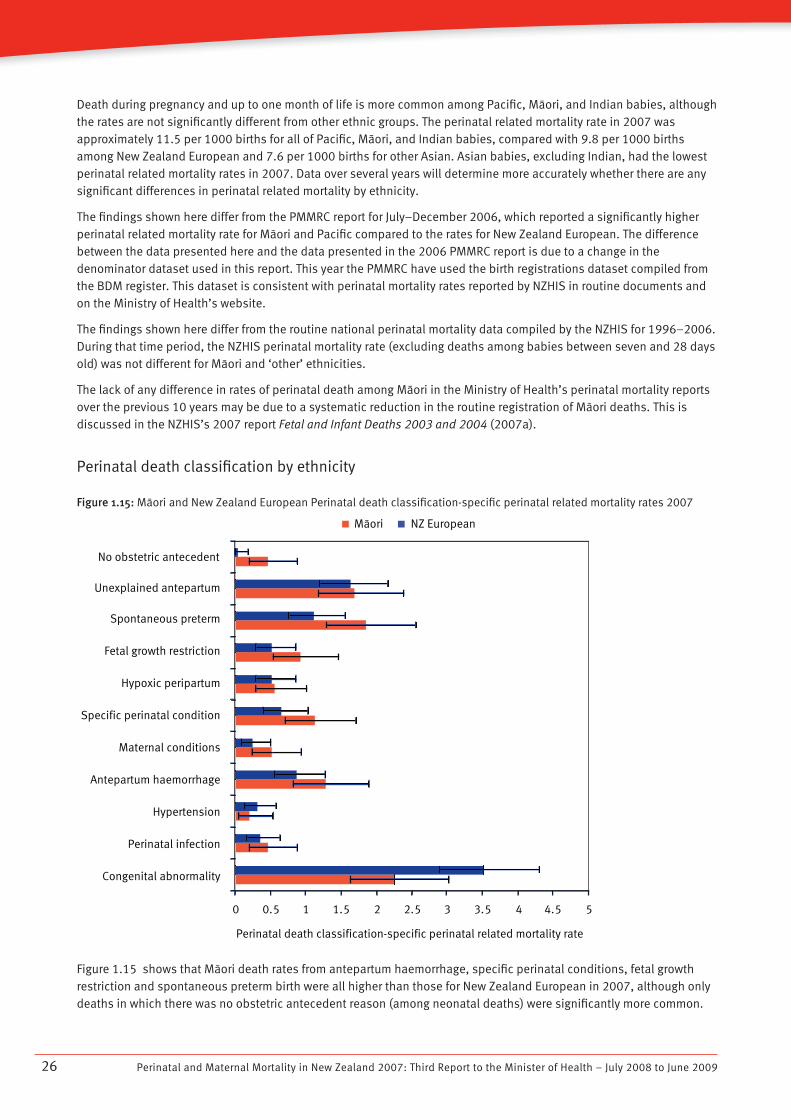
Figure 1.15: Màori and New Zealand European Perinatal death classification-specific perinatal related mortality rates 2007
0 0.5 1 1.5 2 2.5 3 3.5 4 4.5 5
No obstetric antecedent
Unexplained antepartum
Spontaneous preterm
Fetal growth restriction
Hypoxic peripartum
Specific perinatal condition
Perinatal death classification-specific perinatal related mortality rate
Maternal conditions
Antepartum haemorrhage
Hypertension
Perinatal infection
Congenital abnormality
Màori NZ EuropeanMàori NZ EuropeanMàori NZ European
Figure 1.15 shows that Màori death rates from antepartum haemorrhage, specific perinatal conditions, fetal growth restriction and spontaneous preterm birth were all higher than those for New Zealand European in 2007, although only deaths in which there was no obstetric antecedent reason (among neonatal deaths) were significantly more common.
Perinatal and Maternal Mortality in New Zealand 2007: Third Report to the Minister of Health – July 2008 to June 2009 27
Some differences may be explained by higher rates of smoking in Màori compared to New Zealand European. Among neonatal deaths without obstetric antecedent cause, almost all were SUDI (sudden unexplained death in infancy), many of which were associated with bed-sharing (recommendations related to this are described on page 23). There is limited evidence within this report to support a definitive statement on the contribution of ethnicity to perinatal related mortality. The PMMRC will continue to analyse perinatal mortality by ethnicity and explore causes of death within ethnicities.
Socioeconomic disadvantage
Table 1.7 Termination, stillbirth, neonatal and perinatal related mortality by deprivation index (Dep2006) quintile 2007
Deprivation
quintile
Fetal deaths
Neonatal deaths
Perinatal related deathsTotal birthsTermination of
pregnancyStillbirths
n = 65,602 n = 144 n = 366 n = 167 n = 677
n % n Rate n Rate n Rate n % Rate
1 9928 15.1 25 2.5 41 4.1 16 1.6 82 12.1 8.3
2 10601 16.2 33 3.1 48 4.5 17 1.6 98 14.5 9.2
3 12084 18.4 33 2.7 58 4.8 30 2.5 121 17.9 10.0
4 15052 22.9 29 1.9 90 6.0 42 2.8 161 23.8 10.7
5 17529 26.7 24 1.4 127 7.2 60 3.5 211 31.2 12.0
Unknown 408 0.6 0 2 2 4
Figure 1.16 Perinatal related mortality by deprivation quintile (Dep2006) and distribution of perinatal deaths by deprivation
quintile
0.0
2.0
4.0
6.0
8.0
10.0
12.0
14.0
1 2 3 4 5
Deprivation Quintile
0.0
5.0
10.0
15.0
20.0
25.0
30.0
35.0
Perinatal related mortality rate % perinatal related deaths
A quintile represents 20 percent of the population. Births are not evenly distributed across the quintiles: in 2007, 26 percent of births were in the most deprived quintile (quintile 5) and only 15 percent in the least deprived (quintile 1). The highest perinatal related mortality rate was found in the most deprived quintile, where most births occurred. There was a statistically significant association between the deprivation index and perinatal related mortality, with a relative risk of perinatal related death of 1.5 (95 percent confidence interval 1.1–1.9) for babies in the most deprived quintile compared to babies in the least deprived quintile.
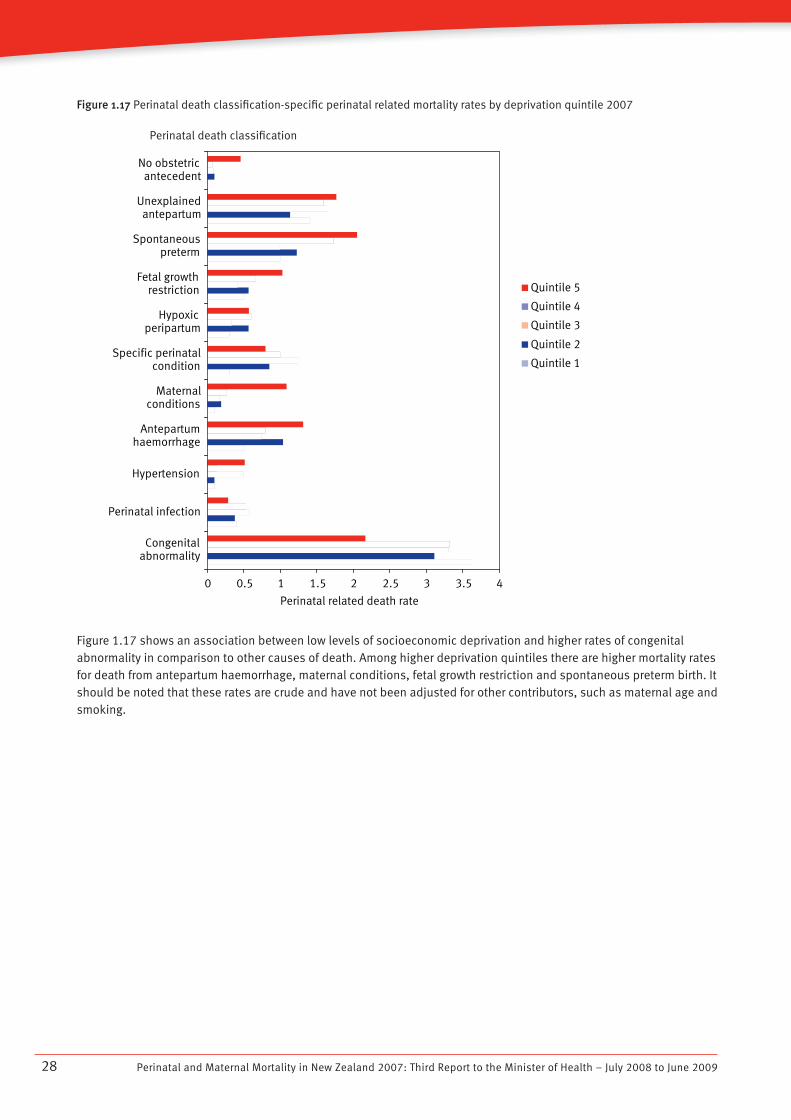
Perinatal and Maternal Mortality in New Zealand 2007: Third Report to the Minister of Health – July 2008 to June 200928
Figure 1.17 Perinatal death classification-specific perinatal related mortality rates by deprivation quintile 2007
Figure 1.17 shows an association between low levels of socioeconomic deprivation and higher rates of congenital abnormality in comparison to other causes of death. Among higher deprivation quintiles there are higher mortality rates for death from antepartum haemorrhage, maternal conditions, fetal growth restriction and spontaneous preterm birth. It should be noted that these rates are crude and have not been adjusted for other contributors, such as maternal age and smoking.
0 0.5 1 1.5 2 2.5 3 3.5 4
Congenitalabnormality
Perinatal infection
Hypertension
Antepartumhaemorrhage
Maternalconditions
Specific perinatalcondition
Hypoxicperipartum
Fetal growthrestriction
Spontaneouspreterm
Unexplainedantepartum
No obstetricantecedent
Perinatal related death rate
Quintile 5
Quintile 4
Quintile 3
Quintile 2
Quintile 1
Perinatal death classification
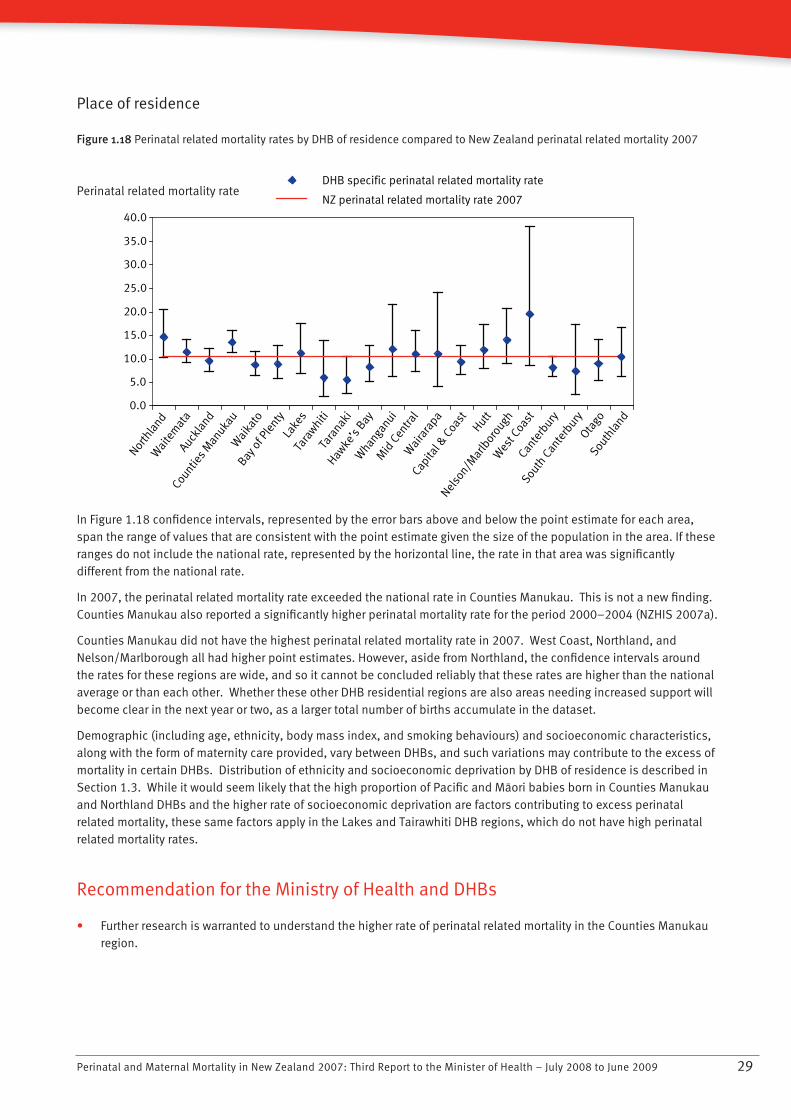
Perinatal and Maternal Mortality in New Zealand 2007: Third Report to the Minister of Health – July 2008 to June 2009 29
Place of residence
Figure 1.18 Perinatal related mortality rates by DHB of residence compared to New Zealand perinatal related mortality 2007Nor
thla
ndW
aite
mat
aCou
nties M
anuka
u
Auckla
nd
Wai
kato
Bay o
f Ple
ntyLa
kes
Tara
whitiTa
ranak
i
Hawke
’s Bay
Whan
ganui
Mid
Cen
tral
Wai
rara
pa
Capita
l & C
oast
Nelso
n/Mar
lbor
ough
HuttW
est C
oast
Cante
rbury
South
Can
terb
uryOta
goSou
thla
nd
0.0
5.0
10.0
15.0
20.0
25.0
30.0
35.0
40.0
DHB specific perinatal related mortality rate
NZ perinatal related mortality rate 2007
In Figure 1.18 confidence intervals, represented by the error bars above and below the point estimate for each area, span the range of values that are consistent with the point estimate given the size of the population in the area. If these ranges do not include the national rate, represented by the horizontal line, the rate in that area was significantly different from the national rate.
In 2007, the perinatal related mortality rate exceeded the national rate in Counties Manukau. This is not a new finding. Counties Manukau also reported a significantly higher perinatal mortality rate for the period 2000–2004 (NZHIS 2007a).
Counties Manukau did not have the highest perinatal related mortality rate in 2007. West Coast, Northland, and Nelson/Marlborough all had higher point estimates. However, aside from Northland, the confidence intervals around the rates for these regions are wide, and so it cannot be concluded reliably that these rates are higher than the national average or than each other. Whether these other DHB residential regions are also areas needing increased support will become clear in the next year or two, as a larger total number of births accumulate in the dataset.
Demographic (including age, ethnicity, body mass index, and smoking behaviours) and socioeconomic characteristics, along with the form of maternity care provided, vary between DHBs, and such variations may contribute to the excess of mortality in certain DHBs. Distribution of ethnicity and socioeconomic deprivation by DHB of residence is described in Section 1.3. While it would seem likely that the high proportion of Pacific and Màori babies born in Counties Manukau and Northland DHBs and the higher rate of socioeconomic deprivation are factors contributing to excess perinatal related mortality, these same factors apply in the Lakes and Tairawhiti DHB regions, which do not have high perinatal related mortality rates.
Recommendation for the Ministry of Health and DHBs
Further research is warranted to understand the higher rate of perinatal related mortality in the Counties Manukau • region.
Perinatal related mortality rate
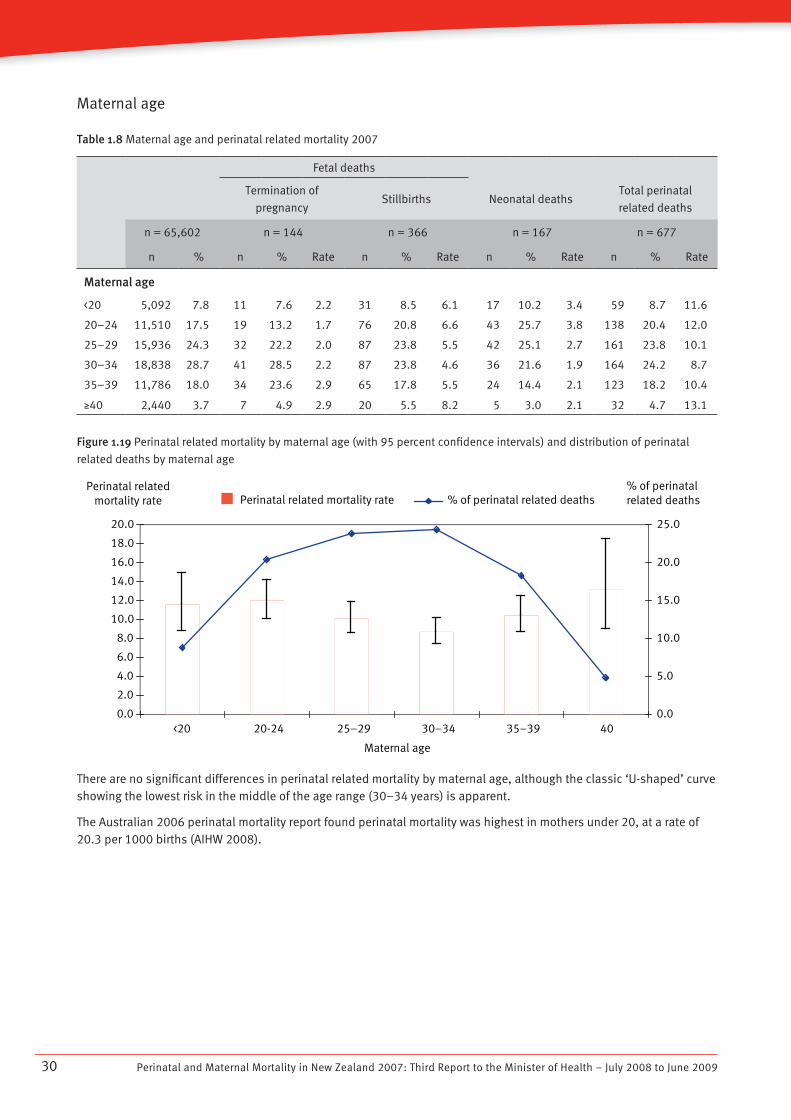
Perinatal and Maternal Mortality in New Zealand 2007: Third Report to the Minister of Health – July 2008 to June 200930
Maternal age
Table 1.8 Maternal age and perinatal related mortality 2007
Fetal deaths
Termination of
pregnancyStillbirths Neonatal deaths
Total perinatal
related deaths
n = 65,602 n = 144 n = 366 n = 167 n = 677
n % n % Rate n % Rate n % Rate n % Rate
Maternal age
<20 5,092 7.8 11 7.6 2.2 31 8.5 6.1 17 10.2 3.4 59 8.7 11.6
20–24 11,510 17.5 19 13.2 1.7 76 20.8 6.6 43 25.7 3.8 138 20.4 12.0
25–29 15,936 24.3 32 22.2 2.0 87 23.8 5.5 42 25.1 2.7 161 23.8 10.1
30–34 18,838 28.7 41 28.5 2.2 87 23.8 4.6 36 21.6 1.9 164 24.2 8.7
35–39 11,786 18.0 34 23.6 2.9 65 17.8 5.5 24 14.4 2.1 123 18.2 10.4
N40 2,440 3.7 7 4.9 2.9 20 5.5 8.2 5 3.0 2.1 32 4.7 13.1
Figure 1.19 Perinatal related mortality by maternal age (with 95 percent confidence intervals) and distribution of perinatal
related deaths by maternal age
0.0
2.0
4.0
6.0
8.0
10.0
12.0
14.0
16.0
18.0
20.0
<20 20-24 25–29 30–34 35–39 �40
Maternal age
0.0
5.0
10.0
15.0
20.0
25.0
Perinatal related mortality rate % of perinatal related deathsPerinatal related
mortality rate% of perinatal related deaths
There are no significant differences in perinatal related mortality by maternal age, although the classic ‘U-shaped’ curve showing the lowest risk in the middle of the age range (30–34 years) is apparent.
The Australian 2006 perinatal mortality report found perinatal mortality was highest in mothers under 20, at a rate of 20.3 per 1000 births (AIHW 2008).
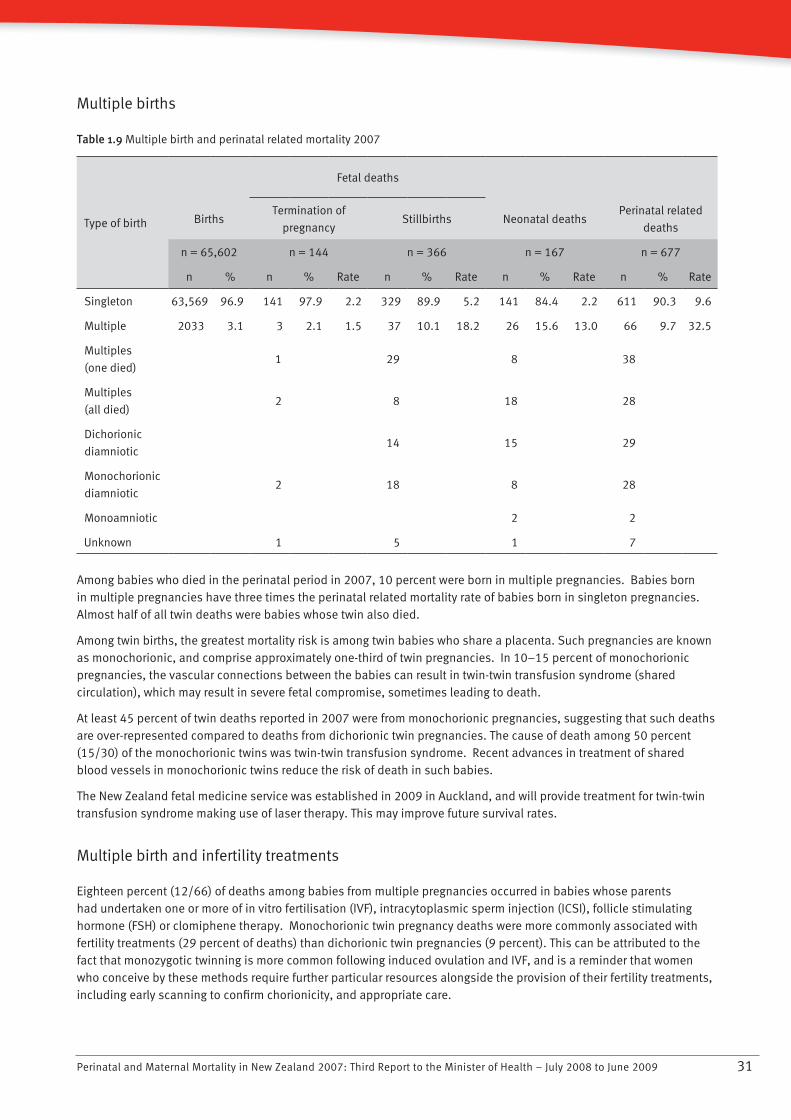
Perinatal and Maternal Mortality in New Zealand 2007: Third Report to the Minister of Health – July 2008 to June 2009 31
Multiple births
Table 1.9 Multiple birth and perinatal related mortality 2007
Type of birth
Fetal deaths
BirthsTermination of
pregnancyStillbirths Neonatal deaths
Perinatal related
deaths
n = 65,602 n = 144 n = 366 n = 167 n = 677
n % n % Rate n % Rate n % Rate n % Rate
Singleton 63,569 96.9 141 97.9 2.2 329 89.9 5.2 141 84.4 2.2 611 90.3 9.6
Multiple 2033 3.1 3 2.1 1.5 37 10.1 18.2 26 15.6 13.0 66 9.7 32.5
Multiples
(one died) 1 29 8 38
Multiples
(all died) 2 8 18 28
Dichorionic
diamniotic 14 15 29
Monochorionic
diamniotic 2 18 8 28
Monoamniotic 2 2
Unknown 1 5 1 7
Among babies who died in the perinatal period in 2007, 10 percent were born in multiple pregnancies. Babies born in multiple pregnancies have three times the perinatal related mortality rate of babies born in singleton pregnancies. Almost half of all twin deaths were babies whose twin also died.
Among twin births, the greatest mortality risk is among twin babies who share a placenta. Such pregnancies are known as monochorionic, and comprise approximately one-third of twin pregnancies. In 10–15 percent of monochorionic pregnancies, the vascular connections between the babies can result in twin-twin transfusion syndrome (shared circulation), which may result in severe fetal compromise, sometimes leading to death.
At least 45 percent of twin deaths reported in 2007 were from monochorionic pregnancies, suggesting that such deaths are over-represented compared to deaths from dichorionic twin pregnancies. The cause of death among 50 percent (15/30) of the monochorionic twins was twin-twin transfusion syndrome. Recent advances in treatment of shared blood vessels in monochorionic twins reduce the risk of death in such babies.
The New Zealand fetal medicine service was established in 2009 in Auckland, and will provide treatment for twin-twin transfusion syndrome making use of laser therapy. This may improve future survival rates.
Multiple birth and infertility treatments
Eighteen percent (12/66) of deaths among babies from multiple pregnancies occurred in babies whose parents had undertaken one or more of in vitro fertilisation (IVF), intracytoplasmic sperm injection (ICSI), follicle stimulating hormone (FSH) or clomiphene therapy. Monochorionic twin pregnancy deaths were more commonly associated with fertility treatments (29 percent of deaths) than dichorionic twin pregnancies (9 percent). This can be attributed to the fact that monozygotic twinning is more common following induced ovulation and IVF, and is a reminder that women who conceive by these methods require further particular resources alongside the provision of their fertility treatments, including early scanning to confirm chorionicity, and appropriate care.
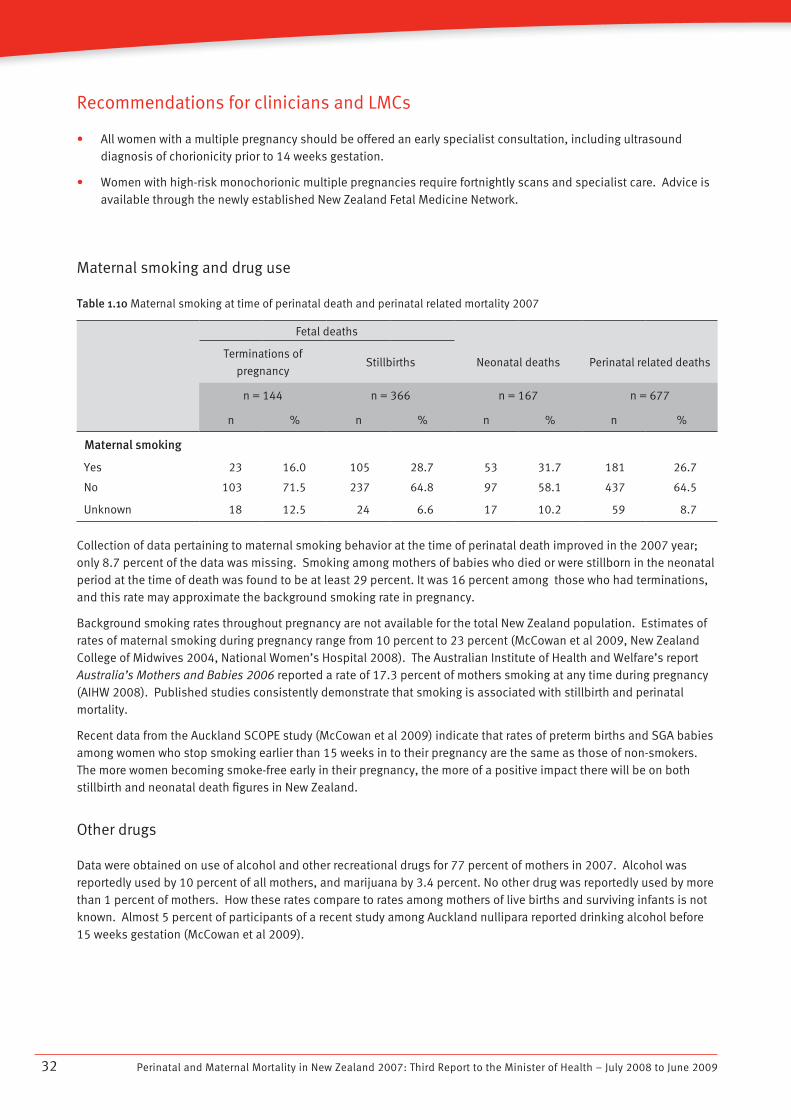
Perinatal and Maternal Mortality in New Zealand 2007: Third Report to the Minister of Health – July 2008 to June 200932
Recommendations for clinicians and LMCs
All women with a multiple pregnancy should be offered an early specialist consultation, including ultrasound • diagnosis of chorionicity prior to 14 weeks gestation.
Women with high-risk monochorionic multiple pregnancies require fortnightly scans and specialist care. Advice is • available through the newly established New Zealand Fetal Medicine Network.
Maternal smoking and drug use
Table 1.10 Maternal smoking at time of perinatal death and perinatal related mortality 2007
Fetal deaths
Terminations of
pregnancyStillbirths Neonatal deaths Perinatal related deaths
n = 144 n = 366 n = 167 n = 677
n % n % n % n %
Maternal smoking
Yes 23 16.0 105 28.7 53 31.7 181 26.7
No 103 71.5 237 64.8 97 58.1 437 64.5
Unknown 18 12.5 24 6.6 17 10.2 59 8.7
Collection of data pertaining to maternal smoking behavior at the time of perinatal death improved in the 2007 year; only 8.7 percent of the data was missing. Smoking among mothers of babies who died or were stillborn in the neonatal period at the time of death was found to be at least 29 percent. It was 16 percent among those who had terminations, and this rate may approximate the background smoking rate in pregnancy.
Background smoking rates throughout pregnancy are not available for the total New Zealand population. Estimates of rates of maternal smoking during pregnancy range from 10 percent to 23 percent (McCowan et al 2009, New Zealand College of Midwives 2004, National Women’s Hospital 2008). The Australian Institute of Health and Welfare’s report Australia’s Mothers and Babies 2006 reported a rate of 17.3 percent of mothers smoking at any time during pregnancy (AIHW 2008). Published studies consistently demonstrate that smoking is associated with stillbirth and perinatal mortality.
Recent data from the Auckland SCOPE study (McCowan et al 2009) indicate that rates of preterm births and SGA babies among women who stop smoking earlier than 15 weeks in to their pregnancy are the same as those of non-smokers. The more women becoming smoke-free early in their pregnancy, the more of a positive impact there will be on both stillbirth and neonatal death figures in New Zealand.
Other drugs
Data were obtained on use of alcohol and other recreational drugs for 77 percent of mothers in 2007. Alcohol was reportedly used by 10 percent of all mothers, and marijuana by 3.4 percent. No other drug was reportedly used by more than 1 percent of mothers. How these rates compare to rates among mothers of live births and surviving infants is not known. Almost 5 percent of participants of a recent study among Auckland nullipara reported drinking alcohol before 15 weeks gestation (McCowan et al 2009).
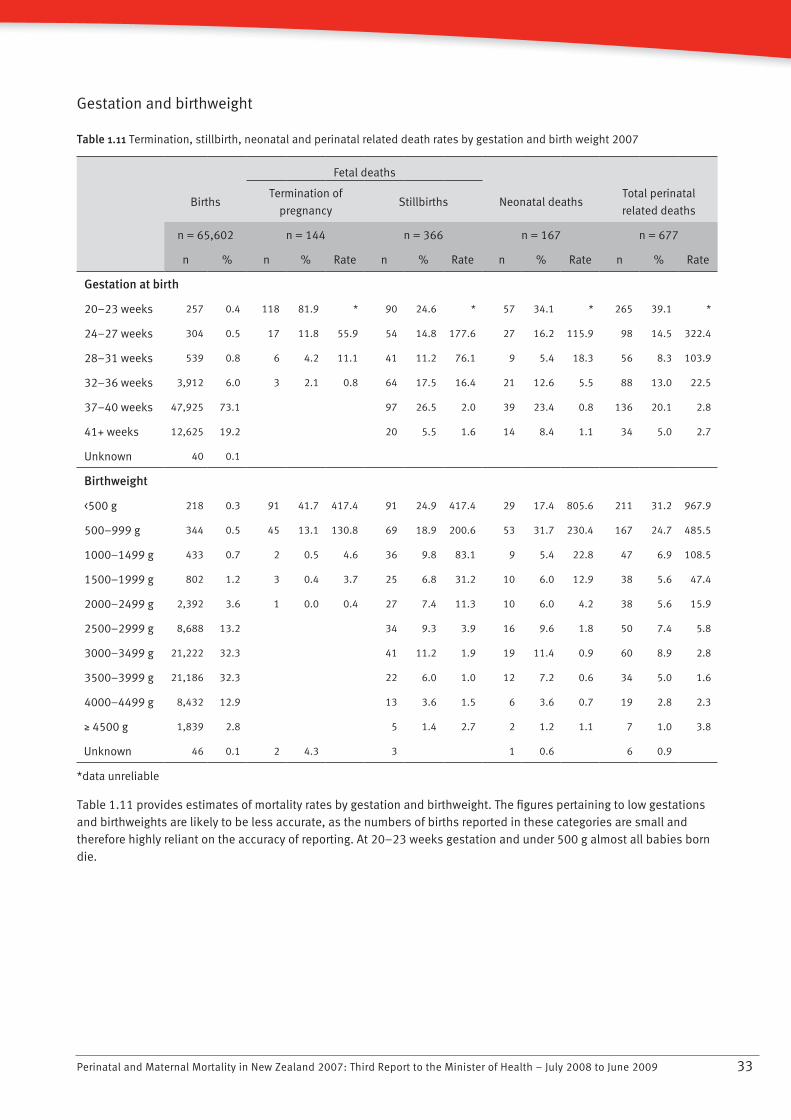
Perinatal and Maternal Mortality in New Zealand 2007: Third Report to the Minister of Health – July 2008 to June 2009 33
Gestation and birthweight
Table 1.11 Termination, stillbirth, neonatal and perinatal related death rates by gestation and birth weight 2007
Fetal deaths
BirthsTermination of
pregnancyStillbirths Neonatal deaths
Total perinatal
related deaths
n = 65,602 n = 144 n = 366 n = 167 n = 677
n % n % Rate n % Rate n % Rate n % Rate
Gestation at birth
20–23 weeks 257 0.4 118 81.9 * 90 24.6 * 57 34.1 * 265 39.1 *
24–27 weeks 304 0.5 17 11.8 55.9 54 14.8 177.6 27 16.2 115.9 98 14.5 322.4
28–31 weeks 539 0.8 6 4.2 11.1 41 11.2 76.1 9 5.4 18.3 56 8.3 103.9
32–36 weeks 3,912 6.0 3 2.1 0.8 64 17.5 16.4 21 12.6 5.5 88 13.0 22.5
37–40 weeks 47,925 73.1 97 26.5 2.0 39 23.4 0.8 136 20.1 2.8
41+ weeks 12,625 19.2 20 5.5 1.6 14 8.4 1.1 34 5.0 2.7
Unknown 40 0.1
Birthweight
<500 g 218 0.3 91 41.7 417.4 91 24.9 417.4 29 17.4 805.6 211 31.2 967.9
500–999 g 344 0.5 45 13.1 130.8 69 18.9 200.6 53 31.7 230.4 167 24.7 485.5
1000–1499 g 433 0.7 2 0.5 4.6 36 9.8 83.1 9 5.4 22.8 47 6.9 108.5
1500–1999 g 802 1.2 3 0.4 3.7 25 6.8 31.2 10 6.0 12.9 38 5.6 47.4
2000–2499 g 2,392 3.6 1 0.0 0.4 27 7.4 11.3 10 6.0 4.2 38 5.6 15.9
2500–2999 g 8,688 13.2 34 9.3 3.9 16 9.6 1.8 50 7.4 5.8
3000–3499 g 21,222 32.3 41 11.2 1.9 19 11.4 0.9 60 8.9 2.8
3500–3999 g 21,186 32.3 22 6.0 1.0 12 7.2 0.6 34 5.0 1.6
4000–4499 g 8,432 12.9 13 3.6 1.5 6 3.6 0.7 19 2.8 2.3
N 4500 g 1,839 2.8 5 1.4 2.7 2 1.2 1.1 7 1.0 3.8
Unknown 46 0.1 2 4.3 3 1 0.6 6 0.9
*data unreliable
Table 1.11 provides estimates of mortality rates by gestation and birthweight. The figures pertaining to low gestations and birthweights are likely to be less accurate, as the numbers of births reported in these categories are small and therefore highly reliant on the accuracy of reporting. At 20–23 weeks gestation and under 500 g almost all babies born die.
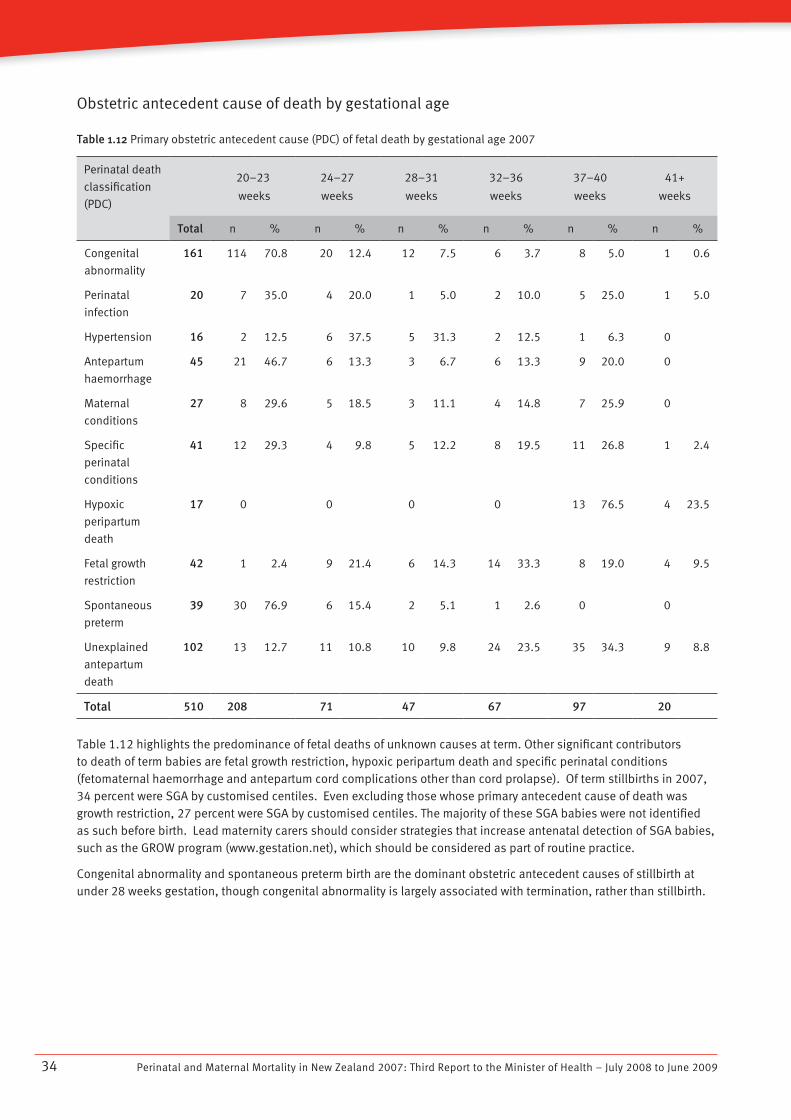
Perinatal and Maternal Mortality in New Zealand 2007: Third Report to the Minister of Health – July 2008 to June 200934
Obstetric antecedent cause of death by gestational age
Table 1.12 Primary obstetric antecedent cause (PDC) of fetal death by gestational age 2007
Perinatal death
classification
(PDC)
20–23
weeks
24–27
weeks
28–31
weeks
32–36
weeks
37–40
weeks
41+
weeks
Total n % n % n % n % n % n %
Congenital
abnormality
161 114 70.8 20 12.4 12 7.5 6 3.7 8 5.0 1 0.6
Perinatal
infection
20 7 35.0 4 20.0 1 5.0 2 10.0 5 25.0 1 5.0
Hypertension 16 2 12.5 6 37.5 5 31.3 2 12.5 1 6.3 0
Antepartum
haemorrhage
45 21 46.7 6 13.3 3 6.7 6 13.3 9 20.0 0
Maternal
conditions
27 8 29.6 5 18.5 3 11.1 4 14.8 7 25.9 0
Specific
perinatal
conditions
41 12 29.3 4 9.8 5 12.2 8 19.5 11 26.8 1 2.4
Hypoxic
peripartum
death
17 0 0 0 0 13 76.5 4 23.5
Fetal growth
restriction
42 1 2.4 9 21.4 6 14.3 14 33.3 8 19.0 4 9.5
Spontaneous
preterm
39 30 76.9 6 15.4 2 5.1 1 2.6 0 0
Unexplained
antepartum
death
102 13 12.7 11 10.8 10 9.8 24 23.5 35 34.3 9 8.8
Total 510 208 71 47 67 97 20
Table 1.12 highlights the predominance of fetal deaths of unknown causes at term. Other significant contributors to death of term babies are fetal growth restriction, hypoxic peripartum death and specific perinatal conditions (fetomaternal haemorrhage and antepartum cord complications other than cord prolapse). Of term stillbirths in 2007, 34 percent were SGA by customised centiles. Even excluding those whose primary antecedent cause of death was growth restriction, 27 percent were SGA by customised centiles. The majority of these SGA babies were not identified as such before birth. Lead maternity carers should consider strategies that increase antenatal detection of SGA babies, such as the GROW program (www.gestation.net), which should be considered as part of routine practice.
Congenital abnormality and spontaneous preterm birth are the dominant obstetric antecedent causes of stillbirth at under 28 weeks gestation, though congenital abnormality is largely associated with termination, rather than stillbirth.
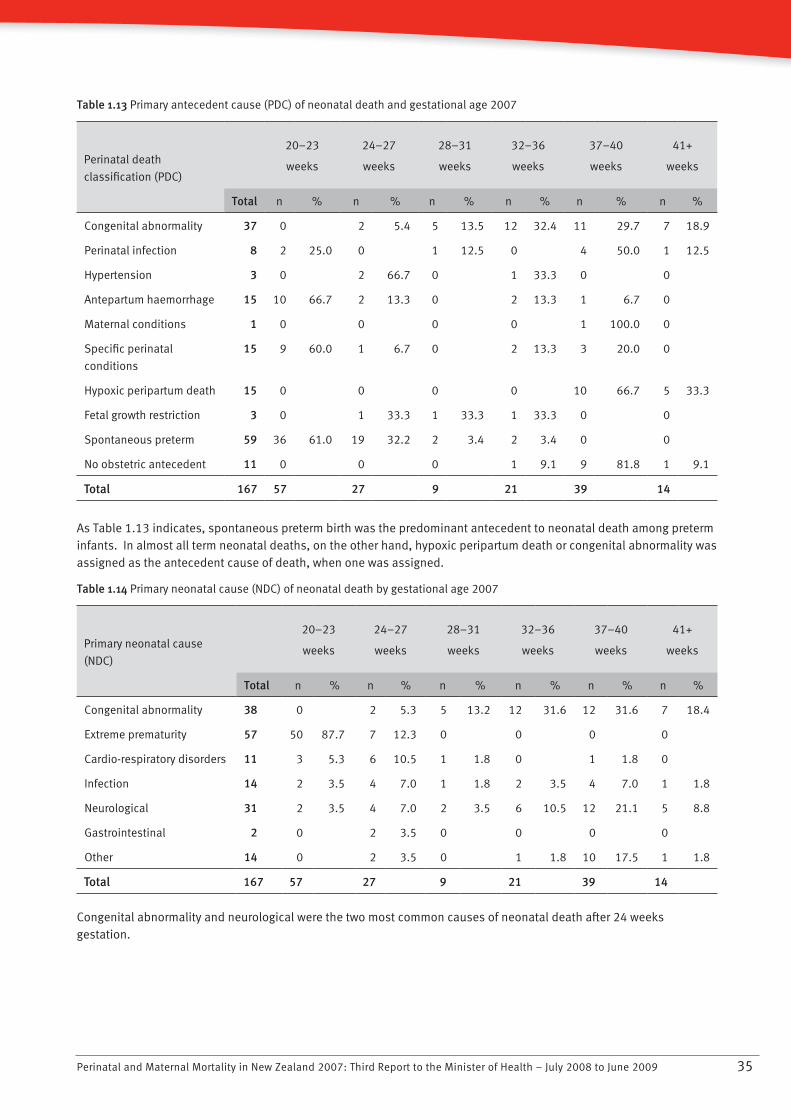
Perinatal and Maternal Mortality in New Zealand 2007: Third Report to the Minister of Health – July 2008 to June 2009 35
Table 1.13 Primary antecedent cause (PDC) of neonatal death and gestational age 2007
20–23
weeks
24–27
weeks
28–31
weeks
32–36
weeks
37–40
weeks
41+
weeksPerinatal death
classification (PDC)
Total n % n % n % n % n % n %
Congenital abnormality 37 0 2 5.4 5 13.5 12 32.4 11 29.7 7 18.9
Perinatal infection 8 2 25.0 0 1 12.5 0 4 50.0 1 12.5
Hypertension 3 0 2 66.7 0 1 33.3 0 0
Antepartum haemorrhage 15 10 66.7 2 13.3 0 2 13.3 1 6.7 0
Maternal conditions 1 0 0 0 0 1 100.0 0
Specific perinatal
conditions
15 9 60.0 1 6.7 0 2 13.3 3 20.0 0
Hypoxic peripartum death 15 0 0 0 0 10 66.7 5 33.3
Fetal growth restriction 3 0 1 33.3 1 33.3 1 33.3 0 0
Spontaneous preterm 59 36 61.0 19 32.2 2 3.4 2 3.4 0 0
No obstetric antecedent 11 0 0 0 1 9.1 9 81.8 1 9.1
Total 167 57 27 9 21 39 14
As Table 1.13 indicates, spontaneous preterm birth was the predominant antecedent to neonatal death among preterm infants. In almost all term neonatal deaths, on the other hand, hypoxic peripartum death or congenital abnormality was assigned as the antecedent cause of death, when one was assigned.
Table 1.14 Primary neonatal cause (NDC) of neonatal death by gestational age 2007
20–23
weeks
24–27
weeks
28–31
weeks
32–36
weeks
37–40
weeks
41+
weeksPrimary neonatal cause
(NDC)
Total n % n % n % n % n % n %
Congenital abnormality 38 0 2 5.3 5 13.2 12 31.6 12 31.6 7 18.4
Extreme prematurity 57 50 87.7 7 12.3 0 0 0 0
Cardio-respiratory disorders 11 3 5.3 6 10.5 1 1.8 0 1 1.8 0
Infection 14 2 3.5 4 7.0 1 1.8 2 3.5 4 7.0 1 1.8
Neurological 31 2 3.5 4 7.0 2 3.5 6 10.5 12 21.1 5 8.8
Gastrointestinal 2 0 2 3.5 0 0 0 0
Other 14 0 2 3.5 0 1 1.8 10 17.5 1 1.8
Total 167 57 27 9 21 39 14
Congenital abnormality and neurological were the two most common causes of neonatal death after 24 weeks gestation.
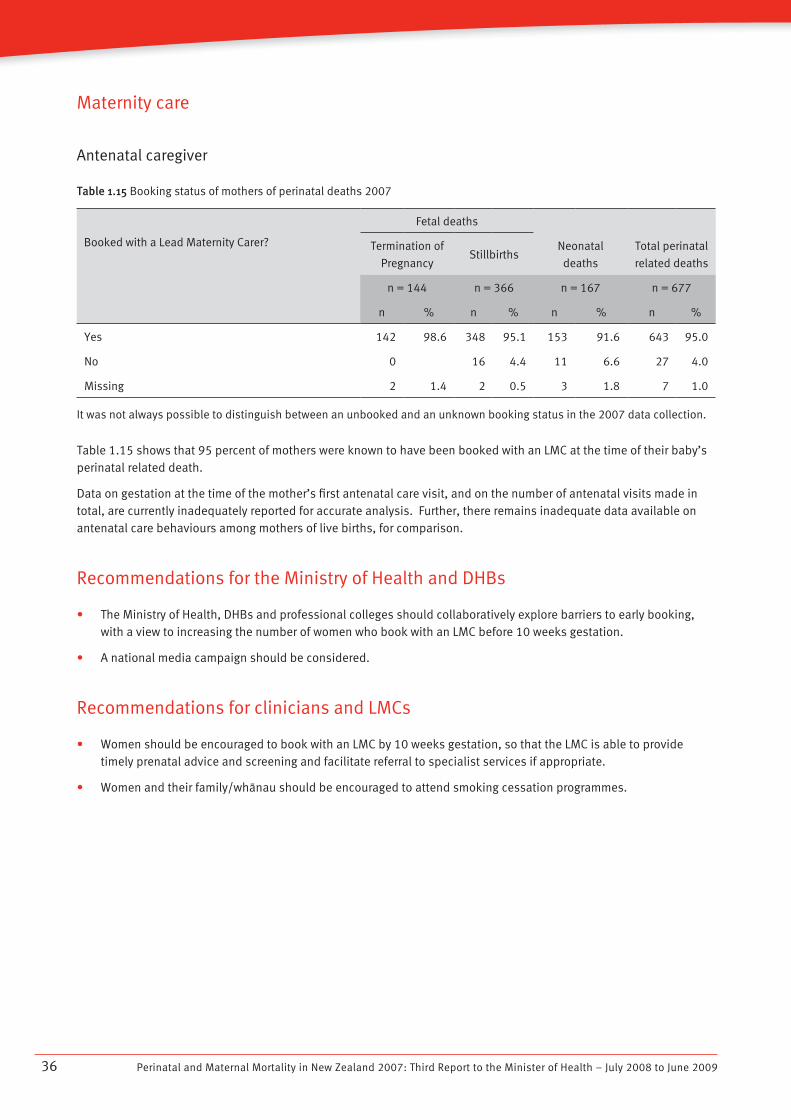
Perinatal and Maternal Mortality in New Zealand 2007: Third Report to the Minister of Health – July 2008 to June 200936
Maternity care
Antenatal caregiver
Table 1.15 Booking status of mothers of perinatal deaths 2007
Booked with a Lead Maternity Carer?
Fetal deaths
Termination of
PregnancyStillbirths
Neonatal
deaths
Total perinatal
related deaths
n = 144 n = 366 n = 167 n = 677
n % n % n % n %
Yes 142 98.6 348 95.1 153 91.6 643 95.0
No 0 16 4.4 11 6.6 27 4.0
Missing 2 1.4 2 0.5 3 1.8 7 1.0
It was not always possible to distinguish between an unbooked and an unknown booking status in the 2007 data collection.
Table 1.15 shows that 95 percent of mothers were known to have been booked with an LMC at the time of their baby’s perinatal related death.
Data on gestation at the time of the mother’s first antenatal care visit, and on the number of antenatal visits made in total, are currently inadequately reported for accurate analysis. Further, there remains inadequate data available on antenatal care behaviours among mothers of live births, for comparison.
Recommendations for the Ministry of Health and DHBs
The Ministry of Health, DHBs and professional colleges should collaboratively explore barriers to early booking, • with a view to increasing the number of women who book with an LMC before 10 weeks gestation.
A national media campaign should be considered.•
Recommendations for clinicians and LMCs
Women should be encouraged to book with an LMC by 10 weeks gestation, so that the LMC is able to provide • timely prenatal advice and screening and facilitate referral to specialist services if appropriate.
Women and their family/whànau should be encouraged to attend smoking cessation programmes.•
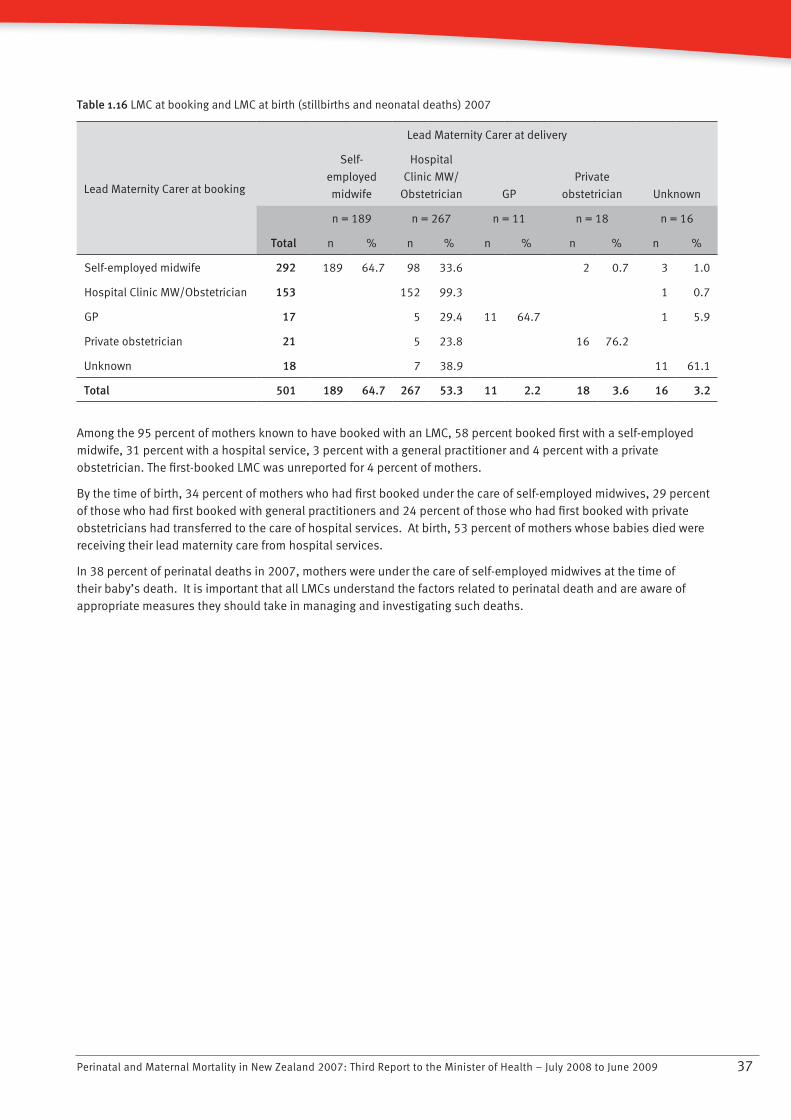
Perinatal and Maternal Mortality in New Zealand 2007: Third Report to the Minister of Health – July 2008 to June 2009 37
Table 1.16 LMC at booking and LMC at birth (stillbirths and neonatal deaths) 2007
Lead Maternity Carer at booking
Lead Maternity Carer at delivery
Self-
employed
midwife
Hospital
Clinic MW/
Obstetrician GP
Private
obstetrician Unknown
n = 189 n = 267 n = 11 n = 18 n = 16
Total n % n % n % n % n %
Self-employed midwife 292 189 64.7 98 33.6 2 0.7 3 1.0
Hospital Clinic MW/Obstetrician 153 152 99.3 1 0.7
GP 17 5 29.4 11 64.7 1 5.9
Private obstetrician 21 5 23.8 16 76.2
Unknown 18 7 38.9 11 61.1
Total 501 189 64.7 267 53.3 11 2.2 18 3.6 16 3.2
Among the 95 percent of mothers known to have booked with an LMC, 58 percent booked first with a self-employed midwife, 31 percent with a hospital service, 3 percent with a general practitioner and 4 percent with a private obstetrician. The first-booked LMC was unreported for 4 percent of mothers.
By the time of birth, 34 percent of mothers who had first booked under the care of self-employed midwives, 29 percent of those who had first booked with general practitioners and 24 percent of those who had first booked with private obstetricians had transferred to the care of hospital services. At birth, 53 percent of mothers whose babies died were receiving their lead maternity care from hospital services.
In 38 percent of perinatal deaths in 2007, mothers were under the care of self-employed midwives at the time of their baby’s death. It is important that all LMCs understand the factors related to perinatal death and are aware of appropriate measures they should take in managing and investigating such deaths.
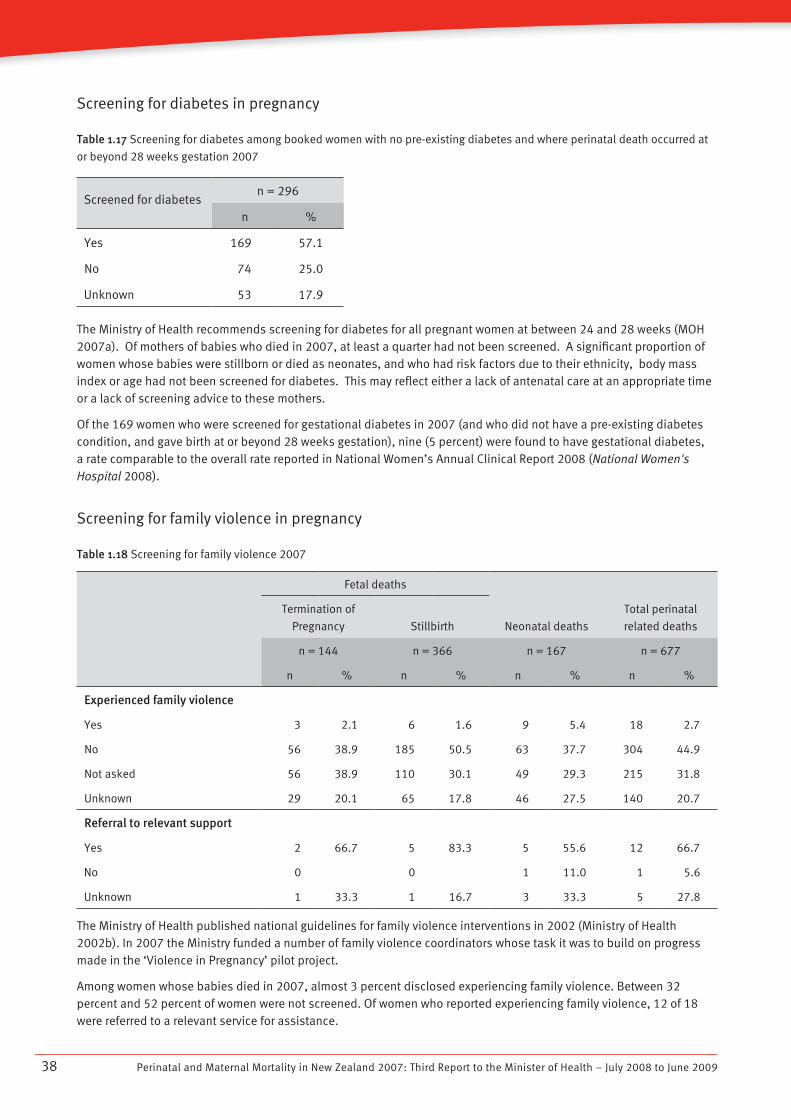
Perinatal and Maternal Mortality in New Zealand 2007: Third Report to the Minister of Health – July 2008 to June 200938
Screening for diabetes in pregnancy
Table 1.17 Screening for diabetes among booked women with no pre-existing diabetes and where perinatal death occurred at
or beyond 28 weeks gestation 2007
Screened for diabetesn = 296
n %
Yes 169 57.1
No 74 25.0
Unknown 53 17.9
The Ministry of Health recommends screening for diabetes for all pregnant women at between 24 and 28 weeks (MOH 2007a). Of mothers of babies who died in 2007, at least a quarter had not been screened. A significant proportion of women whose babies were stillborn or died as neonates, and who had risk factors due to their ethnicity, body mass index or age had not been screened for diabetes. This may reflect either a lack of antenatal care at an appropriate time or a lack of screening advice to these mothers.
Of the 169 women who were screened for gestational diabetes in 2007 (and who did not have a pre-existing diabetes condition, and gave birth at or beyond 28 weeks gestation), nine (5 percent) were found to have gestational diabetes, a rate comparable to the overall rate reported in National Women’s Annual Clinical Report 2008 (National Women's Hospital 2008).
Screening for family violence in pregnancy
Table 1.18 Screening for family violence 2007
Fetal deaths
Neonatal deaths
Total perinatal
related deaths
Termination of
Pregnancy Stillbirth
n = 144 n = 366 n = 167 n = 677
n % n % n % n %
Experienced family violence
Yes 3 2.1 6 1.6 9 5.4 18 2.7
No 56 38.9 185 50.5 63 37.7 304 44.9
Not asked 56 38.9 110 30.1 49 29.3 215 31.8
Unknown 29 20.1 65 17.8 46 27.5 140 20.7
Referral to relevant support
Yes 2 66.7 5 83.3 5 55.6 12 66.7
No 0 0 1 11.0 1 5.6
Unknown 1 33.3 1 16.7 3 33.3 5 27.8
The Ministry of Health published national guidelines for family violence interventions in 2002 (Ministry of Health 2002b). In 2007 the Ministry funded a number of family violence coordinators whose task it was to build on progress made in the ‘Violence in Pregnancy’ pilot project.
Among women whose babies died in 2007, almost 3 percent disclosed experiencing family violence. Between 32 percent and 52 percent of women were not screened. Of women who reported experiencing family violence, 12 of 18 were referred to a relevant service for assistance.
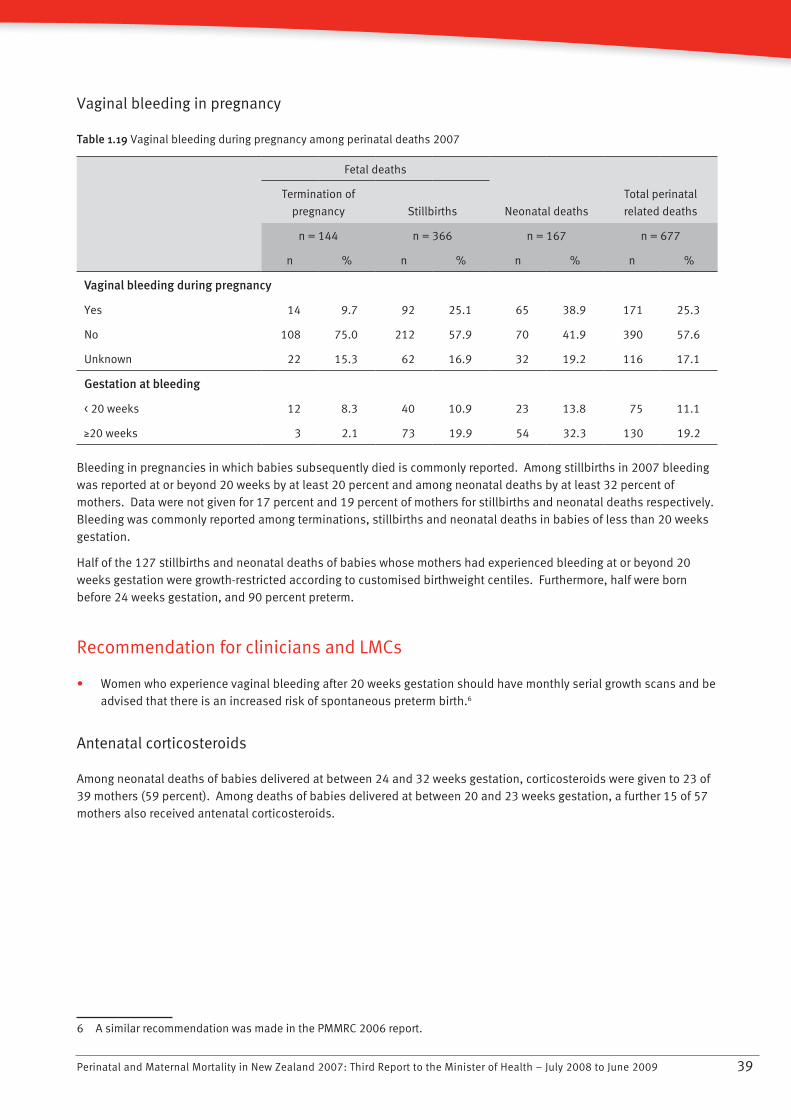
Perinatal and Maternal Mortality in New Zealand 2007: Third Report to the Minister of Health – July 2008 to June 2009 39
Vaginal bleeding in pregnancy
Table 1.19 Vaginal bleeding during pregnancy among perinatal deaths 2007
Fetal deaths
Neonatal deaths
Total perinatal
related deaths
Termination of
pregnancy Stillbirths
n = 144 n = 366 n = 167 n = 677
n % n % n % n %
Vaginal bleeding during pregnancy
Yes 14 9.7 92 25.1 65 38.9 171 25.3
No 108 75.0 212 57.9 70 41.9 390 57.6
Unknown 22 15.3 62 16.9 32 19.2 116 17.1
Gestation at bleeding
< 20 weeks 12 8.3 40 10.9 23 13.8 75 11.1
N20 weeks 3 2.1 73 19.9 54 32.3 130 19.2
Bleeding in pregnancies in which babies subsequently died is commonly reported. Among stillbirths in 2007 bleeding was reported at or beyond 20 weeks by at least 20 percent and among neonatal deaths by at least 32 percent of mothers. Data were not given for 17 percent and 19 percent of mothers for stillbirths and neonatal deaths respectively. Bleeding was commonly reported among terminations, stillbirths and neonatal deaths in babies of less than 20 weeks gestation.
Half of the 127 stillbirths and neonatal deaths of babies whose mothers had experienced bleeding at or beyond 20 weeks gestation were growth-restricted according to customised birthweight centiles. Furthermore, half were born before 24 weeks gestation, and 90 percent preterm.
Recommendation for clinicians and LMCs
Women who experience vaginal bleeding after 20 weeks gestation should have monthly serial growth scans and be • advised that there is an increased risk of spontaneous preterm birth.6
Antenatal corticosteroids
Among neonatal deaths of babies delivered at between 24 and 32 weeks gestation, corticosteroids were given to 23 of 39 mothers (59 percent). Among deaths of babies delivered at between 20 and 23 weeks gestation, a further 15 of 57 mothers also received antenatal corticosteroids.
6 A similar recommendation was made in the PMMRC 2006 report.
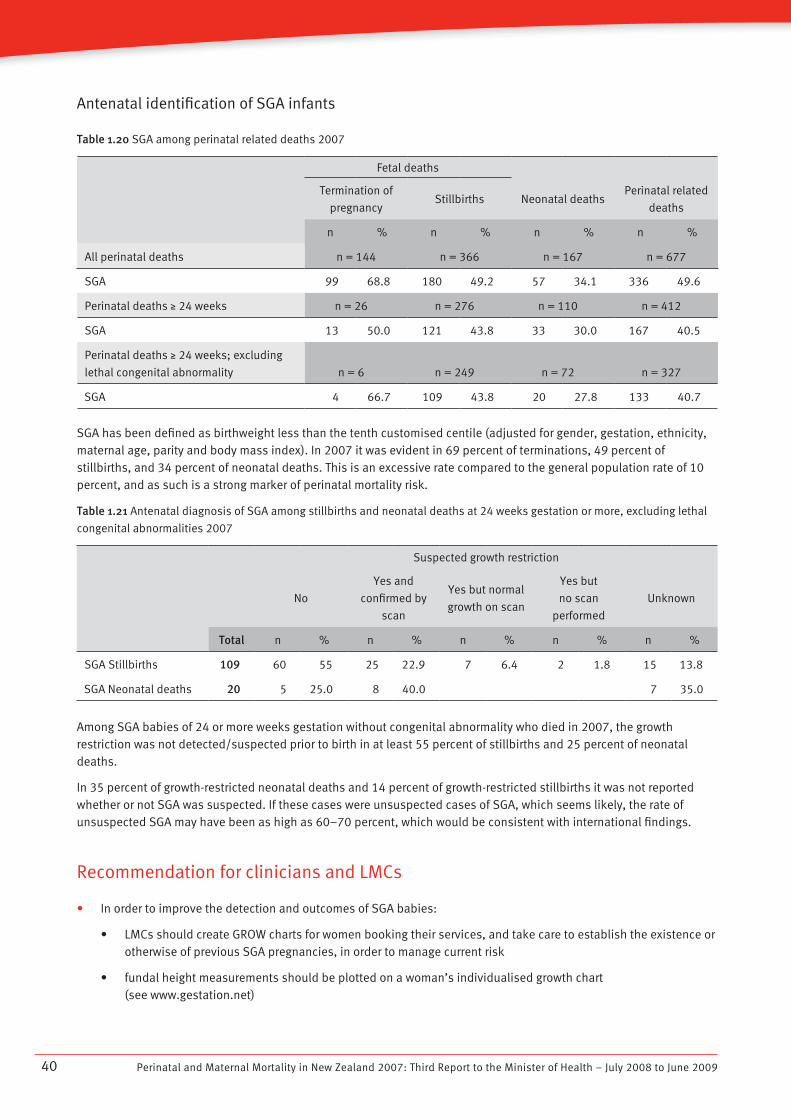
Perinatal and Maternal Mortality in New Zealand 2007: Third Report to the Minister of Health – July 2008 to June 200940
Antenatal identification of SGA infants
Table 1.20 SGA among perinatal related deaths 2007
Fetal deaths
Termination of
pregnancyStillbirths Neonatal deaths
Perinatal related
deaths
n % n % n % n %
All perinatal deaths n = 144 n = 366 n = 167 n = 677
SGA 99 68.8 180 49.2 57 34.1 336 49.6
Perinatal deaths N 24 weeks n = 26 n = 276 n = 110 n = 412
SGA 13 50.0 121 43.8 33 30.0 167 40.5
Perinatal deaths N 24 weeks; excluding
lethal congenital abnormality n = 6 n = 249 n = 72 n = 327
SGA 4 66.7 109 43.8 20 27.8 133 40.7
SGA has been defined as birthweight less than the tenth customised centile (adjusted for gender, gestation, ethnicity, maternal age, parity and body mass index). In 2007 it was evident in 69 percent of terminations, 49 percent of stillbirths, and 34 percent of neonatal deaths. This is an excessive rate compared to the general population rate of 10 percent, and as such is a strong marker of perinatal mortality risk.
Table 1.21 Antenatal diagnosis of SGA among stillbirths and neonatal deaths at 24 weeks gestation or more, excluding lethal
congenital abnormalities 2007
Suspected growth restriction
No
Yes and
confirmed by
scan
Yes but normal
growth on scan
Yes but
no scan
performed
Unknown
Total n % n % n % n % n %
SGA Stillbirths 109 60 55 25 22.9 7 6.4 2 1.8 15 13.8
SGA Neonatal deaths 20 5 25.0 8 40.0 7 35.0
Among SGA babies of 24 or more weeks gestation without congenital abnormality who died in 2007, the growth restriction was not detected/suspected prior to birth in at least 55 percent of stillbirths and 25 percent of neonatal deaths.
In 35 percent of growth-restricted neonatal deaths and 14 percent of growth-restricted stillbirths it was not reported whether or not SGA was suspected. If these cases were unsuspected cases of SGA, which seems likely, the rate of unsuspected SGA may have been as high as 60–70 percent, which would be consistent with international findings.
Recommendation for clinicians and LMCs
In order to improve the detection and outcomes of SGA babies:•
LMCs should create GROW charts for women booking their services, and take care to establish the existence or • otherwise of previous SGA pregnancies, in order to manage current risk
fundal height measurements should be plotted on a woman’s individualised growth chart • (see www.gestation.net)
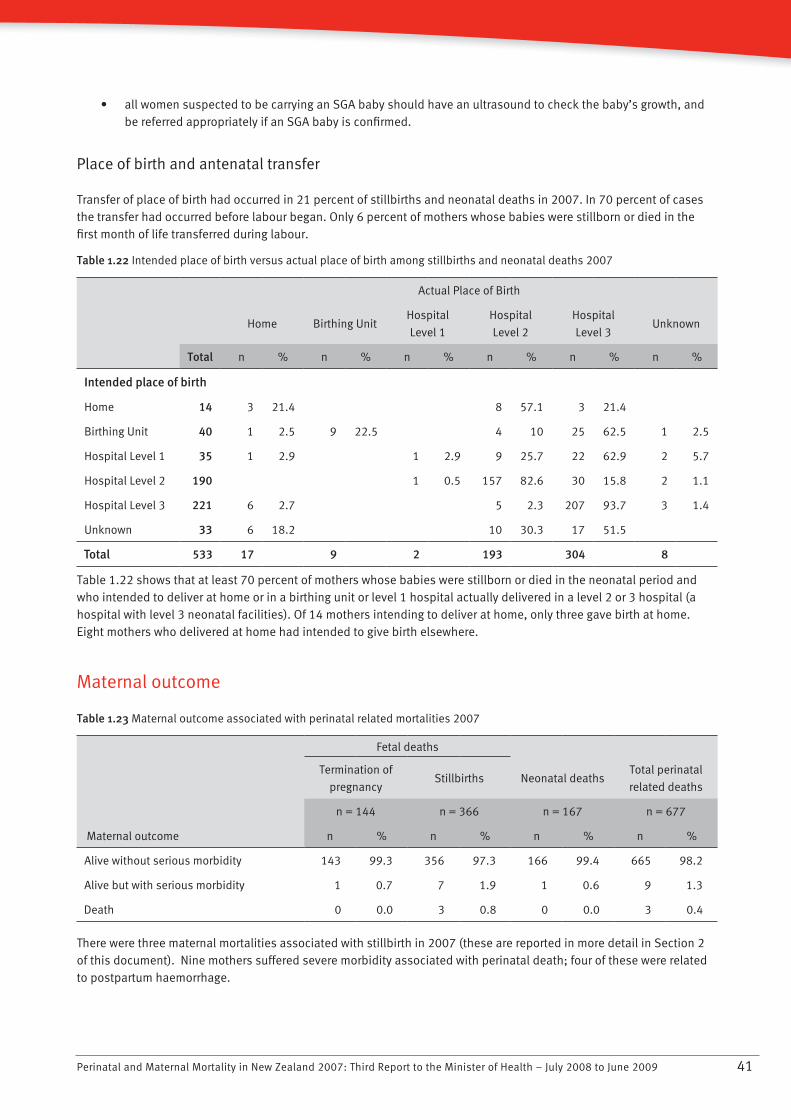
Perinatal and Maternal Mortality in New Zealand 2007: Third Report to the Minister of Health – July 2008 to June 2009 41
all women suspected to be carrying an SGA baby should have an ultrasound to check the baby’s growth, and • be referred appropriately if an SGA baby is confirmed.
Place of birth and antenatal transfer
Transfer of place of birth had occurred in 21 percent of stillbirths and neonatal deaths in 2007. In 70 percent of cases the transfer had occurred before labour began. Only 6 percent of mothers whose babies were stillborn or died in the first month of life transferred during labour.
Table 1.22 Intended place of birth versus actual place of birth among stillbirths and neonatal deaths 2007
Actual Place of Birth
Home Birthing Unit
Hospital
Level 1
Hospital
Level 2
Hospital
Level 3Unknown
Total n % n % n % n % n % n %
Intended place of birth
Home 14 3 21.4 8 57.1 3 21.4
Birthing Unit 40 1 2.5 9 22.5 4 10 25 62.5 1 2.5
Hospital Level 1 35 1 2.9 1 2.9 9 25.7 22 62.9 2 5.7
Hospital Level 2 190 1 0.5 157 82.6 30 15.8 2 1.1
Hospital Level 3 221 6 2.7 5 2.3 207 93.7 3 1.4
Unknown 33 6 18.2 10 30.3 17 51.5
Total 533 17 9 2 193 304 8
Table 1.22 shows that at least 70 percent of mothers whose babies were stillborn or died in the neonatal period and who intended to deliver at home or in a birthing unit or level 1 hospital actually delivered in a level 2 or 3 hospital (a hospital with level 3 neonatal facilities). Of 14 mothers intending to deliver at home, only three gave birth at home. Eight mothers who delivered at home had intended to give birth elsewhere.
Maternal outcome
Table 1.23 Maternal outcome associated with perinatal related mortalities 2007
Fetal deaths
Termination of
pregnancyStillbirths Neonatal deaths
Total perinatal
related deaths
n = 144 n = 366 n = 167 n = 677
Maternal outcome n % n % n % n %
Alive without serious morbidity 143 99.3 356 97.3 166 99.4 665 98.2
Alive but with serious morbidity 1 0.7 7 1.9 1 0.6 9 1.3
Death 0 0.0 3 0.8 0 0.0 3 0.4
There were three maternal mortalities associated with stillbirth in 2007 (these are reported in more detail in Section 2 of this document). Nine mothers suffered severe morbidity associated with perinatal death; four of these were related to postpartum haemorrhage.
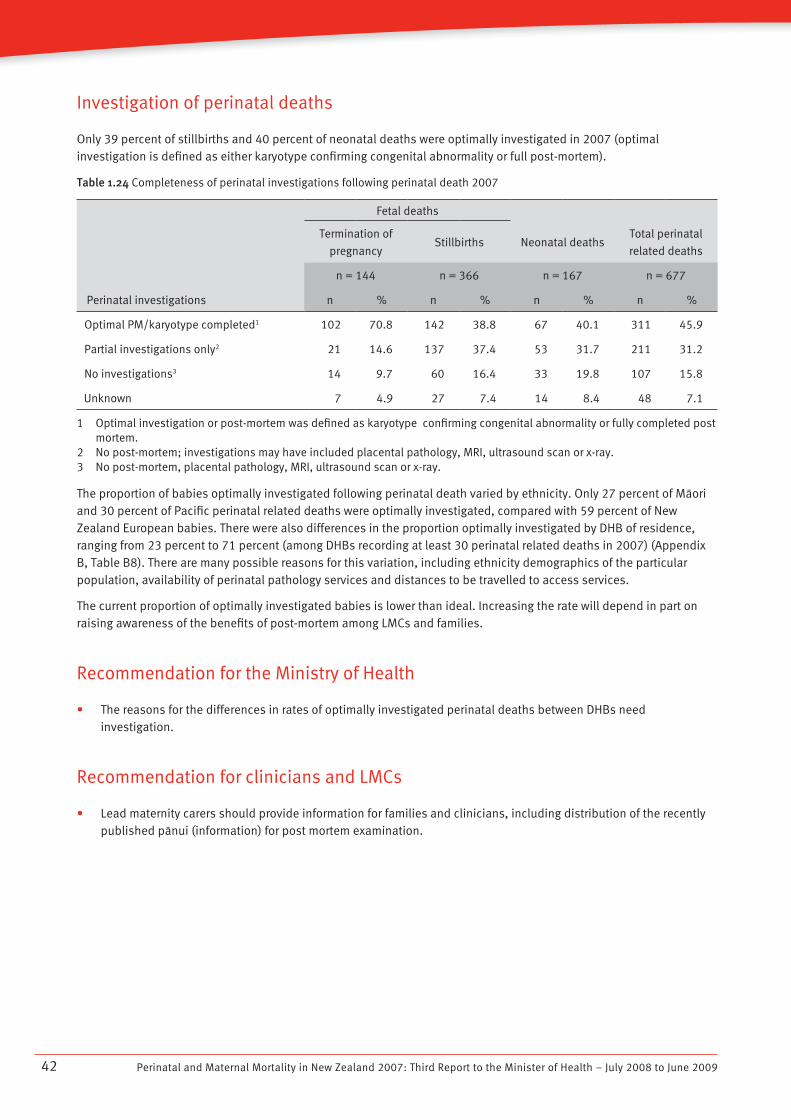
Perinatal and Maternal Mortality in New Zealand 2007: Third Report to the Minister of Health – July 2008 to June 200942
Investigation of perinatal deaths
Only 39 percent of stillbirths and 40 percent of neonatal deaths were optimally investigated in 2007 (optimal investigation is defined as either karyotype confirming congenital abnormality or full post-mortem).
Table 1.24 Completeness of perinatal investigations following perinatal death 2007
Fetal deaths
Termination of
pregnancyStillbirths Neonatal deaths
Total perinatal
related deaths
n = 144 n = 366 n = 167 n = 677
Perinatal investigations n % n % n % n %
Optimal PM/karyotype completed1 102 70.8 142 38.8 67 40.1 311 45.9
Partial investigations only2 21 14.6 137 37.4 53 31.7 211 31.2
No investigations3 14 9.7 60 16.4 33 19.8 107 15.8
Unknown 7 4.9 27 7.4 14 8.4 48 7.1
1 Optimal investigation or post-mortem was defined as karyotype confirming congenital abnormality or fully completed post mortem.
2 No post-mortem; investigations may have included placental pathology, MRI, ultrasound scan or x-ray.3 No post-mortem, placental pathology, MRI, ultrasound scan or x-ray.
The proportion of babies optimally investigated following perinatal death varied by ethnicity. Only 27 percent of Màori and 30 percent of Pacific perinatal related deaths were optimally investigated, compared with 59 percent of New Zealand European babies. There were also differences in the proportion optimally investigated by DHB of residence, ranging from 23 percent to 71 percent (among DHBs recording at least 30 perinatal related deaths in 2007) (Appendix B, Table B8). There are many possible reasons for this variation, including ethnicity demographics of the particular population, availability of perinatal pathology services and distances to be travelled to access services.
The current proportion of optimally investigated babies is lower than ideal. Increasing the rate will depend in part on raising awareness of the benefits of post-mortem among LMCs and families.
Recommendation for the Ministry of Health
The reasons for the differences in rates of optimally investigated perinatal deaths between DHBs need • investigation.
Recommendation for clinicians and LMCs
Lead maternity carers should provide information for families and clinicians, including distribution of the recently • published pànui (information) for post mortem examination.
Perinatal and Maternal Mortality in New Zealand 2007: Third Report to the Minister of Health – July 2008 to June 2009 43
2. New Zealand Maternal Mortality 2007
2.1 Introduction
The terms of reference of the PMMRC require the committee to review ‘direct’ maternal deaths. A Maternal Mortality Review Working Group (MMRWG) reporting to the PMMRC has been established to develop a process for the national collection of data relating to maternal deaths. The group’s aim is to review maternal mortality and identify potentially avoidable causes, with the expectation that this will lead to improvements in care.
The MMRWG is chaired by Claire McLintock (obstetric physician), and includes representatives from various professional groups, including anaesthetists, midwives, nurses, obstetricians, pathologists and psychiatrists. Vicki Masson (PMMRC national coordinator) provides additional support. The MMRWG meets three times a year.
The MMRWG must identify and review all ‘direct’ pregnancy-related deaths. Following discussion with the Ministry of Health, it has additionally decided to review ‘indirect’ deaths: in particular (but not solely) those related to surgery, psychiatric illness and family violence.
Recording maternal mortality rates is important at the level of the general population, the maternal population and the individual. On a population level the maternal mortality ratio acts as one barometer of how well the entire health system is functioning, and is a marker of a country’s overall development. At the maternal population level, studying trends in the data in order to identify and understand causes of mortality will help to improve future care. On an individual level, every maternal death is a tragedy. At each level, a basic premise applies: all women have the right to good clinical care in pregnancy and, as a basic human right, should be protected from avoidable death.
Definitions
In this report it was decided to adopt the following definition of maternal death, which comes from the World Health Organization (WHO) from the International Classification of Diseases (10th edition) as follows:
Maternal related death: "death of a woman while pregnant or within 42 days of termination of pregnancy, irrespective of the duration and site of the pregnancy, from any cause related to or aggravated by the pregnancy or its management, but not from accidental or incidental causes."
The cause of each death is classified using the CEMACH classification system (Lewis 2007):
Direct maternal deaths:• those resulting from obstetric complications of the pregnant state (pregnancy, labour or puerperium); from interventions, omissions or incorrect treatment; or from a chain of events resulting from the above.
Indirect maternal deaths:• those resulting from previous existing disease or disease that developed during pregnancy and was not due to direct obstetric causes, but which was aggravated by the physiologic effects of pregnancy.
Coincidental deaths:• those deaths from unrelated causes which happen to occur in pregnancy or the puerperium.
These definitions exclude maternal deaths occurring between 42 days and one year after the birth. It is known that some maternal deaths occur in this late period; the working group may consider those deaths in the future, although it should be noted that their precise identification often proves difficult.
Perinatal and Maternal Mortality in New Zealand 2007: Third Report to the Minister of Health – July 2008 to June 200944
2.2 Methodology
Since 2006, the national coordinator of the PMMRC has requested PMMRC local coordinators to notify her of all maternal deaths. Deaths are also brought to the MMRWG’s attention by the coroner, or when reported in the media. The working group has developed a New Zealand-specific data collection tool for maternal deaths. Following notification of a maternal death, the national coordinator issues maternal death reporting forms to the appropriate local coordinator, who is then responsible for gathering the relevant clinical information from staff involved with the woman’s care.
Each completed reporting form, along with relevant clinical information, is reviewed by a designated member of the MMRWG, who presents a summary of the case and findings to the working group. All MMRWG members then discuss each case in detail.
The maternal mortality ratio is calculated per 100,000 maternities. Maternities are defined as all live births and fetal deaths at 20 weeks gestation or beyond, or where the fetus weighs 400 g or more if gestation is unknown.
In reviewing each maternal death, the MMRWG notes potentially avoidable features. It considers there to be no avoidable features if no aspects of care that would have changed the clinical outcome have been identified. If it considers that there were potentially avoidable features, these are classified as either:
major features: aspects of care that would have been likely to affect the outcome if they had been appropriately • recognised and acted on, or
minor features: aspects of care that were less than ideal but unlikely to have affected the outcome.•
Potentially avoidable features are considered including the systems level issues (for example funding, management, organisation, staffing levels), clinical factors (for example competency, training, judgement), environmental factors (for example inadequate facilities, distance) and issues relating to the particular woman and her family (for example unbooked pregnancies, language barriers, social isolation).
2.3 Findings
There were 11 maternal deaths from 65,602 maternities reported to the MMRWG in 2007, giving a maternal mortality ratio of 16.8/100,000. Five of these were classified as direct deaths and five as indirect deaths, and one death could not be classified. Of classified deaths, the ratio for each of direct and indirect maternal deaths was 7.6/100,000. Three other deaths were reviewed and classified as coincidental deaths (due to road traffic accidents and malignancy), and were thus not included in calculation of the maternal mortality ratio.
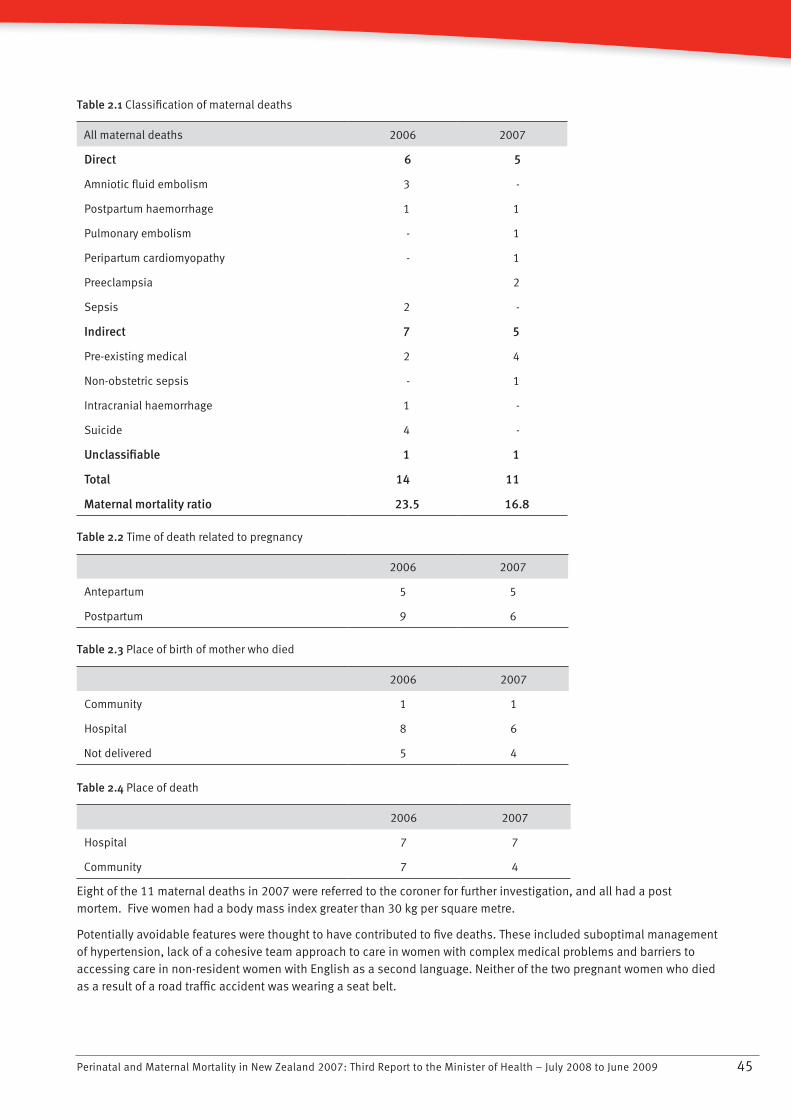
Perinatal and Maternal Mortality in New Zealand 2007: Third Report to the Minister of Health – July 2008 to June 2009 45
Table 2.1 Classification of maternal deaths
All maternal deaths 2006 2007
Direct 6 5
Amniotic fluid embolism 3 -
Postpartum haemorrhage 1 1
Pulmonary embolism - 1
Peripartum cardiomyopathy - 1
Preeclampsia 2
Sepsis 2 -
Indirect 7 5
Pre-existing medical 2 4
Non-obstetric sepsis - 1
Intracranial haemorrhage 1 -
Suicide 4 -
Unclassifiable 1 1
Total 14 11
Maternal mortality ratio 23.5 16.8
Table 2.2 Time of death related to pregnancy
2006 2007
Antepartum 5 5
Postpartum 9 6
Table 2.3 Place of birth of mother who died
2006 2007
Community 1 1
Hospital 8 6
Not delivered 5 4
Table 2.4 Place of death
2006 2007
Hospital 7 7
Community 7 4
Eight of the 11 maternal deaths in 2007 were referred to the coroner for further investigation, and all had a post mortem. Five women had a body mass index greater than 30 kg per square metre.
Potentially avoidable features were thought to have contributed to five deaths. These included suboptimal management of hypertension, lack of a cohesive team approach to care in women with complex medical problems and barriers to accessing care in non-resident women with English as a second language. Neither of the two pregnant women who died as a result of a road traffic accident was wearing a seat belt.
Perinatal and Maternal Mortality in New Zealand 2007: Third Report to the Minister of Health – July 2008 to June 200946
Key recommendations
Recommendations for the Ministry of Health and DHBs
Hypertension in pregnancy
Obstetric units should adopt the evidence-based management of hypertension in pregnancy recommended by the • Society of Obstetric Medicine of Australia and New Zealand.7
Access to care
Strategies to improve awareness of antenatal care services and increase access among women who are isolated for • social, economic, cultural or language reasons should be developed.
Seat belts in pregnancy
There is a need for greater public awareness of the importance of wearing a seat belt during pregnancy. All • pregnant women should know that three-point seat belts should be worn throughout pregnancy, with the lap strap placed as low as possible beneath the ‘bump’, lying across the thighs, and the diagonal shoulder strap above the ‘bump’, lying between the breasts.
Recommendations for clinicians and LMCs
Team approach to care
Women with complex medical conditions require a multidisciplinary approach to care, often across more than one • DHB. Each woman requiring such care should be assigned a key clinician to facilitate her care.
Seat belts in pregnancy
LMCs should advise pregnant women that three-point seat belts should be worn throughout pregnancy, with the • lap strap placed as low as possible beneath the ‘bump’, lying across the thighs, and the diagonal shoulder strap above the ‘bump’, lying between the breasts.
7 This is available open-access through the Society’s website: http://www.somanz.org/pdfs/somanz_guidelines_2008.pdf
Perinatal and Maternal Mortality in New Zealand 2007: Third Report to the Minister of Health – July 2008 to June 2009 47
3. PMMRC National Coordinator Report
Vicki Masson has been the national coordinator for the PMMRC since October 2006. Her background is nursing and midwifery, most recently in caring for women with high-risk pregnancy.
The role of the PMMRC national coordinator includes the following.
PMMRC data collection
The national coordinator supports LMCs, clinicians and local coordinators in DHBs in the completion of PMMRC data collection forms following both perinatal and maternal death. She ensures data integrity by following up on missing data, checking the accuracy of the data provided and the PSANZ classification of cause of death, and arranging audits for 15 percent of the perinatal death information and classifications.
The national coordinator notes any issues or suggestions for improvement of data collection, thus contributing to the development and enhancement of PMMRC information systems. She works with the PMMRC, epidemiologist, the Mortality Review Data Group (MRDG) and local coordinators to develop PMMRC forms and guidelines.
The national coordinator organises annual workshops, including one for LMCs, clinicians and other interested parties and one providing training and support for PMMRC local coordinators. She visits DHBs to support local perinatal mortality review meetings and distribute resources, through the PMMRC local coordinators.
Family support
The national coordinator is available to answer queries from affected families and the public regarding perinatal and maternal mortality. She also presents information on the purpose of the PMMRC and its findings at Sands conferences and other workshops.
PMMRC committee support
The national coordinator reports to the PMMRC on concerns that have been raised with her, including clinical issues or issues related to data quality. Before each PMMRC committee meeting she produces a data report from the PMMRC database.
The MMRWG has the support of the national coordinator in carrying out its review of maternal deaths and subsequent report, as does the NEWG in the creation of data collection systems for reviewing morbidity due to neonatal encephalopathy.
The national coordinator assisted with the planning and preparation for this report, and the data analysis interpretation contained within it.
Other working relationships
The national coordinator also works with the secretariat at the Ministry of Health, the Mortality Review Data Group (MRDG), other mortality review committees and local and national coroner’s offices.
Perinatal and Maternal Mortality in New Zealand 2007: Third Report to the Minister of Health – July 2008 to June 200948
4. Neonatal Encephalopathy Working Group Report
The PMMRC’s purpose is to review New Zealand’s perinatal and maternal deaths and report its findings to the Minister of Health. The PMMRC also develops strategic plans and methodologies to reduce preventable perinatal morbidity. Neonatal encephalopathy (NE) was recently identified as an area in which services and outcomes could be improved. In late 2007 the PMMRC established the Neonatal Encephalopathy Working Group (NEWG) and charged it with reviewing New Zealand data on NE.
The Neonatal Encephalopathy Working Group’s definition of NE is a clinically defined syndrome of disturbed neurological function within the first week of life in the term infant, manifested by difficulty in initiating and maintaining respiration, depression of tone and reflexes, subnormal level of consciousness and often seizures.
Although perinatal hypoxic ischemic insult is considered the most common cause of preventable neurological injury in newborns, no valid national dataset on its prevalence currently exists in New Zealand. Thus, the first priority of the group is to establish the true size of the problem.
An observational audit will soon take place, and will include the following components:
the inclusion of NE as a condition on perinatal surveillance unit reporting cards•
the requirement for LMCs to complete rapid reporting forms on behalf of the mother for babies diagnosed with NE•
the requirement for attending paediatricians to complete rapid reporting forms on behalf of the baby for surviving • infants with moderate to severe NE.
The audit has been designed in consultation with the Paediatric Surveillance Unit (PSU). Ethical approval by the Multi-region Ethics Committee was obtained in June 2009. Pilot data collection will commence in 2009, and full data collection in 2010.
The information provided will be completely confidential: no individual infant or mother will be identified. The project will document the number of newborn infants with moderate to severe NE in New Zealand and the distribution of these affected infants in terms of geographic location and level 2 and level 3 neonatal units. Analysis of the data will help to determine possible predictors of the condition, and will inform the future development of effective preventative and remedial therapies. The ultimate aim is to reduce the occurrence and severity of NE, improving health outcomes for infants and decreasing disability.
Further information on NEWG can be found on the PMMRC’s website www.pmmrc.health.govt.nz
Perinatal and Maternal Mortality in New Zealand 2007: Third Report to the Minister of Health – July 2008 to June 2009 49
5. Issues for Parents, Families and Whànau
The first two reports of the PMMRC highlighted the inconsistent and patchy support that DHBs provide for bereaved parents, family and whànau who experience a perinatal loss. This observation resulted from a survey that the PMMRC had carried out into perinatal loss services in DHBs, which recommended that DHBs should be better supported and guided to provide such services.
There has only been limited progress made on this recommendation. Many DHBs have held perinatal death study days, and the Ministry of Health has funded the printing of the Sands support pack that hospitals provide to parents and families following their baby’s death (available in all DHBs). However, many DHBs are still unable to provide a coordinated support service, and are relying on the voluntary and unfunded efforts of community groups to provide partial support. In the coming year, the PMMRC will be resurveying the DHBs to gauge progress in this area, and will subsequently inform DHBs on future improvements that remain to be made.
The PMMRC have produced a pànui for parents who are faced with making the decision regarding post mortem examination for their baby. This is available on the PMMRC website and from local coordinators in each DHB. In the future, the PMMRC will provide further information regarding decisions to be made following a diagnosis of congenital abnormalities.
Recommendation for the Ministry of Health and DHBs
Continued funding of support information to bereaved parents and families following perinatal death. •
Perinatal and Maternal Mortality in New Zealand 2007: Third Report to the Minister of Health – July 2008 to June 200950
Appendix A: Classifications of the Perinatal Society of Australia and New Zealand
Perinatal Death Classification (PSANZ-PDC)1 Congenital abnormality (including terminations for congenital abnormalities) 1.1 Central nervous system 1.2 Cardiovascular system 1.3 Urinary system 1.4 Gastrointestinal system 1.5 Chromosomal 1.6 Metabolic 1.7 Multiple/non chromosomal syndromes 1.8 Other congenital abnormality 1.8.1 Musculoskeletal 1.8.2 Respiratory 1.8.3 Diaphragmatic hernia 1.8.4 Haematological 1.8.5 Tumours 1.8.8 Other specified congenital abnormality 1.9 Unspecified congenital abnormality
2 Perinatal infection 2.1 Bacterial 2.1.1 Group B Streptococcus 2.1.2 E coli 2.1.3 Listeria monocytogenes 2.1.4 Spirochaetal, for example Syphilis 2.1.8 Other bacterial 2.1.9 Unspecified bacterial 2.2 Viral 2.2.1 Cytomegalovirus 2.2.2 Parvovirus 2.2.3 Herpes simplex virus 2.2.4 Rubella virus 2.2.8 Other viral 2.2.9 Unspecified viral 2.3 Protozoal, for example, Toxoplasma 2.5 Fungal 2.8 Other specified organism 2.9 Other unspecified organism
3 Hypertension 3.1 Chronic hypertension: essential 3.2 Chronic hypertension: secondary, for example renal disease 3.3 Chronic hypertension: unspecified 3.4 Gestational hypertension 3.5 Pre-eclampsia 3.5.1 With laboratory evidence of thrombophilia 3.6 Pre-eclampsia superimposed on chronic hypertension 3.6.1 With laboratory evidence of thrombophilia 3.9 Unspecified hypertension
4 Antepartum haemorrhage (APH) 4.1 Placental abruption 4.1.1 With laboratory evidence of thrombophilia 4.2 Placenta praevia 4.3 Vasa praevia 4.8 Other APH 4.9 APH of undetermined origin
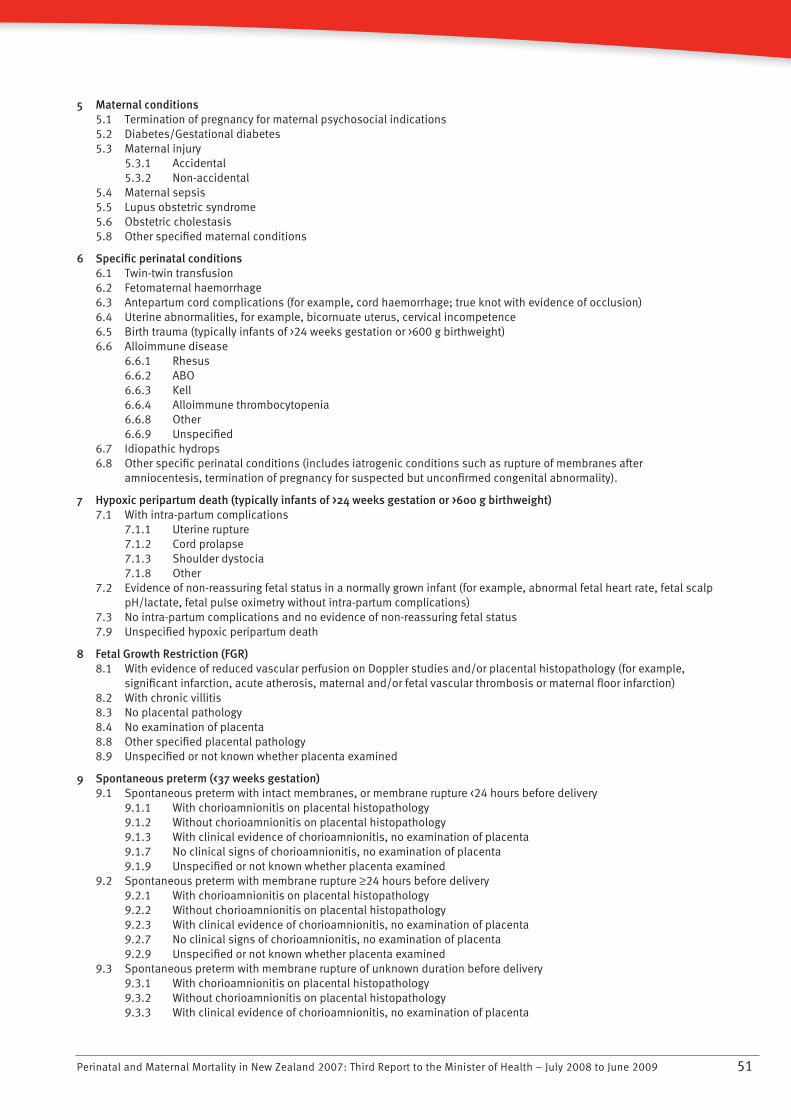
Perinatal and Maternal Mortality in New Zealand 2007: Third Report to the Minister of Health – July 2008 to June 2009 51
5 Maternal conditions 5.1 Termination of pregnancy for maternal psychosocial indications 5.2 Diabetes/Gestational diabetes 5.3 Maternal injury 5.3.1 Accidental 5.3.2 Non-accidental 5.4 Maternal sepsis 5.5 Lupus obstetric syndrome 5.6 Obstetric cholestasis 5.8 Other specified maternal conditions
6 Specific perinatal conditions 6.1 Twin-twin transfusion 6.2 Fetomaternal haemorrhage 6.3 Antepartum cord complications (for example, cord haemorrhage; true knot with evidence of occlusion) 6.4 Uterine abnormalities, for example, bicornuate uterus, cervical incompetence 6.5 Birth trauma (typically infants of >24 weeks gestation or >600 g birthweight) 6.6 Alloimmune disease 6.6.1 Rhesus 6.6.2 ABO 6.6.3 Kell 6.6.4 Alloimmune thrombocytopenia 6.6.8 Other 6.6.9 Unspecified 6.7 Idiopathic hydrops 6.8 Other specific perinatal conditions (includes iatrogenic conditions such as rupture of membranes after
amniocentesis, termination of pregnancy for suspected but unconfirmed congenital abnormality).
7 Hypoxic peripartum death (typically infants of >24 weeks gestation or >600 g birthweight) 7.1 With intra-partum complications 7.1.1 Uterine rupture 7.1.2 Cord prolapse 7.1.3 Shoulder dystocia 7.1.8 Other 7.2 Evidence of non-reassuring fetal status in a normally grown infant (for example, abnormal fetal heart rate, fetal scalp
pH/lactate, fetal pulse oximetry without intra-partum complications) 7.3 No intra-partum complications and no evidence of non-reassuring fetal status 7.9 Unspecified hypoxic peripartum death
8 Fetal Growth Restriction (FGR) 8.1 With evidence of reduced vascular perfusion on Doppler studies and/or placental histopathology (for example,
significant infarction, acute atherosis, maternal and/or fetal vascular thrombosis or maternal floor infarction) 8.2 With chronic villitis 8.3 No placental pathology 8.4 No examination of placenta 8.8 Other specified placental pathology 8.9 Unspecified or not known whether placenta examined
9 Spontaneous preterm (<37 weeks gestation) 9.1 Spontaneous preterm with intact membranes, or membrane rupture <24 hours before delivery 9.1.1 With chorioamnionitis on placental histopathology 9.1.2 Without chorioamnionitis on placental histopathology 9.1.3 With clinical evidence of chorioamnionitis, no examination of placenta 9.1.7 No clinical signs of chorioamnionitis, no examination of placenta 9.1.9 Unspecified or not known whether placenta examined 9.2 Spontaneous preterm with membrane rupture ≥24 hours before delivery 9.2.1 With chorioamnionitis on placental histopathology 9.2.2 Without chorioamnionitis on placental histopathology 9.2.3 With clinical evidence of chorioamnionitis, no examination of placenta 9.2.7 No clinical signs of chorioamnionitis, no examination of placenta 9.2.9 Unspecified or not known whether placenta examined 9.3 Spontaneous preterm with membrane rupture of unknown duration before delivery 9.3.1 With chorioamnionitis on placental histopathology 9.3.2 Without chorioamnionitis on placental histopathology 9.3.3 With clinical evidence of chorioamnionitis, no examination of placenta
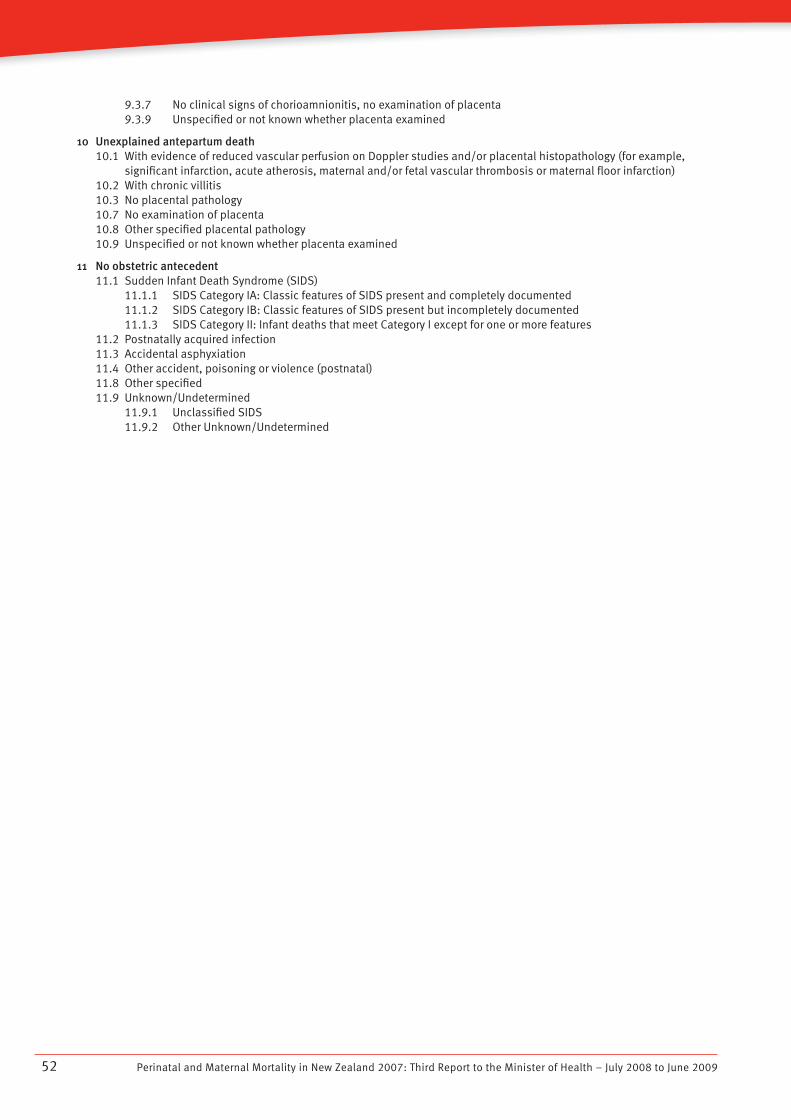
Perinatal and Maternal Mortality in New Zealand 2007: Third Report to the Minister of Health – July 2008 to June 200952
9.3.7 No clinical signs of chorioamnionitis, no examination of placenta 9.3.9 Unspecified or not known whether placenta examined
10 Unexplained antepartum death 10.1 With evidence of reduced vascular perfusion on Doppler studies and/or placental histopathology (for example,
significant infarction, acute atherosis, maternal and/or fetal vascular thrombosis or maternal floor infarction) 10.2 With chronic villitis 10.3 No placental pathology 10.7 No examination of placenta 10.8 Other specified placental pathology 10.9 Unspecified or not known whether placenta examined
11 No obstetric antecedent 11.1 Sudden Infant Death Syndrome (SIDS) 11.1.1 SIDS Category IA: Classic features of SIDS present and completely documented 11.1.2 SIDS Category IB: Classic features of SIDS present but incompletely documented 11.1.3 SIDS Category II: Infant deaths that meet Category I except for one or more features 11.2 Postnatally acquired infection 11.3 Accidental asphyxiation 11.4 Other accident, poisoning or violence (postnatal) 11.8 Other specified 11.9 Unknown/Undetermined 11.9.1 Unclassified SIDS 11.9.2 Other Unknown/Undetermined
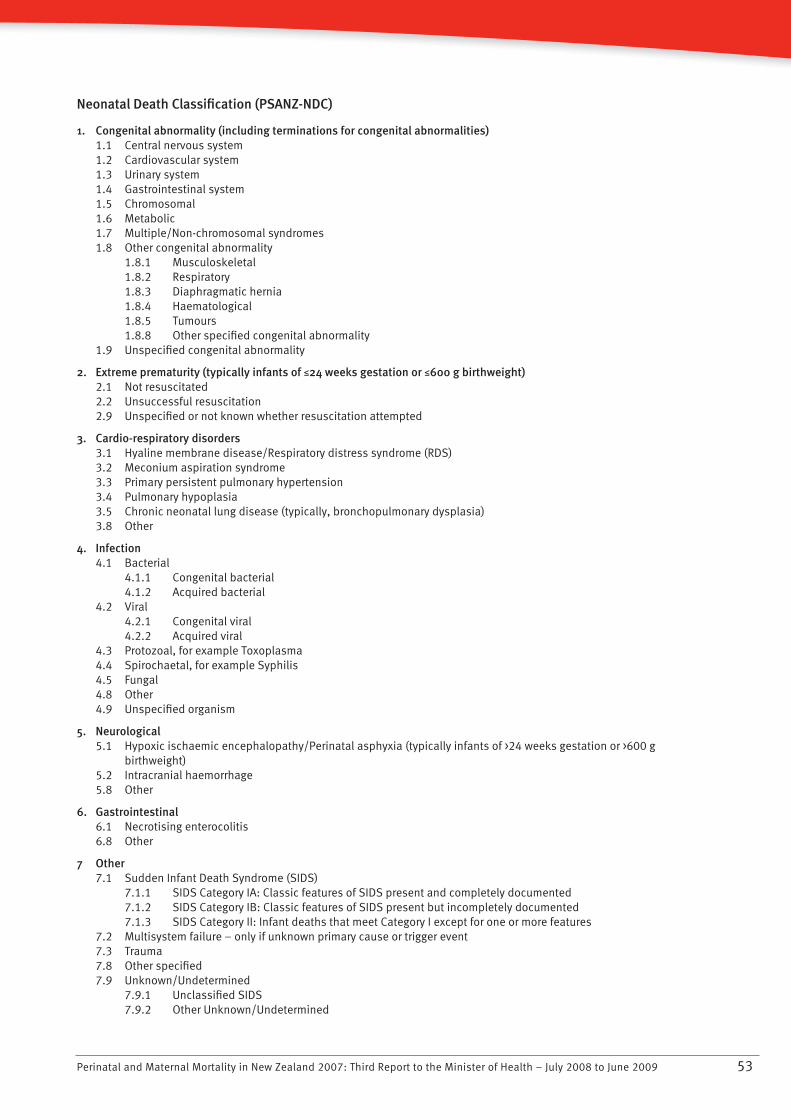
Perinatal and Maternal Mortality in New Zealand 2007: Third Report to the Minister of Health – July 2008 to June 2009 53
Neonatal Death Classification (PSANZ-NDC)
1. Congenital abnormality (including terminations for congenital abnormalities) 1.1 Central nervous system 1.2 Cardiovascular system 1.3 Urinary system 1.4 Gastrointestinal system 1.5 Chromosomal 1.6 Metabolic 1.7 Multiple/Non-chromosomal syndromes 1.8 Other congenital abnormality 1.8.1 Musculoskeletal 1.8.2 Respiratory 1.8.3 Diaphragmatic hernia 1.8.4 Haematological 1.8.5 Tumours 1.8.8 Other specified congenital abnormality 1.9 Unspecified congenital abnormality
2. Extreme prematurity (typically infants of M24 weeks gestation or M600 g birthweight) 2.1 Not resuscitated 2.2 Unsuccessful resuscitation 2.9 Unspecified or not known whether resuscitation attempted
3. Cardio-respiratory disorders 3.1 Hyaline membrane disease/Respiratory distress syndrome (RDS) 3.2 Meconium aspiration syndrome 3.3 Primary persistent pulmonary hypertension 3.4 Pulmonary hypoplasia 3.5 Chronic neonatal lung disease (typically, bronchopulmonary dysplasia) 3.8 Other
4. Infection 4.1 Bacterial 4.1.1 Congenital bacterial 4.1.2 Acquired bacterial 4.2 Viral 4.2.1 Congenital viral 4.2.2 Acquired viral 4.3 Protozoal, for example Toxoplasma 4.4 Spirochaetal, for example Syphilis 4.5 Fungal 4.8 Other 4.9 Unspecified organism
5. Neurological 5.1 Hypoxic ischaemic encephalopathy/Perinatal asphyxia (typically infants of >24 weeks gestation or >600 g
birthweight) 5.2 Intracranial haemorrhage 5.8 Other
6. Gastrointestinal 6.1 Necrotising enterocolitis 6.8 Other
7 Other 7.1 Sudden Infant Death Syndrome (SIDS) 7.1.1 SIDS Category IA: Classic features of SIDS present and completely documented 7.1.2 SIDS Category IB: Classic features of SIDS present but incompletely documented 7.1.3 SIDS Category II: Infant deaths that meet Category I except for one or more features 7.2 Multisystem failure – only if unknown primary cause or trigger event 7.3 Trauma 7.8 Other specified 7.9 Unknown/Undetermined 7.9.1 Unclassified SIDS 7.9.2 Other Unknown/Undetermined
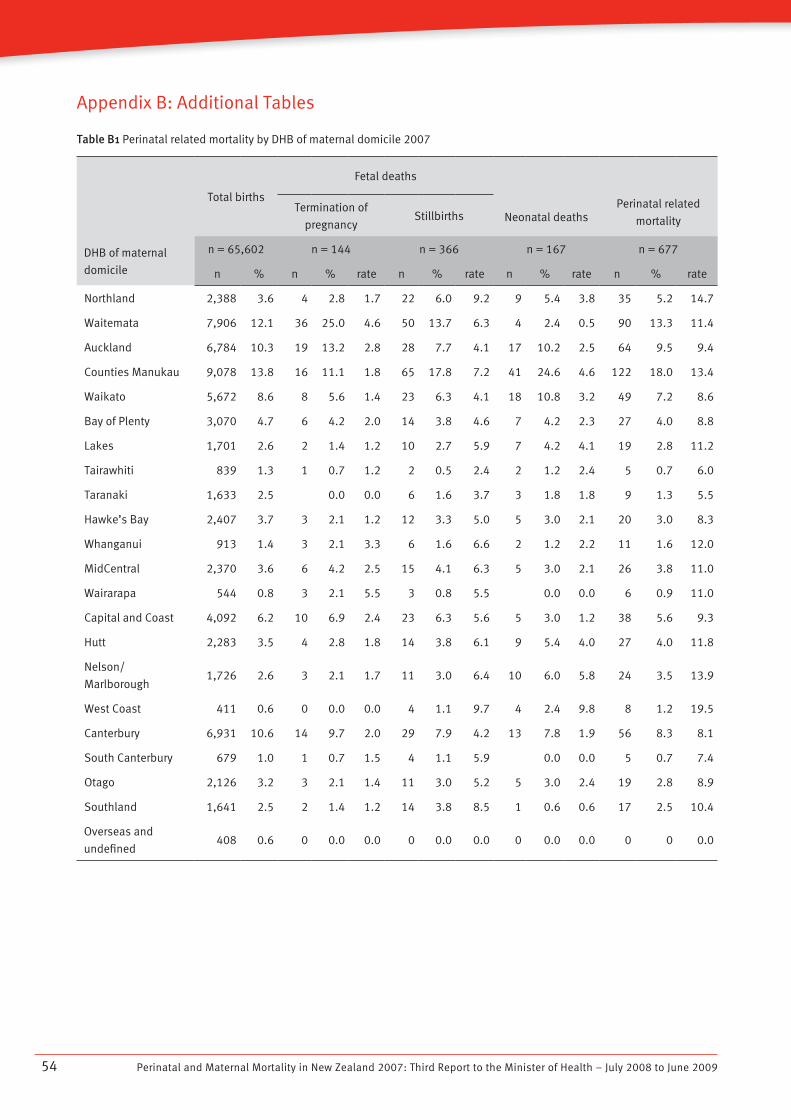
Perinatal and Maternal Mortality in New Zealand 2007: Third Report to the Minister of Health – July 2008 to June 200954
Appendix B: Additional Tables
Table B1 Perinatal related mortality by DHB of maternal domicile 2007
DHB of maternal
domicile
Total births
Fetal deaths
Neonatal deathsPerinatal related
mortalityTermination of
pregnancyStillbirths
n = 65,602 n = 144 n = 366 n = 167 n = 677
n % n % rate n % rate n % rate n % rate
Northland 2,388 3.6 4 2.8 1.7 22 6.0 9.2 9 5.4 3.8 35 5.2 14.7
Waitemata 7,906 12.1 36 25.0 4.6 50 13.7 6.3 4 2.4 0.5 90 13.3 11.4
Auckland 6,784 10.3 19 13.2 2.8 28 7.7 4.1 17 10.2 2.5 64 9.5 9.4
Counties Manukau 9,078 13.8 16 11.1 1.8 65 17.8 7.2 41 24.6 4.6 122 18.0 13.4
Waikato 5,672 8.6 8 5.6 1.4 23 6.3 4.1 18 10.8 3.2 49 7.2 8.6
Bay of Plenty 3,070 4.7 6 4.2 2.0 14 3.8 4.6 7 4.2 2.3 27 4.0 8.8
Lakes 1,701 2.6 2 1.4 1.2 10 2.7 5.9 7 4.2 4.1 19 2.8 11.2
Tairawhiti 839 1.3 1 0.7 1.2 2 0.5 2.4 2 1.2 2.4 5 0.7 6.0
Taranaki 1,633 2.5 0.0 0.0 6 1.6 3.7 3 1.8 1.8 9 1.3 5.5
Hawke’s Bay 2,407 3.7 3 2.1 1.2 12 3.3 5.0 5 3.0 2.1 20 3.0 8.3
Whanganui 913 1.4 3 2.1 3.3 6 1.6 6.6 2 1.2 2.2 11 1.6 12.0
MidCentral 2,370 3.6 6 4.2 2.5 15 4.1 6.3 5 3.0 2.1 26 3.8 11.0
Wairarapa 544 0.8 3 2.1 5.5 3 0.8 5.5 0.0 0.0 6 0.9 11.0
Capital and Coast 4,092 6.2 10 6.9 2.4 23 6.3 5.6 5 3.0 1.2 38 5.6 9.3
Hutt 2,283 3.5 4 2.8 1.8 14 3.8 6.1 9 5.4 4.0 27 4.0 11.8
Nelson/
Marlborough1,726 2.6 3 2.1 1.7 11 3.0 6.4 10 6.0 5.8 24 3.5 13.9
West Coast 411 0.6 0 0.0 0.0 4 1.1 9.7 4 2.4 9.8 8 1.2 19.5
Canterbury 6,931 10.6 14 9.7 2.0 29 7.9 4.2 13 7.8 1.9 56 8.3 8.1
South Canterbury 679 1.0 1 0.7 1.5 4 1.1 5.9 0.0 0.0 5 0.7 7.4
Otago 2,126 3.2 3 2.1 1.4 11 3.0 5.2 5 3.0 2.4 19 2.8 8.9
Southland 1,641 2.5 2 1.4 1.2 14 3.8 8.5 1 0.6 0.6 17 2.5 10.4
Overseas and
undefined408 0.6 0 0.0 0.0 0 0.0 0.0 0 0.0 0.0 0 0 0.0
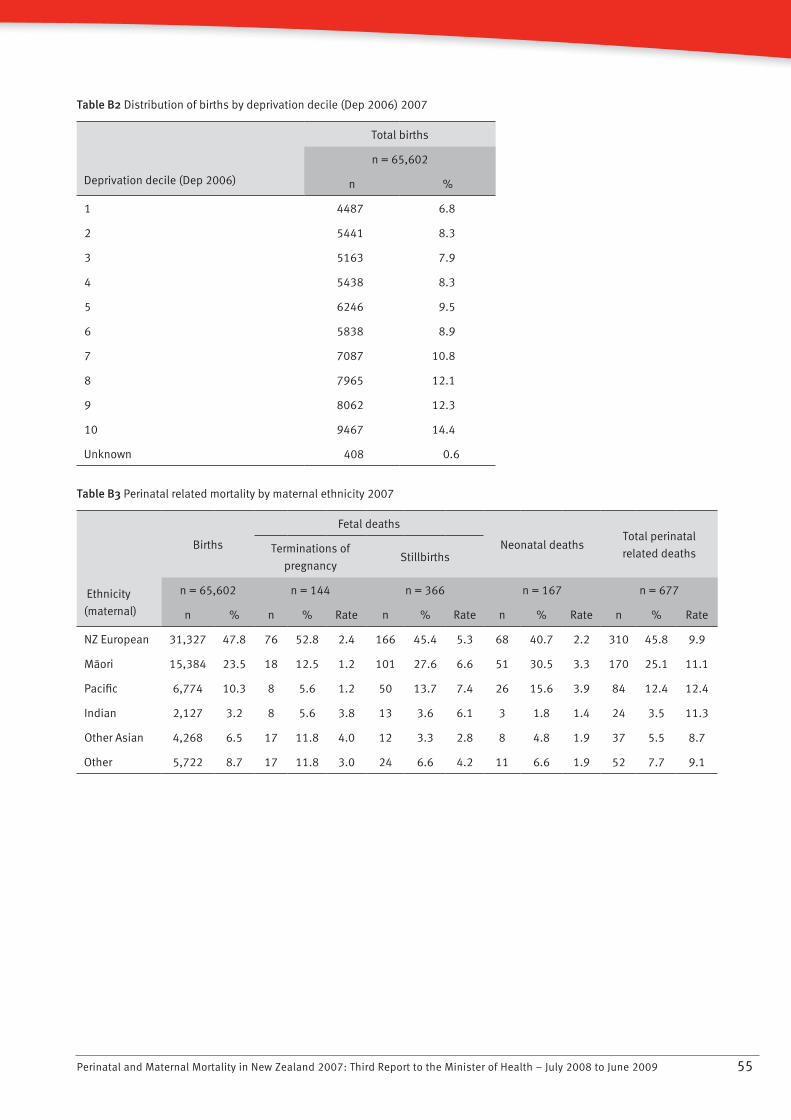
Perinatal and Maternal Mortality in New Zealand 2007: Third Report to the Minister of Health – July 2008 to June 2009 55
Table B2 Distribution of births by deprivation decile (Dep 2006) 2007
Deprivation decile (Dep 2006)
Total births
n = 65,602
n %
1 4487 6.8
2 5441 8.3
3 5163 7.9
4 5438 8.3
5 6246 9.5
6 5838 8.9
7 7087 10.8
8 7965 12.1
9 8062 12.3
10 9467 14.4
Unknown 408 0.6
Table B3 Perinatal related mortality by maternal ethnicity 2007
Ethnicity
(maternal)
Births
Fetal deaths
Neonatal deathsTotal perinatal
related deathsTerminations of
pregnancyStillbirths
n = 65,602 n = 144 n = 366 n = 167 n = 677
n % n % Rate n % Rate n % Rate n % Rate
NZ European 31,327 47.8 76 52.8 2.4 166 45.4 5.3 68 40.7 2.2 310 45.8 9.9
Màori 15,384 23.5 18 12.5 1.2 101 27.6 6.6 51 30.5 3.3 170 25.1 11.1
Pacific 6,774 10.3 8 5.6 1.2 50 13.7 7.4 26 15.6 3.9 84 12.4 12.4
Indian 2,127 3.2 8 5.6 3.8 13 3.6 6.1 3 1.8 1.4 24 3.5 11.3
Other Asian 4,268 6.5 17 11.8 4.0 12 3.3 2.8 8 4.8 1.9 37 5.5 8.7
Other 5,722 8.7 17 11.8 3.0 24 6.6 4.2 11 6.6 1.9 52 7.7 9.1
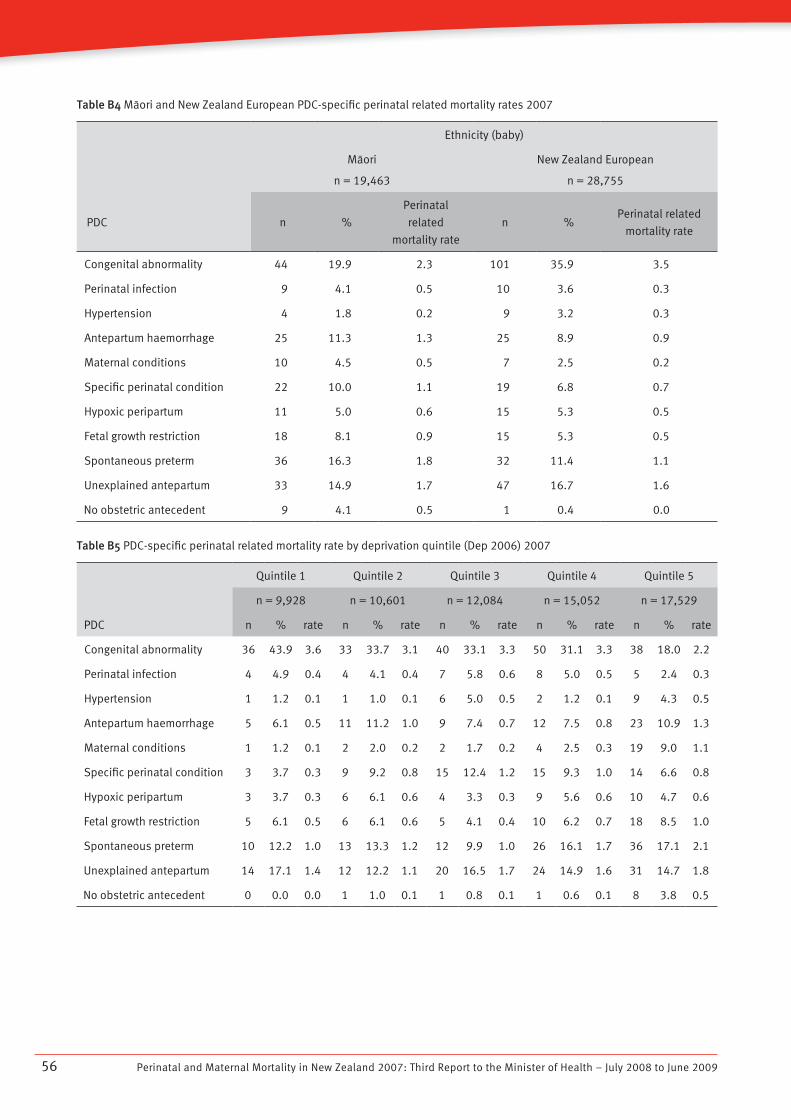
Perinatal and Maternal Mortality in New Zealand 2007: Third Report to the Minister of Health – July 2008 to June 200956
Table B4 Màori and New Zealand European PDC-specific perinatal related mortality rates 2007
Ethnicity (baby)
Màori
n = 19,463
New Zealand European
n = 28,755
PDC n %
Perinatal
related
mortality rate
n %Perinatal related
mortality rate
Congenital abnormality 44 19.9 2.3 101 35.9 3.5
Perinatal infection 9 4.1 0.5 10 3.6 0.3
Hypertension 4 1.8 0.2 9 3.2 0.3
Antepartum haemorrhage 25 11.3 1.3 25 8.9 0.9
Maternal conditions 10 4.5 0.5 7 2.5 0.2
Specific perinatal condition 22 10.0 1.1 19 6.8 0.7
Hypoxic peripartum 11 5.0 0.6 15 5.3 0.5
Fetal growth restriction 18 8.1 0.9 15 5.3 0.5
Spontaneous preterm 36 16.3 1.8 32 11.4 1.1
Unexplained antepartum 33 14.9 1.7 47 16.7 1.6
No obstetric antecedent 9 4.1 0.5 1 0.4 0.0
Table B5 PDC-specific perinatal related mortality rate by deprivation quintile (Dep 2006) 2007
Quintile 1 Quintile 2 Quintile 3 Quintile 4 Quintile 5
n = 9,928 n = 10,601 n = 12,084 n = 15,052 n = 17,529
PDC n % rate n % rate n % rate n % rate n % rate
Congenital abnormality 36 43.9 3.6 33 33.7 3.1 40 33.1 3.3 50 31.1 3.3 38 18.0 2.2
Perinatal infection 4 4.9 0.4 4 4.1 0.4 7 5.8 0.6 8 5.0 0.5 5 2.4 0.3
Hypertension 1 1.2 0.1 1 1.0 0.1 6 5.0 0.5 2 1.2 0.1 9 4.3 0.5
Antepartum haemorrhage 5 6.1 0.5 11 11.2 1.0 9 7.4 0.7 12 7.5 0.8 23 10.9 1.3
Maternal conditions 1 1.2 0.1 2 2.0 0.2 2 1.7 0.2 4 2.5 0.3 19 9.0 1.1
Specific perinatal condition 3 3.7 0.3 9 9.2 0.8 15 12.4 1.2 15 9.3 1.0 14 6.6 0.8
Hypoxic peripartum 3 3.7 0.3 6 6.1 0.6 4 3.3 0.3 9 5.6 0.6 10 4.7 0.6
Fetal growth restriction 5 6.1 0.5 6 6.1 0.6 5 4.1 0.4 10 6.2 0.7 18 8.5 1.0
Spontaneous preterm 10 12.2 1.0 13 13.3 1.2 12 9.9 1.0 26 16.1 1.7 36 17.1 2.1
Unexplained antepartum 14 17.1 1.4 12 12.2 1.1 20 16.5 1.7 24 14.9 1.6 31 14.7 1.8
No obstetric antecedent 0 0.0 0.0 1 1.0 0.1 1 0.8 0.1 1 0.6 0.1 8 3.8 0.5
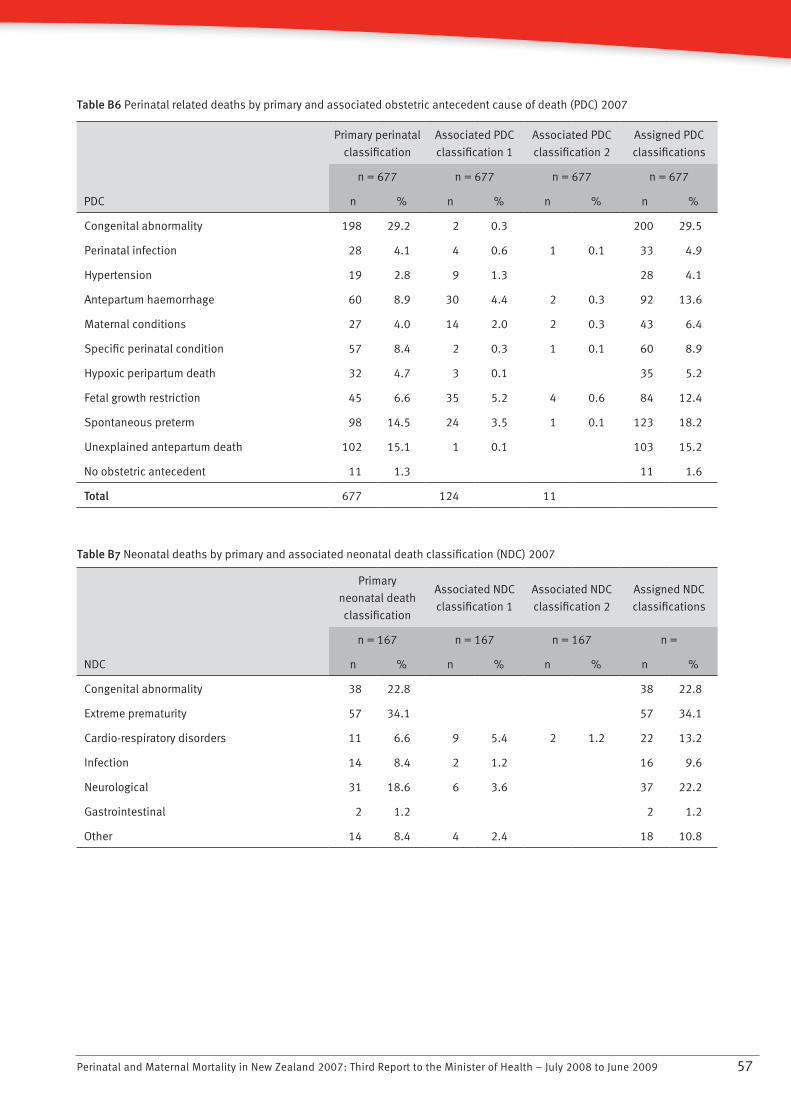
Perinatal and Maternal Mortality in New Zealand 2007: Third Report to the Minister of Health – July 2008 to June 2009 57
Table B6 Perinatal related deaths by primary and associated obstetric antecedent cause of death (PDC) 2007
Primary perinatal
classification
Associated PDC
classification 1
Associated PDC
classification 2
Assigned PDC
classifications
n = 677 n = 677 n = 677 n = 677
PDC n % n % n % n %
Congenital abnormality 198 29.2 2 0.3 200 29.5
Perinatal infection 28 4.1 4 0.6 1 0.1 33 4.9
Hypertension 19 2.8 9 1.3 28 4.1
Antepartum haemorrhage 60 8.9 30 4.4 2 0.3 92 13.6
Maternal conditions 27 4.0 14 2.0 2 0.3 43 6.4
Specific perinatal condition 57 8.4 2 0.3 1 0.1 60 8.9
Hypoxic peripartum death 32 4.7 3 0.1 35 5.2
Fetal growth restriction 45 6.6 35 5.2 4 0.6 84 12.4
Spontaneous preterm 98 14.5 24 3.5 1 0.1 123 18.2
Unexplained antepartum death 102 15.1 1 0.1 103 15.2
No obstetric antecedent 11 1.3 11 1.6
Total 677 124 11
Table B7 Neonatal deaths by primary and associated neonatal death classification (NDC) 2007
Primary
neonatal death
classification
Associated NDC
classification 1
Associated NDC
classification 2
Assigned NDC
classifications
n = 167 n = 167 n = 167 n =
NDC n % n % n % n %
Congenital abnormality 38 22.8 38 22.8
Extreme prematurity 57 34.1 57 34.1
Cardio-respiratory disorders 11 6.6 9 5.4 2 1.2 22 13.2
Infection 14 8.4 2 1.2 16 9.6
Neurological 31 18.6 6 3.6 37 22.2
Gastrointestinal 2 1.2 2 1.2
Other 14 8.4 4 2.4 18 10.8
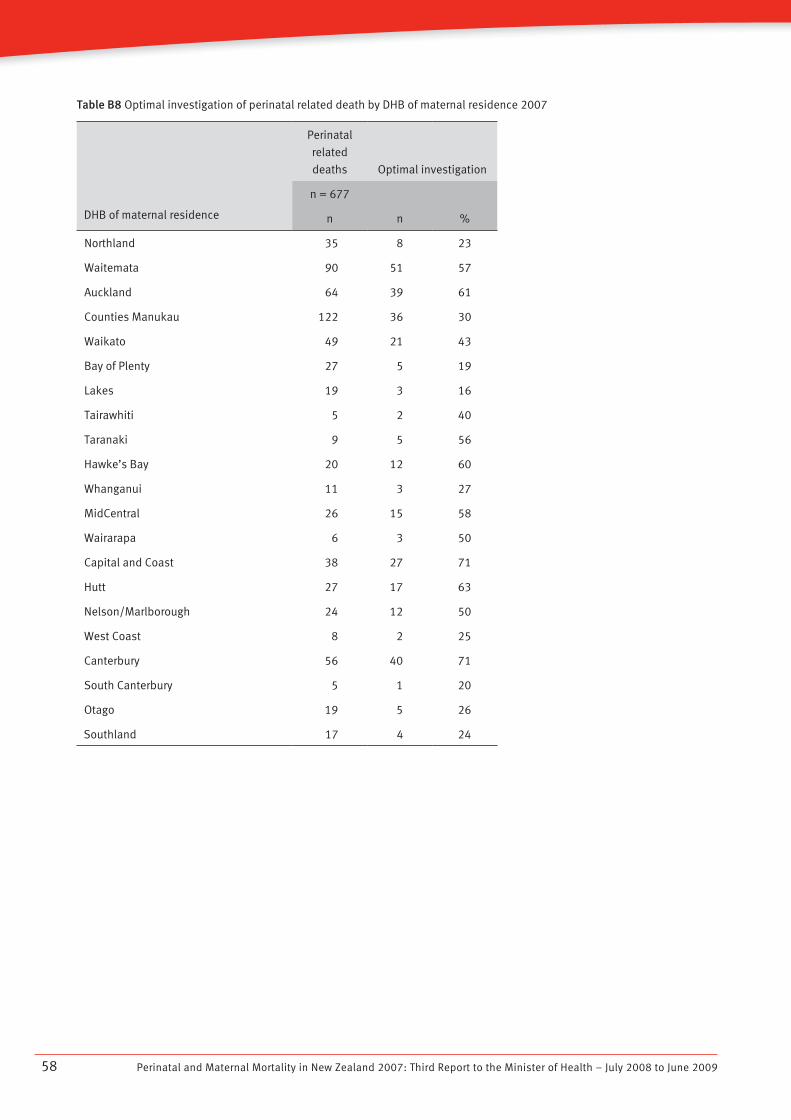
Perinatal and Maternal Mortality in New Zealand 2007: Third Report to the Minister of Health – July 2008 to June 200958
Table B8 Optimal investigation of perinatal related death by DHB of maternal residence 2007
DHB of maternal residence
Perinatal
related
deaths Optimal investigation
n = 677
n n %
Northland 35 8 23
Waitemata 90 51 57
Auckland 64 39 61
Counties Manukau 122 36 30
Waikato 49 21 43
Bay of Plenty 27 5 19
Lakes 19 3 16
Tairawhiti 5 2 40
Taranaki 9 5 56
Hawke’s Bay 20 12 60
Whanganui 11 3 27
MidCentral 26 15 58
Wairarapa 6 3 50
Capital and Coast 38 27 71
Hutt 27 17 63
Nelson/Marlborough 24 12 50
West Coast 8 2 25
Canterbury 56 40 71
South Canterbury 5 1 20
Otago 19 5 26
Southland 17 4 24
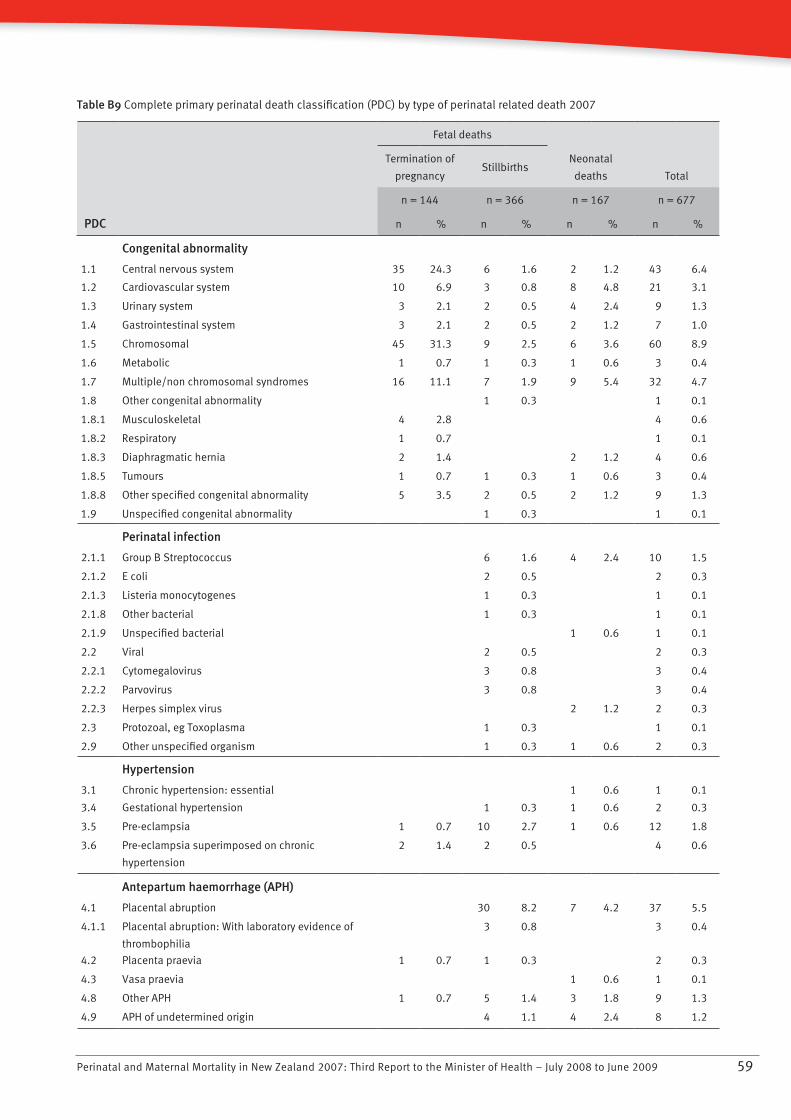
Perinatal and Maternal Mortality in New Zealand 2007: Third Report to the Minister of Health – July 2008 to June 2009 59
Table B9 Complete primary perinatal death classification (PDC) by type of perinatal related death 2007
PDC
Fetal deaths
Neonatal
deaths Total
Termination of
pregnancyStillbirths
n = 144 n = 366 n = 167 n = 677
n % n % n % n %
Congenital abnormality
1.1 Central nervous system 35 24.3 6 1.6 2 1.2 43 6.4
1.2 Cardiovascular system 10 6.9 3 0.8 8 4.8 21 3.1
1.3 Urinary system 3 2.1 2 0.5 4 2.4 9 1.3
1.4 Gastrointestinal system 3 2.1 2 0.5 2 1.2 7 1.0
1.5 Chromosomal 45 31.3 9 2.5 6 3.6 60 8.9
1.6 Metabolic 1 0.7 1 0.3 1 0.6 3 0.4
1.7 Multiple/non chromosomal syndromes 16 11.1 7 1.9 9 5.4 32 4.7
1.8 Other congenital abnormality 1 0.3 1 0.1
1.8.1 Musculoskeletal 4 2.8 4 0.6
1.8.2 Respiratory 1 0.7 1 0.1
1.8.3 Diaphragmatic hernia 2 1.4 2 1.2 4 0.6
1.8.5 Tumours 1 0.7 1 0.3 1 0.6 3 0.4
1.8.8 Other specified congenital abnormality 5 3.5 2 0.5 2 1.2 9 1.3
1.9 Unspecified congenital abnormality 1 0.3 1 0.1
Perinatal infection
2.1.1 Group B Streptococcus 6 1.6 4 2.4 10 1.5
2.1.2 E coli 2 0.5 2 0.3
2.1.3 Listeria monocytogenes 1 0.3 1 0.1
2.1.8 Other bacterial 1 0.3 1 0.1
2.1.9 Unspecified bacterial 1 0.6 1 0.1
2.2 Viral 2 0.5 2 0.3
2.2.1 Cytomegalovirus 3 0.8 3 0.4
2.2.2 Parvovirus 3 0.8 3 0.4
2.2.3 Herpes simplex virus 2 1.2 2 0.3
2.3 Protozoal, eg Toxoplasma 1 0.3 1 0.1
2.9 Other unspecified organism 1 0.3 1 0.6 2 0.3
Hypertension
3.1 Chronic hypertension: essential 1 0.6 1 0.1
3.4 Gestational hypertension 1 0.3 1 0.6 2 0.3
3.5 Pre-eclampsia 1 0.7 10 2.7 1 0.6 12 1.8
3.6 Pre-eclampsia superimposed on chronic
hypertension
2 1.4 2 0.5 4 0.6
Antepartum haemorrhage (APH)
4.1 Placental abruption 30 8.2 7 4.2 37 5.5
4.1.1 Placental abruption: With laboratory evidence of
thrombophilia
3 0.8 3 0.4
4.2 Placenta praevia 1 0.7 1 0.3 2 0.3
4.3 Vasa praevia 1 0.6 1 0.1
4.8 Other APH 1 0.7 5 1.4 3 1.8 9 1.3
4.9 APH of undetermined origin 4 1.1 4 2.4 8 1.2
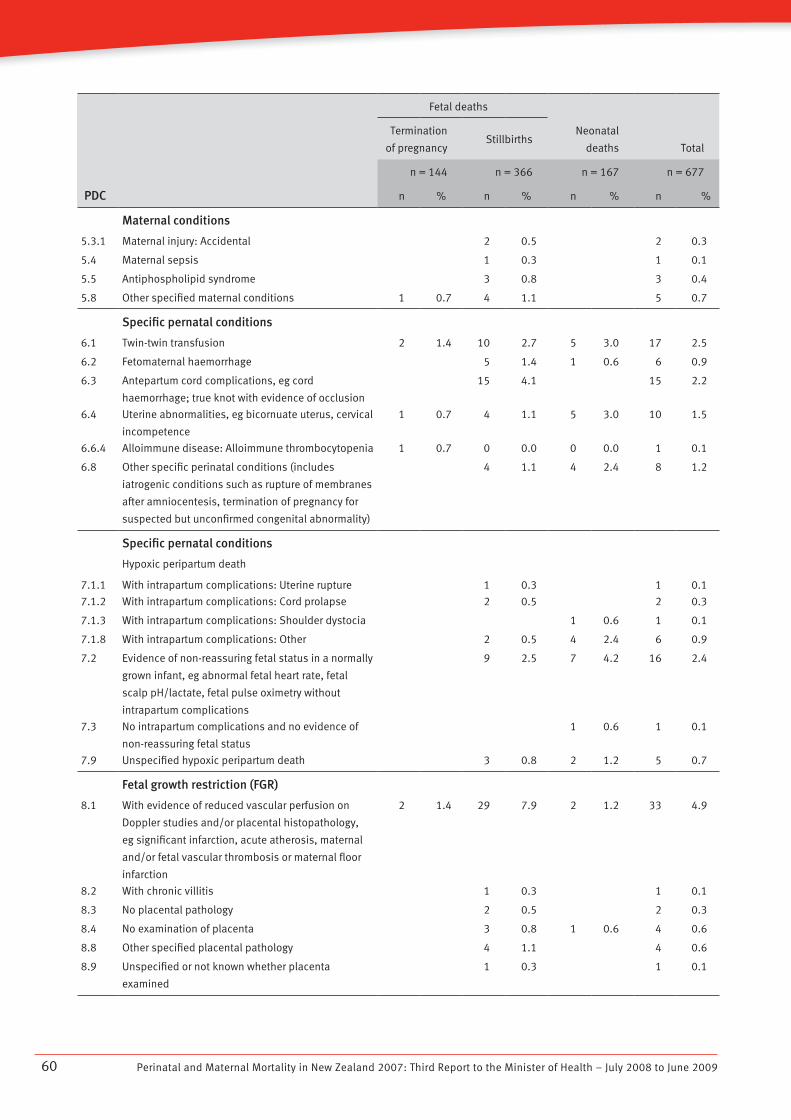
Perinatal and Maternal Mortality in New Zealand 2007: Third Report to the Minister of Health – July 2008 to June 200960
PDC
Fetal deaths
Neonatal
deaths Total
Termination
of pregnancyStillbirths
n = 144 n = 366 n = 167 n = 677
n % n % n % n %
Maternal conditions
5.3.1 Maternal injury: Accidental 2 0.5 2 0.3
5.4 Maternal sepsis 1 0.3 1 0.1
5.5 Antiphospholipid syndrome 3 0.8 3 0.4
5.8 Other specified maternal conditions 1 0.7 4 1.1 5 0.7
Specific pernatal conditions
6.1 Twin-twin transfusion 2 1.4 10 2.7 5 3.0 17 2.5
6.2 Fetomaternal haemorrhage 5 1.4 1 0.6 6 0.9
6.3 Antepartum cord complications, eg cord
haemorrhage; true knot with evidence of occlusion
15 4.1 15 2.2
6.4 Uterine abnormalities, eg bicornuate uterus, cervical
incompetence
1 0.7 4 1.1 5 3.0 10 1.5
6.6.4 Alloimmune disease: Alloimmune thrombocytopenia 1 0.7 0 0.0 0 0.0 1 0.1
6.8 Other specific perinatal conditions (includes
iatrogenic conditions such as rupture of membranes
after amniocentesis, termination of pregnancy for
suspected but unconfirmed congenital abnormality)
4 1.1 4 2.4 8 1.2
Specific pernatal conditions
7.1.1
Hypoxic peripartum death
With intrapartum complications: Uterine rupture 1 0.3 1 0.1
7.1.2 With intrapartum complications: Cord prolapse 2 0.5 2 0.3
7.1.3 With intrapartum complications: Shoulder dystocia 1 0.6 1 0.1
7.1.8 With intrapartum complications: Other 2 0.5 4 2.4 6 0.9
7.2 Evidence of non-reassuring fetal status in a normally
grown infant, eg abnormal fetal heart rate, fetal
scalp pH/lactate, fetal pulse oximetry without
intrapartum complications
9 2.5 7 4.2 16 2.4
7.3 No intrapartum complications and no evidence of
non-reassuring fetal status
1 0.6 1 0.1
7.9 Unspecified hypoxic peripartum death 3 0.8 2 1.2 5 0.7
Fetal growth restriction (FGR)
8.1 With evidence of reduced vascular perfusion on
Doppler studies and/or placental histopathology,
eg significant infarction, acute atherosis, maternal
and/or fetal vascular thrombosis or maternal floor
infarction
2 1.4 29 7.9 2 1.2 33 4.9
8.2 With chronic villitis 1 0.3 1 0.1
8.3 No placental pathology 2 0.5 2 0.3
8.4 No examination of placenta 3 0.8 1 0.6 4 0.6
8.8 Other specified placental pathology 4 1.1 4 0.6
8.9 Unspecified or not known whether placenta
examined
1 0.3 1 0.1
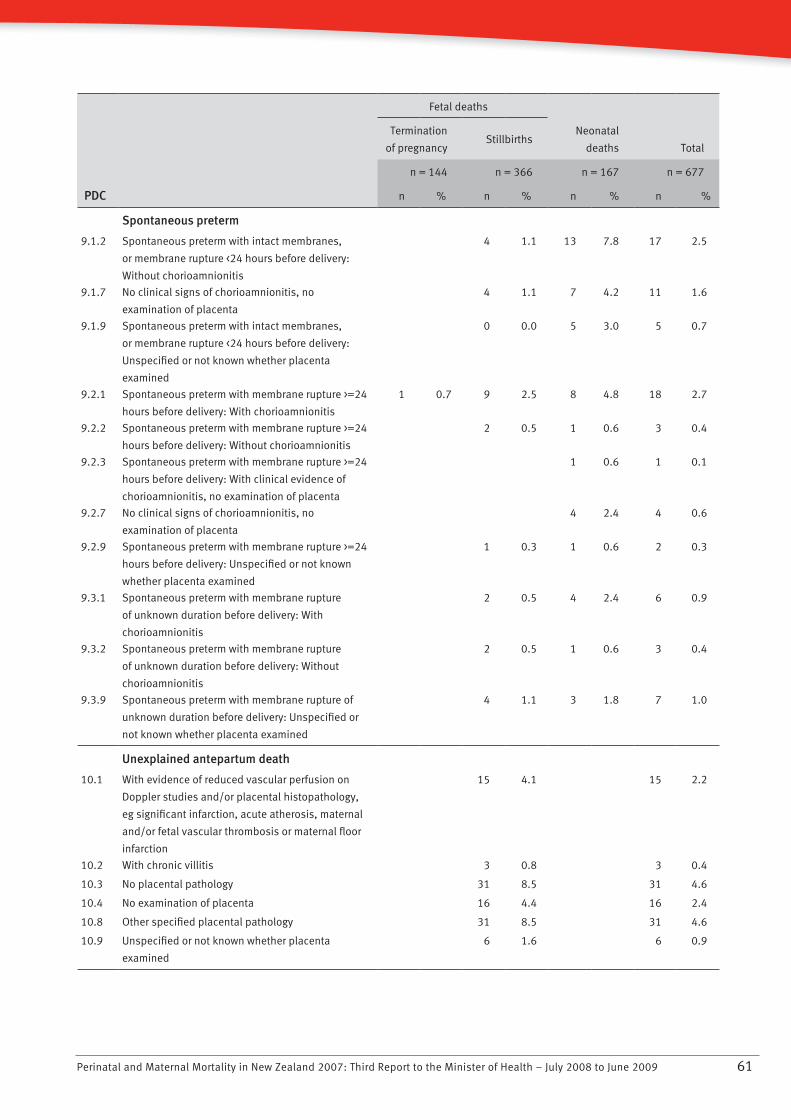
Perinatal and Maternal Mortality in New Zealand 2007: Third Report to the Minister of Health – July 2008 to June 2009 61
PDC
Fetal deaths
Neonatal
deaths Total
Termination
of pregnancyStillbirths
n = 144 n = 366 n = 167 n = 677
n % n % n % n %
Spontaneous preterm
9.1.2 Spontaneous preterm with intact membranes,
or membrane rupture <24 hours before delivery:
Without chorioamnionitis
4 1.1 13 7.8 17 2.5
9.1.7 No clinical signs of chorioamnionitis, no
examination of placenta
4 1.1 7 4.2 11 1.6
9.1.9 Spontaneous preterm with intact membranes,
or membrane rupture <24 hours before delivery:
Unspecified or not known whether placenta
examined
0 0.0 5 3.0 5 0.7
9.2.1 Spontaneous preterm with membrane rupture >=24
hours before delivery: With chorioamnionitis
1 0.7 9 2.5 8 4.8 18 2.7
9.2.2 Spontaneous preterm with membrane rupture >=24
hours before delivery: Without chorioamnionitis
2 0.5 1 0.6 3 0.4
9.2.3 Spontaneous preterm with membrane rupture >=24
hours before delivery: With clinical evidence of
chorioamnionitis, no examination of placenta
1 0.6 1 0.1
9.2.7 No clinical signs of chorioamnionitis, no
examination of placenta
4 2.4 4 0.6
9.2.9 Spontaneous preterm with membrane rupture >=24
hours before delivery: Unspecified or not known
whether placenta examined
1 0.3 1 0.6 2 0.3
9.3.1 Spontaneous preterm with membrane rupture
of unknown duration before delivery: With
chorioamnionitis
2 0.5 4 2.4 6 0.9
9.3.2 Spontaneous preterm with membrane rupture
of unknown duration before delivery: Without
chorioamnionitis
2 0.5 1 0.6 3 0.4
9.3.9 Spontaneous preterm with membrane rupture of
unknown duration before delivery: Unspecified or
not known whether placenta examined
4 1.1 3 1.8 7 1.0
Unexplained antepartum death
10.1 With evidence of reduced vascular perfusion on
Doppler studies and/or placental histopathology,
eg significant infarction, acute atherosis, maternal
and/or fetal vascular thrombosis or maternal floor
infarction
15 4.1 15 2.2
10.2 With chronic villitis 3 0.8 3 0.4
10.3 No placental pathology 31 8.5 31 4.6
10.4 No examination of placenta 16 4.4 16 2.4
10.8 Other specified placental pathology 31 8.5 31 4.6
10.9 Unspecified or not known whether placenta
examined
6 1.6 6 0.9
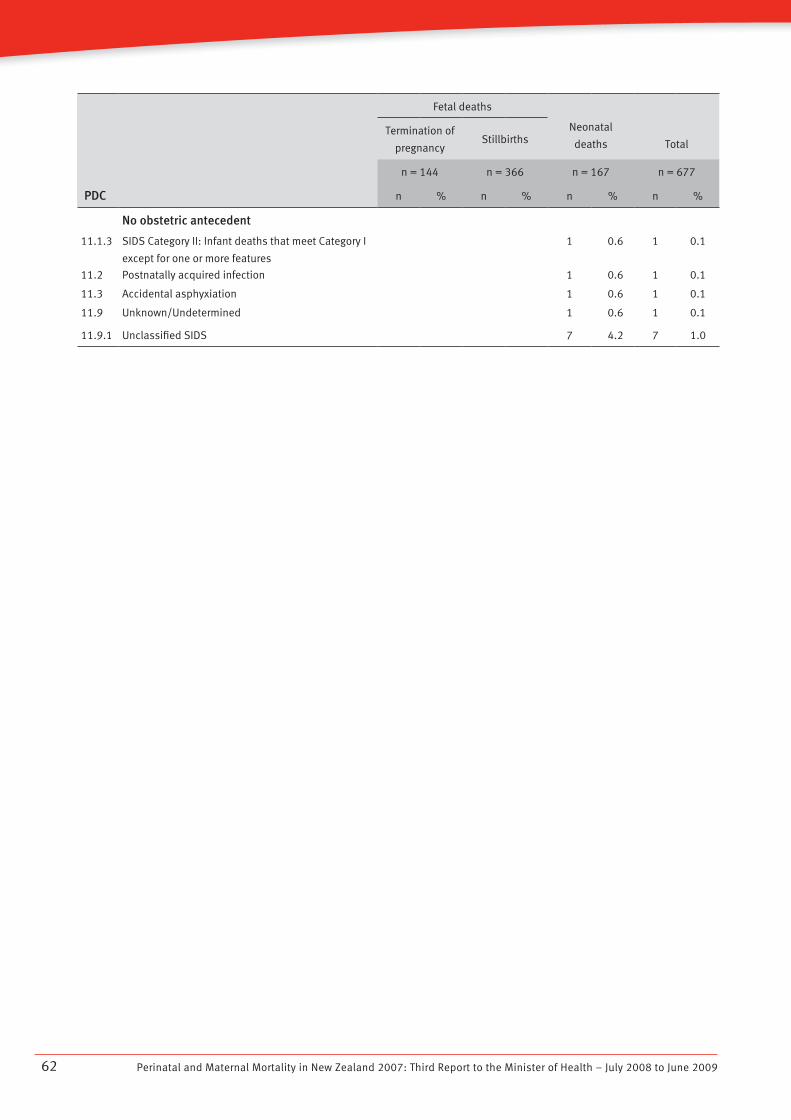
Perinatal and Maternal Mortality in New Zealand 2007: Third Report to the Minister of Health – July 2008 to June 200962
PDC
Fetal deaths
Neonatal
deaths TotalTermination of
pregnancyStillbirths
n = 144 n = 366 n = 167 n = 677
n % n % n % n %
No obstetric antecedent
11.1.3 SIDS Category II: Infant deaths that meet Category I
except for one or more features
1 0.6 1 0.1
11.2 Postnatally acquired infection 1 0.6 1 0.1
11.3 Accidental asphyxiation 1 0.6 1 0.1
11.9 Unknown/Undetermined 1 0.6 1 0.1
11.9.1 Unclassified SIDS 7 4.2 7 1.0
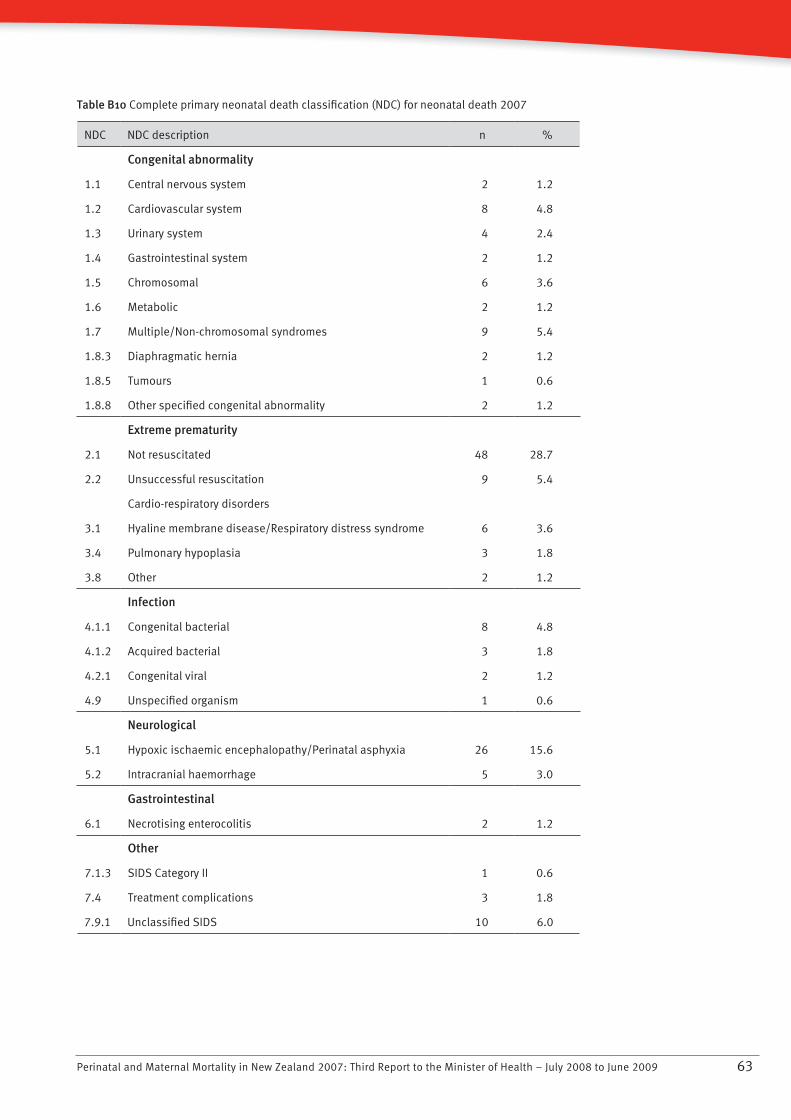
Perinatal and Maternal Mortality in New Zealand 2007: Third Report to the Minister of Health – July 2008 to June 2009 63
Table B10 Complete primary neonatal death classification (NDC) for neonatal death 2007
NDC NDC description n %
Congenital abnormality
1.1 Central nervous system 2 1.2
1.2 Cardiovascular system 8 4.8
1.3 Urinary system 4 2.4
1.4 Gastrointestinal system 2 1.2
1.5 Chromosomal 6 3.6
1.6 Metabolic 2 1.2
1.7 Multiple/Non-chromosomal syndromes 9 5.4
1.8.3 Diaphragmatic hernia 2 1.2
1.8.5 Tumours 1 0.6
1.8.8 Other specified congenital abnormality 2 1.2
Extreme prematurity
2.1 Not resuscitated 48 28.7
2.2 Unsuccessful resuscitation 9 5.4
Cardio-respiratory disorders
3.1 Hyaline membrane disease/Respiratory distress syndrome 6 3.6
3.4 Pulmonary hypoplasia 3 1.8
3.8 Other 2 1.2
Infection
4.1.1 Congenital bacterial 8 4.8
4.1.2 Acquired bacterial 3 1.8
4.2.1 Congenital viral 2 1.2
4.9 Unspecified organism 1 0.6
Neurological
5.1 Hypoxic ischaemic encephalopathy/Perinatal asphyxia 26 15.6
5.2 Intracranial haemorrhage 5 3.0
Gastrointestinal
6.1 Necrotising enterocolitis 2 1.2
Other
7.1.3 SIDS Category II 1 0.6
7.4 Treatment complications 3 1.8
7.9.1 Unclassified SIDS 10 6.0

Perinatal and Maternal Mortality in New Zealand 2007: Third Report to the Minister of Health – July 2008 to June 200964
Appendix C: PMMRC DHB Local Coordinators July 2009
DHB Local coordinator Work role
Northland Yvonne Morgan
Dr Deralie Flower
Chris Cullen
Clinical charge midwife
Obstetrician
Quality/risk facilitator
Waitemata Dr Sue Belgrave
Eleanor Gates
Clinical director of obstetrics
Quality midwife
Auckland Associate Professor
Lesley McCowan
Dr Emma Parry
Obstetrician
Obstetrician
Counties Manukau Dr Sarah Wadsworth
Dr Graham Parry
Dr Nerida Titchiner
Obstetrician
Obstetrician
Obstetrician
Waikato Dr Alastair Haslam
Dr Sarah Waymouth
Dr Phil Weston
Pauline Martyn
Obstetrician
Obstetrician
Paediatrician
Midwife
Bay of Plenty Margret Norris Midwife leader
Lakes Amanda Griffiths Midwife
Tairawhiti Sandra Walsh
Estelle Mulligan
Midwifery educator
Midwife
Taranaki Amanda Hinks Clinical midwife leader
Hawke’s Bay Dr Lynda Croft
Sara Paley
Obstetrician
Midwifery educator
Wanganui Lucy Pettit
Robyn McDougal
Midwife
Midwife
MidCentral Billie Clayton
Dr Ken Clarke
Midwifery educator
Obstetrician
Wairarapa Donna Purvis Team leader midwifery
Capital and Coast Dr Dawn Elder
Dr Rose Elder
Paediatrician
Obstetrician
Hutt Valley Joanne McMullan
Charlotte Smith
Midwife
Midwife
Nelson Marlborough Lois McTaggart
Dr Kevin Hill
Clinical midwife leader
Obstetrician
West Coast Jude Bruce
Mary McGrane
Midwife
Midwife
Canterbury Dianne Leishman
Sonya Matthews
Midwife
Midwife

Perinatal and Maternal Mortality in New Zealand 2007: Third Report to the Minister of Health – July 2008 to June 2009 65
DHB Local coordinator Work role
South Canterbury Dianne Keeman
Dr John Weir
Clinical leader maternity
Obstetrician
Otago Helen Flockton
Dr Alex Teare
Charge midwife
Obstetrician
Southland Jenny Humphries Associate director of nursing and
midwifery, maternal and child
Perinatal and Maternal Mortality in New Zealand 2007: Third Report to the Minister of Health – July 2008 to June 200966
Appendix D: List of Abbreviations
CEMACH . . . .Confidential Enquiry into Maternal and Child Health
DHB . . . . . . . .District Health Board
LMC . . . . . . . .Lead maternity carer
MMRWG .. . .Maternal Mortality Review Working Group
MRI .. . . . . . .Magnetic resonance imaging
NEWG . . . . . .Neonatal Encephalopathy Working Group
NHI .. . . . . . .National Health Index
NZDep . . . . . .New Zealand Deprivation Score
NZHIS .. . . . .New Zealand Health Information Service
PMMRC .. . . .Perinatal and Maternal Mortality Review Committee
PSANZ . . . . . .Perinatal Society of Australia and New Zealand
PSANZ-PDC PSANZ perinatal death classification
PSANZ-NDC PSANZ neonatal death classification
SGA .. . . . . . .Small for gestational age
SUDI . . . . . . .Sudden unexplained death in infancy
Perinatal and Maternal Mortality in New Zealand 2007: Third Report to the Minister of Health – July 2008 to June 2009 67
References
AIHW National Perinatal Statistics Unit. 2008. Australia’s Mothers and Babies 2006. Sydney: Australian Institute of Health and Welfare.
Becher JC, Stenson BJ, Lyon AJ. 2007. Is intrapartum asphyxia preventable? British Journal of Obstetrics and Gynaecology 114: 1442–4.
CCOPMM. 2007. Annual Report for the Year 2006 Incorporating the 45th Survey of Perinatal Deaths in Victoria. Melbourne: Consultative Council on Obstetric and Paediatric Mortality and Morbidity. URL: http://www.health.vic.gov.au/__data/assets/pdf_file/0018/314217/updated_annual_report_2006.pdf 25 August 2009.
Centre for Maternal and Child Health Enquiries. 2007. Perinatal Mortality 2007. London: Centre for Maternal and Child Health Enquiries. URL: http://www.cmace.org.uk/getattachment/1d2c0ebc-d2aa-4131-98ed-56bf8269e529/Perinatal-Mortality-2007.aspx 25 August 2009.
Gestation Network. 2007. Centile calculator. URL: http://www.gestation.net/birthweight_centiles/birthweight_centiles.htm 25 August 2009.
Lewis G (ed). 2007. Saving Mothers’ Lives: Reviewing maternal deaths to make motherhood safer – 2003–2005. The Seventh Report of the Confidential Enquiries into Maternal Deaths in the United Kingdom. London: Confidential Enquiry into Maternal and Child Health.
Mattatall FM, O’Connell CM, Baskett TF. 2005. A review of intrapartum fetal deaths, 1982 to 2002. American Journal of Obstetrics and Gynecology 192:1475–7.
McCowan LME, Dekker GA, Chan E, et al, on behalf of the SCOPE consortium. 2009. Spontaneous preterm birth and small for gestational age infants in women who stop smoking early in pregnancy: prospective cohort study. British Medical Journal 338: b1081.
Ministry of Health. 2002a. Section 88 of the New Zealand Public Health and Disability Act. Wellington: Ministry of Health.
Ministry of Health. 2002b. Family Violence Intervention Guidelines. Wellington: Ministry of Health.
Ministry of Health. 2004. Ethnicity Data Protocols for the Health and Disability Sector. Wellington: Ministry of Health.
Ministry of Health. 2007a. Gestational Diabetes Mellitus in New Zealand: Technical report from the gestational diabetes mellitus technical working party. Wellington: Ministry of Health.
Ministry of Health. 2007b. New Zealand Smoking Cessation Guidelines. Wellington: Ministry of Health.
National Women’s Hospital. 2008. National Women’s Annual Clinical Report 2008. Auckland: National Women’s Hospital. URL: http://www.adhb.govt.nz/NWHealthInfo/new_page_6.htm
New Zealand College of Midwives. 2004. Report on MMPO Midwives: Care activities and outcomes. URL: http://www.mmpo.co.nz/Assets/2004MMPORpt.pdf 25 August 2009.
NZHIS. 2007a. Fetal and Infant Deaths 2003 and 2004. Wellington: Ministry of Health. URL: http://www.nzhis.govt.nz/moh.nsf/pagesns/72/$File/FetalandInfantdeaths0304.pdf 25 August 2009.
NZHIS. 2007b. Report on Maternity 2004: Maternal and newborn information. Wellington: Ministry of Health. URL: http://www.nzhis.govt.nz/moh.nsf/pagesns/73/$File/maternityreport04.pdf 25 August 2009.
NZHIS. 2008. Statistical Information on Hospital-based Maternity Events 2005. Wellington: Ministry of Health. URL: http://www.nzhis.govt.nz/moh.nsf/pagesns/33/$File/Hospital_based_Maternity_2005.pdf 25 August 2009.
Pearson GA (ed). 2008. Why Children Die: A pilot study 2006; England (South West, North East and West Midlands), Wales and Northern Ireland. London: Confidential Enquiry into Maternal and Child Health. URL: http://www.cmace.org.uk/getattachment/72d46ead-b529-466d-b0c3-4794d6a30203/Why-Children-Die--A-pilot-study-%282006%29.aspx 25 August 2009.
Perinatal and Maternal Mortality in New Zealand 2007: Third Report to the Minister of Health – July 2008 to June 200968
PMMRC. 2006. Rapid Reporting Forms and User Guide. Wellington: Perinatal and Maternal Mortality Review Committee. URL: https://secure-www.otago.ac.nz/cymr/PMMRC (secure site) 25 August 2009.
PMMRC. 2007. First Report to the Minister of Health: June 2005 to June 2007. Wellington: Perinatal and Maternal Mortality Review Committee. URL: http://www.pmmrc.health.govt.nz/moh.nsf/pagescm/6734/$File/pmmrc-annual-report-200507.pdf 25 August 2009.
PSANZ 2005. Perinatal Mortality Audit Guideline; Section 7: Perinatal mortality classifications; Appendix 1. URL: http://www.psanzpnmsig.org/doc/Section_7_Version_2.2_April_2009.pdf 25 August 2009.
Salmond C, Crampton P. 2002a. NZDep2001 Index of Deprivation. Wellington: Wellington School of Medicine and Health Sciences.
Salmond C, Crampton P. 2002b. NZDep2001 Index of Deprivation: User manual. Wellington: Wellington School of Medicine and Health Sciences.
Statistics New Zealand. 2007. Births in New Zealand 1991–2007. URL: http://www.stats.govt.nz/store/2008/02/births-and-deaths-dec07qtr-hotp.htm 24 June 2009.
Walsh CA, McMenamin MB, Foley ME, et al. 2008. Trends in Intrapartum Fetal Death, 1979–2003. American Journal of Obstetrics and Gynecology 198: 47.e1–7.