Embed Size (px)
Citation preview

Grand Valley State UniversityScholarWorks@GVSU
Articles University Libraries
4-1-1996
Periodical Price Survey 1996: Projecting theElectronic RevolutionLee Van OrsdelGrand Valley State University, [email protected]
Kathleen BornEBSCO Information Services
Follow this and additional works at: http://scholarworks.gvsu.edu/library_spPart of the Information and Library Science Commons
This Article is brought to you for free and open access by the University Libraries at ScholarWorks@GVSU. It has been accepted for inclusion inArticles by an authorized administrator of ScholarWorks@GVSU. For more information, please contact [email protected].
Recommended CitationVan Orsdel, Lee and Born, Kathleen, "Periodical Price Survey 1996: Projecting the Electronic Revolution" (1996). Articles. Paper 36.http://scholarworks.gvsu.edu/library_sp/36

PERIODICAL PRICE 1996 SURVEY
Projecting the Electronic Revolution
While Budgeting for the Status Quo
By Lee Ketcham & Kathleen Born
AMER1CAN LIBRARIES appear to be on the cusp of a periodical revolution. Traditional practi ces for buying, slOring. and
access ing journals are being challenged by the advent of electronic journals (md e lectronic full -tex.t pe riodical products that are stored remote ly and de livered on demand via the I nternet. The migration 10 fu ll-text electronic products aneVor document delivery services. coupled wi th ongoing programs of hefty cancellmions due to spiraling serials prices and stagnant budgets, is bound to have major impact on the marketplace.
This year's periodical price study looks at these and other trends, including pricing and currency issues, which wiJ I affect the cost of subscriptions in 1997. Three Institute for Scientilic Information (lSI) databases-Arts and Humanities Citation Index, Social Sciences Ci tation [ndex, and Science Citation Index- provide the 4 .957 titles used in the core study. Most of the chans
Lee Ketchum is Director o r Librarie.'i. Uni versity or Montevallo. Alabama. and Kathleen Born is DireclOr. Academic Di vision. EBSeO Subscription Serv ices (ESS). Bimlingham. Alabama. The authors wish to acknowledge Allen Powell, Ch ie r Financial Oflicer. and Laura Ralst in. Communications Coordinator. ESS. for their contri butions to this article
in the article are derived from an analysis of the lS I databases and renect the subscription lists of research libraries. For smaller academic libraries. we have included an analysis of approximately 2000 joumals indexed in EBSCO Publishing's Academic Search. For public and school librmies there is a brief anal ys is of Magazine Article Summaries, a popu lar-periodical index produced by EBSCO Publishing.
Cost history and other information for each of the studies was pulled from EBSCO Subscription Services' database
TABLE 1: AVERAGE 1996 PRICE FOR SCIENTIFIC DISCIPLINES
Avg. Price Title Per ntle
PhySics $ 1,354.80
Chemistry 1,239.26
Astronomy 1,007.22
Math & Computer Science 749.84 ~~~ -
Biology 717.43
Engineering 715.78
Technology 643.58
Geoklgy 627.13
Botany 562.71
Zoology 536.83
Food Science 515.12
General Science 504 .33
Health Sciences 486.35
LIBRARY JOU RNAUA PRl L t5. 1996
of more than 256,000 serials title listiJlgS. For practical reasons, the study was limi ted to prcpriced titles (as opposed to standing-order or bill ~ I ,Her titles) that can be ordered t.hrough a vendor. 1l1e data are current as of February 15, 1996.
New technology, new choices The explosion of access options
made possible by the Imemet is fue ling a whole new round of debate among librarians on how they spend serials do llars. More and more librarjcs are canceling expensive, esoteric. and rarely used journals and redirecting a pottion of the savings to offe r free, direct. on-demand rutiele del ivery service to patrons. The trend towm'd document del.ivery is not ncw, but the growing acceptance for using li brary dollars to buy access is. This move away from purchasing journal subscriptions to purchasing journal anic1es is but one facto r driving the revolutjon in the serials marketplace.
The advent in 1995 of fuUy indexed. e lectronic period ical collections stored on a remote host and delivered over the Lntcrnct promises to shake up Ihe markel even more. WhHe some libraries have aire,tdy begun to cancel duplicate paper subscriptions. others are wailing for the new products to stabi lize and mature before canceling paper copies and runn.ing the ri sk of gaps down the road . But. many expect lhat full-text, Hnd eventually full-image. period ical products will result in a conve-
45

nient, cost-erreclive alternative to paper subscriptions. If (me, there is no doubt that the resulting cancellations will speed the development of new economic models for the buying and sell ing of serial publications.
Electronic journals A thi rd factor on ~le horizon is the
rapid emergence of electronic journals. The Associarion of Research Libraries' (A RL) 1995 Directory of Electronic Journals, Newsletters and Academic Discussion Lists identifies a total of 139 peer-reviewed E-journals. Only 13 of the 139 (9%) charge a subscription fee. The rest are free, a phenomenon that probably renects the experimental nat'Ure of tJ,e medium rather than a trend on the pan of the publishers. At the high
Subject
Agriculture
Anthropology
Art & Architecture
Astronomy
Biology
Botany
Average No. of Titles
1992-96
Average Cost
Per Title 1992
$238.02
11 9.71
90.98
680.69
457.36
351.14
168.08
end of the priced titles is the $4500 Current Opinions in M edicine, from Britain 's Current Science Group, Ltd . The average cost of the 13 priced Ejournals is $754 per year. One of these titles adds a modest "per retrieval" charge, and several olIer stepped prices for additional simultaneous users. Almost a ll of the priced E-journals are in scientiJic or medical fie lds.
Some scholarly publishers are offering the electronic version of their journals to print subscribers at no addjtional cost. Publishers are undoubtedly waitillg to establish new pricing models for E-journals until they see substantial numbers of subscribers moving toward electronic in lieu of print subscriptions. It may be unrealistic to assume that the change to electronic journal formats will
TABLE 2: COST HISTORY BY SUBJECT
save libraries money in the long mn. (l:;"or a broader picture or this issue, see Carol Tenopir & Donald W. King's "Setting tbe Record Straight on Journal Publi shing: Myth vs . Rea lit y," LJ . March 15, p. 32-35.) One publisher estimates the savings at a modest 10%, the discoulll he offers (Q subscribers who want only the electronk version.
The acquisition, storage, and use of electronic joumals raise difficult issues for libraries. An ARL survey in 1994 identified only 35 ARL libraries that had begun to provide access to E-journals. While the more sophisticated libraries struggle with the technical and procedural issues, the rest of the library world waits to see how price. access, and storage questions will be resolved. Few doubt that electronic joumals will be a factor in the coming rev-
Average Cost
Per n tle 1993
% of Change '92-'93
Average Cost
Per Title 1994
% 01 Change '93-'94
Average Cost
Per Title 1995
% 01 Change '94-'95
Average Cost
Per Title ' 996
% 01 Change '95-'96
'92-'96 % 01
Change
$276.38
128.72
97.68
840.31
526.24
41S.n
190.55
$32 1.57 11.54 $3n.5 1
158.16 12,28 173.8 1
17.40
9.90
58.60
45.19
22.S3 104.86 5.37
859.08
608.2S
480.70
12.29
11 .85
12.74
236.54 15.66
111.48 6 .31
1,007.22 17.24 47.97
717.43 17.95 56.86
562.71 17.06 60.25
280.86 18.74 67.10 Business & Economics
Chemistry
'94 37
58
20
223
62
238
'83 87
240
809.53 933.74
16. 12
7.53
7.36
23.45
15.06
18.69
13.37
15.34
16.63
11.18
14.78
13.24
7.54
14.97
15.31
12.26
6.86
8.1 3
13.25
$288.31
140.86
99.52
765.07
543.8 1
426.37
204 .51
949.80
126.98
535.18
401.81
393.94
71.63
289.30
470.21
371.00
74.15
4.32
9.43
' .88 ·8.95
3.34
2.30
7.33
1.72
4.48
8.5 1
3.16
1,045.50 10.08 1.239.26 18.53
152.88 10.31
715.78 21.63
515.12 15.85
53.08
46.70
6 1.35
5 1.80
54.19
Education
Engineering
Food Science
General Science
General Works
Geography
Geology
Health Sciences
History
Language & Ulerature
Law
Library & Information Science ----Math & Computer Science
Military & Naval Sdence
Music
Philosophy & Religion
Physics
Political Science
Psychology
Recreation
Sociology
Technology
Zoology
46
'7 75
75
62
79
1,379
'85
305
9'
104 .21 121.54
443.62
339.34
327.08
6 1.30
235.10
389.48
3 14.58
65. 13
62.94
80.70
493.21
389.50
370.40
65.92
270.29
449.09
353. 16
69.60
68.06
91 .39
69.73
93.86
6.36
8.66
138.59 9.14
588.47 9.96
444.64 10.66
437.83 11.14
75.88 5.93
7.03 325.46 12.50
4.70
5.05
6.54
522.22 11.06
4 13.30 11.40
81.87 10.41
2.45 76.52 9.74
504 .33 15.19
87.82 15.74 43.26
373.52 14.77 58.88
627.13 20.09 61.02
486.35 17.67 54.60 ---- -88.94 8.64 36.56
86.92 13.59 38.10
2.70 101.25 7.87 113.02 11 .62 40.05
6 1 128.81 139.28 8.13 147.78--6.-' 0-- -' -6S-.37- ,1."'90 ---C'8::2OC.'-=3:--:-' O=-.:C' 3:--4",-=.39
' 62 8
42
'36
'8' 55
'30 ' 7
246
'87
' 09
473.21 530.80 - ' -2. 17 - 584.06 - '-0.-03- ---638.54:--::9-::.3-=-3---::7:-:4-=-9.-=84-:--'-=7:-.4-=3--::58=-.-:-46=-
90.75
50.05
77.75
-~-:--- --- -- -- --::---cc-:-:-103.63 14,19 117.13 13.03 136.75 16.75 151.00 10.42 66.39
54.68
88.19
857.15 1.005.03
103.30 118.08
141.64
68. 17
133.98
156.12
7 1.41
146.89
390.73 437.91
348.94 395.92
9.25
13.43
17.25
14.31
10.22
4.75
964
12.07
13.46
54.72
89.23
1,031.59
124.29
171.66
77.25
156.98
0.07
1.1 8
2.64
5.26
9.95
8.18
6.87
484.16 10.56
417.24 5.38
LI BRARY JOURNAUAPRIL 15. 19%
59.47 8.68
99.72 11 .76
62.58 5.23 25.03
42.64 110.90 11 .21 =--:::-=-1, 141.05 to.61 1.354.80 18.73 58.06 - ----~-------
140.58 13.11 162.62 15.68 57.42
192.08 11.90
79.79 3.29
173.91 10.78
538.45 11.21
466. 48 11 .80
217.51 13.24 53.57
89.89 12.66 31.86
198.47 14 .12
643.58 19.52
536.83 15.08
48.13
64.7 1
53.85
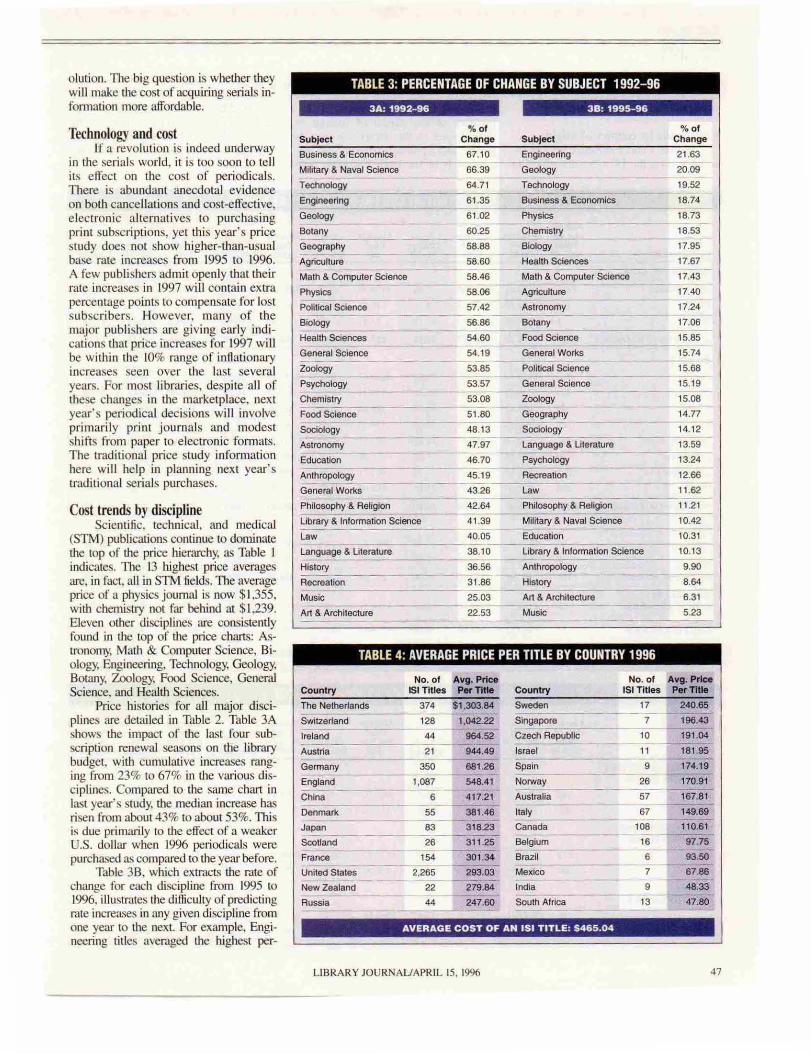
olution. l1,e big question is whether they will make the cost of acquiring serials information more aIfordable.
Technology and cost H a revolution is indeed underway
in the serials world. it is too soon to tell it s elrect on the cost of periodicals. There is abundant anecdotal evidence on both cancellations and cost-efreclive, electronic aJlernatives to purchasing prim subscriptions, yet this year's price swdy does not show higher-than-usual base rate increases from 1995 to 1996. A few publishers admit openly that their rate increases in 1997 wi ll contain extra percentage points to compensate for lost subscri bers. However. many of the major publishers are giv ing early indications that price increases for 1997 will be within the 10% range of inflationary increases secn over the last several years. For most libraries, despile all of these changes in the marketplace. next year's periodical decisions will involve primarily print journals and modest shifts from paper to electronic fonnals. The tTaditionaJ price study infonnation here wi ll help in planning next year's traditional serials purchases.
Cost trends by discipline Scientific. technical. and medical
(STM) publications continue to dominate the top of the price hierarchy. as Table I indicates. l1,e 13 highest price avemges are, in fact~ ali in STM fie lds. The avemge price of a physics journal is now $1,355. with chemistry not far behind al $1,239. Eleven other disciplines are consistently found in the top of the price charts: AslrOllomy, Mmh & Computer Science, Biology. Engineering, Technology, Geology, Botany, Zoology, Food Science, General Science, and Health Sciences.
Price histories for aU major disciplines are detai led in Table 2. Table 3A shows the impact of the last four subscription renewal seasons on !.he library budget, with cumulative increases ranging from 23% to 67% in the various disciplines. Compared to the same chan in last year's study. the median increase has risen from about 43% to about 53%. 111is is due primruily to !.he effect of a weaker U.S. dollar when 1996 peliodicals were purchased as compared to Ihe year before.
Table 3B. which extmcts the mte of ch<mge for each discipline from 1995 to 1996, illustmtes the difficulty of predicting rate increases in any given discipl ine from one year to the next. For example. Engineering titles averaged the highest per-
TABLE 3: PERCENTAGE OF CHANGE BY SUBJECT 1992- 96
3A: 1992-96 38: 1995-96
% 01 Subject Change Subject
Business & Economics 67.10 Engineering ----- - --Military & Naval Science 66.39 Geology - -- ----------------Technology 64 .71,.-_-;T,""ec--,hnol~ __
Engineering ~ ___ 6-:-',...3::5,.--_-:BuSiness & Economics GeOlogy'-________ 61.02 -y~sics
Botany 60.25 Chemistry
% 0' Change
21 .63
20.09
19.52
18.74
18.73
18.53 =-~---------- - -----~_og_ra_p_h_y _ 58.88 _B;_ology ______ _
Agriculture 58.60 Health Sciences -----Math & Computer Science 58.46 Math & Computer Science
17.95
17.67
17.43
Physics 58.06 Agriculture 17.40 ---Political Science 57.42 Astronomy 17.24 -----Biology 56.86 Botany 17.06 Health"'Sci;;-7·.-nce- s--------54:-:-:.6"0---,F""ooct-:c:-;Scie=· -nc".---------:c'5'".8"'5=---'
----General Science 54.19 GeneralWor1(s 15.74 -~-----Zoology 53.85 Political Science , 5.68 Psychology -------;53.57 --G-.n-.-ra-I Sc- ;.- n-c.- ---- 15.19
ChemIstry ----- ---;5"3.-=0::-8 Zoology ---- 15.08 -- -- --- - ----Food Science 51.80 Geography 14.n ---Sociology 48.13 SocIOlog,=,y-;;-,===_. __ '4_._' 2_ Astronomy 47.97 Language & Uterature 13.59 EducatIon ---------:4;:-cS.70---ps-yc-ho- logy----
Anthropology 45.19 Recreation ------ ---- ---- ---General Works
Philosophy & Re:cHc:g;.:on==~ __
Ubrary & Informalion Science
law Language & Uterature
43.26 Law
42.64 Philosophy & Religion
41.39 Military & Naval Science
40.05 Education
38.10 Library & Information ScIence
36.56 Anthropology
31.86 History
History Recrea~tio:::n:-----------;,o~---;-;=C'-'=
13.24
12.66
11 .62
11 .21
10.42
10.31
10.13
9.90
8.64
25.03 Art & Archilecture 6.31
22.53 Music 5.23
Music Art&~A:::rc~h~ite:::c~lu~r.:--------------~~----~:c7:--~~~------------~
TABLE 4: AVERAGE PRICE PER TITLE BY COUNTRY 1996
No. of Avg. Price 151 Tit les Per TItle
No. of Avg. Price Country
The Netherlands 374 $ 1.303.84
Switzerland 128
Ireland 44
Austria
Gennany -------England
China
Denmark
Japan
Scotland
France
United Siaies
New Zealand
Russia
2' 350
' ,087
6 55
83
26
154
2.265
22
44
1.042.22
964.52
944.49
681.26
548.41
417.21
381.46
318.23
311.25
301.34
293.03
279.84
247.60
Country lSI Titles Per TItle
Sweden 17 240.65 S~I~n~-:Cp~o:::r.-------------7 196.43
Czech Republic
Israel
Spain ---
10 191 .04
11 181.95
9 174.19 --------Norway 26 170.91 Australia---- - - 57- ' -67- .8- '-
Italy
Canada
Belgium ----Brazil
Mexico
India
South Africa
67
'08
'6 6
7
9
' 3
149.69
110.61
97.75
93.50
67.86
48.33
47.80
AVERAGE COST OF AN lSI TITLE: $465.04
LIBRARY JOURNAUAPRIL 15, 19% 47

= 1996 centage of increase this past year (almost 22%). In 1995, they were near the bottom of the list, increasing less than ]0%.
Cost trends by country of origin Tables 4 and 5 organize pricing in
formation on the 151 titles according to
country of origin. Country of origin il1-fom1ation is important to a library ' s budgeling process for two reasons: I) as a measure of the impact of foreign exchange rates on the library's purchasing power; and 2) as a measure of the pricing trends of the large European STM
publishers, whose data dominate their various countries of origin on these charts. M,my of the major STM publishers are located in the countries at the lOP of Table 4. which explains the high average cost of publications from those counLries.
TABLE 5: COST HISTORY BY CONTINENT/COUNTRY OF ORIGIN
ContinenVCountry
Average No. of Titles
1992-96
Average Cost '992
Average Cost 1993
" of Change '92-'93
Average Cost '994
" of Change '93-'94
Average Cost 1995
NORTH AMERICA
United States 2252 $ 190.21 5210.85 10.85 $233.99 10.97 $261 .31
Canada ---- ' 06
B
84.89
41 .88
85.87
46.8 1
1.15 95.57 11 .30 100.73 --------Other 11 .79 54.81 17.09 56.83
Average for all N. America 2,366 185.07 204.n '0.64 227.16 10.93
EUROPE -------- ----:-c:::-:::--c:::-. ---- -
France 153 $ 198.49 $226.01 13.86 5230.57 2.02
G_e_rma_n_y ___ ~~~~-=,-=,-=,-=,---'-,3:.:3-:'_---:44::0=",=4B:--=534.29 __ 21._3_0_-~_ - S-'5.3:::'-=.- _ ·_3_.5_5
Ireland 44 600.37 732.67 22.04 696.83 -4 .89 -- ----- --------Itaty 66 134.46 133.55 .Q.68 134.33 0.58
The Netherlands 350 n3.28 950.43 22.91 987.81 3.93 -- -- --- --Switzerland 129 609.12 680.73 11 .76 729.99 7.24 --------- ---United Kingdom 1,081 366.86 392.89 7. 10 426.47 8.55
Other 226 227.00 260.21 14.63 242.08 --6.97
Average for all Europe 2,379 424.22 486.58 14.70 500.50 2.86
ASIA
Japan
Other
--- ------:-:-- ---- ----82 $211 .76 $233.n 10.39 $287.73 23.08
- --- ---:4'=3- -'-:' :::22;:'.:::96:--'-:' '=2B='.ccB6;:-- --:4.ao---'4-0-.37 8.93
253.24
$259.37
570.53
751.95
144.45
1.027.08
845.31
468.61
278.85
550.63
$297.65
149.29
Average for all Asia 125 180.97 197.39 9.08 237.04 20.08 246,25
AUSTRALIA & NEW ZEALAND 79 $139.47 $146.96 5.37 $160.17 8.98 $175.30
SOUTH AMERICA $60.39 $65.92 9. 15 $74.56 13.11 $76.62
AFRICA ' 6 $5B.94 $64.85 10.03 $62.72 -3.29 $66.63
TABLE 6: COST HISTORY BY BROAD SUBJECT
ARTS & HUMANITIES CITATION INDEX
Average No. of Titles
1992-96
Average Cost
Per Title '992
Average Cost
Per Title 1993
-------U.S 540 $55.16 $59.67
Non-U.S.
SOCIAL SCIENCES CITATION INDEX
595 _ '-,0:.5.:.9,-' __ 117.48
- ------ ------
" of Change
B.2
10.9
U.S. 1,5 13 $ 141 .00 $155.06 10.0 ----Non-U.S. 1,536 284.58 322.62
SCIENCE CITATION INDEX
U.S.
Non-U.S.
1.124 $312.46 $347.16
1.761 542.84 625.38
13.4
11 .1
15.2
Average Cost
Per Title % of 1994 Change
$63.70
118.70
$170.87
336.98
$385.89
640.32
6.B
' .0
10.2
4.5
11 .2
2.4
48 LIBRARY JOURNAUAPRIL 15. 1996
Average Cost
Per Title '995
$68.41
131.31
$188.54
370.14
$433.36
706.13
" of Change '94-'95
11 .68
Average Cost 1996
" of Change '95-'96
$293.03 12.14
'92-'96 " of
Change
54.06
5.40 110.61 9.81 30.30 -- ----- -----3.69 61.69 8.54 47.3 1
11 .48 283.98 12.14 53.45
12.49 $301 .34 16.18 51.82 ~.-.--- --- -----
10.72 681.26 19.41 54.66
7.91 964.52 28.27 60.65 -----7.53 149.69 3.63 11 .33
3.98 1,303.84 26.95 68.61
15.80 1,042.22 23.29 7 1.10
9.88 541.54 15.56 47.6 1
15.19 312.08 11.92
10.01 660.93 20.03
3.45 $318.23 6.91
8.48 6.35 161.95
3.89
9,45
2.76
6.25
" of Change
7.4
10.6
264.89
$199.01
$81.51
$70.40
Average Cost
7.57
13.52
6.37
5.65
PerTltle % of 1996 Change
$73.33 7.2
147.97 12.7
10.3 $210.73 11 .8
19.1 9.8 440.68
12.3
10.3
$487.94 12.6
848.84 20.2
37.48
55.80
50.28
31.71
46.38
42.69
34.96
19.45
'92- '96 %of
Change
32.9
39.7
49.5
54.9
56.2
56.4

More than 75% of Ihe major publishers with whom E BSCO does business set their
ARTS AND
TABLE 7: 1997 COST PROJECTIONS BY BROAD SUBJECT
Projected Pr_ No.ot % of 1995 % of % of 1996 Tilles Ust Cost Cost Increase Coat
Projected % of Overall % Cost Increase 1996 subscriplion rates
in U.S . dollars . This means thaI roughJy 90% of expendilures by American libraries for foreign til les in 1996 were priced in U.S. dollars. While this practice simplifies the purchase of European joornals for U.S. libraries, it does make it more difficult to tmck price changes of foreign publica ti ons over a period of years. When looking al Tables
HU ...... mES CITATION INDEX --- -- -
530 51.3 $38,863 34.3 B.O $41,972 34.3 - ------- B.O u.s. Non-U.S. 504 48.7 74,579 65.7 B.O 80,545 65.7
SOCIAL SCIENCES CITAnON INDEX
u.s. 1,471 50.8 $309,981 33.1 10.5 $342,529 33.2 10.2
Non-U.S. 1,423 49.2 627.093 66.9 10.0 689,802 66.B
SCIENCE
1,063
CITAnON INDEX - --c-::-=
U.S. 39.0 - --- -
$518,676 26.9 - - -
11 .0 $575,730 27.0
Non-U.S.
4 and 5. il helps to re-member that Illost Euro-pean publishers have held the line of inoation at around 10% for the last several years. As a rule of thumb, price increases for European journals that are higher or lower than 10% reflect the effect of currency exchange rJ.tes mther than hUe
price increases. The 10% rule holds true, in fact, For most scholarly publishers worldwide.
The foreign-domestic price gap According to the data in Table 6,
where each of the lSI indexes is broken into U.S. and non-U.S. publications, the average foreign title is just about double
- -- 10.6 1.660 61.0 1,409,071 73.1 10.5 1,557,023 73.0
PROJECTED OVERALL INCREASE FOR All lSI TITLES: 10.4%
thecasl oftheavemge U.S. title acrns the board. This is not the eflect of currency Ouctuation, because the comparison has held uue For all seven years for which we have data, despite the ups and downs of the dollar over those same years.
Currency fluctuation nonetheless plays an important role in the cost of joumals 10 U.S. libmries. Chart I traces me percentage change in the average cost of U.S. and non-U .S . subscriptions over a four-year pcriod and the corresponding percenwge change in the exchange rate for a composite of European currencies during the renewal season.
Simply stated, as the exchange rate line dips, the European currencies weaken (i.e., the U.S. dollar strengthens), and U.S. libraries pay less for European publications.
Last year was nol a good one tu buy foreign publications with the U.S. dollar. Between the fall of 1994 and June 1995, when some of the larger European publishers began to set U.S. rates, the do llar weakened by about 90/0--a significant decli.ne. As a result, U.S. libraries saw average price increases of around 20% in 1996 for both Science and Social Science journals.
Periodical Prices for Public and School Libraries
The titles in EBSCO Publishing' s general index. Magazine Article Summaries, are those Illost often
subscribed to by school and public li braries in the United States, based on data from EBSCO Subscription Services. Table 9 provides historical data for approximately 350 tilies in the index. For 1996 the average cost of a U.S. and non-U.S. tilie combined was $41.89. up 7% over the previous year.
The 5.3% increase in the U.S. titles in 1995 may be largely due to the
30% rise in paper costs, TABLE 8: an etrecl that is always
felt more sharply in consumer publishing than in a c ademic pub li s hin g. Next year should be a bet-
1997 COST PROJECTIONS FOR TITLES IN MAGAZINE ARTICLE SUMMARIES
ter one for buyers. Paper costs have stabilized, and advertising rates, which have been slipping in re
Index
Mag. Article Summaries
cent years and driving up subscript ion costs as a consequence. have ruso stabi lized . We forecas t an
Projected Pro)ected No. of 1996 % of 1997 Titles Cost Increase Cost
354 514,796 3.5 $15,314
overa1.1 increase of about 3.5% for popular magazines.
TABLE 9: COST HISTORY FOR TITLES IN MAGAZINE ARTICLE SUMMARIES
Average A _ _
Average Average Average Average No. of Cost Cost Cost Cost Cost '92-'96
Magazine Titles Per TltIe Per Tltle % of Per Trtle %of Per Tltle % of Per Tltle % of % of Article Summaries '92·'96 1992 1993 Change 1994 Change 1995 Change 1996 Change Change
U.S 32B $35.22 $36.84 4.6 $37.85 2.7 $39.11 3.3 $41.18 5.3 16.9
Non-U.S. 22 40.35 38.23 -5.3 42.07 10.0 48.57 15.5 52.41 7.9 29.9 I
LIBRARY JOURNAUAPRIL t5. 1996 49

50
CHART 1: COST & CURRENCY FLUCTUATION BY BROAD SUBJECT
ARTS AND HUMANITIES CITATION INDEX 25 ______ ~---------~--------------~--------~-----20 ______ '- ---- -- ~
; 15 _____ : ________ '_ --- --- - -:-
-10 ___ -'..._---------,=-________ -:':,......-_______ =~ __ _ 1993 1994 1995 1996
Subscriptions Subscriptions Subscriptions Subscriptions
SOCIAL SCIENCE CITATION INDEX 25 ~---o--------~----------~--------~----
20 ____ -'-___________ __
; 15.- -'-------' ----~-
~ 10 ____ .::~~~----.. ~--...... --~~~~~~~~~--~ w
"
o ________ --~~----------------~~-------------
-5
-10 ____ -'-. _____ • ___ -"-_______ • _____ _
1993 1994 1995 Subscriptions Subscriptions Subscriptions
SCIENCE CITATION INDEX
20
1996 Subscriptions
z 15 ---
: 10~-__ ~~~~~~~~~~~~::~~~~::~::::~ • w
-5
-10 =~=__i~~-=-±:_=---~......""..,.-~---.....,""': 1993 1994 1995 1996
Subscriptions Subscriptions Subscriptions Subscriptions
- u.S. -Non-U.S. '------" Exchange Rate
The "exchange rate" line is based on an average 01 five major European currencies: the British pound; Dutch guilder; French franc; Swiss franc; and German mark. Each point
on the exchange rate Hne represents the change in the composite currency's value as compared to the U.S. dollar (i.e .• the change In how many dollars can be bought by a unit 01 the
representative currency from one year to the next).
LIBRARY JOURNAUAPRIL 15. 1996
Arts and Humanities journals, which hislorically show smaller tradi tional base increases, went up an average of 12.7%. Last year we predicted that the average increase for all lSI titles in the study would be 16.4% Because of the continual decl ine of the dollar between February, when the article was written, and June. when prices were set, the actual increase was about a percentage point higher, at 17.6%.
Budgeting for 1997 Most major scholarly publishers
are estimati.ng increases next year in the 9- 11 % range, which is slightly lower than the 10-- 12% range predicted last year. Increases in this range are expected to cover inflation. page increases, cancellations. postage hikes. etc. With a rew exceptions, publisher predictions are within recent nonns for base price increases.
Foreign publishers will be dealing with a major new factor when they set prices for 1997. In 1994 the Universal Postal Union, the agency of the United Nations that establishes reimbursement rates for international postage handling, passed a resolution to increase rates by January 1997. Its meeting will not take place until December 1996. months after most subscription rates are set by publishers, Publishers all over the world will. therefore, have to guess at the effeel of the new rates on their costs, and their estimates may raise prices for 1997 beyond the 10% being projected now.
Currency exchange may not have much of an elfect on the cost of European subscriptions for U.S. libraries in 1997. The dollar ha~ been fairly stable since prices were set for 1996 subscriptions. In fact. it is s lightly stronger. If that trend continue. .... increases should stay at or slightly below the 9- LJ % range overall.
After looking at price history in the broad subject areas, at publisher predictions about base rale increases, and at currency trends. we are forecasting an average increase of 10.4% for the lSI titles in the study. Separate projections are provided in Table 7 for broad subject areas covered in the three indexes: Arts and Humanities. Social Sciences. and Sciences. Projected increases for domestic publications are 8%, 10.5%, and 11 %. respectively. Projected increases for foreign publications are 8%, 10%, and 10.5%, respectively. As always, the carefu l budget manager will adjust these predictions as new information from publi s hers . ve ndors, and economis t s becomes available later in the year. •

Periodical Prices for College and Medium-Sized University Libraries
Tilles in the three 151 indexes that com pri se th e
core of this price s tud y range from widely held , basic academic journals to highly esoteric and
TABLE 10: 1996 COST PROJECTIONS FOR TITLES IN ACADEMIC SEARCH
Academic Search No. of TItles
% 01 Lis'
'995 Cost
u.s _____ '..:,=37"'3,--,80""'.4,- $131 ,128 Non-U.S. 334 19.6 95.273
Projected Projected %of % Of 1996 % of
Cost Cost Increase Cost
57.9
42.1 9-o.0,---_:...$''"'4=2,'=930='-_~58.0 8.5 103,371 42.0
P,*",ed Overall % Increase
8.8
special ized publications, many of which are beyond the budgets and the needs of mid-sized and smaller academic institutions. For this reason, we include an analysis of the titles in EBSCO Publi shing's Academic Search, an indexing and abstracting service for core academic journals.
In Table II , the 1700 titl es in this index are arranged by subject so that
cost trends in a given discipl.ine can be seen. Comparing both average cost per discipline and rate of increase for th is core (jst to the data shown in Table 2, drawn from the comprehensive 151 title list, may be helpful as a planning tool for librarians whose periodical collec tions fall somewhere between these two groups in temlS of comprehensiveness.
As shown in Table 10, only 20% of these core titles are published oUl<ide the United States, but they comprise 42% of the total cost of the list. We estimate that the non-U.S. publications will increase by 8.5% in 1997, whi le domestic publications are projected to go up by 9%. 111e overall averdge increase for the titles in this index will be somewhere in the range of 8.8%.
Subject
Agriculture
Average No. of Titles
1992-96
36
TABLE 11: COST HISTORY FOR TITLES IN ACADEMIC SEARCH
Cost PerTHte
'992
$37.52
Average Cost
Per Title '993
$37.72
A~ A~ A~ Av«a~ % of Cost % 0' Cost % of Cost % of '92-'96
Change Per T1Ue Change Per TItle Change Per TItle Change % of '92-'93 1994 '93-'94 1995 '94-'95 1996 '95-'96 Change
0.53 $38.90 3.13 $40.71 4.65 $42.84 5.23 14.18
Anthropology 25 99.72 103.16 3.45 114.93 11.41 128.26 11.60 147.32 14.86 47.73
Art & Architecture 41 42.40 46.83 10.45 48.12 2.75 51 .06 6.1 1 52.46 2.74 23.73
Astronomy 5 24.36 26.49 8.74 26.39 -0.38 26.38 ..0.04 28.98 9.86 18.97
Biology 26 179.19 200.92 12.13 216.65 7 .83 238.84 10.24 263.77 10.44 47.20 ----Botany 3 101.67 118.33 16.39 121.67 2.82 128.67 5.75 139.33 8.28 37.04
Business & Economics 434 125.93 140.87 11 .86 155.90 10.67 175.30 12.44 202.81 15.69 61 .05
Chemistry
Education
Engineering
Food Science
General Science
General Works
Geog"'Phy
Geology
Health Sciences ~--~
History
language & Uterature ---------
4 821.18 868.54 5.77 928.49 6.90 1,046.81 12.74 1.178.64 12.59 43.53
145 75.64 86.13 13.87 00.77 5.39 98.12 8.10 107.82 9.89 42.54
51 62.SO 65.32 4.51 69.03 5.68 72.70 5.32 80.11 10.19 28.18
33 39.14 40.40 3.22 42.57 5.37 45.46 6.79 SO.57 11 .24 29.20
~--:22:;:- 107.11 113.10 5.59 122.65 8.44 134. 11 9.34 144.62 7.84 35.02
111 32.77 34.23 4.46 35.49 3.68 36.28 2.23 38.34 5.68 17.00 ~~--~ -~~--~~~=---23 69.04 71.SO 3.56 82.31 15.12 85.46 3.83 87.88 2.83 27.29
12 140.35 "' 5::5'"'.300::---,'''0-=.6''5----,'''5::-:9.66 2.81 168.83 5.74 186.24 10.31 32.70 139 102.24 11 0.36 --7=-.:"'94'--"C11'-c5C".86":---'-4.~98C--"C'2'"'3-C.05-'c---6'-.-C2''--'---' 3CC7C".64CC--,":,-C.86"---34'--'c.62 , 52 55.04 -;:;59".33=--~7.~79;:---;6;;;3.~' :-' --'6~.3~7;---c.;6:07."62;;--:07.~'5;C--':':72~.60::;- 7.36 31.90 ---158 47.86 51 .04 6.64 53.59 5.00 57.01 6.38 61 .01 7.02 27.48
--- ---- - -;:-,::--~ ::;---7":::c-- -:-==---:=---:: law 35 85.66 92.67 8.1S 97.56 5.28 106.31 8.97 122.22 14.97 42.68
Ubrary& lnfoScience 55 93.66 101 .25 8.10 104.31 3.02 11 5.93 11 .14 130.19 12.30 39.00
Math & Computer Science 26 , 7Q9=-."C45=-- '''2=7."''5=-2--c'6=-.=5''--"C'34=-.'''2--=-S.--' Sc---'''42.45 -oS-=.2--'--"--58=-.""60~===' "C,:_.--34:..."C:_ -_ -_ -~4"C4.""9"C' -
Military & Naval Science 12 33.38 38.38 14.98 42.58 10.94 45.13 5.99 47.50 5.25 42.30
Music 20 43.52 45.76 5.15 SO.55 10.47 53.03 4.91 56.23 6.03 29.20
Philosophy & Religion 65 56.90 63.96 12.41 65.20 1.94 70.64 8.34 78.4111.00 37.80 -----------~~c--~~~~~~=_--::~~~~--::~c--~~~~
Physics 6 104.67 142.67 36.30 150.33 5.37 158.00 5.10 172.00 8.86 64.33
Political Science 54 65.11 67.14 3.12 73.42 9.35 77.fi1 5.65 86.11 11 .01 32.25
Psychology 54 134.25 145.35 8.27 156.69 7.80 177.91 13.54 194.94 9.57 45.21
Recreation 16 39.SO 43.81 10.91 46.64 6.46 52.08 11.66 53.33 2.40 35.01
Sociology 203 97.52 112.43 15.29 120.36 7.05 131 .04 B.87 145.21 10.81 48.90 Toch~---------- 7-c6---..,8::7'"'.94cc----9=-3--.9=-',----=6--.7::9----'--0--' --.2-cS----:7"'.S::5-----'--O"5--.2--' ----3=-.--aa=---"C' --' SC".33CO---'--2--.. --7-----34=-.56::c-
Zoology 8 96.45 108.78 12.78 123.72 13.73 126.80 2.49 132.20 4.26 37.07
LIBRARY JOURNAlJ APRIL 15. 1996 5 1