Embed Size (px)
Citation preview
PERISHABLE PRODUCTS PERISHABLE PRODUCTS EXPORT CONTROL BOARDEXPORT CONTROL BOARD
2001020010--11 ANNUAL REPORT11 ANNUAL REPORT
Parliamentary Portfolio Committee Parliamentary Portfolio Committee
on Agriculture, Forestry & Fisheries on Agriculture, Forestry & Fisheries
OCTOBER 2011OCTOBER 2011
Presentation OutlinePresentation Outline
− Business Overview
− Enterprise Risks – Top Six
− Performance Highlights
− People and Transformation
− Financial Results
− Concluding remarks
Presentation OutlinePresentation Outline
− Business Overview
− Enterprise Risks: Top Six
− Performance Highlights
− People and Transformation
− Financial Results
− Concluding remarks

Perishable Products ExportControl Board (since 1926)
www.ppecb.com
Official Quality Inspection & Certification Agency in South
Africa
A Partner in Global Competitiveness of South African Perishable Products
Our vision…Our vision…
Our mission…Our mission…
To build competitive capacity in our people & systems in Industries we serve in order to instill world-wide confidence in South African
Perishable Products
Our mission…Our mission…
PPECB ResponsibilityPPECB Responsibility
− Responsible for the Orderly Exports of Perishable Products
− Responsible for Export Quality and FoodSafety Inspection and Certification In South Safety Inspection and Certification In South Africa.
− Inland Phytosanitary Inspections for Non-Cold Treatment Markets
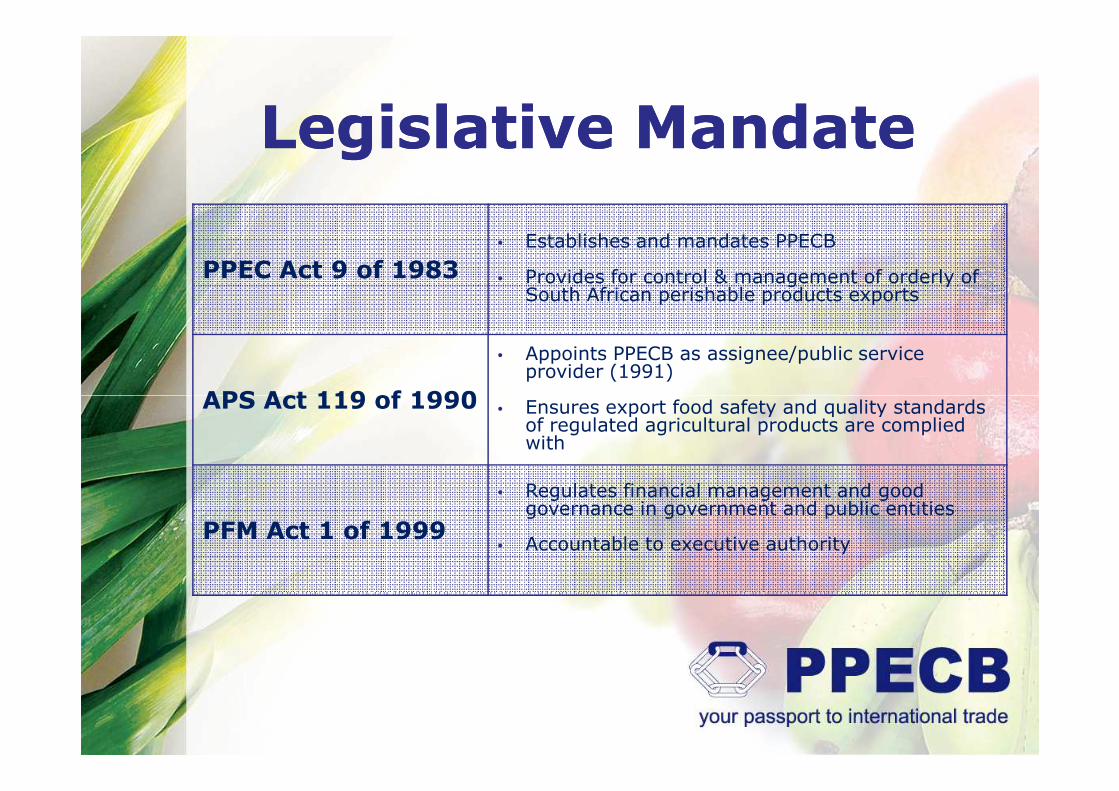
Legislative MandateLegislative Mandate
PPEC Act 9 of 1983
• Establishes and mandates PPECB
• Provides for control & management of orderly of South African perishable products exports
APS Act 119 of 1990
• Appoints PPECB as assignee/public service provider (1991)
Ensures export food safety and quality standards APS Act 119 of 1990 • Ensures export food safety and quality standards of regulated agricultural products are complied with
PFM Act 1 of 1999
• Regulates financial management and good governance in government and public entities
• Accountable to executive authority
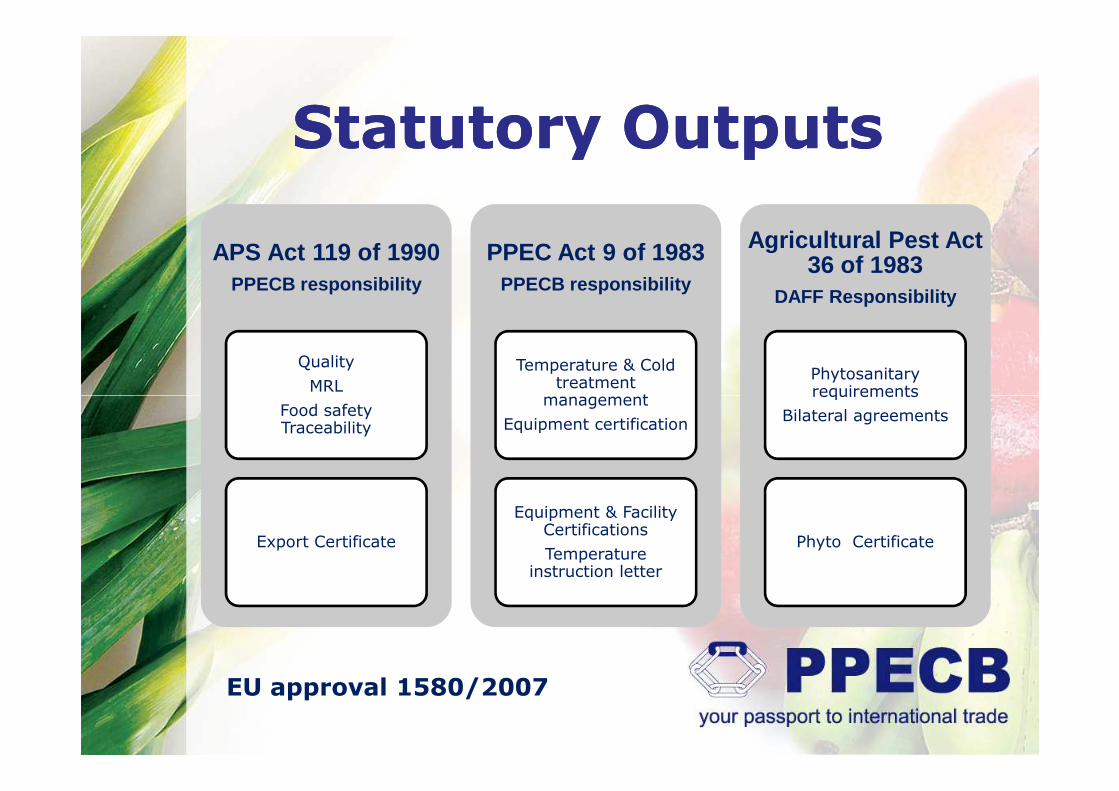
Statutory OutputsStatutory Outputs
APS Act 119 of 1990PPECB responsibility
Quality
MRL
PPEC Act 9 of 1983PPECB responsibility
Temperature & Cold treatment
management
Agricultural Pest Act 36 of 1983
DAFF Responsibility
Phytosanitaryrequirements
Food safety Traceability
Export Certificate
management
Equipment certification
Equipment & Facility Certifications
Temperature instruction letter
requirements
Bilateral agreements
Phyto Certificate
EU approval 1580/2007
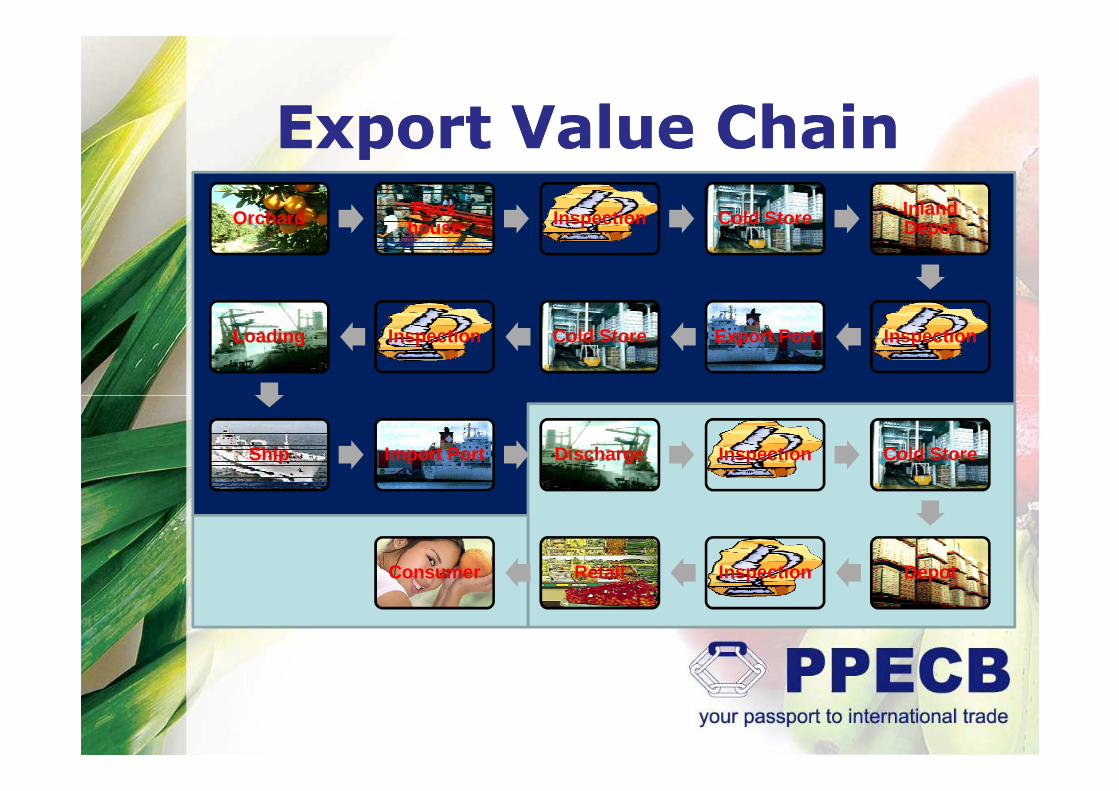
Export Value ChainExport Value Chain
Orchard Pack house Inspection Cold Store Inland
Depot
InspectionExport PortCold StoreInspectionLoading
Ship Import Port Discharge Inspection Cold Store
DepotInspectionRetailConsumer
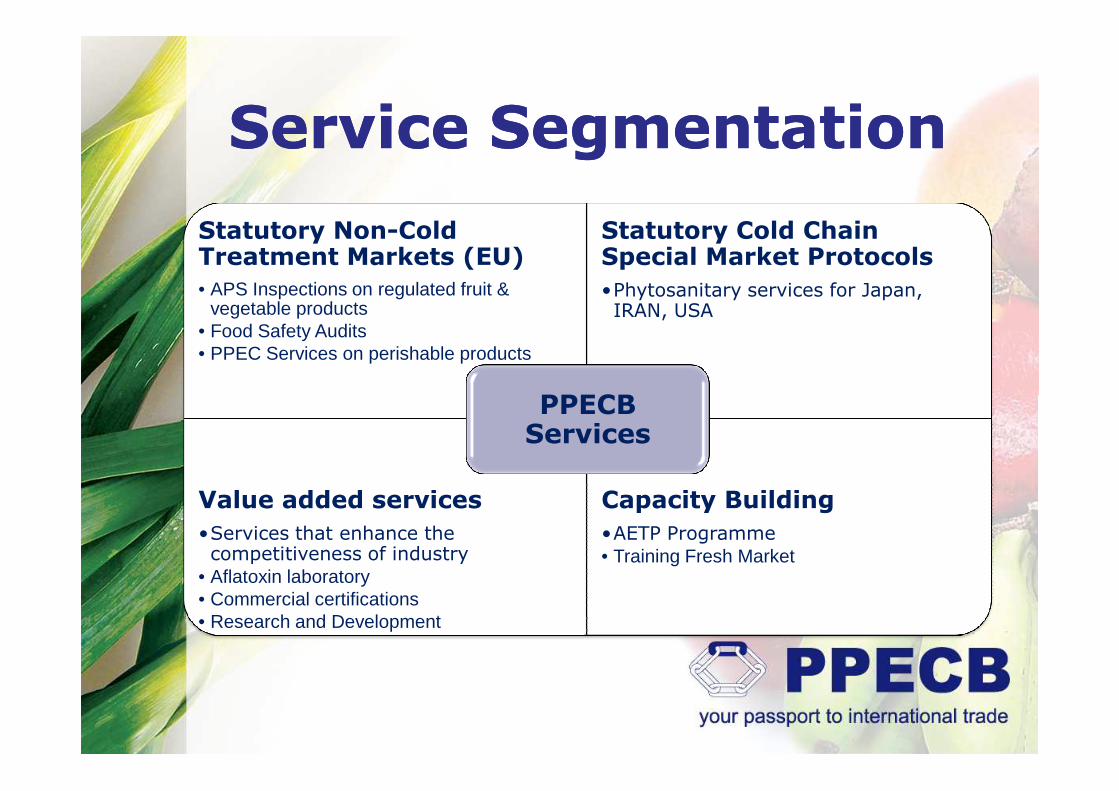
Service SegmentationService Segmentation
Statutory Non-Cold Treatment Markets (EU)
• APS Inspections on regulated fruit & vegetable products
• Food Safety Audits• PPEC Services on perishable products
Statutory Cold Chain Special Market Protocols
•Phytosanitary services for Japan, IRAN, USA
PPECB
Value added services
•Services that enhance the competitiveness of industry
• Aflatoxin laboratory• Commercial certifications• Research and Development
Capacity Building
•AETP Programme
• Training Fresh Market
PPECB Services
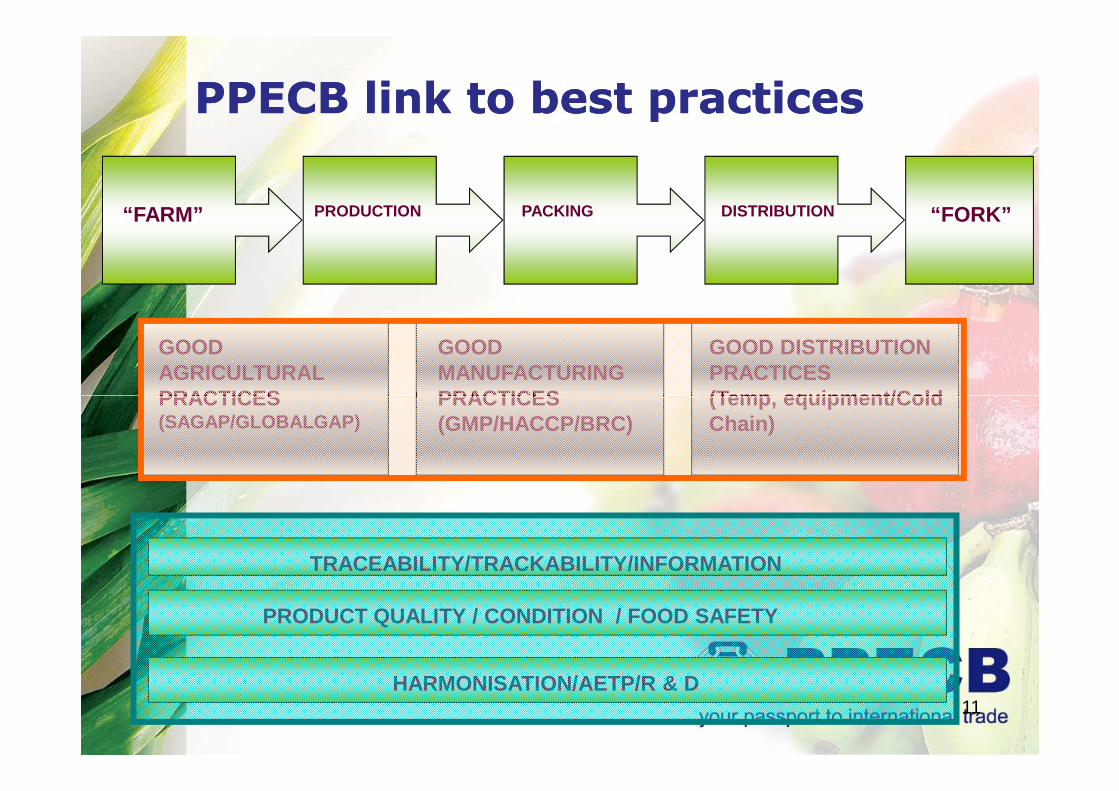
“FORK”“FARM” PRODUCTION PACKING DISTRIBUTION
GOOD AGRICULTURALPRACTICES
GOOD MANUFACTURINGPRACTICES
GOOD DISTRIBUTIONPRACTICES(Temp, equipment/Cold
PPECB link to best PPECB link to best practicespractices
11
PRACTICES(SAGAP/GLOBALGAP)
PRACTICES(GMP/HACCP/BRC)
(Temp, equipment/Cold Chain)
TRACEABILITY/TRACKABILITY/INFORMATION
PRODUCT QUALITY / CONDITION / FOOD SAFETY
HARMONISATION/AETP/R & D
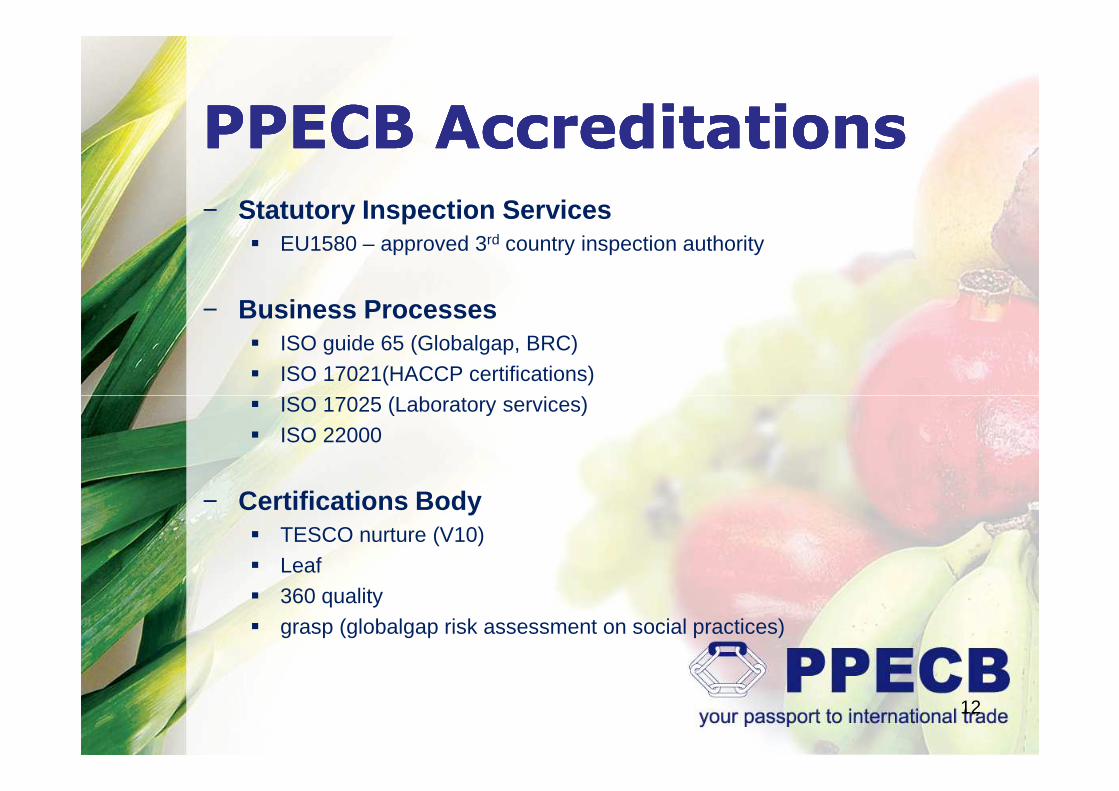
PPECB AccreditationsPPECB AccreditationsPPECB AccreditationsPPECB Accreditations− Statutory Inspection Services
� EU1580 – approved 3rd country inspection authority
− Business Processes� ISO guide 65 (Globalgap, BRC) � ISO 17021(HACCP certifications)� ISO 17025 (Laboratory services)� ISO 17025 (Laboratory services)� ISO 22000
− Certifications Body� TESCO nurture (V10)� Leaf� 360 quality� grasp (globalgap risk assessment on social practices)
12
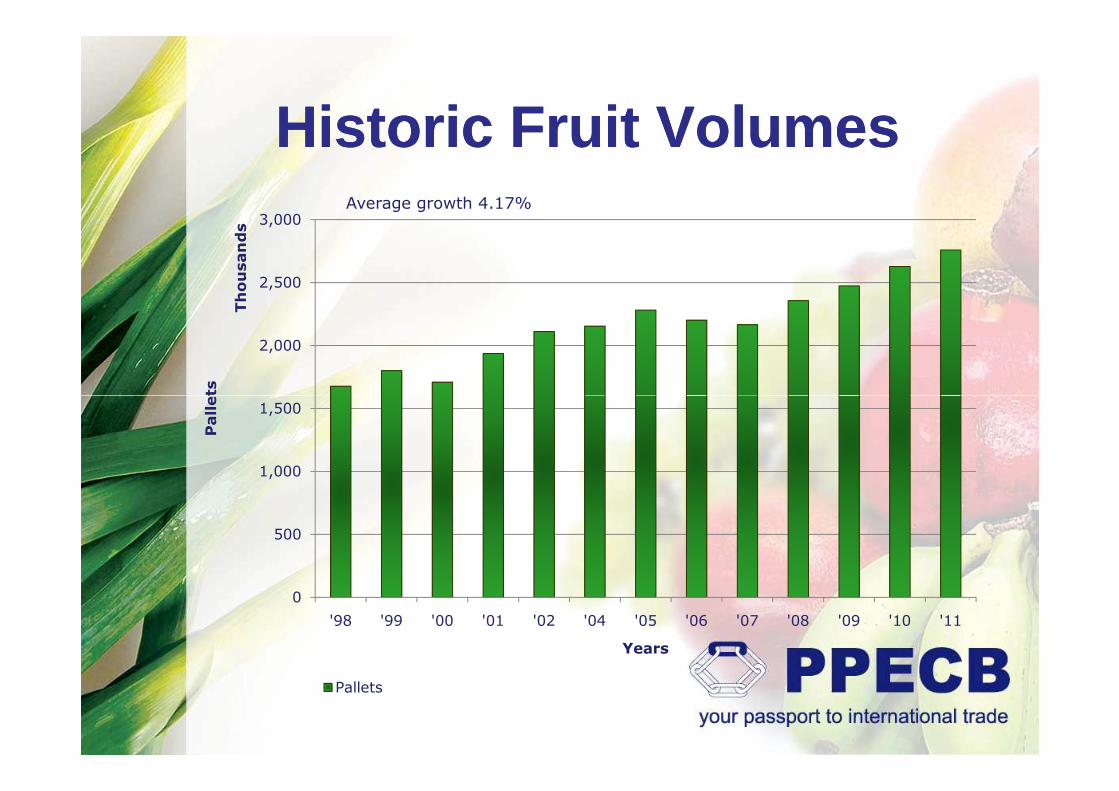
Historic Fruit VolumesHistoric Fruit Volumes
2,000
2,500
3,000Pallets
Thousands
Average growth 4.17%
0
500
1,000
1,500
'98 '99 '00 '01 '02 '04 '05 '06 '07 '08 '09 '10 '11
Pallets
Years
Pallets
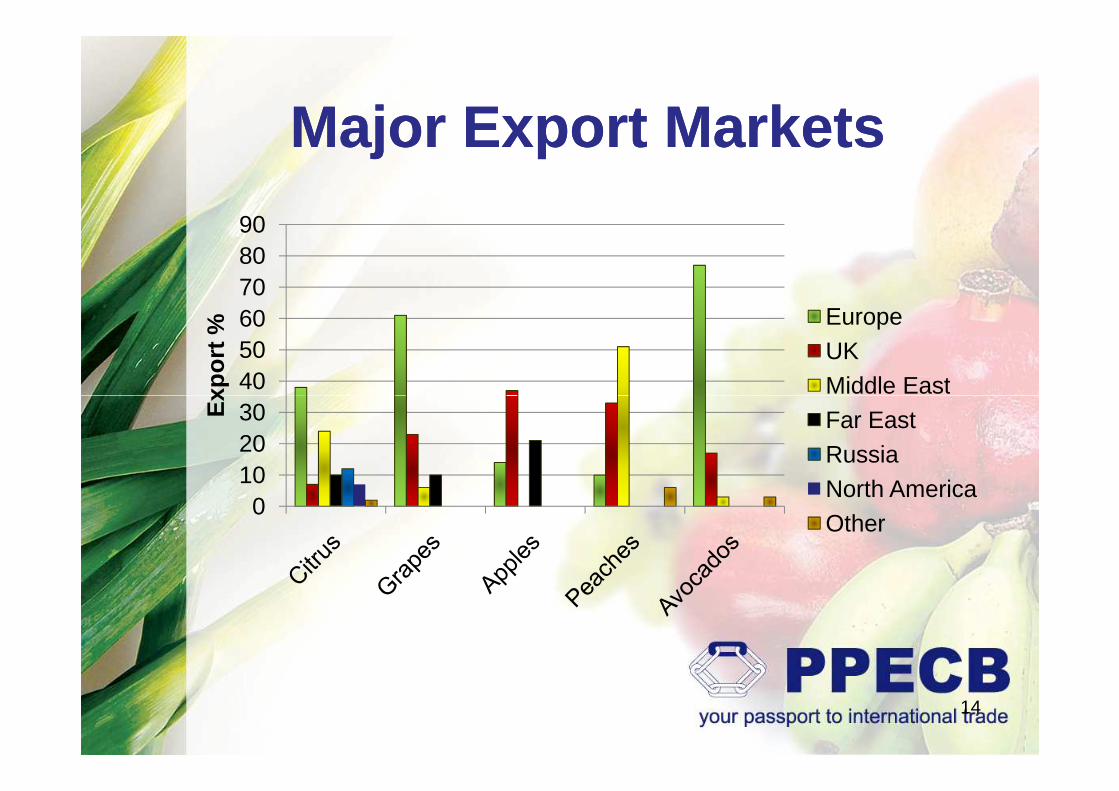
Major Export MarketsMajor Export Markets
405060708090
Exp
ort %
EuropeUKMiddle East
0102030E
xpor
t %
Middle EastFar EastRussiaNorth AmericaOther
14
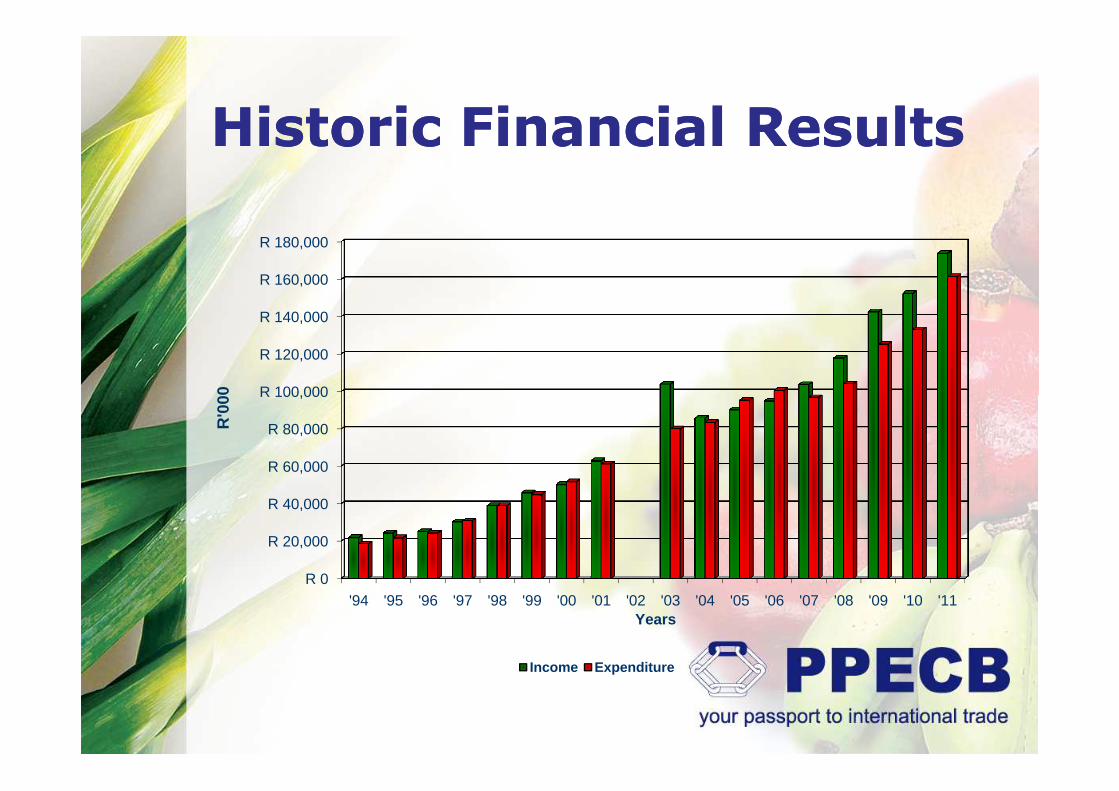
Historic Financial ResultsHistoric Financial Results
R 100,000
R 120,000
R 140,000
R 160,000
R 180,000R
'000
R 0
R 20,000
R 40,000
R 60,000
R 80,000
R 100,000
'94 '95 '96 '97 '98 '99 '00 '01 '02 '03 '04 '05 '06 '07 '08 '09 '10 '11
R'0
00
Years
Income Expenditure

Presentation OutlinePresentation Outline
− Business Overview
− Enterprise Risks: Top Six
− Performance Highlights
− People and Transformation
− Financial Results
− Concluding remarks
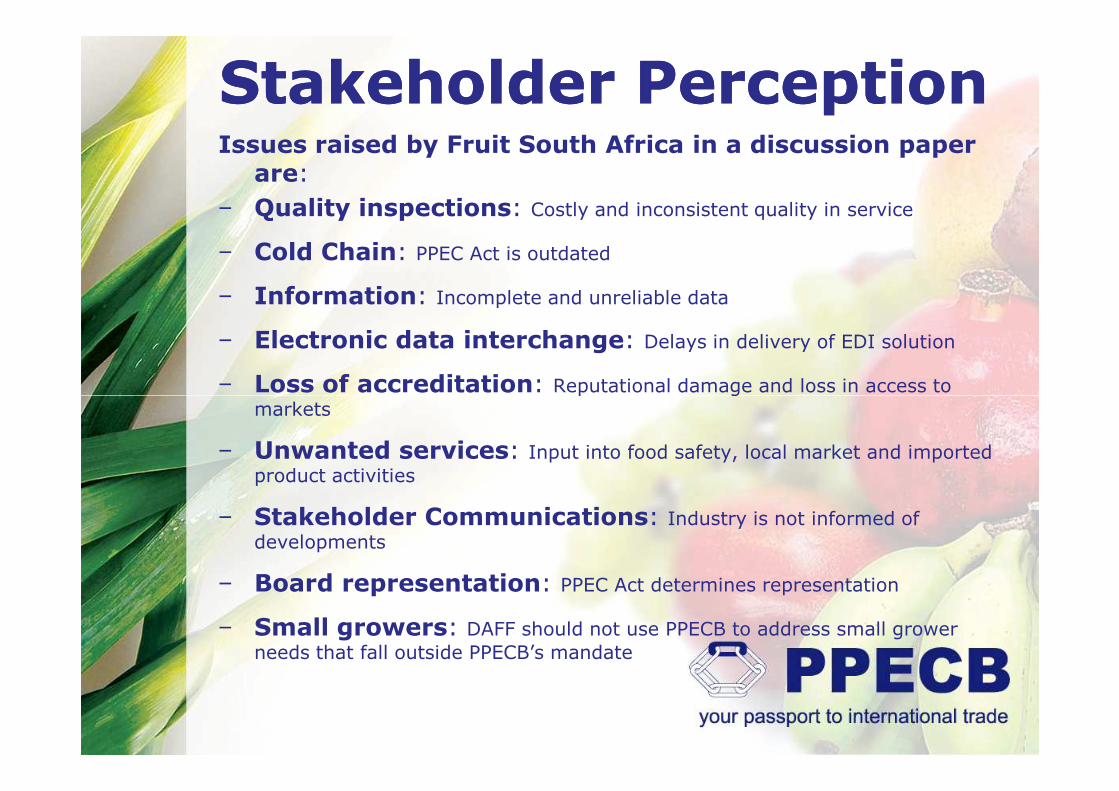
Stakeholder PerceptionStakeholder PerceptionIssues raised by Fruit South Africa in a discussion paper
are:
− Quality inspections: Costly and inconsistent quality in service
− Cold Chain: PPEC Act is outdated
− Information: Incomplete and unreliable data
− Electronic data interchange: Delays in delivery of EDI solution
− Loss of accreditation: Reputational damage and loss in access to − Loss of accreditation: Reputational damage and loss in access to
markets
− Unwanted services: Input into food safety, local market and imported
product activities
− Stakeholder Communications: Industry is not informed of
developments
− Board representation: PPEC Act determines representation
− Small growers: DAFF should not use PPECB to address small grower
needs that fall outside PPECB’s mandate
Enterprise RisksEnterprise Risks
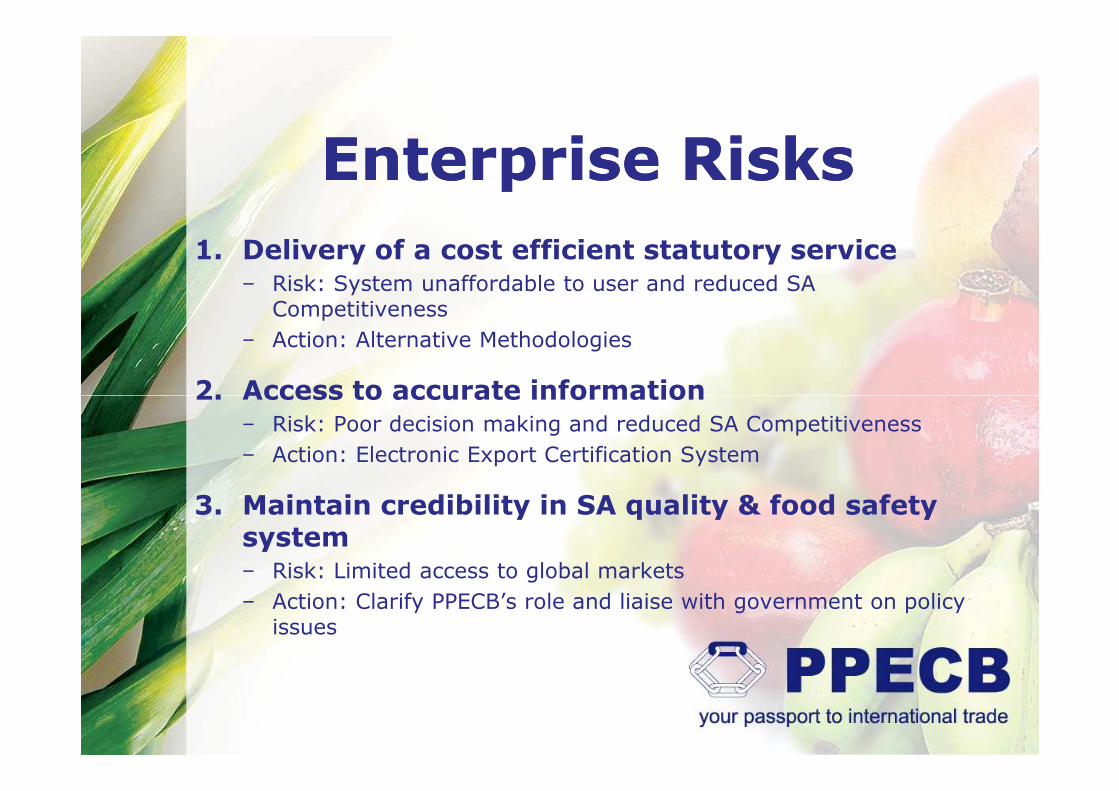
1. Delivery of a cost efficient statutory service− Risk: System unaffordable to user and reduced SA
Competitiveness
− Action: Alternative Methodologies
2. Access to accurate information2. Access to accurate information− Risk: Poor decision making and reduced SA Competitiveness
− Action: Electronic Export Certification System
3. Maintain credibility in SA quality & food safety system− Risk: Limited access to global markets
− Action: Clarify PPECB’s role and liaise with government on policy issues
Enterprise Risks Enterprise Risks (continued)(continued)
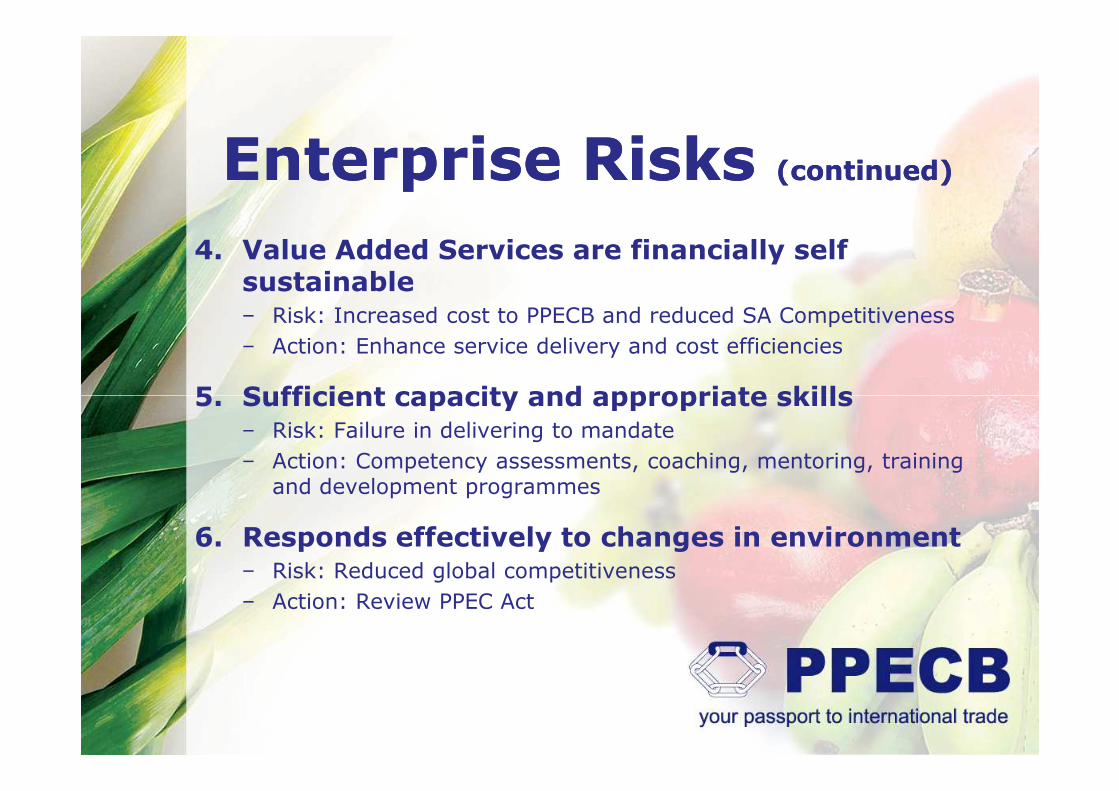
4. Value Added Services are financially self sustainable− Risk: Increased cost to PPECB and reduced SA Competitiveness
− Action: Enhance service delivery and cost efficiencies
5. Sufficient capacity and appropriate skills5. Sufficient capacity and appropriate skills− Risk: Failure in delivering to mandate
− Action: Competency assessments, coaching, mentoring, training and development programmes
6. Responds effectively to changes in environment− Risk: Reduced global competitiveness
− Action: Review PPEC Act
Presentation OutlinePresentation Outline
− Business Overview
− Enterprise Risks: Top Six
− Performance Highlights
− People and Transformation
− Financial Results
− Concluding remarks

Strategic ObjectivesStrategic Objectives
1. Enhancing the credibility of the South African Export Certificate
2. Supporting the export competitiveness of the South African perishable products industries
3. Strengthening PPECB’s capacity as a credible source of information for serving industries and stakeholdersinformation for serving industries and stakeholders
4. Supporting Government in ensuring confidence in the quality assurance and food safety systems for local perishable product markets
5. Supporting Government in building systems to ensure compliance to South African quality and food safety standards for imported perishable products
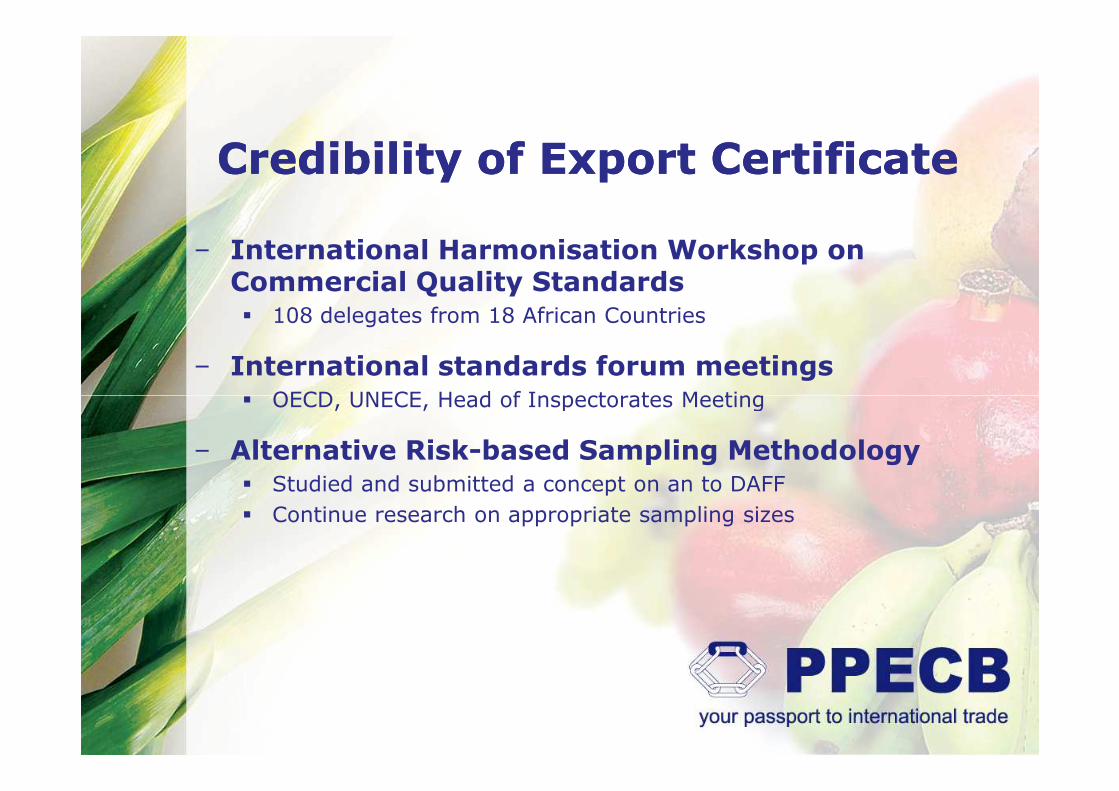
Credibility of Export CertificateCredibility of Export Certificate
− International Harmonisation Workshop on Commercial Quality Standards� 108 delegates from 18 African Countries
− International standards forum meetings� OECD, UNECE, Head of Inspectorates Meeting� OECD, UNECE, Head of Inspectorates Meeting
− Alternative Risk-based Sampling Methodology� Studied and submitted a concept on an to DAFF
� Continue research on appropriate sampling sizes
Credibility of Export CertificateCredibility of Export Certificate
− PPECB Cold Chain� Benchmarked current cold chain protocols
� Continue with alternative container loading and monitoring methodologies
� Continue with implementation of port activity auditing and introduction of consistency measures
− PPECB Laboratory− PPECB Laboratory� Proven reliability in mycotoxin analysis by PPECB Laboratory
� All FAPAS measured results (z scores) between -2 and 2
− Harmonisation Programme� Practical competency evaluations.. 326 with competency ratings
of 80% on majority of products
� Accelerated skills transfer programme.. 82 participants
� Specialists Harmonisation workshops.. 98 sessions
Support Export CompetitivenessSupport Export Competitiveness
− Research and development in Cold Chain� Completed post harvest research trials on temperature storage
for garlic products with article published in an international research journal
� Completed project on cold storage for Leuadendron and Leucospernum
� Developed post harvest and shipping protocols for South African Pomegranate with article published in an international research Pomegranate with article published in an international research journal
� Investigated non-destructive monitoring and prediction of rind quality in citrus
− International good practices� Benchmarked SAGAP against GlobalGap V3
� Discuss with NAMC to revive initiative
Support Export CompetitivenessSupport Export Competitiveness
− Accreditations− Completed validation for Fumonisons in pet food and maize
− Moisture analyser testing methodology reduced lead times from 48 hours to 20 minutes
− Established a PMU for SAPiPII− Limpopo - Technology Transfer.. 40 farmers− Limpopo - Technology Transfer.. 40 farmers
− North West - Responsible Pesticide Usage.. 100 farmers
− Limpopo and Eastern Cape - Product Quality.. 49 participants
− Johannesburg Fresh Produce Market− Internal capacity building.. 17 training interventions
Reliable Source of InformationReliable Source of Information
− Inspection information� Information accuracy 90% in week 1 and
� 98% in week 2
− Export information� Reliance on third party service providers
Implementation of EDI due in December 2011� Implementation of EDI due in December 2011
− Access to information� Created web portal for users to register and extract statistical
information
− Management Information� Completed the design and development of a Tool
� Implementation in November 2011
Presentation OutlinePresentation Outline
− Business Overview
− Enterprise Risks: Top Six
− Performance Highlights
− People and Transformation
− Financial Results
− Concluding remarks
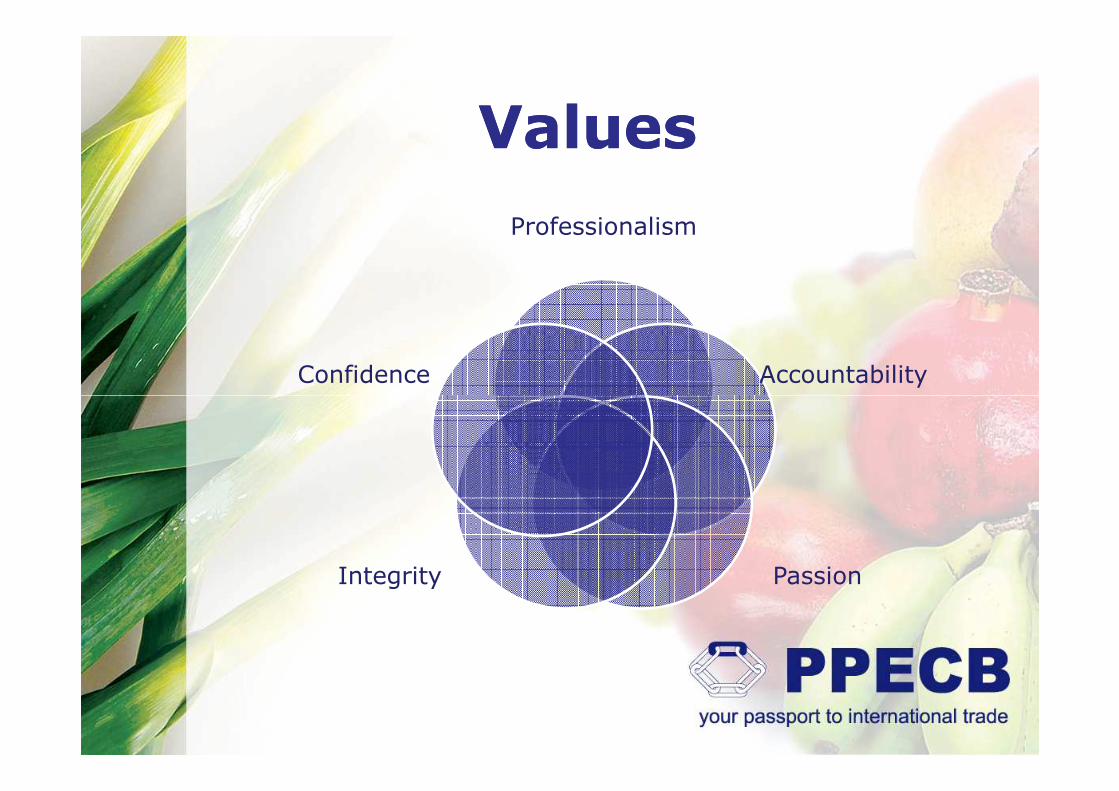
ValuesValues
Professionalism
AccountabilityConfidence
PassionIntegrity
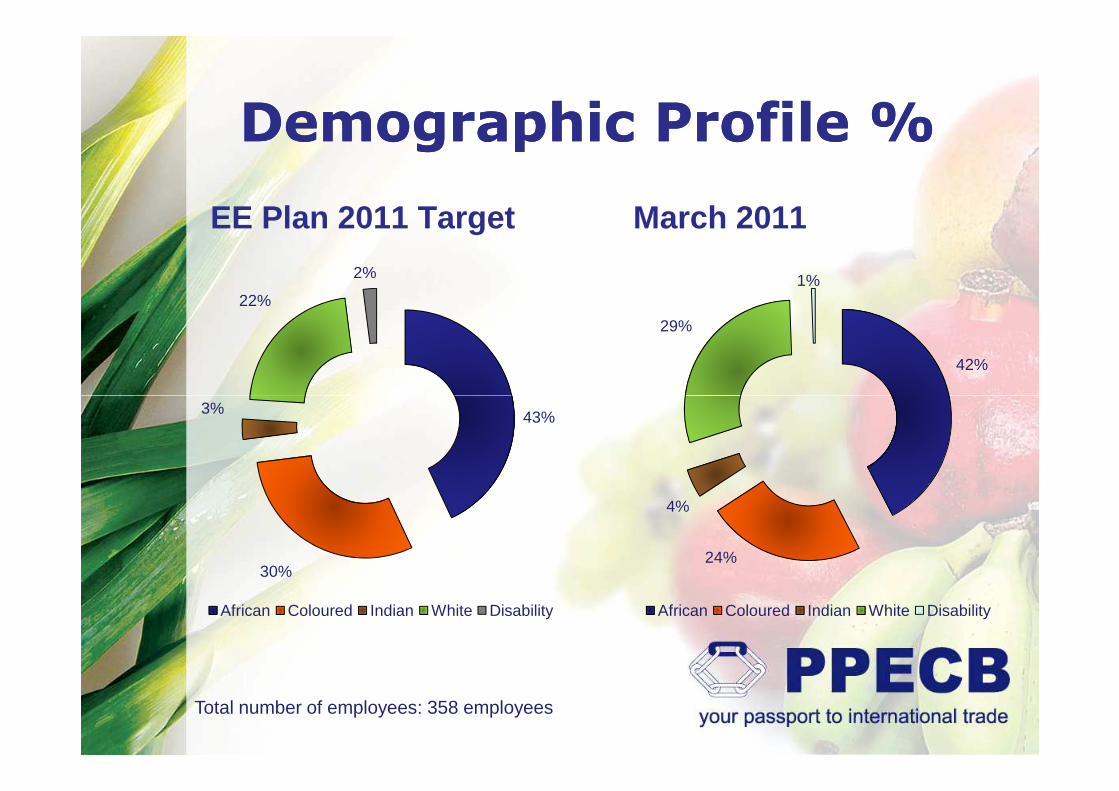
Demographic Profile %Demographic Profile %
March 2011
42%
29%
1%
EE Plan 2011 Target
22%
2%
24%
4%
African Coloured Indian White Disability
Total number of employees: 358 employees
43%
30%
3%
African Coloured Indian White Disability
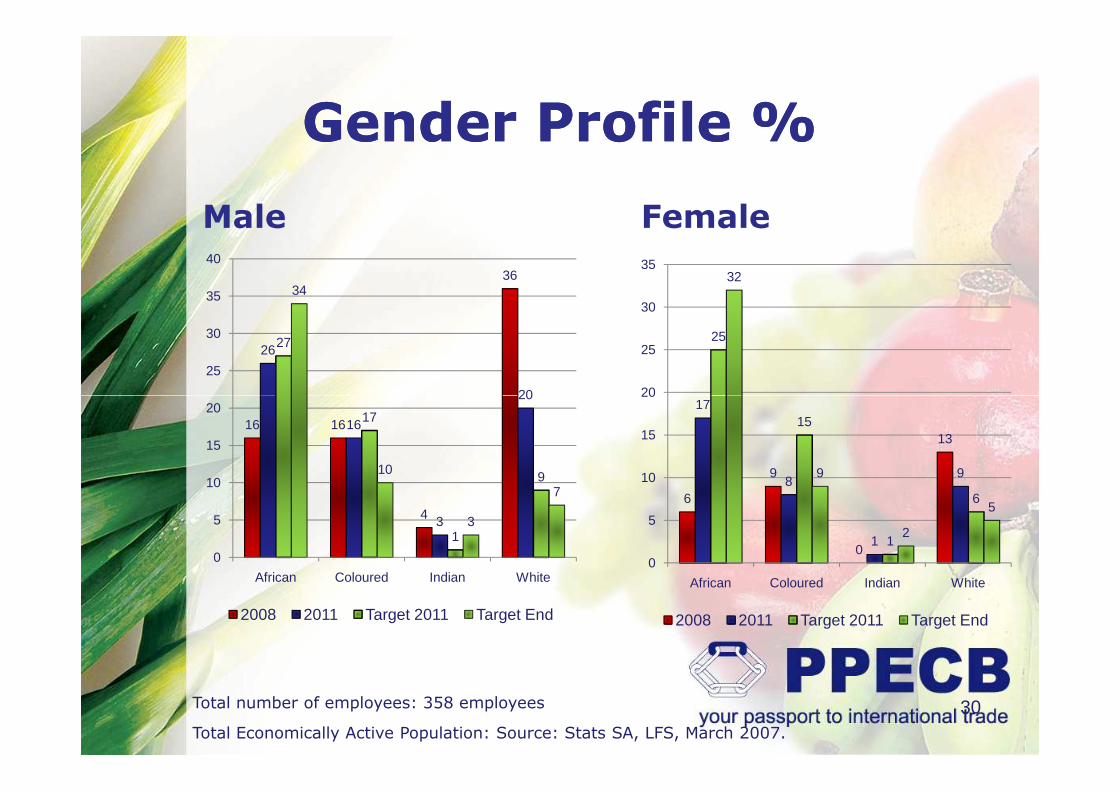
Gender Profile %Gender Profile %
Male
36
26
20
27
34
25
30
35
40
Female
25
32
20
25
30
35
16 16
4
16
3
20
17
1
910
3
7
0
5
10
15
20
African Coloured Indian White
2008 2011 Target 2011 Target End
30
6
9
0
13
17
8
1
9
15
1
6
9
2
5
0
5
10
15
20
African Coloured Indian White
2008 2011 Target 2011 Target End
Total number of employees: 358 employees
Total Economically Active Population: Source: Stats SA, LFS, March 2007.
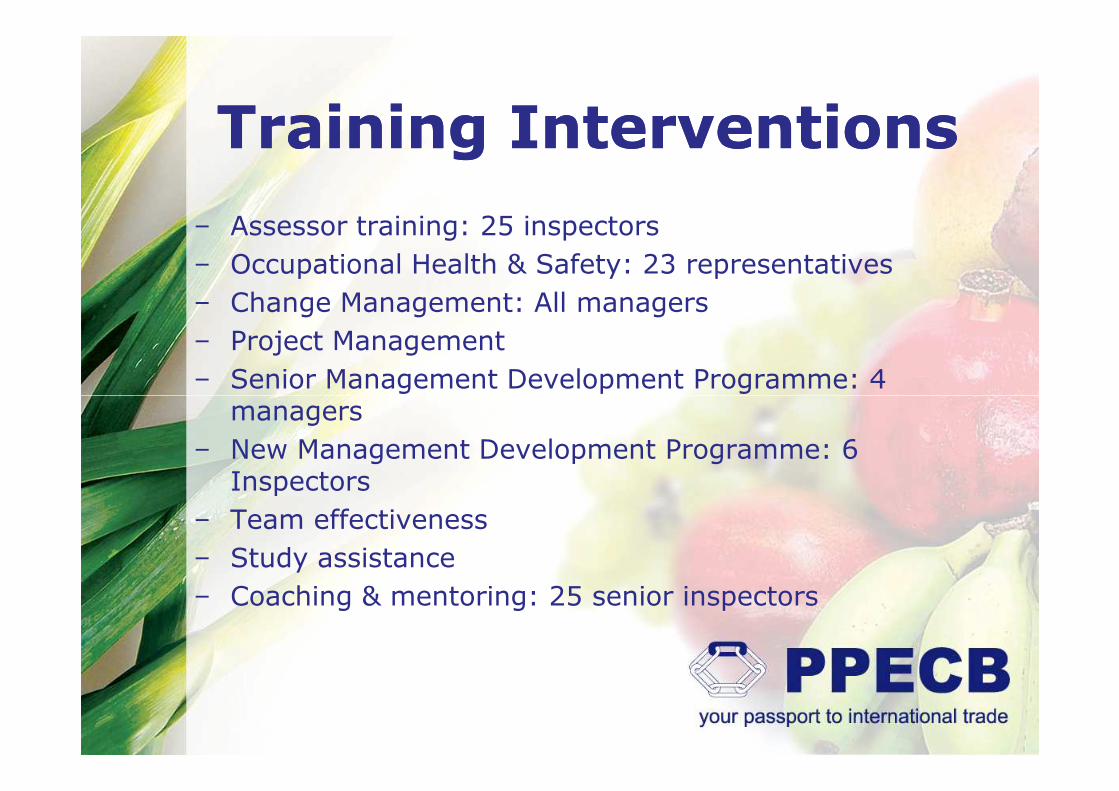
Training InterventionsTraining Interventions
− Assessor training: 25 inspectors
− Occupational Health & Safety: 23 representatives
− Change Management: All managers
− Project Management
− Senior Management Development Programme: 4 managersmanagers
− New Management Development Programme: 6 Inspectors
− Team effectiveness
− Study assistance
− Coaching & mentoring: 25 senior inspectors
DevelopmentDevelopment
− Change management: all managers
− Assessor training: 25 inspectors
− Project Management
− Senior Management Development
Programme
Presentation OutlinePresentation Outline
− Business Overview
− Enterprise Risks: Top Six
− Performance Highlights
− People and Transformation
− Financial Results
− Concluding remarks
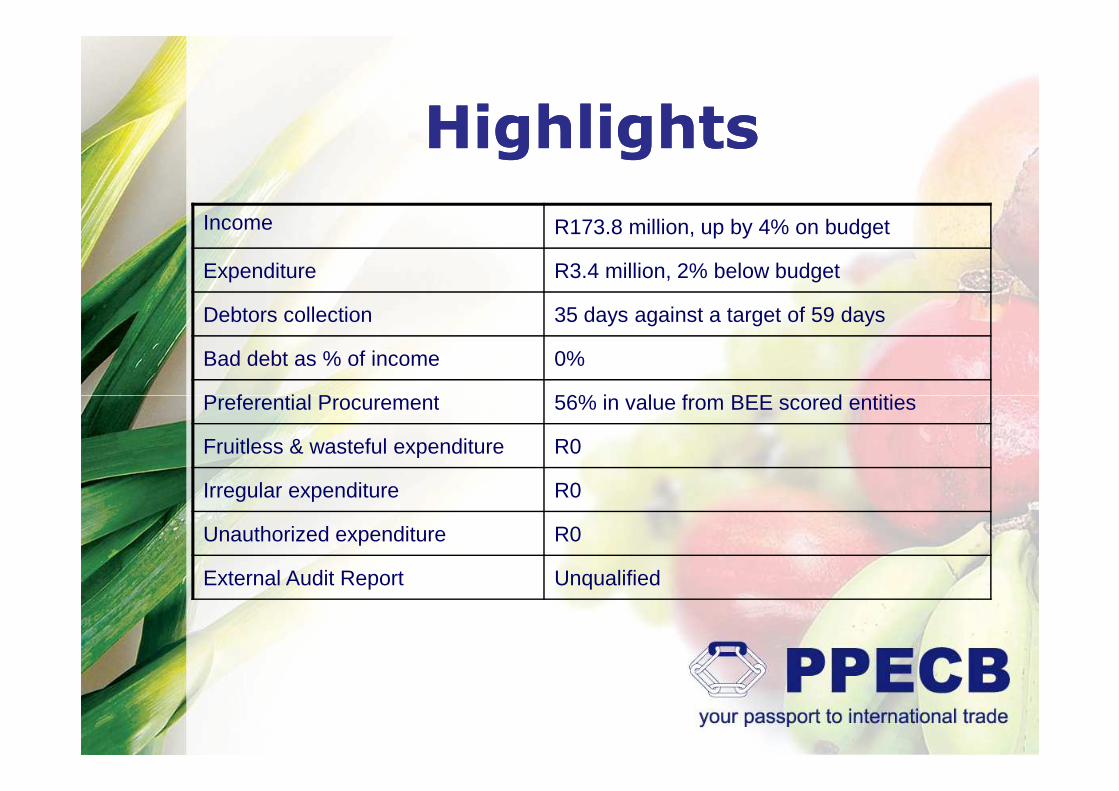
HighlightsHighlights
Income R173.8 million, up by 4% on budget
Expenditure R3.4 million, 2% below budget
Debtors collection 35 days against a target of 59 days
Bad debt as % of income 0%
Preferential Procurement 56% in value from BEE scored entitiesPreferential Procurement 56% in value from BEE scored entities
Fruitless & wasteful expenditure R0
Irregular expenditure R0
Unauthorized expenditure R0
External Audit Report Unqualified
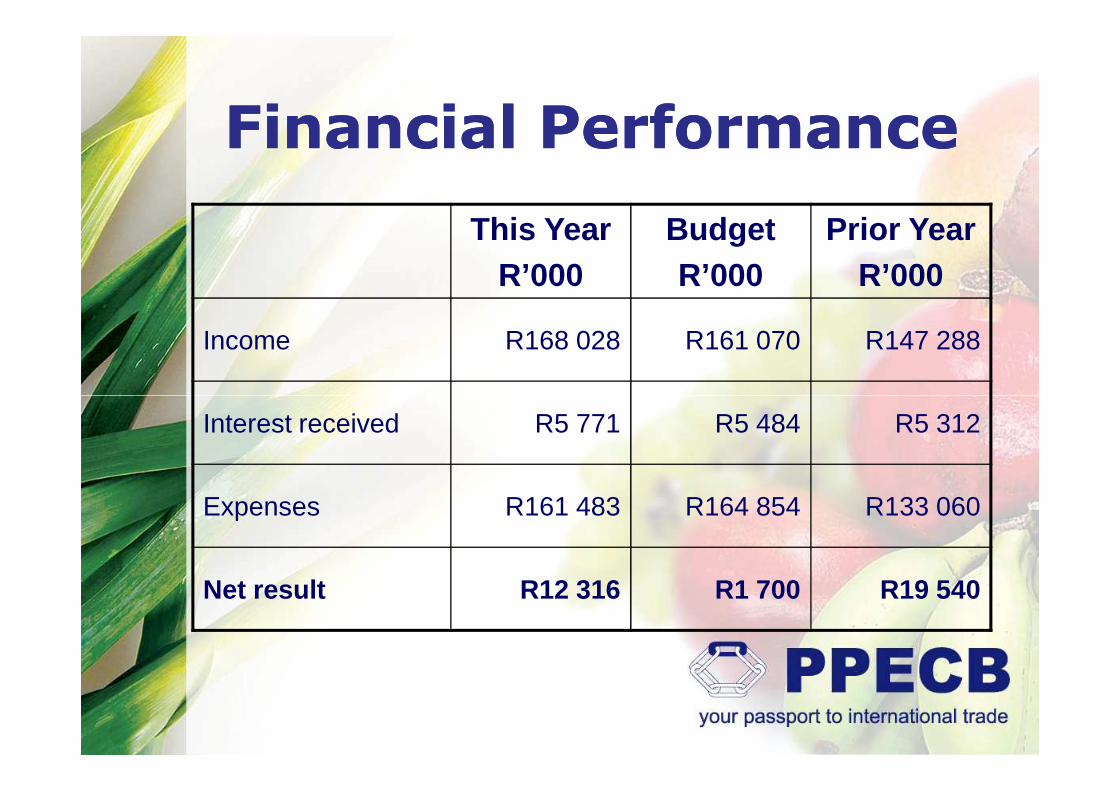
Financial PerformanceFinancial Performance
This YearR’000
BudgetR’000
Prior YearR’000
Income R168 028 R161 070 R147 288
Interest received R5 771 R5 484 R5 312
Expenses R161 483 R164 854 R133 060
Net result R12 316 R1 700 R19 540
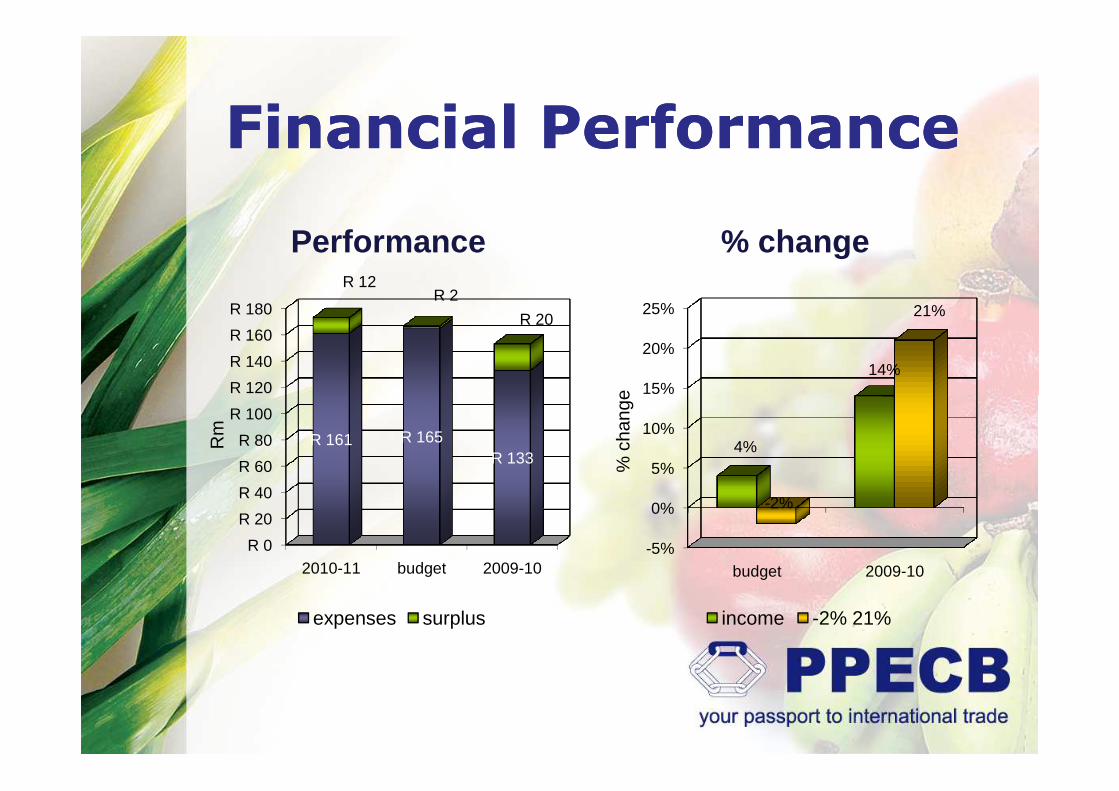
Financial PerformanceFinancial Performance
Performance
R 120
R 140
R 160
R 180
R 12R 2
R 20
% change
15%
20%
25%
14%
21%
% c
hang
e
R 0
R 20
R 40
R 60
R 80
R 100
R 120
2010-11 budget 2009-10
R 161 R 165R 133
Rm
expenses surplus
-5%
0%
5%
10%
15%
budget 2009-10
4%
-2%
% c
hang
eincome -2% 21%
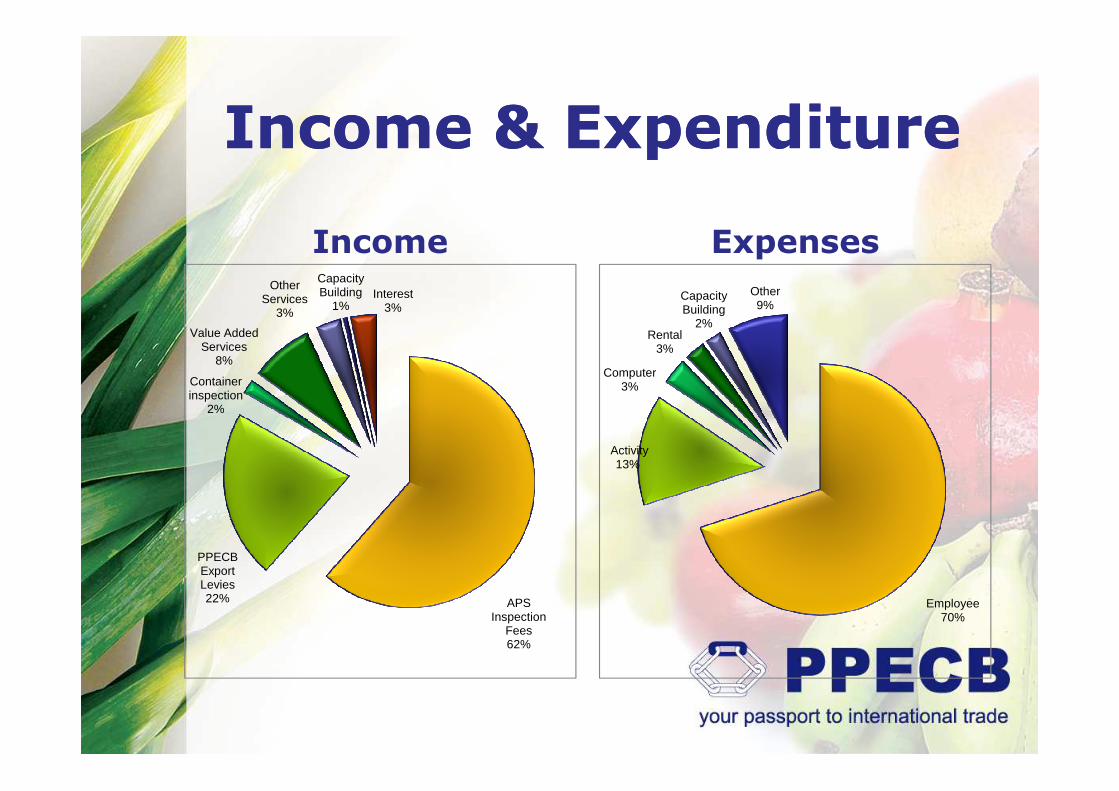
Income & ExpenditureIncome & Expenditure
Income
Container inspection
Value Added Services
8%
Other Services
3%
Capacity Building
1%Interest
3%
Expenses
Computer3%
Rental3%
Capacity Building
2%
Other9%
APS Inspection
Fees62%
PPECB Export Levies22%
inspection2%
Employee70%
Activity13%
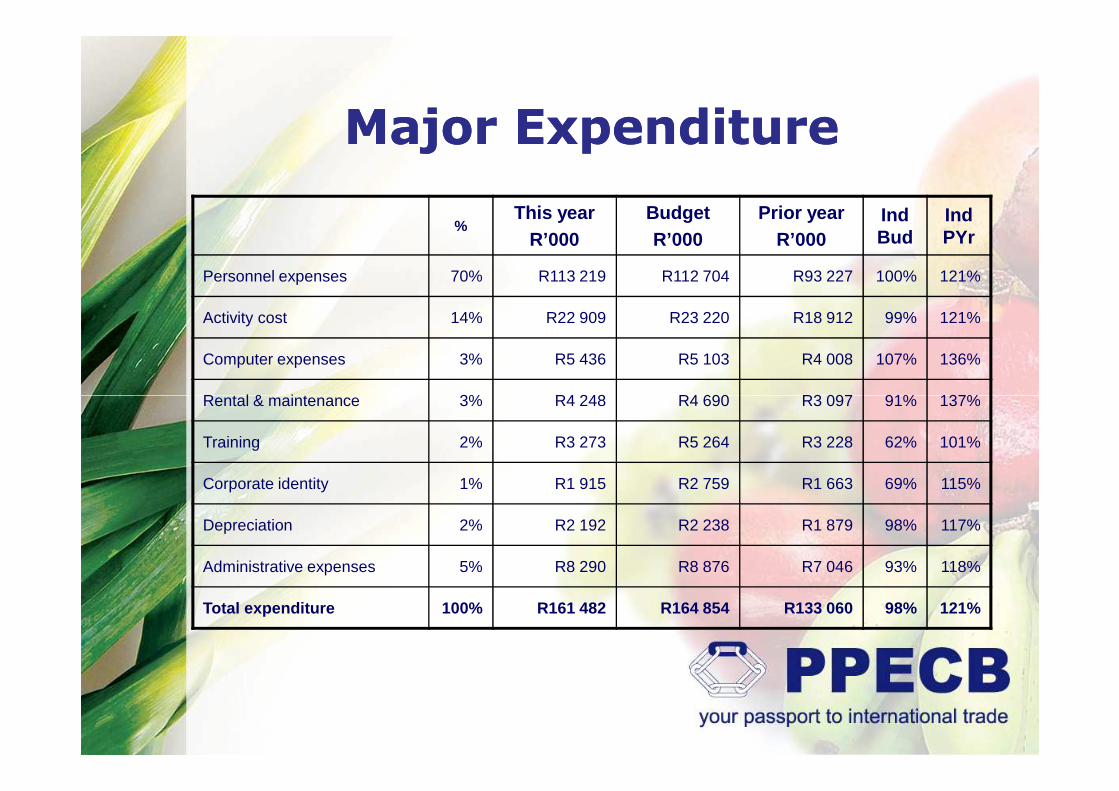
Major ExpenditureMajor Expenditure
%This year
R’000BudgetR’000
Prior yearR’000
IndBud
IndPYr
Personnel expenses 70% R113 219 R112 704 R93 227 100% 121%
Activity cost 14% R22 909 R23 220 R18 912 99% 121%
Computer expenses 3% R5 436 R5 103 R4 008 107% 136%
Rental & maintenance 3% R4 248 R4 690 R3 097 91% 137%Rental & maintenance 3% R4 248 R4 690 R3 097 91% 137%
Training 2% R3 273 R5 264 R3 228 62% 101%
Corporate identity 1% R1 915 R2 759 R1 663 69% 115%
Depreciation 2% R2 192 R2 238 R1 879 98% 117%
Administrative expenses 5% R8 290 R8 876 R7 046 93% 118%
Total expenditure 100% R161 482 R164 854 R133 060 98% 121 %
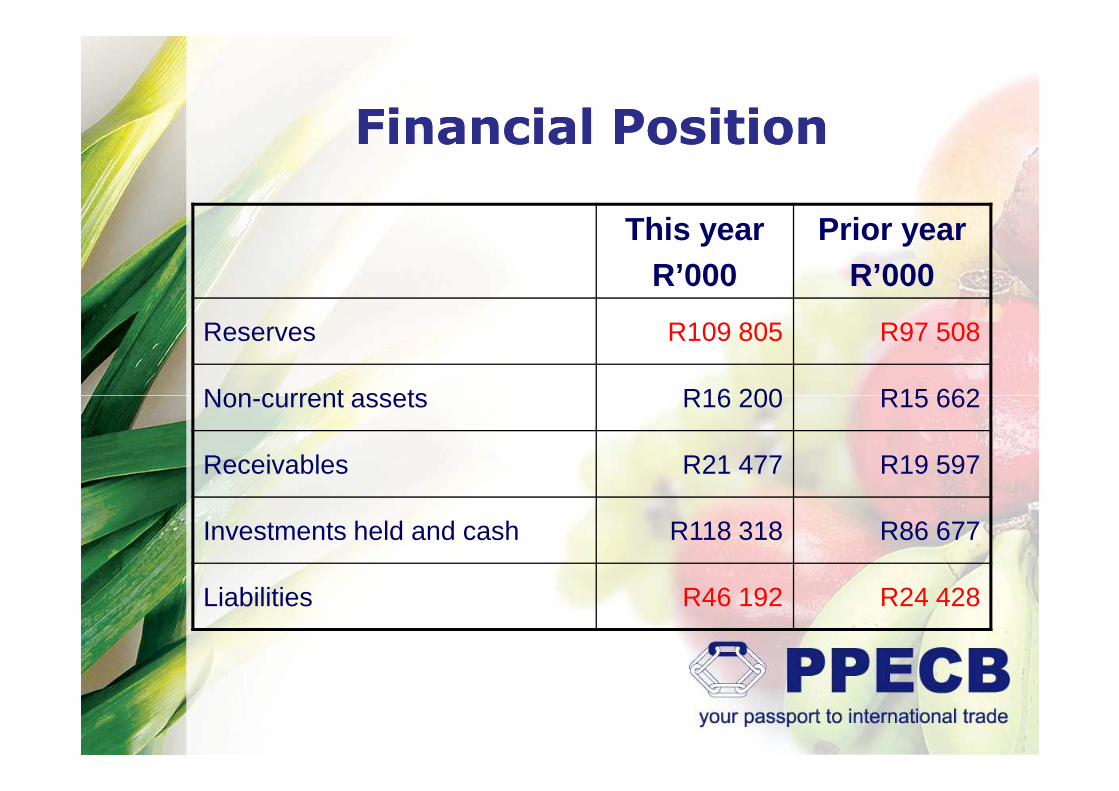
Financial PositionFinancial Position
This yearR’000
Prior yearR’000
Reserves R109 805 R97 508
Non-current assets R16 200 R15 662Non-current assets R16 200 R15 662
Receivables R21 477 R19 597
Investments held and cash R118 318 R86 677
Liabilities R46 192 R24 428
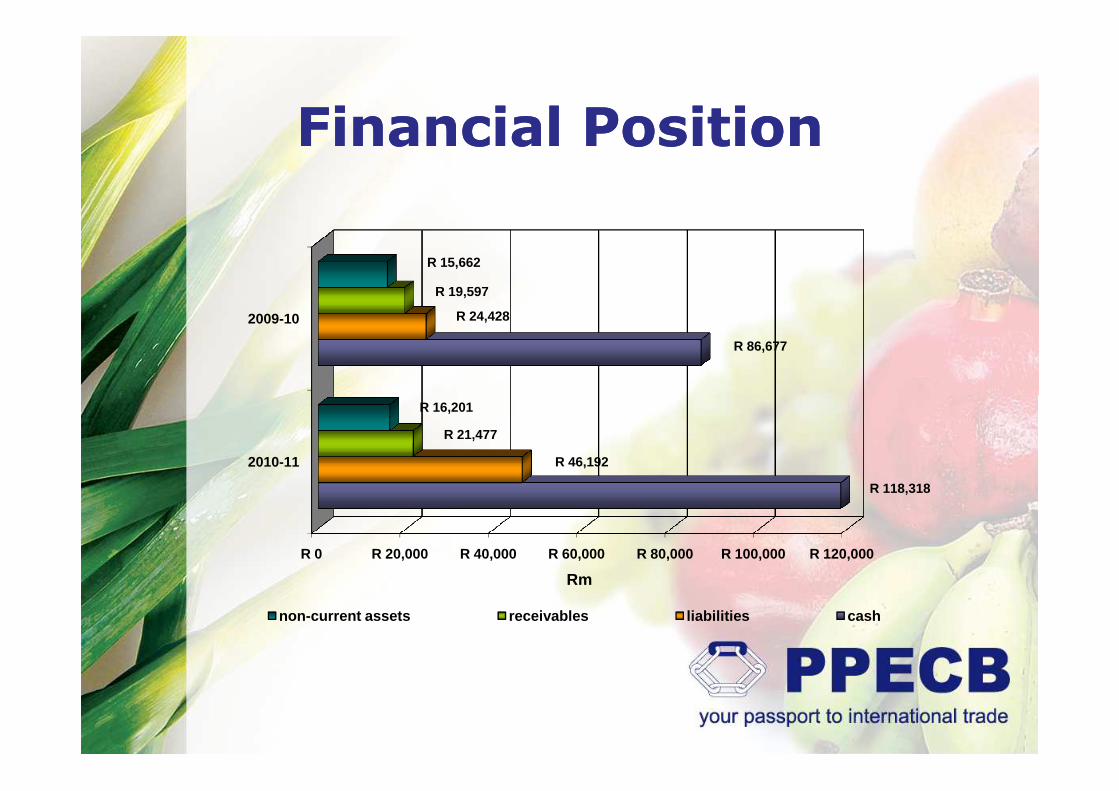
Financial PositionFinancial Position
2009-10
R 86,677
R 24,428
R 19,597
R 15,662
R 0 R 20,000 R 40,000 R 60,000 R 80,000 R 100,000 R 120,000
2010-11
R 118,318
R 46,192
R 21,477
R 16,201
Rm
non-current assets receivables liabilities cash
Presentation OutlinePresentation Outline
− Business Overview
− Enterprise Risks: Top Six
− Performance Highlights
− People and Transformation
− Financial Results
− Concluding remarks
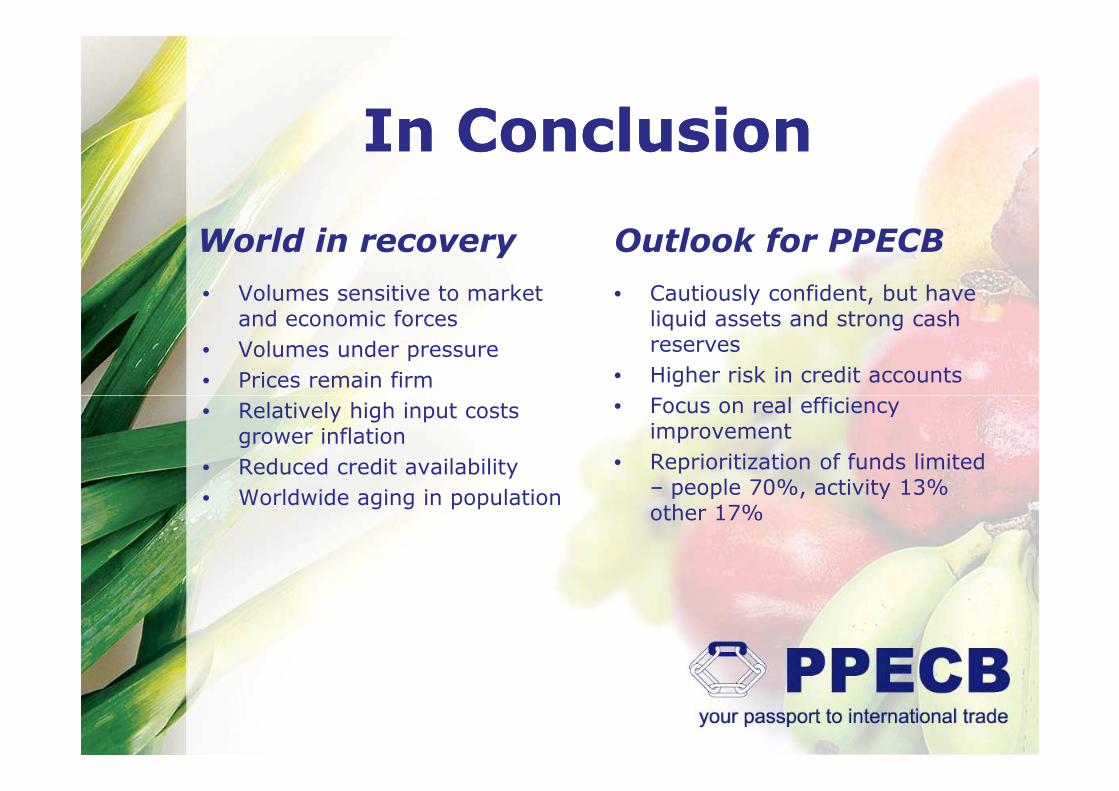
In ConclusionIn Conclusion
World in recovery
• Volumes sensitive to market and economic forces
• Volumes under pressure
• Prices remain firm
Outlook for PPECB
• Cautiously confident, but have liquid assets and strong cash reserves
• Higher risk in credit accounts
• Focus on real efficiency • Relatively high input costs grower inflation
• Reduced credit availability
• Worldwide aging in population
• Focus on real efficiency improvement
• Reprioritization of funds limited – people 70%, activity 13% other 17%

Thank YouThank You
Creating WorldCreating World--Wide Confidence in Wide Confidence in South African Perishable Export South African Perishable Export
ProductsProducts