Embed Size (px)
Citation preview
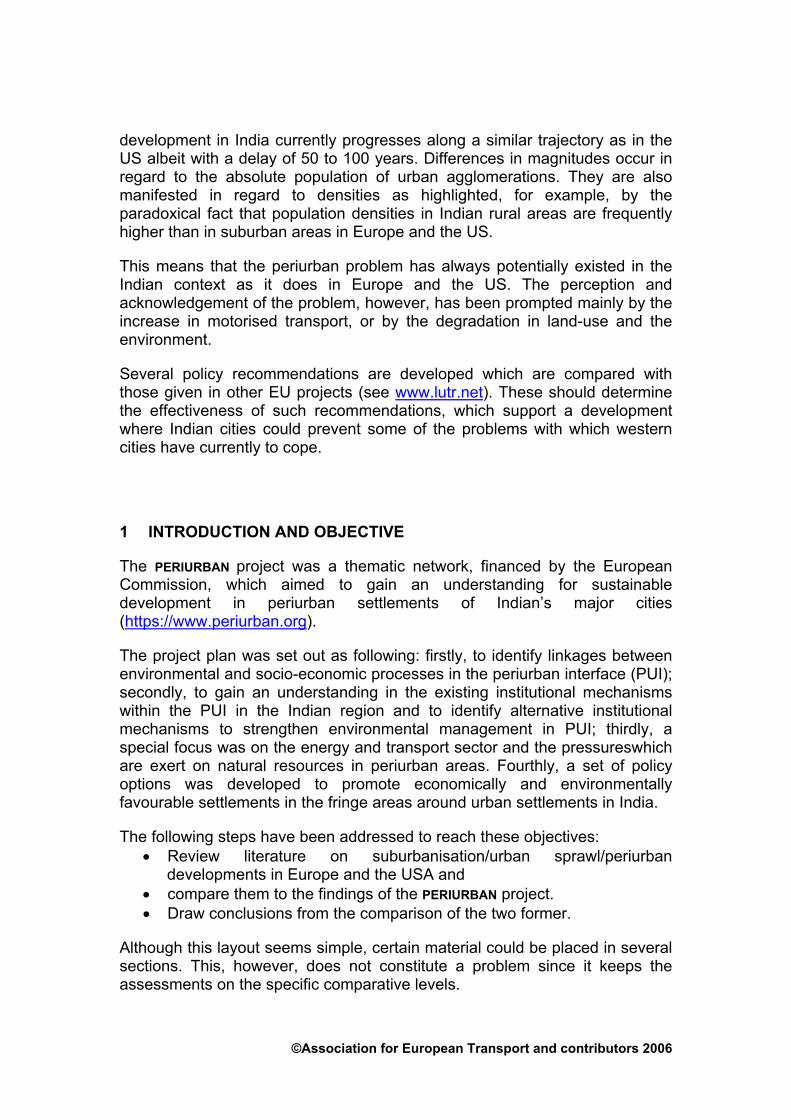
PERIURBAN – A COMPARISON BETWEEN INDIA AND WESTERN COUNTRIES
Robert Kölbl Institute for Transport Planning and Traffic Engineering,
University of Technology, Vienna
Reinhard Haller Institute for Transport Planning and Traffic Engineering,
University of Technology, Vienna
Short abstract:
The EC funded project analysed peri-urban settlements of India's major cities and their developments are compared with cities from Europe and the USA. Proposed EC policies are assessed in regard of their effectiveness and sustainability.
Long abstract:
The PERIURBAN project was an EC funded thematic network with the aim of obtaining an understanding for sustainable development in periurban settlements of India's major cities. The project’s focus was on a cross-sectional analysis including a socio-economic framework, the institutional setup and the analysis regarding energy and transport, which have not been explicitly tackled in previous projects of the same kind. The case studies have been carried out in several Indian major cities, such as Kolkatta, Mumbai, Delhi, Ahmadabad and Chennai.
This paper extends the project analysis by a juxtaposition of the Indian City development with urban development of Western Europe and the US. Based on a literature review, parallels in development are identified and described.
Urban development is a complex issue which makes it difficult to identify unequivocal (cause-effect) relationships. Due to the multitude of involved aspects and overlapping trends, a number of potential driving forces are taken into account. The relevant literature usually considers ‘general’ socio-economic trends as the main element of urban evolution. However, as it will be shown from the analysis, transport infrastructure is not only an indispensable precondition for periurban development, but appears to be the key factor. Changes in travel behaviour, such as commute patterns, are the most obvious effect of transport infrastructure. Additionally, changes in the socio-economic entities in connection with changes in land-use, seem to be a result of a transport-driven process. In this respect, the lack of institutional control is often criticised, especially in the Indian context.
Differences between Indian and European & US developments are mainly characterised by time lags and, most noticeable, by the difference in magnitudes and speed. The empirical studies suggest that urban
©Association for European Transport and contributors 2006
development in India currently progresses along a similar trajectory as in the US albeit with a delay of 50 to 100 years. Differences in magnitudes occur in regard to the absolute population of urban agglomerations. They are also manifested in regard to densities as highlighted, for example, by the paradoxical fact that population densities in Indian rural areas are frequently higher than in suburban areas in Europe and the US.
This means that the periurban problem has always potentially existed in the Indian context as it does in Europe and the US. The perception and acknowledgement of the problem, however, has been prompted mainly by the increase in motorised transport, or by the degradation in land-use and the environment.
Several policy recommendations are developed which are compared with those given in other EU projects (see www.lutr.net). These should determine the effectiveness of such recommendations, which support a development where Indian cities could prevent some of the problems with which western cities have currently to cope.
1 INTRODUCTION AND OBJECTIVE
The PERIURBAN project was a thematic network, financed by the European Commission, which aimed to gain an understanding for sustainable development in periurban settlements of Indian’s major cities (https://www.periurban.org).
The project plan was set out as following: firstly, to identify linkages between environmental and socio-economic processes in the periurban interface (PUI); secondly, to gain an understanding in the existing institutional mechanisms within the PUI in the Indian region and to identify alternative institutional mechanisms to strengthen environmental management in PUI; thirdly, a special focus was on the energy and transport sector and the pressureswhich are exert on natural resources in periurban areas. Fourthly, a set of policy options was developed to promote economically and environmentally favourable settlements in the fringe areas around urban settlements in India.
The following steps have been addressed to reach these objectives: • Review literature on suburbanisation/urban sprawl/periurban
developments in Europe and the USA and • compare them to the findings of the PERIURBAN project. • Draw conclusions from the comparison of the two former.
Although this layout seems simple, certain material could be placed in several sections. This, however, does not constitute a problem since it keeps the assessments on the specific comparative levels.
©Association for European Transport and contributors 2006
2 SUBURBANIZATION, URBAN SPRAWL OR PERIURBAN: CONCEPTS AND DEFINITIONS
2.1 The development in the EU and US: General concepts
This section gives a brief overview over a selection of theoretical concepts on the process of PU development.
Klaassen, Bourdrez et al. (1981) and van den Berg (1989) distinguish four stages: i) The urban region becomes more important in the process of urbanization. ii) This is followed by the subsequent counter-process of ‘suburbanization’. iii) The process culminates in ‘de-urbanization’ in which the city region as a whole loses importance. And iv), the core city regains population and economic activity through ‘re-urbanization’. According to them, most European cities were in phases of ‘urbanization’ and ‘suburbanization’. in the 1970s and 80s.
Axhausen (2000) points out the prevailing of the transport perspective of urban geography in the 20th century, considering traffic as a separate function. The associated ‘network logic’ is mainly concerned with factors such as efficiency of operations, speed and safety and has gradually overpowered traditional urban logic. The most important factors determining suburbanization quoted in scientific American sprawl literature are:
• The oppressiveness of the place-based networks • Increased participation in higher education • Greater fluidity of many labour markets • The car • Subsidised housing ownership
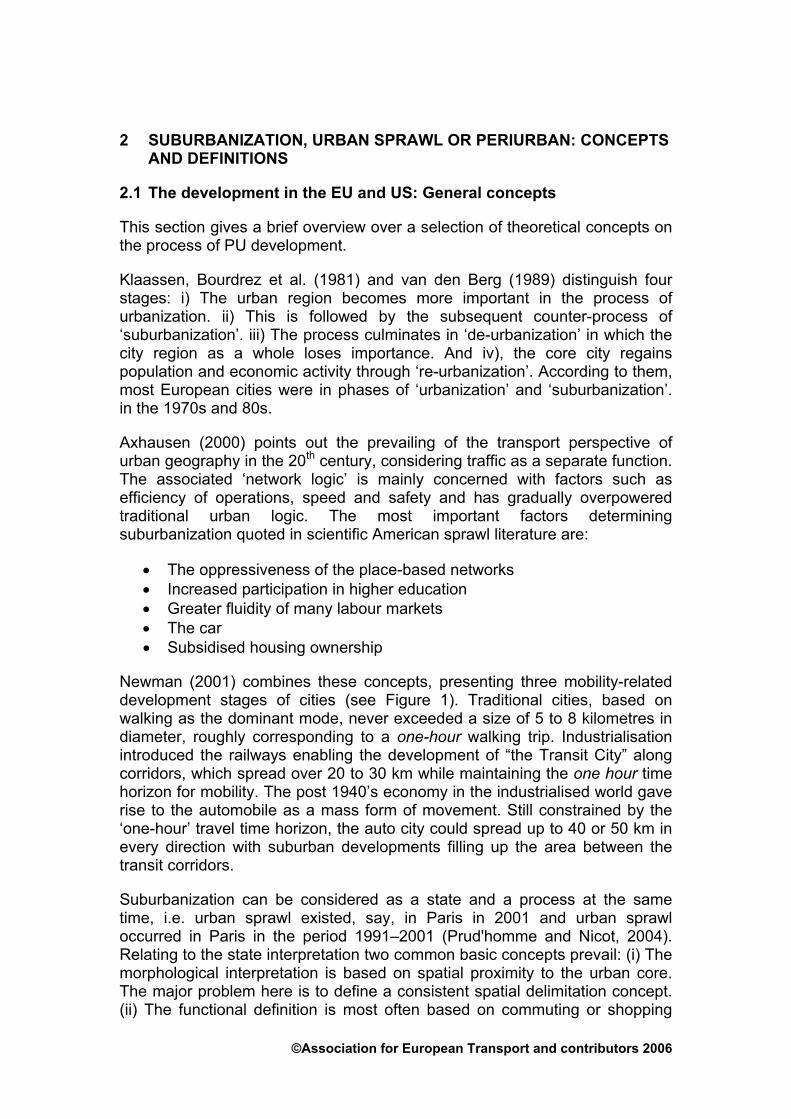
Newman (2001) combines these concepts, presenting three mobility-related development stages of cities (see Figure 1). Traditional cities, based on walking as the dominant mode, never exceeded a size of 5 to 8 kilometres in diameter, roughly corresponding to a one-hour walking trip. Industrialisation introduced the railways enabling the development of “the Transit City” along corridors, which spread over 20 to 30 km while maintaining the one hour time horizon for mobility. The post 1940’s economy in the industrialised world gave rise to the automobile as a mass form of movement. Still constrained by the ‘one-hour’ travel time horizon, the auto city could spread up to 40 or 50 km in every direction with suburban developments filling up the area between the transit corridors.
Suburbanization can be considered as a state and a process at the same time, i.e. urban sprawl existed, say, in Paris in 2001 and urban sprawl occurred in Paris in the period 1991–2001 (Prud'homme and Nicot, 2004). Relating to the state interpretation two common basic concepts prevail: (i) The morphological interpretation is based on spatial proximity to the urban core. The major problem here is to define a consistent spatial delimitation concept. (ii) The functional definition is most often based on commuting or shopping
©Association for European Transport and contributors 2006
patterns and is frequently used for the definition of (functional) urban areas by statistical offices. The process definition focuses on temporal evaluation and can be interpreted as flattening of urban density gradients (Prud'homme and Nicot, 2004).
I
II
III
Figure 1 Walking (I), transit (II) and automobile (III) city (Newman, 2001)
2.2 Indian concepts
Although the PERIURBAN project was not a primary research project, certain assumptions were made for development of the empirical studies.
©Association for European Transport and contributors 2006
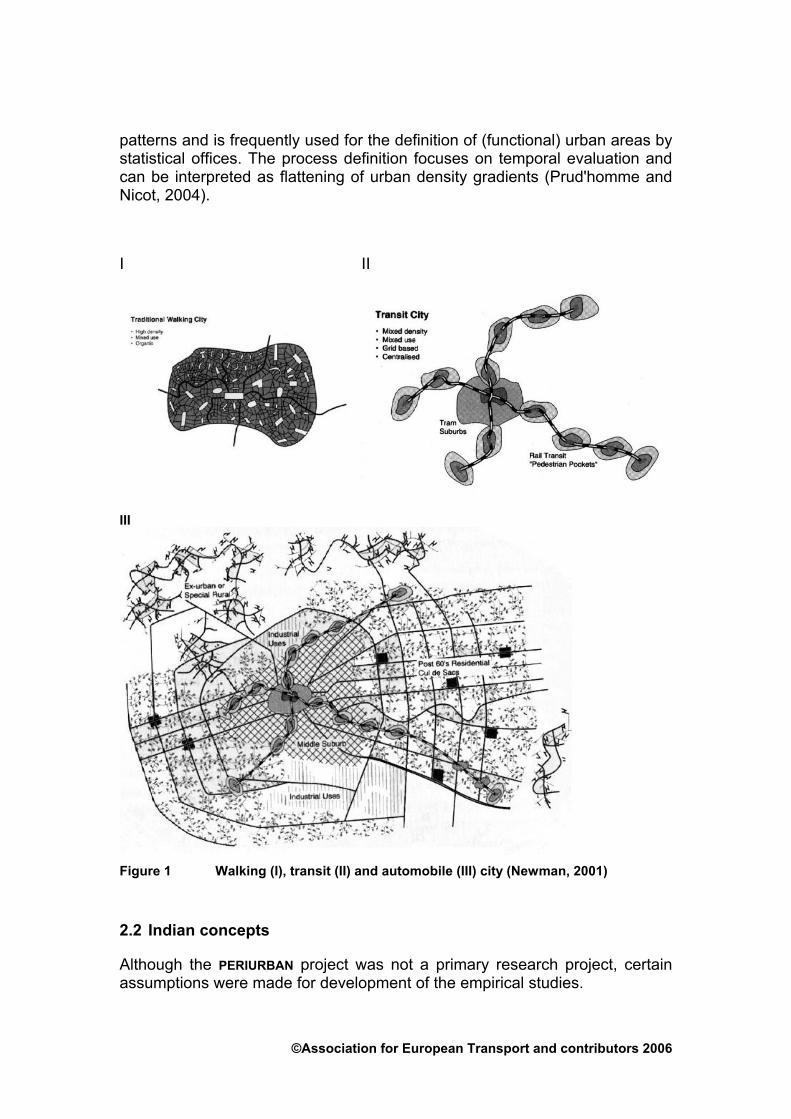
On a conceptual level, the formation of peri-urban (PU) areas is assumed to be related to ‘push factors’, such as a deteriorating environment, creating a strong influence on these areas beyond the traditional city limits (Thirumurthy, 2005). However, urbanization is also due to ‘pull factors’, specifically through the easy accessibility of transportation corridors. Thus, the process of urbanization in areas beyond the city limits transforms rural areas into urban areas by passing through the PU stage (Figure 2).
Figure 2 Concept of formation of PU areas (Thirumurthy, 2005)
A major emphasis in the PERIURBAN project was placed on definitions of the notion of “peri-urban interface” (PUI). Three main approaches were identified:
The PUI as the periphery of a city • • •
The PUI as a socio-economic system The PUI as the interaction of rural-urban flows
Traditionally, the PUI has been defined as ‘the edge of the city’, the ‘urban fringe‘ or as the ‘spatial transition zone between urban and rural areas’. A recent example of this approach is the concept of ‘footprints’, which focuses on the consumption of resources (Morello et al., 1998). Spatial proximity to urban areas is thus intrinsic to this definition of PUI. The approach seems entirely consistent with a “natural science” analysis of PU areas (Timms and Hodgson, 2005).
©Association for European Transport and contributors 2006
‘Peri-urban’ or the PUI communities in socio-economic terms are those which have a dual urban-rural orientation regardless of spatial proximity (Iaquinta and Drescher, 2000). Their three main aspects are the demographic, the economic and the socio-psychological component, where the latter is often omitted.
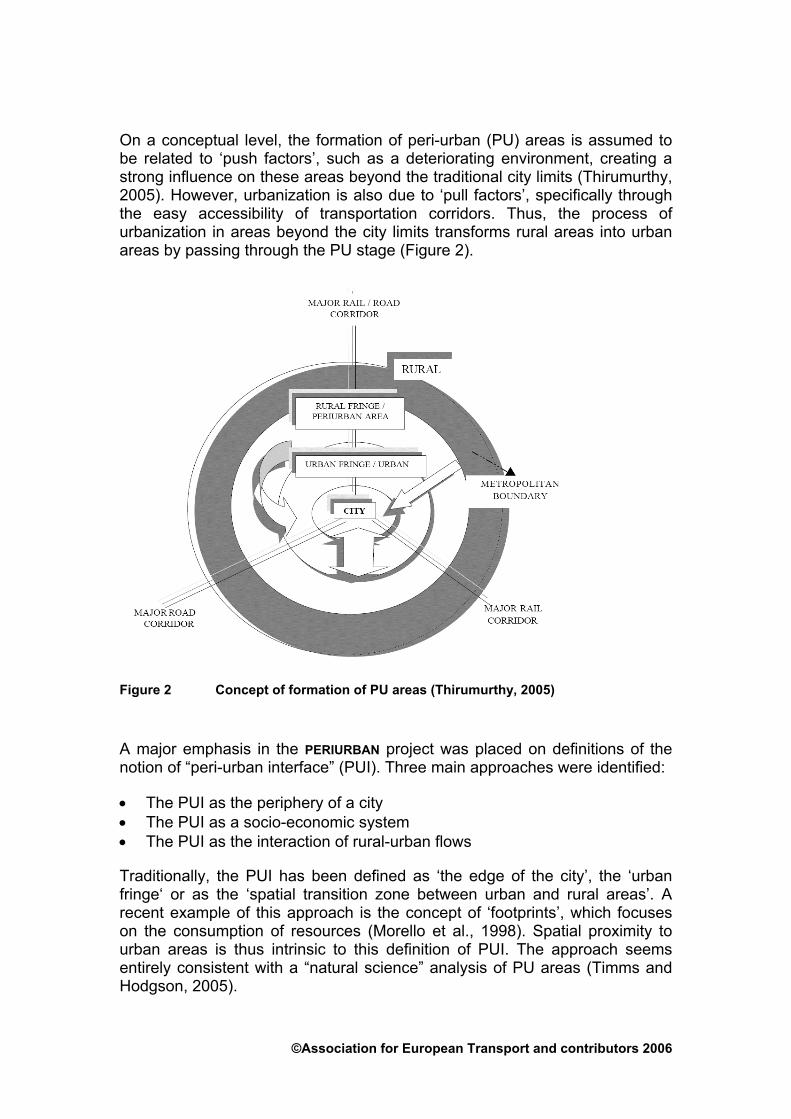
A further approach looks at the dynamics of rural-urban links and flows (see Figure 3). The PUI is assumed to be area where urban-rural linkages are most intense (Thirumurthy, 2005). The dynamics of this approach seems to be conceptually appealing given the rapidly changing nature of social and economic relations within PUI.
People
Production
Commodities
Capital/income
Information
Natural resources
Waste and pollution
Non-agricultural employment Urban services
Production supplies
Non-durable and durable goods
Markets for selling rural products
Processing / manufacturing
Information on employment, production, prices, welfare services
Socio-economic structure and relations Rural economy (sectors)
Rural production
Rural systems Structural changes
Urban systems Functions/role Rural – Urban Flows
Figure 3 Rural–urban flows (Thirumurthy, 2005)
On a more concrete level, the socio-economic driving forces are identified for PU development in India(Thirumurthy, 2005):
Population growth in the cities due to migration leading to increased land prices in the city
•
• • • • • •
Increasing congestion and deterioration of living environment in the city Higher transportation accessibility The availability of health and education facilities outside the city The desire to own a house at affordable prices The availability of communication facilities outside the city Community and friends influence
©Association for European Transport and contributors 2006
2.3 The comparison of concepts
Conceptually, there is little difference between the definitions of suburbanisation, urban sprawl and PU or PUI. Similarly, western and Indian approaches differ also to a limited extent, since the latter are usually derivation or variations of the former. Although the selection of concepts is not comprehensive, it becomes clear that previous approaches generally placed the focus more on the physical or spatial dimension and current add the multi-dimensionality of the socio-economic functions. If they may be regarded as equivalent, depends on the point of view, but definitely point out the complexity of the problem involved. Differences such as between a ‘state’ and a ‘process’ of the PUI are marginal and actually can be viewed as complementary, since connecting states at different points in time describe a dynamic process.
3 MEASURING SUBURBANIZATION/PERIURBAN: THE EMPIRICAL EVIDENCE
3.1 From the EU and US
3.1.1 The empirical evidence
‘Hard’ empirical evidence on suburbanization is still relatively scarce. Evidence is, however, relevant not only to confirm the existence of the phenomenon per se but to highlight the quantitative magnitude of the development and whether suburbanization is still continuing.
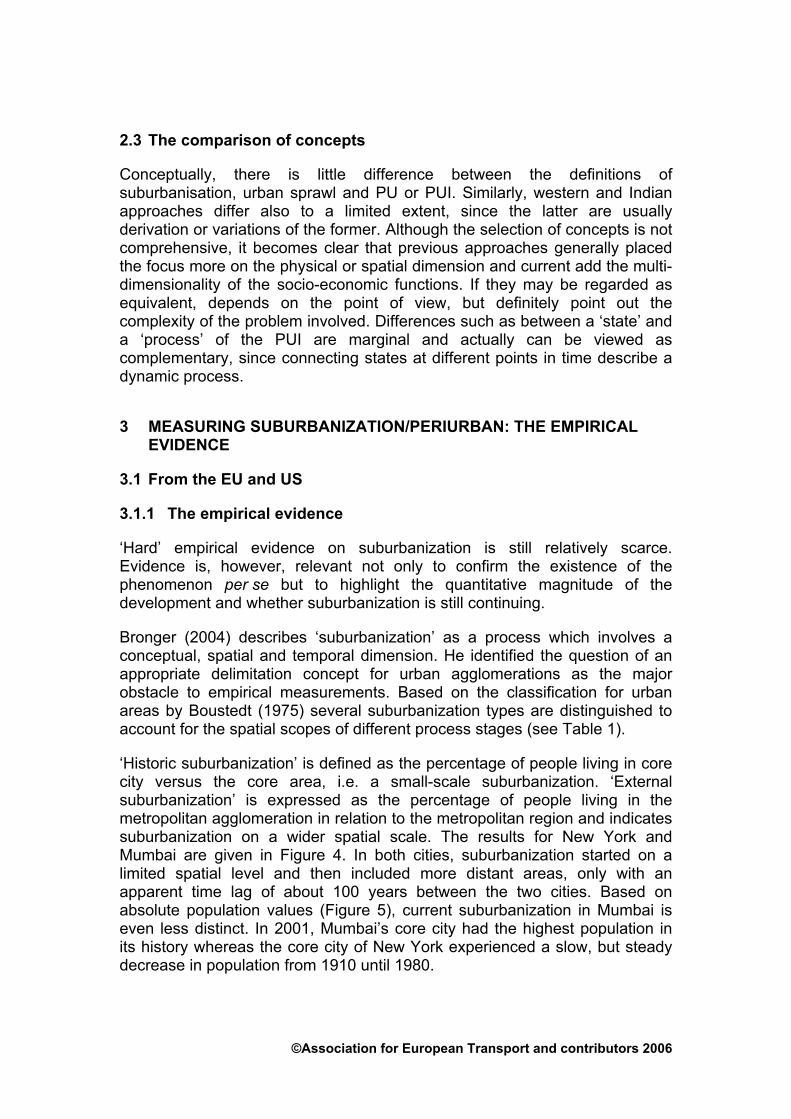
Bronger (2004) describes ‘suburbanization’ as a process which involves a conceptual, spatial and temporal dimension. He identified the question of an appropriate delimitation concept for urban agglomerations as the major obstacle to empirical measurements. Based on the classification for urban areas by Boustedt (1975) several suburbanization types are distinguished to account for the spatial scopes of different process stages (see Table 1).
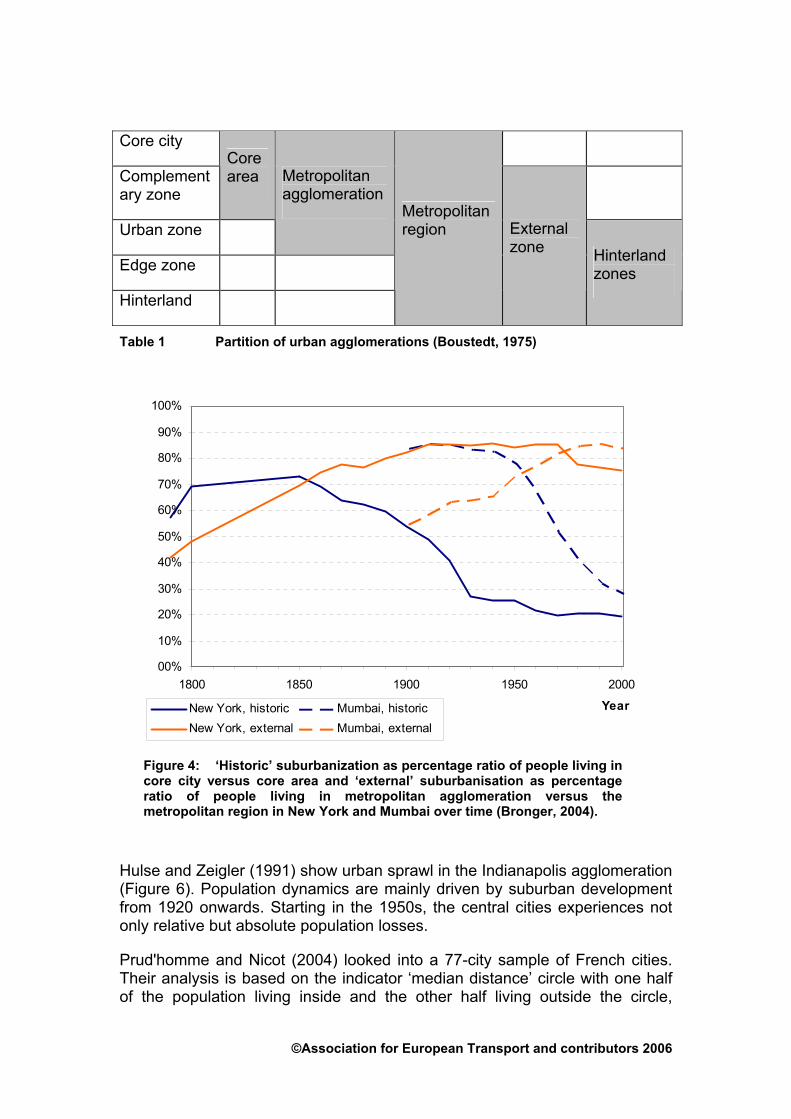
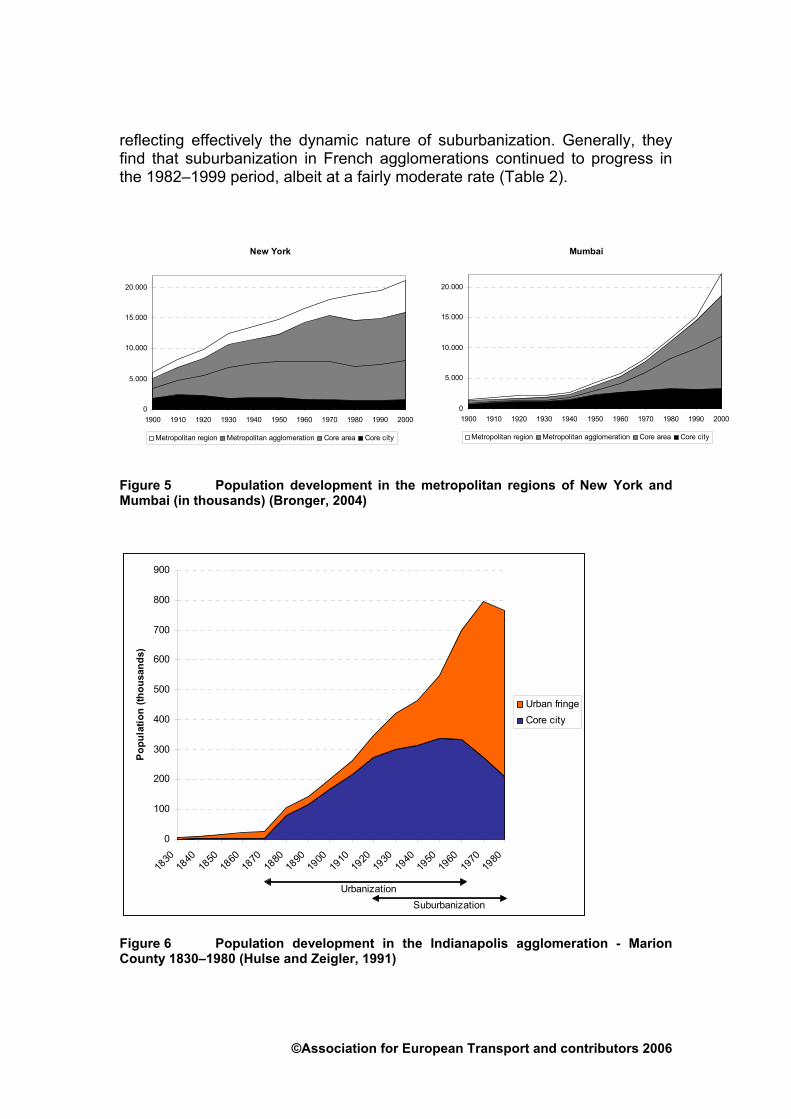
‘Historic suburbanization’ is defined as the percentage of people living in core city versus the core area, i.e. a small-scale suburbanization. ‘External suburbanization’ is expressed as the percentage of people living in the metropolitan agglomeration in relation to the metropolitan region and indicates suburbanization on a wider spatial scale. The results for New York and Mumbai are given in Figure 4. In both cities, suburbanization started on a limited spatial level and then included more distant areas, only with an apparent time lag of about 100 years between the two cities. Based on absolute population values (Figure 5), current suburbanization in Mumbai is even less distinct. In 2001, Mumbai’s core city had the highest population in its history whereas the core city of New York experienced a slow, but steady decrease in population from 1910 until 1980.
©Association for European Transport and contributors 2006
Core city
Complementary zone
Core area
Urban zone
Metropolitan agglomeration
Edge zone
Hinterland
Metropolitan region External
zone Hinterland zones
Table 1 Partition of urban agglomerations (Boustedt, 1975)
00%
10%
20%
30%
40%
50%
60%
70%
80%
90%
100%
1800 1850 1900 1950 2000
YearNew York, historic Mumbai, historicNew York, external Mumbai, external
Figure 4: ‘Historic’ suburbanization as percentage ratio of people living in core city versus core area and ‘external’ suburbanisation as percentage ratio of people living in metropolitan agglomeration versus the metropolitan region in New York and Mumbai over time (Bronger, 2004).
Hulse and Zeigler (1991) show urban sprawl in the Indianapolis agglomeration (Figure 6). Population dynamics are mainly driven by suburban development from 1920 onwards. Starting in the 1950s, the central cities experiences not only relative but absolute population losses.
Prud'homme and Nicot (2004) looked into a 77-city sample of French cities. Their analysis is based on the indicator ‘median distance’ circle with one half of the population living inside and the other half living outside the circle,
©Association for European Transport and contributors 2006
reflecting effectively the dynamic nature of suburbanization. Generally, they find that suburbanization in French agglomerations continued to progress in the 1982–1999 period, albeit at a fairly moderate rate (Table 2).
New York
0
5.000
10.000
15.000
20.000
1900 1910 1920 1930 1940 1950 1960 1970 1980 1990 2000
Metropolitan region Metropolitan agglomeration Core area Core city
Mumbai
0
5.000
10.000
15.000
20.000
1900 1910 1920 1930 1940 1950 1960 1970 1980 1990 2000
Metropolitan region Metropolitan agglomeration Core area Core city
Figure 5 Population development in the metropolitan regions of New York and Mumbai (in thousands) (Bronger, 2004)
0
100
200
300
400
500
600
700
800
900
1830
1840
1850
1860
1870
1880
1890
1900
1910
1920
1930
1940
1950
1960
1970
1980
Popu
latio
n (th
ousa
nds)
Urban fringeCore city
UrbanizationSuburbanization
Figure 6 Population development in the Indianapolis agglomeration - Marion County 1830–1980 (Hulse and Zeigler, 1991)
©Association for European Transport and contributors 2006
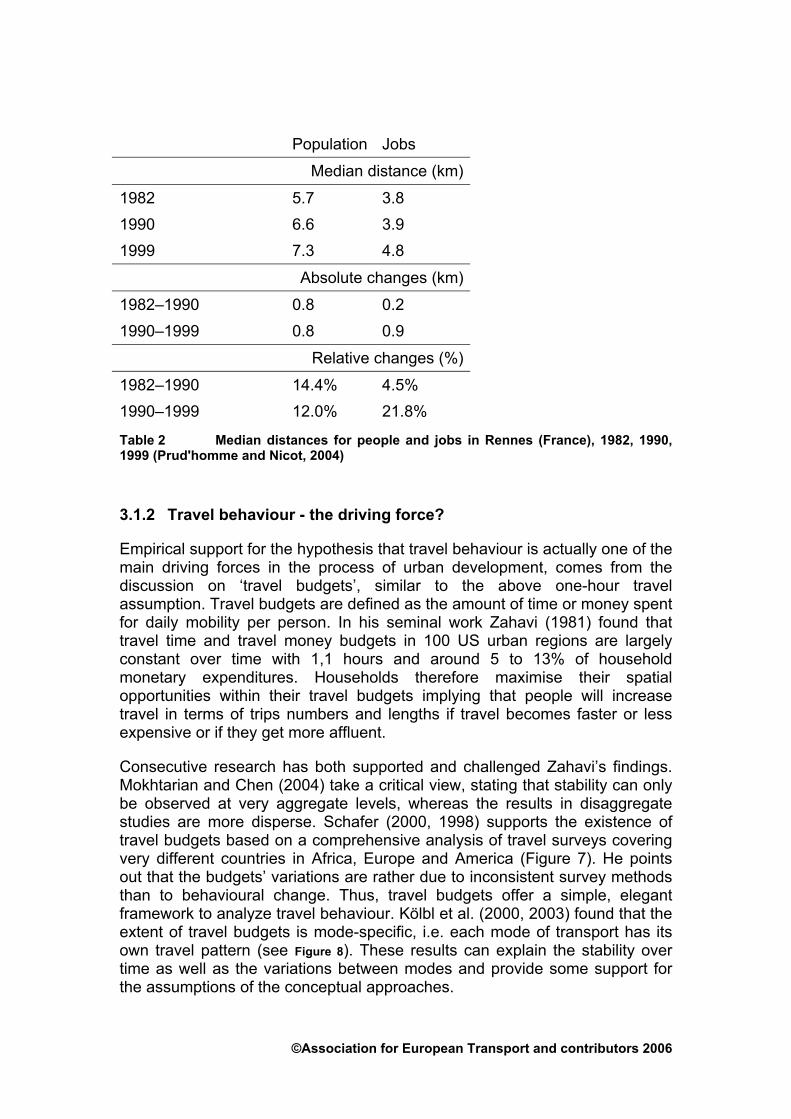
Population Jobs
Median distance (km)
1982 5.7 3.8 1990 6.6 3.9 1999 7.3 4.8
Absolute changes (km)
1982–1990 0.8 0.2 1990–1999 0.8 0.9
Relative changes (%)
1982–1990 14.4% 4.5% 1990–1999 12.0% 21.8%
Table 2 Median distances for people and jobs in Rennes (France), 1982, 1990, 1999 (Prud'homme and Nicot, 2004)
3.1.2 Travel behaviour - the driving force?
Empirical support for the hypothesis that travel behaviour is actually one of the main driving forces in the process of urban development, comes from the discussion on ‘travel budgets’, similar to the above one-hour travel assumption. Travel budgets are defined as the amount of time or money spent for daily mobility per person. In his seminal work Zahavi (1981) found that travel time and travel money budgets in 100 US urban regions are largely constant over time with 1,1 hours and around 5 to 13% of household monetary expenditures. Households therefore maximise their spatial opportunities within their travel budgets implying that people will increase travel in terms of trips numbers and lengths if travel becomes faster or less expensive or if they get more affluent.
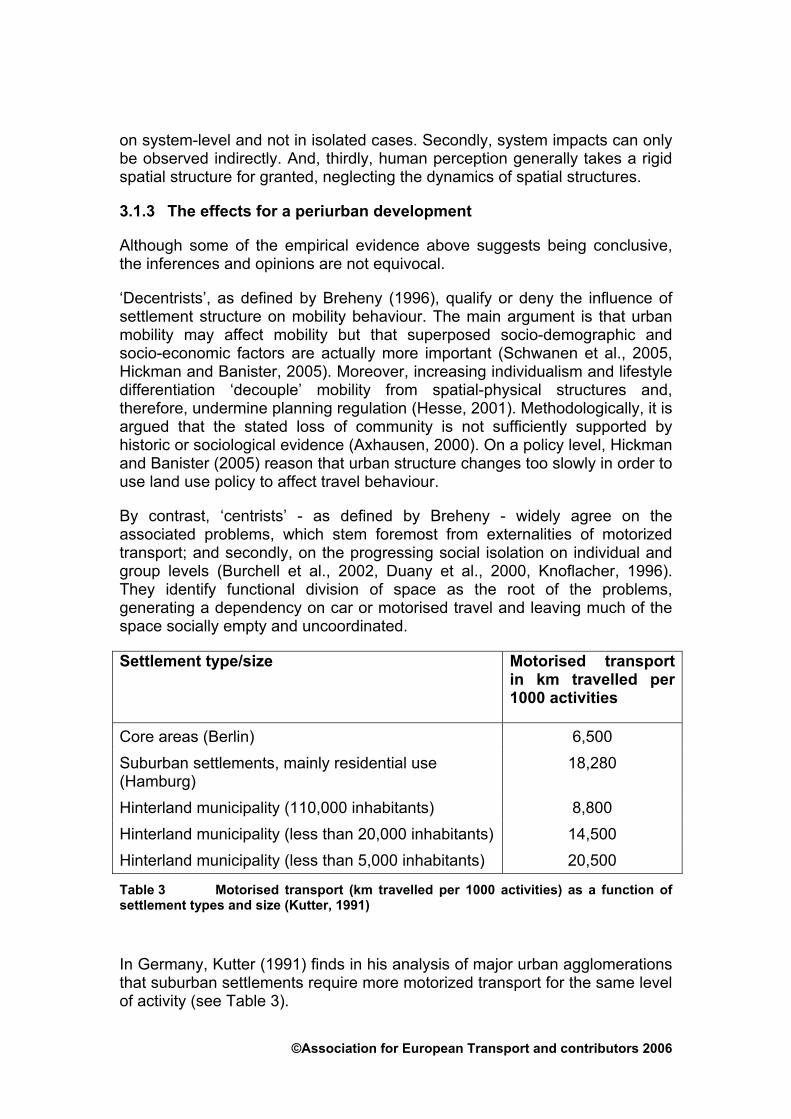
Consecutive research has both supported and challenged Zahavi’s findings. Mokhtarian and Chen (2004) take a critical view, stating that stability can only be observed at very aggregate levels, whereas the results in disaggregate studies are more disperse. Schafer (2000, 1998) supports the existence of travel budgets based on a comprehensive analysis of travel surveys covering very different countries in Africa, Europe and America (Figure 7). He points out that the budgets’ variations are rather due to inconsistent survey methods than to behavioural change. Thus, travel budgets offer a simple, elegant framework to analyze travel behaviour. Kölbl et al. (2000, 2003) found that the extent of travel budgets is mode-specific, i.e. each mode of transport has its own travel pattern (see Figure 8). These results can explain the stability over time as well as the variations between modes and provide some support for the assumptions of the conceptual approaches.
©Association for European Transport and contributors 2006
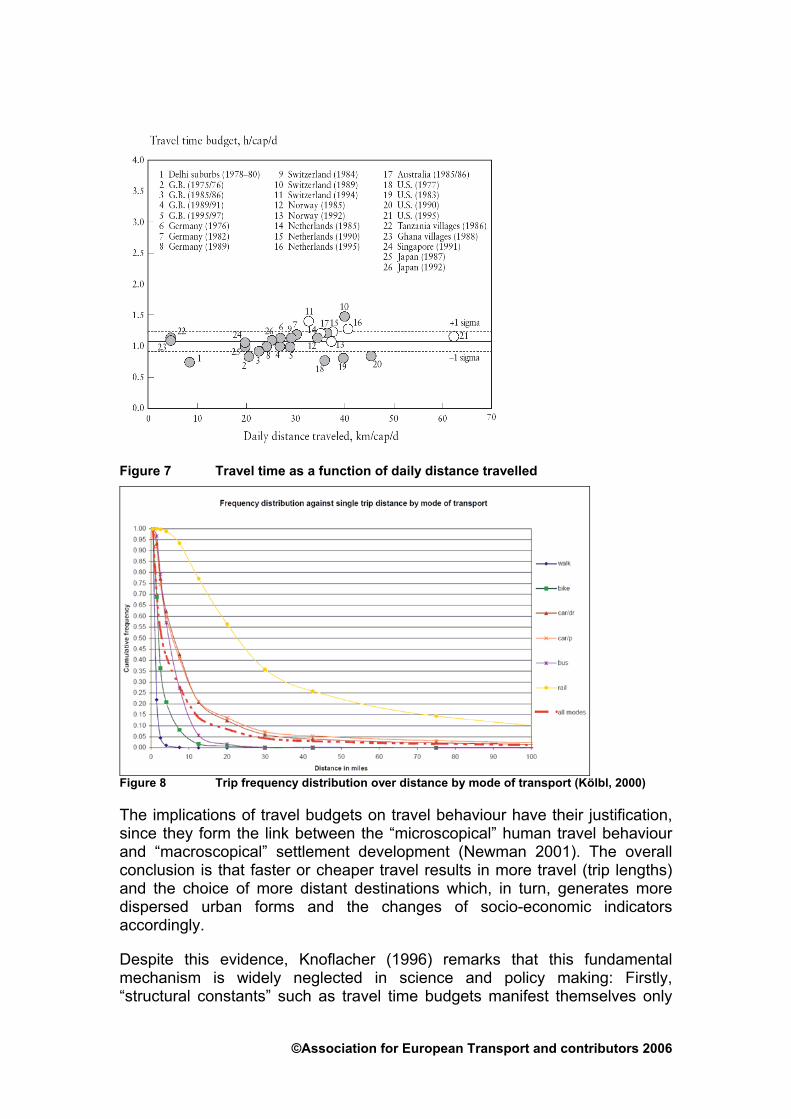
Figure 7 Travel time as a function of daily distance travelled
Figure 8 Trip frequency distribution over distance by mode of transport (Kölbl, 2000)
The implications of travel budgets on travel behaviour have their justification, since they form the link between the “microscopical” human travel behaviour and “macroscopical” settlement development (Newman 2001). The overall conclusion is that faster or cheaper travel results in more travel (trip lengths) and the choice of more distant destinations which, in turn, generates more dispersed urban forms and the changes of socio-economic indicators accordingly.
Despite this evidence, Knoflacher (1996) remarks that this fundamental mechanism is widely neglected in science and policy making: Firstly, “structural constants” such as travel time budgets manifest themselves only
©Association for European Transport and contributors 2006
on system-level and not in isolated cases. Secondly, system impacts can only be observed indirectly. And, thirdly, human perception generally takes a rigid spatial structure for granted, neglecting the dynamics of spatial structures.
3.1.3 The effects for a periurban development
Although some of the empirical evidence above suggests being conclusive, the inferences and opinions are not equivocal.
‘Decentrists’, as defined by Breheny (1996), qualify or deny the influence of settlement structure on mobility behaviour. The main argument is that urban mobility may affect mobility but that superposed socio-demographic and socio-economic factors are actually more important (Schwanen et al., 2005, Hickman and Banister, 2005). Moreover, increasing individualism and lifestyle differentiation ‘decouple’ mobility from spatial-physical structures and, therefore, undermine planning regulation (Hesse, 2001). Methodologically, it is argued that the stated loss of community is not sufficiently supported by historic or sociological evidence (Axhausen, 2000). On a policy level, Hickman and Banister (2005) reason that urban structure changes too slowly in order to use land use policy to affect travel behaviour.
By contrast, ‘centrists’ - as defined by Breheny - widely agree on the associated problems, which stem foremost from externalities of motorized transport; and secondly, on the progressing social isolation on individual and group levels (Burchell et al., 2002, Duany et al., 2000, Knoflacher, 1996). They identify functional division of space as the root of the problems, generating a dependency on car or motorised travel and leaving much of the space socially empty and uncoordinated.
Settlement type/size Motorised transport in km travelled per 1000 activities
Core areas (Berlin) 6,500 Suburban settlements, mainly residential use (Hamburg)
18,280
Hinterland municipality (110,000 inhabitants) 8,800 Hinterland municipality (less than 20,000 inhabitants) 14,500 Hinterland municipality (less than 5,000 inhabitants) 20,500
Table 3 Motorised transport (km travelled per 1000 activities) as a function of settlement types and size (Kutter, 1991)
In Germany, Kutter (1991) finds in his analysis of major urban agglomerations that suburban settlements require more motorized transport for the same level of activity (see Table 3).
©Association for European Transport and contributors 2006
3.2 Indian Evidence
3.2.1 The empirical evidence from the India
India was confronted with an extremely rapid urbanization in the 20th century. The share of urban population, which was only 3% at the beginning of the century, rose to approximately 30%. Concern concentrated on the seven ‘super metros’ (Table 4), but the nature and dimension of the problem is similar elsewhere (Thirumurthy, 2005).
One challenge within the PERIURBAN project was to develop an operational definition for peri-urban settlements suitable for the Indian context. A series of indicators were defined based on the existing Census of India and the above literature review. Each of the indicators is assigned with a threshold value which characterizes urban settlements. Settlements are then classified as urban, PU or rural if more than 75%, 25–75% or less than 25% of the criteria are fulfilled. After a case study evaluation covering the Chennai metropolitan area, the number of indicators was reduced from 28 to 12 without significant loss of explanatory power (see Table 5). The indicator system therefore is a major step towards an operational definition for periurban settlements.
Population (in million) Super Metros
1961 1971 1981 1991 2001
Calcutta 5.7 7.0 9.2 11.2 13.2 Mumbai 4.2 6.0 8.2 9.9 16.4 Delhi 2.4 3.7 5.7 9.2 12.8 Chennai 2.0 3.2 4.3 3.8 6.4 Bangalore 1.2 1.7 2.9 3.3 5.7 Hyderabad 1.3 1.8 2.5 3.0 5.5 Ahmedabad 1.2 1.7 2.5 3.0 4.5
Table 4 Population of Super Metros in India 1961-2001 (Thirumurthy, 2005)
3.2.2 India driving forces
In a case study by Anna-University, a sample of 9 settlements within the Chennai metropolitan area has been analyzed (Thirumurthy, 2005). Whereas the city of Chennai has shown a population growth rate of 11.1% per decade, the 8 municipalities outside the city limits (depicted as the fairly round circles in) had a growth rate of 150% to 600%; all of these municipalities are located along the four major transportation corridors (see Figure 9). The most distinct development has taken place on the Southern corridor, where the rail and
©Association for European Transport and contributors 2006
road facilities provide high levels of accessibility. On the contrary, the road-only corridor to the Northwest has seen relative moderate development. The case study clearly shows that transportation infrastructure is the primal factor influencing PU development; moreover, the speed of change is most explicit in corridors which combine high level roads and railway infrastructure. These results have also been verified by Sudhira et al (2003, 2004) who analysed PU development along the Bangalore – Mysore highway and in the Mangalore/Udupi region using geographical information systems.
Indicator Criterion Indicator Criterion
SOCIO-ECONOMIC INDICATORS INFRASTRUCTURE INDICATORS Density Persons/Sq.Km ≥ 400 Distance from the City Centre ≤ 25 km Literacy ≥ 75% Distance from Major Road/Rail
Corridor ≤ 2km
Workforce-Men ≥ 50% AGRICULTURAL INDICATORS Dependents ≤ 60% Agricultural land use ≤ 10% Non-Agricultural Workforce ≥ 75% Crops ≤ 100
tons Agricultural Workforce ≤ 5% Manufacture & HHI ≥ 2% Other Services ≥ 95%
Table 5 Indicators for PU settlements after case study evaluation (Thirumurthy, 2005)
3.2.3 The effects of Indian periurban development
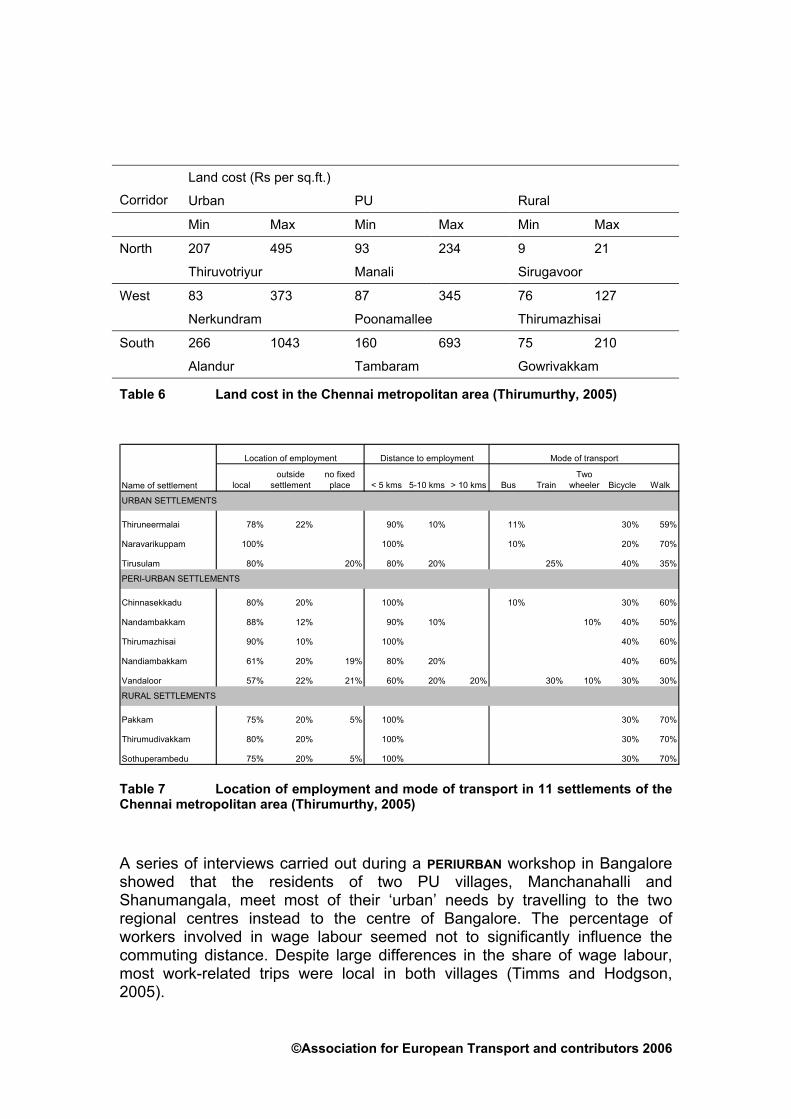
Rapidly growing land cost within the city has created an enormous demand for land outside the city with a huge difference in land values (see Table 6 for figure in the Chennai metropolitan area). Land costs are differentiated by the distance to transport corridors. This shows that accessibility and transport infrastructure play also a role in the development of land costs.
The land value and accommodation rent differentials drive especially people from the middle income group into PU areas in the search for cheaper and better accommodation (IRMA, 2005). The ‘trade off’ between transport and other expenditures results in a more transport-oriented lifestyles. This trend was reinforced by government policies to promote housing activity and by financial institutions which reduced the interest rates for loans.
A travel survey carried out by Thirumurthy (2005) in 16 PU settlements of the Chennai metropolitan area, covering income, transport expenditure and modal shares relating to work-trips shows that the highest level of walking and cycling occur in the settlements with the lowest transport expenditures and the lowest income.
©Association for European Transport and contributors 2006
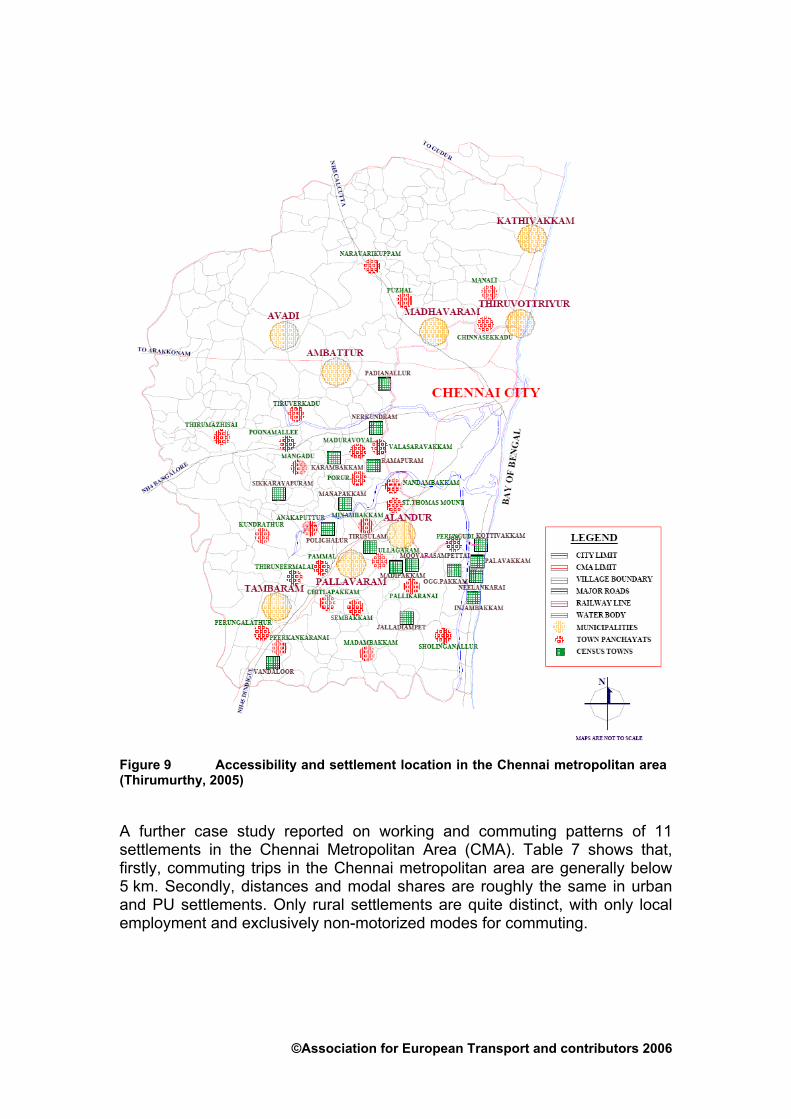
Figure 9 Accessibility and settlement location in the Chennai metropolitan area (Thirumurthy, 2005)
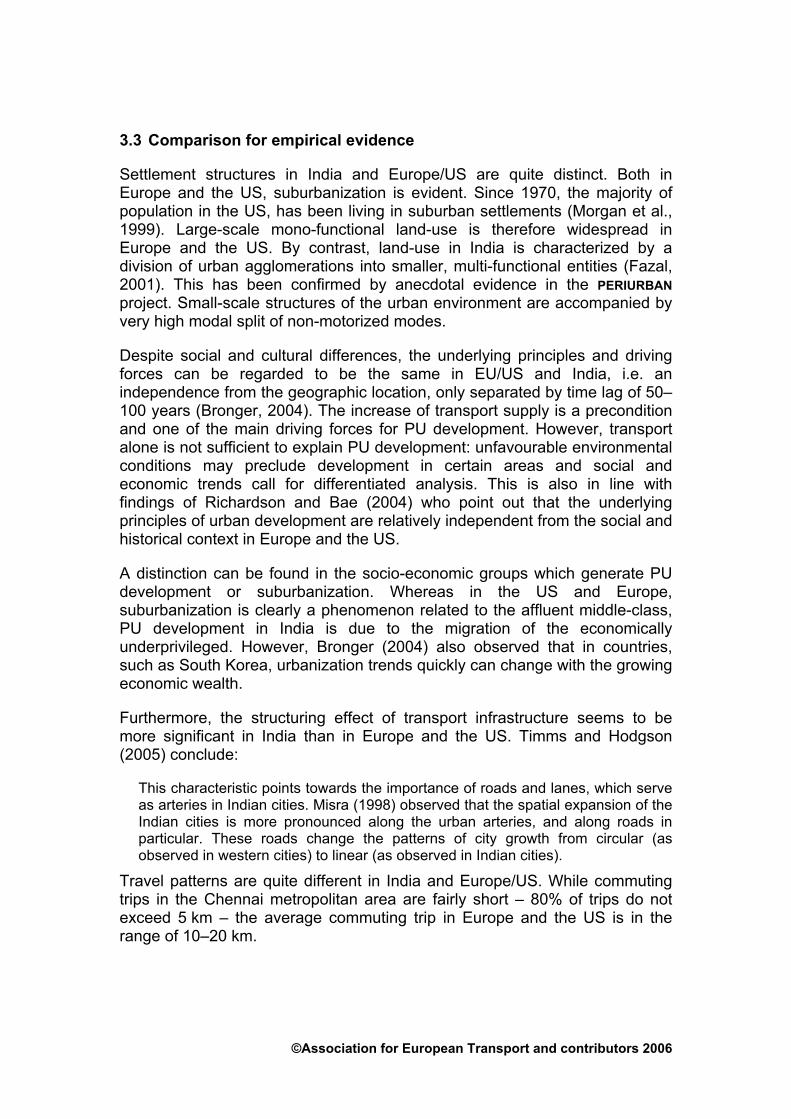
A further case study reported on working and commuting patterns of 11 settlements in the Chennai Metropolitan Area (CMA). Table 7 shows that, firstly, commuting trips in the Chennai metropolitan area are generally below 5 km. Secondly, distances and modal shares are roughly the same in urban and PU settlements. Only rural settlements are quite distinct, with only local employment and exclusively non-motorized modes for commuting.
©Association for European Transport and contributors 2006
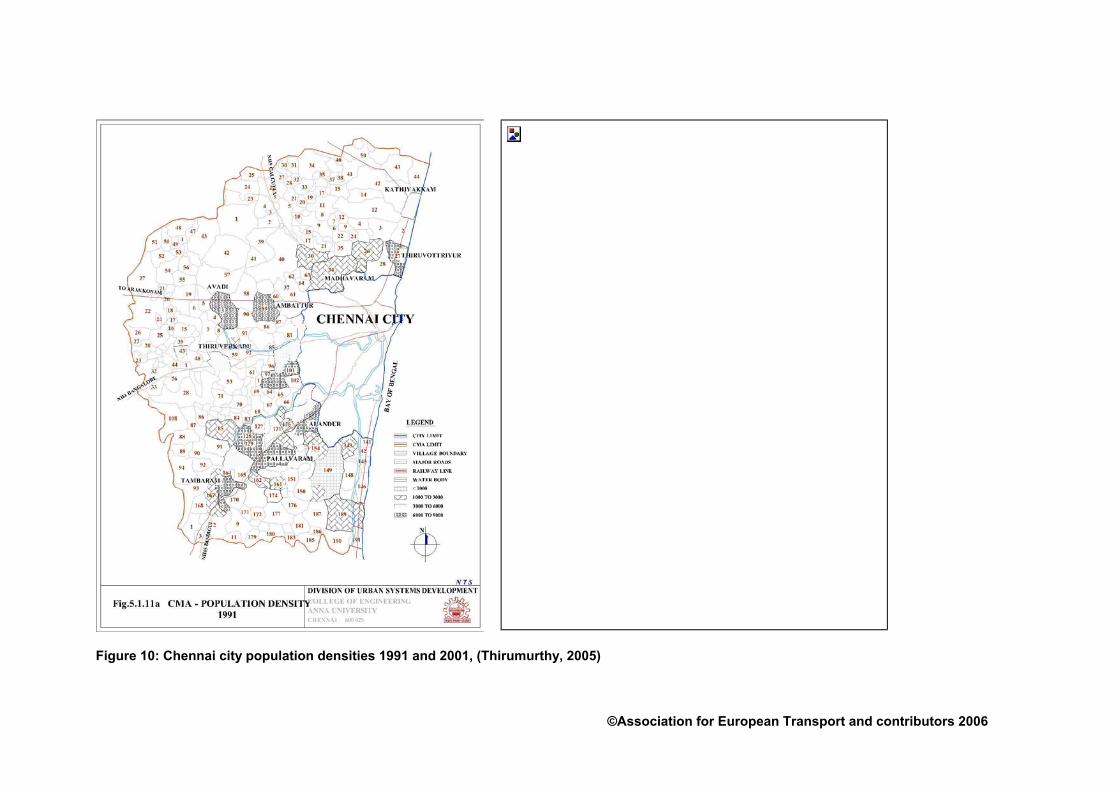
Figure 10: Chennai city population densities 1991 and 2001, (Thirumurthy, 2005)
©Association for European Transport and contributors 2006
Land cost (Rs per sq.ft.)
Corridor Urban PU Rural
Min Max Min Max Min Max
North 207 495 93 234 9 21
Thiruvotriyur Manali Sirugavoor
West 83 373 87 345 76 127
Nerkundram Poonamallee Thirumazhisai
South 266 1043 160 693 75 210
Alandur Tambaram Gowrivakkam
Table 6 Land cost in the Chennai metropolitan area (Thirumurthy, 2005)
localoutside
settlementno fixed place < 5 kms 5-10 kms > 10 kms Bus Train
Two wheeler Bicycle Walk
Thiruneermalai 78% 22% 90% 10% 11% 30% 59%
Naravarikuppam 100% 100% 10% 20% 70%
Tirusulam 80% 20% 80% 20% 25% 40% 35%
Chinnasekkadu 80% 20% 100% 10% 30% 60%
Nandambakkam 88% 12% 90% 10% 10% 40% 50%
Thirumazhisai 90% 10% 100% 40% 60%
Nandiambakkam 61% 20% 19% 80% 20% 40% 60%
Vandaloor 57% 22% 21% 60% 20% 20% 30% 10% 30% 30%
Pakkam 75% 20% 5% 100% 30% 70%
Thirumudivakkam 80% 20% 100% 30% 70%
Sothuperambedu 75% 20% 5% 100% 30% 70%
Name of settlement
Location of employment Distance to employment Mode of transport
URBAN SETTLEMENTS
PERI-URBAN SETTLEMENTS
RURAL SETTLEMENTS
Table 7 Location of employment and mode of transport in 11 settlements of the Chennai metropolitan area (Thirumurthy, 2005)
A series of interviews carried out during a PERIURBAN workshop in Bangalore showed that the residents of two PU villages, Manchanahalli and Shanumangala, meet most of their ‘urban’ needs by travelling to the two regional centres instead to the centre of Bangalore. The percentage of workers involved in wage labour seemed not to significantly influence the commuting distance. Despite large differences in the share of wage labour, most work-related trips were local in both villages (Timms and Hodgson, 2005).
©Association for European Transport and contributors 2006
3.3 Comparison for empirical evidence
Settlement structures in India and Europe/US are quite distinct. Both in Europe and the US, suburbanization is evident. Since 1970, the majority of population in the US, has been living in suburban settlements (Morgan et al., 1999). Large-scale mono-functional land-use is therefore widespread in Europe and the US. By contrast, land-use in India is characterized by a division of urban agglomerations into smaller, multi-functional entities (Fazal, 2001). This has been confirmed by anecdotal evidence in the PERIURBAN project. Small-scale structures of the urban environment are accompanied by very high modal split of non-motorized modes.
Despite social and cultural differences, the underlying principles and driving forces can be regarded to be the same in EU/US and India, i.e. an independence from the geographic location, only separated by time lag of 50–100 years (Bronger, 2004). The increase of transport supply is a precondition and one of the main driving forces for PU development. However, transport alone is not sufficient to explain PU development: unfavourable environmental conditions may preclude development in certain areas and social and economic trends call for differentiated analysis. This is also in line with findings of Richardson and Bae (2004) who point out that the underlying principles of urban development are relatively independent from the social and historical context in Europe and the US.
A distinction can be found in the socio-economic groups which generate PU development or suburbanization. Whereas in the US and Europe, suburbanization is clearly a phenomenon related to the affluent middle-class, PU development in India is due to the migration of the economically underprivileged. However, Bronger (2004) also observed that in countries, such as South Korea, urbanization trends quickly can change with the growing economic wealth.
Furthermore, the structuring effect of transport infrastructure seems to be more significant in India than in Europe and the US. Timms and Hodgson (2005) conclude:
This characteristic points towards the importance of roads and lanes, which serve as arteries in Indian cities. Misra (1998) observed that the spatial expansion of the Indian cities is more pronounced along the urban arteries, and along roads in particular. These roads change the patterns of city growth from circular (as observed in western cities) to linear (as observed in Indian cities).
Travel patterns are quite different in India and Europe/US. While commuting trips in the Chennai metropolitan area are fairly short – 80% of trips do not exceed 5 km – the average commuting trip in Europe and the US is in the range of 10–20 km.
©Association for European Transport and contributors 2006
4 POLICY RECOMMENDATIONS
4.1 Europe and US
Policy recommendations are usually derived in a two-step approach: firstly, a vision of an ‘optimal’ (or desired) urban form is proposed in a normative way; then, secondly, measures are proposed which should bring about this vision (May and Roberts, 1995). If this is exemplified on the “centrists/decentrist” classification, then ‘centrists’ (emphasizing the benefits of mono or poly-centric ‘compact’ cities) opt for planning to influence and control urban development processes whereas ‘decentralists’ (favouring suburban settlement patterns) usually dissuade from intervention (Boarnet, 2000, Brake et al., 2001). (For further details of this discussion see Ewing (1997) and Gordon and Richardson (1997)). Although these points-of-view and their related recommending influence have to be born in mind for policy considerations, the following policies describes mainly actual recommendations or applications in Europe and the US.
Martens, Pedler et al. (2002) identified three basic approaches of transport and land-use planning in European cities. The first one comprehends pure transport instruments to influence autonomous land use changes. The second focuses on a direct influence on land-use using ‘pull policies’, the third approach also reverts to ‘push measures’. The ‘pure’ transport policies involve mainly policies favouring public transport, such as the development of light rail systems. The most popular ‘pull’ measure concerning land-use policies is public investment to stimulate development at desired locations. Other, more innovative measures are less frequently applied. ‘Push’ policies include development regulations requiring minimum densities or imposing parking restrictions; these are even less common. They conclude that practical land-use and transport policies are strongly constrained by feasibility considerations. The main shortcomings of current land-use and transport policies in Europe are the lack of adequate zoning legislation and the absence of regional coordination in urban agglomerations.
The importance of an integration of land-use and transport strategies is also an outcome of the LUTR research cluster (www.lutr.net) (Clifford et al., 2005). Their main findings are:
• Land-use, transport and mobility planning needs to be tackled at regional level first, before being tackled at a local (city) level in order
o to reduce travel distances, travel time and the share of car travel and provide attractive land-use alternatives to suburban living;
o to increase urban density or mixed land-use for the long run; o to make car travel more expensive and slower for less car-
dependent lifestyles; and o to prevent the development of not spatially integrated large retail
and leisure facilities. • A framework needs to be implemented to allow potential legal,
institutional, financial, political and cultural barriers to be overcome.
©Association for European Transport and contributors 2006
• Urban Transport benchmarking needs to be introduced for monitoring and evaluation.
• A participation of End-user cities in research and demonstration activities needs to be set up to overcome barriers of implementation and show the potential benefits for doing so.
In the US, land-use planning is less common than in Europe. Miller (2004) reports on the exception of the Seattle region, where a series of approaches and instruments was implemented to reduce urban sprawl:
• Critical areas, such as natural resources reservoirs, were excluded from urban development.
• Urban growth areas were established to concentrate urban growth in designated areas.
• Cities and counties have to prepare and approve a comprehensive development plan which covers all relevant regulations, investment and other development decisions.
• The local development programmes have to be continuously monitored to assess their implementation and effectiveness.
• Those mandatory, state-wide regulations and requirements were complemented with more local initiatives to assure local commitment to the overall objectives.
4.2 India
Two levels of solutions were identified in the PERIURBAN workshops:
• A “high level” which recognises that transport and land use are closely interconnected, and that solutions should reflect this interconnection.
• A “transport sector level” which is concerned with the provision of everyday transport facilities, with transport seen as an isolated sector (Timms and Hodgson, 2005).
Both levels need to be considered in parallel to ensure mutual consistent solutions.
For high level solutions, it was generally agreed that integrated land-use and transport policies will require either inter-governmental cooperation or some form of regional planning authority. The allocation of responsibilities should be formally established and matched by the financial power. More strategic functions should be retained at higher levels in metropolitan areas.
There was also a need to bring facilities closer to people and reducing the need for transport. One type of measure involved the establishment of “regional centres”. The fact that transport-avoiding behaviour is a common strategy in the PU context, facilitates such policies.
To avoid adverse equity effects, poverty and gender-oriented PU policies should be complemented by a broader strategy incorporating housing, working place regulations, health, education and other social policies.
©Association for European Transport and contributors 2006
The following specific interventions have been identified (TERI, 2005):
• District Planning Committees (DPCs) need to be set up as an institutional body by recognising the rural-urban divide and PU as a distinct area, which is empowered through a concept of regional planning.
• Nagar Panchayats (NPs), a forum for civil society engagement, are ideal institutions which get convergence of rural and urban areas and which should also be considered by the Census as one of the hierarchies in planning process.
• The roles of DPCs and NPs need to be defined clearly, also in terms of rules and regulations (73rd and 74th Amendments) and with allocated budgets and decision making powers.
• Participation for cooperative governance and sustainability should be seen as important aspects of the PU planning process: role of civil society, education and access to basic facilities are important to be met for PU dwellers.
• Environment should be included in the development of Master Plans (considering the industrial/pollution problems of PUI as well).
• In general, it is difficult to generalise indicators for PU settings: inferences from case studies should specifically discuss indicators for the PU settings in question.
• Research should be enabled, for example, through networks such as PUDSEA (Peri-urban Development in South East Asia) or through programs such as LinkCoRe (Linking Communities with Researchers – creating a platform for sustainable periurban development in South-East Asia).
Policy recommendations concerning the ‘lower’ transport sector level were formulated in a series of needs:
• The need to promote facilities for safe non-motorised transport within PU areas. Standards for new road design should incorporate the provision of space for non-motorized modes.
• The need for better integration of transport provision across the combined urban/PU region. Integration should concern both spatial and modal issues.
• There was a need for better enforcement of existing laws (e.g. safety) and for new regulation if current regulation were inadequate. As an example, rights and responsibilities of pedestrians and cyclists should be included in transport legislation and also provided with the financial support according to their modal share.
• The type/size of transport provided at any location should depend upon the demand for travel. In this context, the importance of informal para-transit for the poor has to be recognized and efforts should be made to give it a firmer role in PU transport.
©Association for European Transport and contributors 2006
4.3 Comparison for policy recommendations
The comparison reveals some major differences between India and Europe & the US:
Densification is considered a long-term objective in Europe and in the US. On the contrary, spatially concentrated settlements are (still) commonplace in the Indian context putting India in a comparatively favourable position. Thus, for Europe and the US ‘regeneration’ policies are envisaged to attain sustainability, whereas the strategy in India should be to preserve and improve the existing settlement patterns and the natural environment.
Policies concerned with the PUI should include a special focus on equity issues. In contrast to Europe and the US, low-income groups are the main group involved in PU development in India. These groups are particularly vulnerable to changes in their living environment as they do not have the economic resources to adopt nor do they possess the substantial weight in the political process to enforce their interests.
Poly-centric development seems to be more appropriate in the Indian context. Firstly, the sheer size of India’s major agglomerations clearly suggests poly-centric development. Secondly, Indian cities have a history of multiple self-contained centres so that cultural considerations also indicate poly-centric development.
Some of the arguments, which are brought forward against planning intervention in Europe and the US, do not hold for the Indian context. This definitely applies to the argument that densities in the US are too low to successfully promote public transport (Richardson and Bertaud, 2004).
A policy recommendation, which is in line for India and Europe & the US, is the vision of sustainable settlements, societies and the environment, which is seen as a comprehensive task requiring broad bundle of coordinated instruments. The most important recommendations are regarding the provision of the planning institutions with the legal powers and the financial resources to establish parity between the administrations of the urban, periurban and rural areas and between the public and private sectors.
With this in mind, there is a huge need to research and analysis of the PU development in western countries and India. This, however, should not be limited to this subcontinent, since the same development is luring in many parts of Asia.
Acknowledgement
We would like to thank the EU for funding this project and all project partners, i.e. ANNA University, Institute of Rural Management, Anand, Institute for Transport Studies - University of Leeds (ITS - Leeds), Stockholm Environment Institute (SEI), and Tata Energy Research Institute (Teri) for their cooperation.
©Association for European Transport and contributors 2006
5 BIBLIOGRAPHY
AXHAUSEN, K. W. (2000) Geographies of Somewhere: A Review of Urban
Literature. Urban Studies, 37, 1849–1864. BOARNET, M. G. (2000) Do Highways Matter? Evidence and Policy Implications of
Highways' Influence on Metropolitan Development. Discussion Paper Series. BOUSTEDT, O. (1975) Gedanken und Beobachtungen zum Phänomen der
Suburbanisierung, Hannover, Forschungs- und Sitzungsberichte der Akademie für Raumforschung und Landesplanung, 102.
BRAKE, K., DANGSCHAT, J. S. & HERFERT, G. (2001) Suburbanisierung in Deutschland. Aktuelle Tendenzen, Opladen, Leske + Budrich.
BREHENY, M. (1996) Centrists, Decentrists and Compromisers. Views on the Future of Urban form. IN JENKS, M. (Ed.) The compact city –a sustainable urban form? 1. ed. London, Spon.
BRONGER, D. (2004) Metropolen, Megastädte, Global Cities. Die Metropolisierung der Erde, Darmstadt, Wissenschaftliche Buchgesellschaft.
BURCHELL, R. W., LOWENSTEIN, G., DOLPHIN, W., GALLEY, C. C., DOWNS, A., SESKIN, S. & GRAY STILL, K. (2002) Costs of Sprawl—2000, 74, Transportation Research Board – National Research Council.
CLIFFORD, S., BLACKLEDGE, D., MAY, T., JOPSON, A., SESSA, C. & HAON, S. (2005) PLanning and Urban Mobility in Europe - DELIVERABLE 11: Final Report, Project Contract No: EVK4-CT-2002-20011.
DUANY, A., PLATER-ZYBERK, E. & SPECK, J. (2000) Suburban Nation. The Rise of Sprawl and the Decline of the American Dream, New York, North Point Press.
EWING, R. (1997) Is Los Angeles-Style Sprawl Desirable?” Journal of the American Planning Association, 63, 107–126.
FAZAL, S. (2001) Land re-organization in relation to road in an Indian city. Land Use Policy, 18, 191–199.
GORDON, P. & RICHARDSON, H. W. (1997) Are Compact Cities a Desirable Planning Goal? Journal of the American Planning Association, 63, 95–106.
HESSE, M. (2001) Mobilität und Verkehr im suburbanen Kontext. IN BRAKE, K., DANGSCHAT, J. S. & HERFERT, G. (Eds.) Suburbanisierung in Deutschland. Aktuelle Tendenzen. Opladen, Leske + Budrich.
HICKMAN, R. & BANISTER, D. (2005) Reducing Travel by Design: What About Change Over Time? IN WILLIAMS, K. (Ed.) Spatial planning, urban form and sustainable transport. Aldershot, Ashgate.
HULSE, L. J. & ZEIGLER, C. (1991) The suburbanization of Indianapolis. An Outline of Metropolitan Development in Marion County, 1830-1980, Indianapolis, POLIS Research Center, IUPUI.
IAQUINTA, D. L. & DRESCHER, A. W. (2000) Defining periurban: Understanding Rural-Urban Linkages and Their Connection to Institutional Contexts. 10th World Congress of the international Rural Sociology Association. Rio de Janeiro.
IRMA (2005) PERIURBAN Deliverable 3: Institutional Mechanism: Background Paper, Anand, Institute of Rural Management.
KLAASSEN, L. H., BOURDREZ, J. A. & VOLMULLER, J. (1981) Transport and reurbanisation, Aldershot, Gower.
KNOFLACHER, H. (1996) Zur Harmonie von Stadt und Verkehr, Wien, Böhlau. KÖLBL, R. (2000) A bio-physical model of trip generation/trip distribution.
Department of Civil and Environmental Engineering. Southampton, University of Southampton.
©Association for European Transport and contributors 2006
KÖLBL, R. & HELBING, D. (2003) Energy laws in human travel behaviour. New Journal of Physics, 5.
KUTTER, E. (1991) Verkehrsintegrierende räumliche Planungsinstrumente, Bonn. MARTENS, M., PEDLER, A. & PAULLEY, N. (2002) The Assessment of Integrated
Land Use and Transport Planning Strategies. TRL staff paper. TNO Inro and TRL Limited.
MAY, A. D. & ROBERTS, M. (1995) The design of integrated transport strategies. Transport Policy, 2, 97.
MILLER, D. (2004) Local Innovations in Controlling Sprawl: Experiences with Several Approaches in the Seattle Urban Region. IN RICHARDSON, H. W. & BAE, C.-H. C. (Eds.) Urban sprawl in Western Europe and the United States. Aldershot, Ashgate.
MISRA, R. P. (1998) Million cities of India, New Delhi, Vikas. MOKHTARIAN, P. L. & CHEN, C. (2004) TTB or not TTB, that is the question: a
review and analysis of the empirical literature on travel time (and money) budgets. Transportation Research Part A – Policy and Practice, 38, 643–675.
MORELLO, J., MATTEUCCI, S. D., BUZAI, G. D., BAXENDAL, C. & RODRÍGUEZ, A. (1998) Aplicación de la tecnología SIG para el análisis del soporte biofísico en áreas metropolitanas como herramienta de planificación: El caso de Buenos Aires. IN MATTEUCCI, S. D. & BUZAI, G. D. (Eds.) Sistemas ambientales complejos: Herramientas de análisis espacial. Buenos Aires, University of Buenos Aires Press.
MORGAN, D. R., ENGLAND, R. E. & PELISSERO, J. P. (1999) Managing Urban America, Chatham, Chatham House Publishers.
NEWMAN, P. (2001) Walking in Historical and International Context - What is the Role of Walking in Cities for 21st Century Economies? Australia: Walking the 21st Century. Perth.
PRUD'HOMME, R. & NICOT, B.-H. (2004) Urban Sprawl in Rennes and 77 Urban Areas in France, 1982–1999. IN RICHARDSON, H. W. & BAE, C.-H. C. (Eds.) Urban sprawl in Western Europe and the United States. Aldershot, Ashgate.
RICHARDSON, H. W. & BAE, C.-H. C. (2004) Urban sprawl in Western Europe and the United States, Aldershot, Ashgate.
RICHARDSON, H. W. & BERTAUD, A. (2004) Transit and Density: Atlanta, the United States and Western Europe. IN RICHARDSON, H. W. & BAE, C.-H. C. (Eds.) Urban sprawl in Western Europe and the United States. Aldershot, Ashgate.
SCHAFER, A. (1998) The global demand for motorized mobility. Transportation Research/A, 32, 455–477.
SCHAFER, A. (2000) Regularities in Travel Demand: An International Perspective. Journal of Transportation and Statistics.
SCHWANEN, T., DIJST, M. & DIELEMA, F. M. (2005) The Relationship between Land Use and Travel Patterns: Variations by Household Type. IN WILLIAMS, K. (Ed.) Spatial planning, urban form and sustainable transport. Aldershot, Ashgate.
SUDHIRA, H. S., RAMACHANDRA, T. V. & JAGADISH, K. S. (2003) Urban sprawl pattern analysis using GIS, Bangalore, Centre for Ecological Sciences.
SUDHIRA, H. S., RAMACHANDRA, T. V. & JAGADISH, K. S. (2004) Urban sprawl: metrics, dynamics and modelling using GIS. International Journal of Applied Earth Observation and Geoinformation, 5, 29–39.
TERI (2005) PERIURBAN Deliverable 6: Policy Recommendation, New Delhi, Tata Energy Research Institute (Teri).
©Association for European Transport and contributors 2006
©Association for European Transport and contributors 2006
THIRUMURTHY, A. M. (2005) PERIURBAN Deliverable 2: Socio-economic Conceptual Frame Work (WP2), Chennai, Division of Urban Systems Development, Anna University.
TIMMS, P. & HODGSON, F. (2005) Transport and peri-urban communities in India (WP5 deliverable), Leeds, Institute for Transport Studies, University of Leeds.
U.S. ENVIRONMENTAL PROTECTION AGENCY (2004) Nonroad Engines, Equipment and Vehicles.
VAN DEN BERG, L. (1989) Urban systems in a dynamic society, Aldershot, Gower. ZAHAVI, Y. (1981) The UMOT-Urban Interactions, Washington, DC, U.S.
Department of Transportation.