Embed Size (px)
DESCRIPTION
perloff method
Citation preview

7/17/2019 Perloff
http://slidepdf.com/reader/full/perloff 1/57
STRESS
DISTRIBUTION
WITHIN AND
UNDER
LONG
ELASTIC
EMBANKMENTS
JUNE,
1967
NO.
14
PURDUE
UNIVERSITY
LAFAYETTE
INDIANA
' 7777 ^^S^K

7/17/2019 Perloff
http://slidepdf.com/reader/full/perloff 2/57
7/17/2019 Perloff
http://slidepdf.com/reader/full/perloff 3/57
Research Report
STRESS
BISTRIBUTKM
WITHXH
AND UHDBB
LCK3
ELASTIC BffiABKMEKES
So:
Dr.
G.
A.
Leonards,
Director
Joint
Highway Research
Project
From:
H»
L.
Michael,
Associate
Director
Joint Highway
Research
Project
June
20,
1967
File;
6-6-6
Project:
CE-3S-5?
hed report entitled
Stress Distribution
Within
and
Under
Long
Elastic
Embankments
describes one
phase
of
the
project
concerning
long-tes ormations
of compacted
cohesive
soil embankments.
The
re-
port
was
prepared by
Professor
W.
H.
Perloff,
Research
Engineer,
Mr.
S.
Y.
Baladi, Research
Assistants
and
Professor
M.
E.
Harr.
The
report
presents
diagrams
of
the
distribution
of
stresses
within
and under
long
elastic
embankments continuous with
the
foundation
material.
The si;;
nt
differences
in
the magnitude
and
distribution
of
the stresses
from
those
usually
assumed
are discussed.
Respectfully submitted.,
Harold
L.
Michael
Associate
Director
HLM:i
•
Attachment
Copy: F. L.
Ashbauehez
W. L.
Dolch
W.
H.
Goetz
W.
L.
Greece
G. K.
Hallock
R. H-
Harrell
V.
E.
Harvey
J.
F.
McLaughlin
F.
E.
Mendenhall
R. D.
Miles
J.
C.
Oppenlander
C.
F. Scholer
M. B. Scott
W.
T.
Spencer
F.
W.
Stubbs
E.
R.
J.
Walsh
K.
£» Woods
E.
J. Yoder

7/17/2019 Perloff
http://slidepdf.com/reader/full/perloff 4/57
Research Report
STRESS
DISTRIBUTION
WITHIN
AND
UNDER
LONG
ELASTIC EMBANKMENTS
by
W.
H. Perloff
,
Associate Professor
of
Soil Mechanics
G.
Y.
Baladi, Graduate Research Assistant
M.
E.
Karr,
Professor
of
Soil
Mechanics
Joint
Highway
Research Project
Project:
CE-36-5F
File
:
6-6-6
Prepared
as Part
of
an
Investigation
Conducted
by
Joint
Highway
Research Project
Engineering
Experiment
Station
Purdue University
in
cooperation
with
the
Indiana
State
Highway
Commission
and
the
U.S. Department of
Transportation
Federal
Highway Administration
Bureau of Public
Roads
The
opinions,
findings
and
conclusions expressed
in
this
publication
are
those
of the
authors
and
not
necessarily
those of
the
Bureau
of
Public
Roads.
Not
Released for
Publication
Subject to Change
Not
Reviewed By
Indiana State Highway Commission
gr
the
Bureau of Public
Roads
Purdue University
Lafayette, Indiana
June
20,
1967

7/17/2019 Perloff
http://slidepdf.com/reader/full/perloff 5/57
ABSTRACT
The distribution
of
stresses
withia and under long elastic
embankments continuous
with
the underlying material
is
presented.
The
magnitude
and
distribution
of
stress
in
the
foundation
material
in the vicinity of the
embankment is
significantly
different
from
that predicted by
the usual
assumption
of
stress proportional to
embankment
height applied
normal
to the
foundation.
Influence
charts
for
a
variety
of embankment
shapes
are given.

7/17/2019 Perloff
http://slidepdf.com/reader/full/perloff 6/57
Digitized
by
the
Internet
Archive
in
2011 with
funding
from
LYRASIS members
and
Sloan
Foundation;
Indiana Department of Transportation

7/17/2019 Perloff
http://slidepdf.com/reader/full/perloff 7/57
BERODUCTIGN
The distribution of
stresses
within
and
under earth
embankments
due
to
the
embankment
weight,
is
of
interest
to civil
engineers
in
a
variety
of
applications,,
Consideration
cf
deformations
within
embank-
ments, analysis
of stability, consolidation
of
underlying compressible
materials, all require determination
of
the
distribution
of
these
stresses
At
the
present
time there is no means
available
by
which
a
closed-
#
form
solution
for such
stresses can be
obtained.
Consequently,
various
approximations
of
the real
problem
have been made,
with
the
objective
of
obtaining at least
an
estimate
of
the
stresses.
The
first
such
effort
was made
by
(BROTHERS
(1920).
He
analyzed the stresses within an homo-
geneous,
isotropic
elastic
half-space
resulting
from
a long embankment
loading. It
was assumed
that the
load
was
applied
normal
to
the
boundary
with
a
magnitude proportional
to
the height of
the embankment. These
results were presented in tabular form by JURGENSCH
(1937)
.
OSTERBERG
(1957)
superimposed
solutions
given
by
NE8MARK
(19^0,
I9U2) to
develop
an
influence
chart for the determination
of
the magnitude
of
vertical
stresses
induced in
an elastic half-space
by
a
long
embankment
loading
with
a
variety
of
cross
sections.
Again,
the
magnitude
of
the
pressure
was
assumed to be proportional
to
the
embankment
height
and
applied
normal
to the
surface
of
the foundation
material.
This normal
loading
approxi-
mation
to
the
actual embankment loading
is
illustrated
in
Figure
la.
TERZAGHI
(19^3)
described an
effort
to
evaluate
the
shear
stresses
transmitted
to
the
foundation
material
by an embankment
made
by
RMDULXC

7/17/2019 Perloff
http://slidepdf.com/reader/full/perloff 8/57
WV^WV^ASX^
L
^WAVV/WAWXVAVVI
.V
v
'
v
'->.
(a)
Long
Symmetric
Elastic
Embankment
Continuous With Foundation
^X/AVV/VWAVVAVV/av^AvV^^
(b)
Normal
Loading
Approximation
Fig.
I
-Problem Considered

7/17/2019 Perloff
http://slidepdf.com/reader/full/perloff 9/57
(1936).
It
was
assumed that the embankment
material
was
on
the verge
of
failure
and thus
the shearing
resistance
of
the embankment
was
fully
mobilized
in
order
to
maintain
equilibrium.
Consequently,
TERZ&GHX
(19**3)
suggested that
the magnitude
of the
computed
shear stress
at
the base
was
likely to be lower than
the actual in-situ stresses,
TROLLOPE
(1957),
and
DAVIS and
TAYLOR (I962)
considered
the state
of
stress within
a
granular
embankment
resting
on
a
foundation
which
yielded
an
arbitrary
amount
.
Ho attempt
was
made
to compute the amount
of
founda-
tion movement which would
be
created
by
the
embankment.
FUSS
(i960)
suggested
the
use
of the Schwarz-Christoffel
transforma-
tion
to
map
the
embankment surface into
a
straight
line, thereby
utilizing
the distribution of stresses within
a
semi-infinite
elastic
medium.
How-
ever,
he did
not
carry out
the
suggested procedure
<>
Numerical methods
have been used
to
obtain,
for
particular
cases,
solutions
for
the
stress
distribution
in
an
elastic
embankment
resting
on
elastic
or
rigid
foundations
.
ZIENKIEWICZ (19U7) used
a
finite difference
approach
to
analyze
the
stress
distribution
within
a
triangular gravity
dam
resting on
an elastic foundation
„
This
was
extended
by
ZIENKDMCZ
and
GERSTNER
(1961)
to
the
case
in
which
the foundation
modulus
differed
from
that
of the
dam,
DBJGKALL
and
SCEIVNER
(195U) applied
the
method
of
finite differences to the
solution
of
an
embankment on
a
rigid
foundation
CARLTON
(1962)
used a similar
method
to
study an elastic embankment contin-
uous
with
an
elastic foundation.
The finite
element method
of
numerical
analysis
has been
applied by
ZISNKIEWICZ and
CHBUBG
(1964,
1965)
in
the
study
of
stresses within
but-
tress
dams
resting on elastic foundations .
CLOUGH
and CHOPRA
(1966)
and

7/17/2019 Perloff
http://slidepdf.com/reader/full/perloff 10/57
FIHN
(1966),
respectively, have
also
applied the
finite
element method
to
the study
of
a
triangular
dam
on
a
rigid foundation
and
a
rock
slope
con-
tinuous with
its
elastic
foundation.
BROHN
(1962)
and GOODMAU
and
BROWN
(1963}
investigated
the
case
of
a
long elastic slope constructed
incrementally;
it
is not clear
to
what de«
gree
their
results are
influenced
by
the
fact
that compatibility
is
not
satisfied
by
their solution
method
In
each
of
the
cases
approached
by numerical
methods,
the solution
was
either
restricted to a
single
embankment
cross
section
or a
complete
stress
picture
was
not obtained
.
Thus, despite numerous
attempts
to
determine
the
distribution
of
stresses
within
and under
an
embankment,
no
closed-form
solution is presently available
.
It
is
the
objective
of
this paper to
present such
a
solution.
ergblem CONSIDERED
The
problem
considered herein is
the
determination
of
the
distribution
of
stresses
within
and
under
an
embankment
resulting
from
the
self-weight
of
the
embankment.
The embankment
is
shown schematically
in
Figure
lb» It
is
assumed
that
the
embankment and the foundation
material with
which
it
is
continuous, are
composed
of homogeneous,
isotropic,
linear
elastic
material.
Further, the
embankment
is
assumed
to
be
sufficiently long
so
that
plane
strain
conditions
apply.
The
shape
of
the
symmetric cross
section
is
defined
by the
slope angle
a
and
the
ratio of
the
half
-width of
the
top
of
the
embankment, L, to the embankment
height,
H.
The
solution
is
obtained
by
transforming
the
region of
the
embankment
where the
solution is
unknown,
into
a
half-space where
the
solution
can
be

7/17/2019 Perloff
http://slidepdf.com/reader/full/perloff 11/57
found.
Application of
the
Cauehy
integral
formula
to the
boundary condi-
tions
permits
determination
of
the
stresses.
An
outline of the method is
given in
Appendix 1.
KSSULTS AND DISCUSSION
Vertical Normal
S
tress
A
typical
result
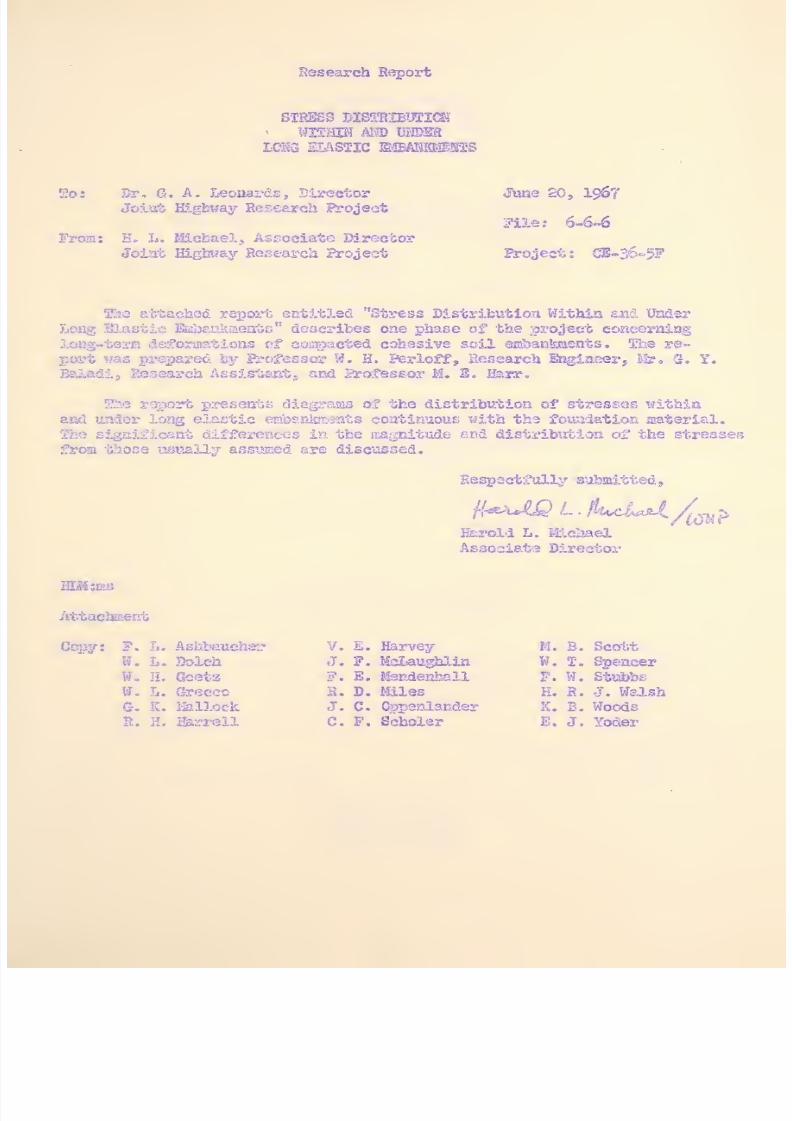
is illustrated in Figure 2.
This figure shows
contours of
the
vertical normal
stress
in
dlmensionless
form,
o^/yH,
for
an
embanlsment with
a
*
U5
,
L/H
«
3?
and
Poissoa°s ratio,
u
®
0.3.
The
contour
lines show
only the effect
of
the
embankment
weight. Thus,
at
depths
below
the
base
of
the
embankment
(y/H
«
0)
the material
is
assumed
weightless.
The
effect
of
the
medium
weight
can
be superimposed
upon
these
values
to give
the
total
stress
acting
at
a
point. The
two
dashed lines
in
Figure
2
show
stress contours, in
terms
of
Oy/VH,
for
the
usual
normal loading
approximation
corresponding to this
embankment. These
indicate that
the vertical normal stresses
produced in
the foundation
mater-
ial below the elastic embankment are generally smaller than computed
for
the
normal
loading
approximation.
The
stress distribution
due
to
the
normal loading
approximation is
independent
of
Poissca
:
s
ratio; the
stresses
due
to
the elastic
embankment
are
dependent
upon
jx.
However,
the vertical stresses are
insensitive to
its magnitude;
changing
n
from
0.3
to
0.5
changes the
vertical
stress
at
a
point
by
less than
five per
cent.
The
effect
of embankment shape
on
the vertical
stress
along vertical
sections
through
the center
line
of
the
embankment and
the toe
of
the
slope,
7/17/2019 Perloff
http://slidepdf.com/reader/full/perloff 12/57
123456789
/H
Fig.
2-Confours
for
Vertical
Stress
10

7/17/2019 Perloff
http://slidepdf.com/reader/full/perloff 13/57
is
illustrated in
Figure
3,
for
a
»
1+5°
and
u
*
0.3.
The
figure
is
a
composite
diagram
shoving
the
embankment schematically,
and
the
magnitude
of
the vertical
stress
at each
section
as a
function
of
depth. Clearly,
the
L/H
ratio has
a
pronounced
effect on
the distribution
of vertical
stress.
As
L/H
decreases, the
stress decreases.
Furthermore, a
smaller
L/H
ratio produces a
more
rapid
dissipation
of
stress with depth.
The
dashed
lines
show
the vertical normal
stress
for
the normal
load-
ing
approximation
equivalent
in shape
to
the
embankment for which
L/H
a
1.
As
indicated
in
Figure
2,
the vertical
stress
for the
corresponding
elastic
embankment
is
smaller.
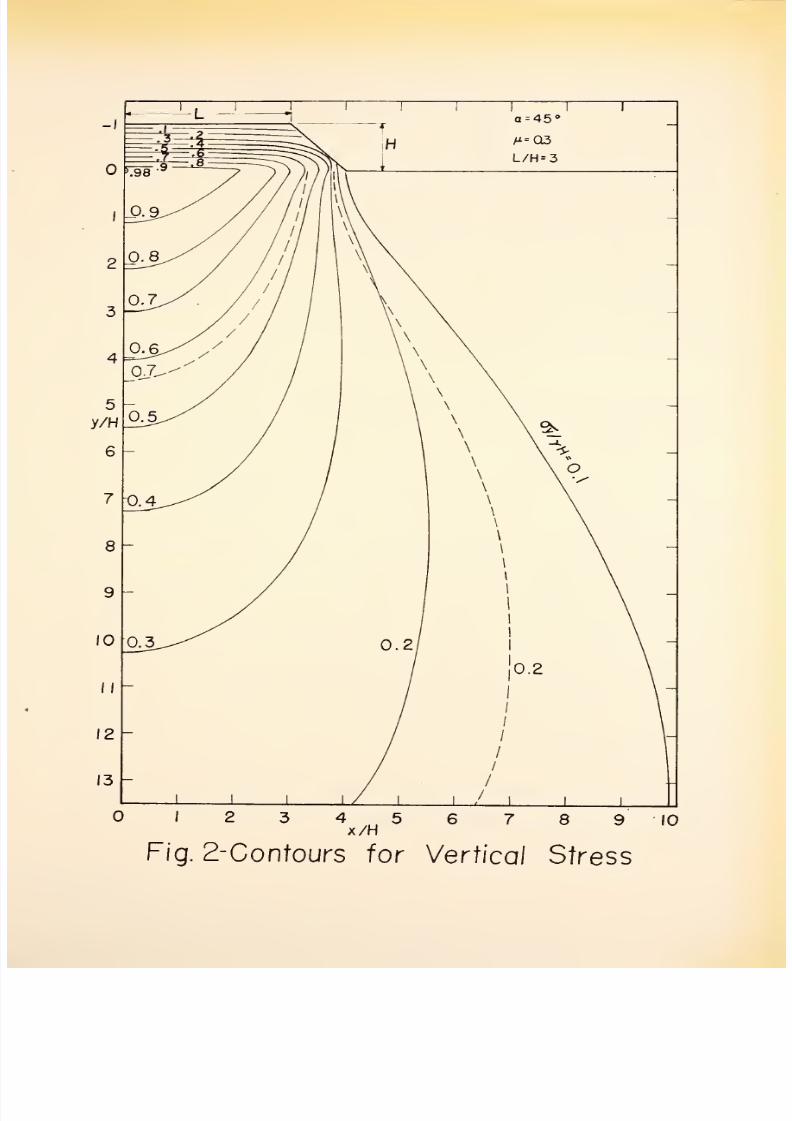
Figure k shows
the
distribution
of
vertical normal
stress
along the
base
of
the
embanloaent
for
u
»
0.3,
four
values
of
a,
and
several embank-
ment shapes
shown
schematically
in
the
figure.
The curved solid
lines
represent the distribution
of
stress
against
the
base;
dashed
lines show
the
distribution of
stress assumed
in the
usual normal loading approximation.
The stress distribution is much more uniform under the elastic
embankment
than is
ordinarily assumed. The
difference
becomes
especially
apparent
as
the
L/H
ratio
of the
steeper embankments
decreases.
Moreover,
the magni-
tude of the
stress
under the
central
zone
of the
elastic
embankment
is
less
than
that shown
by
the dashed
curves.
Again the
effect is
enhanced
for
narrow,
steep
embankments
(for
a
s
45°
and
L/H
s
the
vertical
stress is
only
65
per
cent
of
that
usually
assumed)
In
order
to satisfy
equilibrium,
the
areas
under corresponding
dashed
and
solid
curves must be the same.
Hence
the difference between
these curves
becomes
less pronounced,
at
least
near the
central
portion
of
the
embankment,

7/17/2019 Perloff
http://slidepdf.com/reader/full/perloff 14/57
1
1 1
1
L
1 1
_l
1
my/iWA^A^AV/AN^Ay/AW
11
H
1
/
y y
/
-q
s
>^w/sW//&y/s&>ti
/
/
/
l'\
mr
a=
45°
1
/
/
/
///•
1
-
A
^
=
0.3
/
/
z'
//
/
\\\
/0.0/0.5/
/
/
/
\\\
2
///
'V /
2-
/
3
-
/ /
/
/
r
1
3-
0/
\
/
/
/
/
L/H
*
5
W
1
CM
j
4
///
/
/
/
4-
;
5
-
1
/
/
/
/ /
5-
ill 1
-
y/H
/
/
/
/
/
1
6
-
1 /
/
/ /
6-
-
III
III
j
III
/
/
'
1
7
1
/'
/
/
7-
'
1
8
/
/
/
8-
L/H
=
5
9
1
1
/ /
9
'
io-
1
1
'
/
/
10
'
II-
\9
-
liil
1/
1 1
II
1?
L
ill 1
lz
o
.2 .4
.6 .8 1.
l2
o
2
.4
.6
cr./yH
<r_/
y
H
(a)
At
Centerline
(b)
At Toe
of
Slope
Fig.
3
-
Distribution
of
Vertical
Stress
Along
Vertical
Sections
for
Varying
L/H
Ratios
7/17/2019 Perloff
http://slidepdf.com/reader/full/perloff 15/57
Fig.
4
-
Distribution
of
Vertical
Normal Stress,
a,
fy-W
On
The Base
of
The
Embankment
For
Varying
oc,
And
L/H
Ratios
7/17/2019 Perloff
http://slidepdf.com/reader/full/perloff 16/57
as
L/H
increases
o
However
,
near
the
oister
edge
of
the embankment,
the
stresses are
still significantly
larger on
a
proportional
basis, than
indicated by
the normal loading approximation. Thus,
for
embankments
with
moderate
L/H ratios, the
normal loading approximation
leads to
lar-
ger
estimates
of
differential settlement,
assuming one-dimensional
com-
pression.,
than
would be
computed
by
the
method
presented
herein.
Horizontal
Norma
l
Stress
on
iijiii
i
iii
jti
fi
iimia i irnii
fin
i
n an.
1
^t
osnc—
w
t»
Contours
of
horizontal normal
stress,
0/7H,
for
a
»
U5
,
L/H
»
3
and
u
s
0.3
are shown
in Figure
5„
The
dashed lines
are contours
deter-
mined from, the
usual
normal loading
approximation. The
stresses shown are
those
due to
the
embankment
only.
The
figure
shows
that
the
maximum
hori-
zontal stress
occurs
within
the
body
of
the
embankment
and
decreases with
increasing depth.
In
the
foundation
material
in
the
vicinity of
the elastic
embankment,
0L/7H
is
less
than
half of
that
usually
assumed
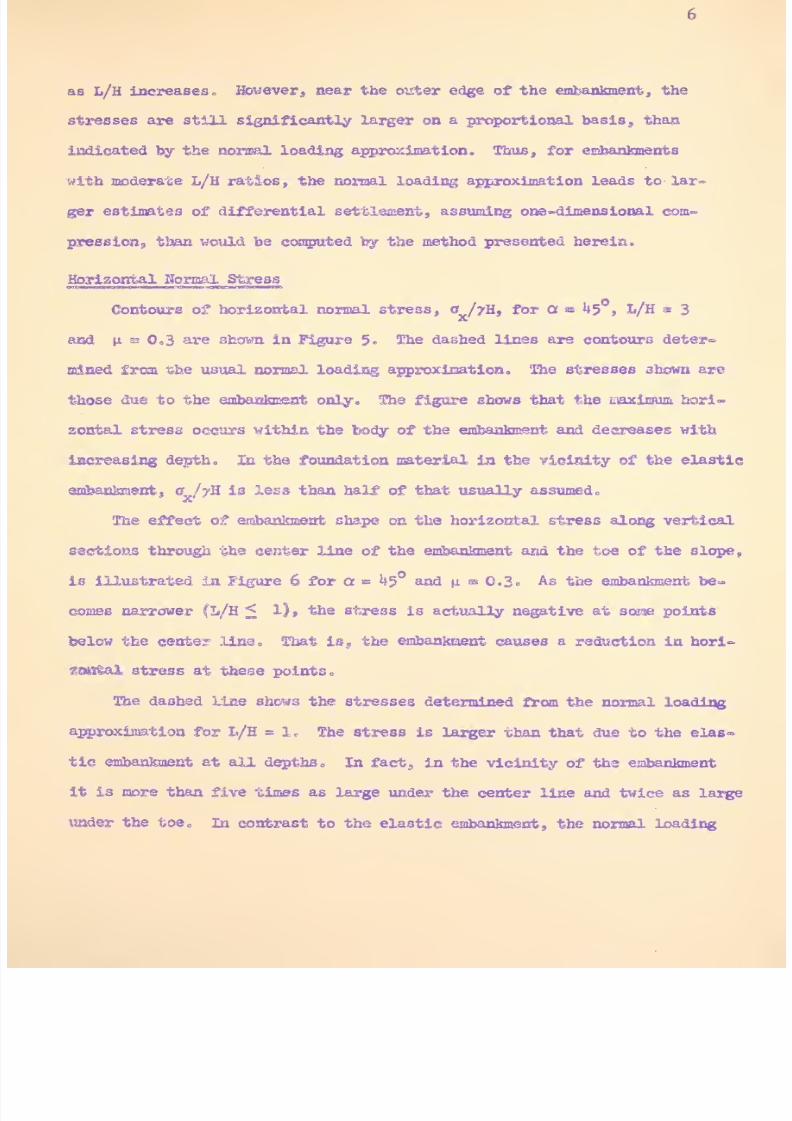
The
effect
of embankment
shape
on
the horizontal
stress along
vertical
sections
through
the
center
line
of
the
embankment and
the
toe
of
the
slope,
is
illustrated in
Figure
6
for
a
=
k$°
and
|i
**
0.3
°
As
the
embankment
be-
comes
narrower
(L/H
<
1),
the
stress
is
actually
negative
at
some
points
below the
center
line. That
is,
the
embankment
causes
a
reduction in hori-
zontal
stress
at
these points.
The
dashed
line shows
the
stresses
determined
from
the normal
loading
approximation
for L/H
»
1.
The
stress
is
larger than that
due
to
the
elas-
tic embankment at all
depths.
In
fact,
in the
vicinity of the
embankment
it is more than
five times
as
large
under the
center line and twice
as
large
under
the
toe.
In
contrast
to
the
elastic
embankment,
the normal
loading

7/17/2019 Perloff
http://slidepdf.com/reader/full/perloff 17/57
12
3
4
5
6
7
x/H
Fig. 5-
Contours
for
Horizontal
Stress
8
7/17/2019 Perloff
http://slidepdf.com/reader/full/perloff 18/57
.2
.
u
4
(a)
At
Centerline
(b),
At
Toe
of
Slope
Fig.
6-Distnbution
of
Horizontal
Stress
Along
Vertical
Sections
for
Varying
L/H
Ratios
7/17/2019 Perloff
http://slidepdf.com/reader/full/perloff 19/57
approximation
does
not
produce
negative horizontal stress
at
any depth.
The
reason
for
this
difference
becomes
apparent
when
the shear
stresses
transmitted
by
the
embankment
to
the foundation material
are considered.
This
is discussed
below.
The effect
of
Poisson's
ratio
on
the horizontal stress is
illustrated
in Figure
?.
This
figure
shows
the
horizontal stress
along
vertical
sec-
tions through the centerline
and
toe
of
the
embankment
for
a
«
1*5°
and
u
ss
0.5.
The
dashed
line
shows
the
stress due
to
the normal
loading
approxi-
mation
for
L/H
s
1.
Comparison
with
Figure
6
indicates
that
a
change
in
Folsson
e
s ratio
from
0.3
to
0.5
changes the stress
at
shallow
depths
below
the
central
portion
of the embankment
by
as
much
as
a
factor of
three. The
difference decreases
as
the L/H ratio increases
„
The
influence of
u
is
less
pronounced
balow
the
toe than
below
the center
line.
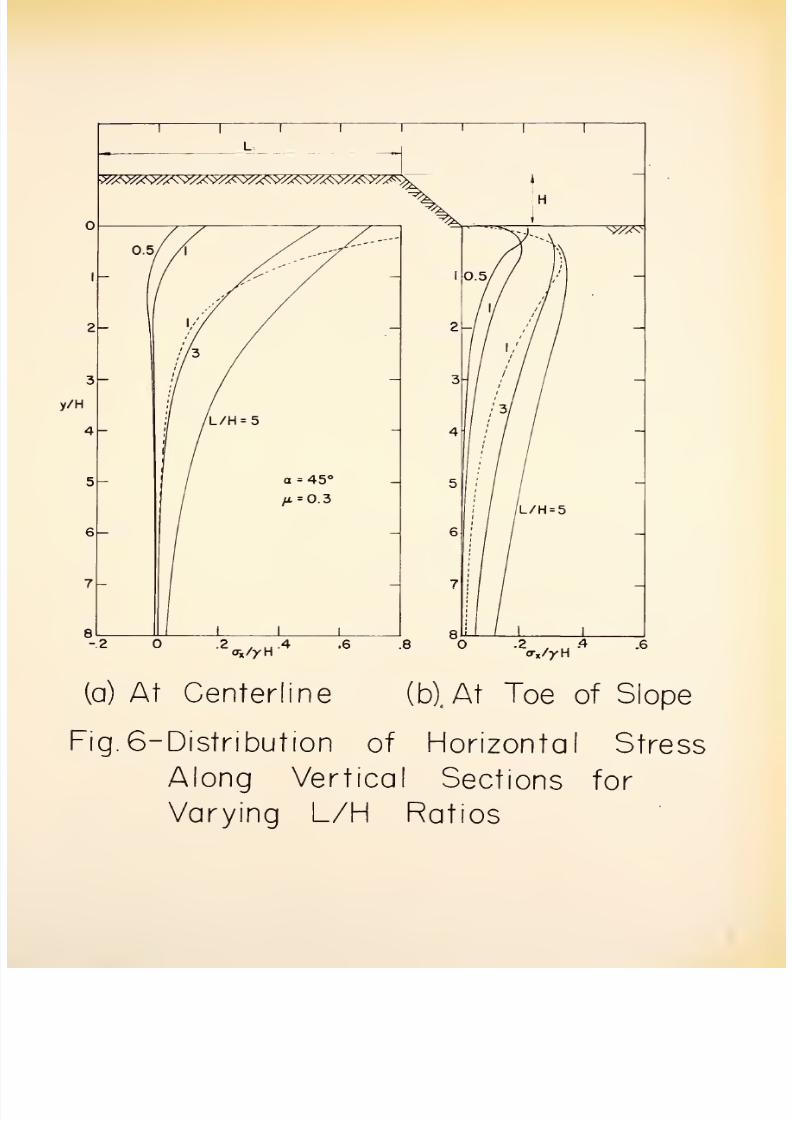
Horizontal
and
Vertical
Shear
Stress
Contours
of
horizontal and vertical shear
stress,
T/7H,
are
shown
in Figure
8,
for
a
=
h5° and
L/H
*
3.
The solid contours are for
Poisson
,,
s
ratio of
0.3*
The long
dashed
contours
are
for
n
«
0«5>
aaad
short
dashed
lines are
for
the
normal
loading approximation.
The
figure indicates
the
existence
of
horizontal shear
stresses
within
the
body
of
the
embankment,
increasing
to
a
value
at the
base near the
toe
of
the
slope,
in
excess
of
0.2
yH.
However, the
maximum
value of horizontal shear
stress
(approxi-
mately
0.3
7H) occurs
below the
base
of
the
embankment.
Like
the horizontal normal stress,
the
shear
stress, t
,
is affected
xy'
markedly
by the magnitude
of
Poisson
8
s
ratio.
However,
the
effect observed
depends
upon the
position
of
the
point considered,
relative
to
the
base
of

7/17/2019 Perloff
http://slidepdf.com/reader/full/perloff 20/57
y/w/w//s>y/&/Ay//s///>y/A<y/
t<y//c>yA
y/H
4
(q)
At Centerline
(b)At
Toe
of
Slope
Fig.
7—
Distribution
of
Horizontal
Stress
Along
Vertical
Sections
for
Varying
L/H
Ratios
7/17/2019 Perloff
http://slidepdf.com/reader/full/perloff 21/57
y/H
to
12
13
^i
=
0.5
Normal Loading Approximation
10
Fig.
8-
Contours
of
Shear Stress,
~C
:

7/17/2019 Perloff
http://slidepdf.com/reader/full/perloff 22/57
8
the
embankment.
In the
zone
below the eaibankment
to
a
depth of y/H
equal
approximately
two
or
three,
the
shear stresses
in
the
incompressible
ma-
terial
(n
*
0.5)
are
less than
for the
case
in
which
u
»
0.3.
At
greater
depths, the
reverse is
true.
The
shear
stress determined
from
the normal
loading
approximation
is less
than
that
for
either
u
above
a
depth factor
of approximately three
to
five,
and
more at greater
depths
.
The
magnitude
of this
effect
depends
upon
the
horizontal
location
considered,
as
shown
in the
figure,,
The
normal
loading
approximation
assumes that there
is no
shear stress
at
the
base
of
the embankment. Figures 3
and
9
indicate
that,
for
the elas°
tic
embankment, this assumption
Is
not
reasonable.
Figure
9
shows the
hori-
zontal
shear stress,
T-V7H,
at
the
base
of
the
embankment
for
u
«
0.3*
four
values
of
a,
and a
variety
of
embankment shapes
shown schematically
in
the
figure.
The horizontal shear
stress
is zero at the
centerline,
as
required
by
symmetry,
and
reaches
a
maximum
near the toe
of
the
slops. The
magnitude
of
the
maximum
and
its location
depend
upon
a
and the
embankment
shape
As
L/H
decreases
for
a
given
a,
the vsaximm.
T^/yH
increases,
and
moves closer
to
the toe
of
the slope. The magnitude of the increase
is
slight
for
a
-
15
degrees,
but
becomes
more significant
as
a
increases,
Bote that
a
maximum
i~Ji&
ia
excess
of
Q.k implies that the
horizontal
shear
stress
at the
base
of
a
forty
foot
high
embankment
may be
greater
than
one
ton per
square
foot
(unless
the
shear
strength of
the
material is
such
that
failure is induced).
To
assist
the
designer
in
evaluating the
significance of
these
results
to
his
particular
problem, influence
diagrams
for
vertical normal,
horl»
zontal normal
and
shear stress
distribution
for
a
variety
of
cases
are

7/17/2019 Perloff
http://slidepdf.com/reader/full/perloff 23/57
Fig
9-
Distribution
ot
Shear Stress,
T,,/jrH
On
The
Base
of The
Embankment For
Varying
a,
And L/H
Ratios

7/17/2019 Perloff
http://slidepdf.com/reader/full/perloff 24/57
Maximum Shear
Stress
It
is
often
useful to
consider
whether
the
maximum
{i
e.,
principal)
shear
stress,
i^^/rH,
at
any
depth
beneath
the
embankment
exceeds
the
a
available
shear
strength.
Thus,
it
is
desirable
to
know
the
magnitude
and
distribution
of
maximum
shear
stresses
due
to
the embankment.
Contours
of
^jjQx/yH
are shown
in
Figure K) for the embankment
section
of
Figures
2,
5
and
80
Note
that
the
magnitude of
t
transmitted
from
the
embankment
^^
max
to
the
foundation
material
is approximately
0,25
7H
at
the
base
of
the
em-
bankment in the
vicinity
of
the
toe. However,
the
largest shear
stress,
Oo337H,
occurs
beneath
the
center line
at
Y/H
2=
1.8. It is
also interest-
ing
to
observe that within the embankment,
the
maximum
shear stresses
are
larger
near
the
top
than
in the mid-depth
region,
and
that
they
increase
again
as
depth increases. This
is
believed due
to the
relatively
large
horizontal stresses
which
are
induced
by
the deformation mode
of
the em-
bankment
(cfo
Figure
5)0
Two
contours of
^-^v/yH
for
the
normal loading
approximation
corre-
sponding to the
embankment considered
are
shown
in
Figure 10
as dashed
lines
c
They indicate
a
shear
stress less than
that
produced by
the
elas-
tic
embankment
in a
shallow
zone
below the embankment, but
larger
shear
stresses
at
depth
Data
for
a
variety
of
embankment
shapes,
with
u
0.3»
and
a 9
15°,
30°,
U5
,
60°
and
75°
are
shown
in Figures 11 to
15,
respectively.
In
these
figures
,
the
maximum value
of
t^
at
a
particular depth
is
plotted
as
a
function of
depth
for
various
L/H
ratios
„
The
horizontal location
of
the
point
at
which
this
maximum
value
occurs
is
-also
shown
.
It
can
be

7/17/2019 Perloff
http://slidepdf.com/reader/full/perloff 25/57
I
2 3
4X/H5
67
8
9
Fig.lO-Contours
for
Max.
Shear
,r
max/YH

7/17/2019 Perloff
http://slidepdf.com/reader/full/perloff 26/57
in
6
b
x
S
«
E
I-
-
1
1 1 1
1
i
1
in
ii
I
-
^
_i
-___to
— ^-—
—
^^=^
^
^^>6^^
-
o^^^
1
I
1
i
1
CJ
to
X
in
(D
oo
E
3
«*
F
rO
X
O
o
ii
c
^—
=1
o
«_
i—
o
o
3
o
M—
2°
-
£Z
JZ
o
H
CD-
o
CD
o
Q
o
_l
M—
O
~o
cz
d
D
o
H
o
CD
c
O
Z3
Z3
U_
D
2
C
&
CP
o
I
O
S
i
CO
o
^-^
^^~
X
CD
Z5
X
Fig
b
y

7/17/2019 Perloff
http://slidepdf.com/reader/full/perloff 27/57
c
o
g
ro
.e
d
x
II
^_
o
H
8
O
O
CL
CD
°
n
o
—1
^
O
^_
g°
o
CD
C
O
=5
3
Li_
-•
1
cn
°
~
O
5,
^
c/)
S
,
^CVJ
^r
3—
X
CD
^
o
3
^
r<l
ii
b

7/17/2019 Perloff
http://slidepdf.com/reader/full/perloff 28/57
X
ro
I
f-
E
E
_£
X
o
2
o
O
o
o
o
o
o
3
o
°
Cl
8
S
O
^
c
o
o
c
O)
o
O
-jz
ZJ o
-•-
c
&L^
<D
o
3
^
°
C
1
(n
o
2
ro
°
y
—
o
<D^
o
LO

7/17/2019 Perloff
http://slidepdf.com/reader/full/perloff 29/57
to
10
*
-
I
X
to
-
CJ
1
1
1
1
1
i
i
-
_
-
Nv
\
M
\
i
\
^
\ _i
-
N
\to
-
io\
\
o\\
|
i\
1 1
i
L
».
I i
(O
o
m
o
X
«*
6
X
O
f-
£
CO
E
o
o
£
X
o
(M
5
O
(M
CJ
to
in
(0
(O
lO
(0
X
£
3
•»
E
ro
X
o
O
O
H
o
u
o
O
o
o
o
o
o
00
1
1
1
1
1
1 1
-
lO
II
I
-
^ --^fO
-
\
lO
^
\—
-___^
-
-
1
1
1
1 1
-
1 1
ID
d
O
CD
%
en
=
D
c
*~>
I
I
Q_
CD
Q
o
o
o
c:
Z5
o
oo
O
°
CD
CD
Z3
cn
k
M
n
O
o

7/17/2019 Perloff
http://slidepdf.com/reader/full/perloff 30/57
E
|
no
x
O
o
n
S
=1
o
o
o
t:
*-
Q_
O
a)
o
LJ
o
O
cz
o
c
o
CD
+r
-o
y
Z3
c
-.-
=5
<D
-
I_L
o
£Z
3
en
C
o
o
2>
o
c/)
i
o
LO
3
1
N-
LO
^
ii
~
X
H
e^
Z5 x
O
Ll_
L2
c:
D

7/17/2019 Perloff
http://slidepdf.com/reader/full/perloff 31/57
10
observed that
in
Figure
11,
that
as
the
L/H ratio
increases
for
a
-
15°,
peak
t
x
increases
in magnitude,
and
acts at
an
increasing
depth
below
the
embankment.
The
horizontal
location
of
the
maximum shear
stress at
a
particular
depth
moves
from
a
position
near the
toe
of
the
slope
im-
mediately
beneath the
embankment
to the
centerline
of the
embankment
at
a
depth
which
depends upon
the
L/H
ratio.
A
similar
trend
is
shown
in Figure 12
for
a
»
30°.
However,
in
Figure
13
(a
*
k$
),
the
largest
shear stress
occurs near
the
toe
of
the
slope
for
L/H
^ 0.0.
Although
the smallest
L/H
ratio shown
in
Figures
Ik and
15
is
0.5,
the
development
of
large shear stress
near
the toe
of
narrow
steep
embankments
is clearly
indicated.
The dashed
line
in Figure
13
shows the
magnitude of
the maximum
t
as a
function
of
depth
for the
normal loading approximation corresponding
to
the
U5
embankment
for
which
L/H
*>
1.
It
is evident that the
peak mag-
nitudes are nearly the
same
for
the two
cases,
but
it occurs
at approxi-
mately
twice
the depth
in
the
case
of the
normal
loading
approximation.
A
similar effect
is
evident in Figure
10
for L/E
a
3.
Thus
the
influence
of
the
elastic
embankment is more pronounced
nearer
the surface
where
softer soils
might be
expected.
As
a
result
,
it
may be
that current
es=
timates
of
stability,
potential creep
and
other
shear
stress
related
phenomena,
for
soils
at
shallow depths beneath
embankments,
are unccnser-
vatlve.
Relationship of
Results
to
In-situ
Stresses
It
is not immediately
clear
what
relationship
these results
have
to
stresses which
actually exist in
the
field.
In
the
case
of
a
built-up

7/17/2019 Perloff
http://slidepdf.com/reader/full/perloff 32/57
u
embankment,
it
is
likely
that
the
embankment material
will
exhibit
sig-
nificantly different
mechanical
properties
from the
foundation
material.
For
a
cut-down
slope,
the assumption
of homogeneity
in
the two
zones may
be more
nearly
justified
.
The
non-linearity
in
the mechanical response
of
most natural materials
will
undoubtedly
also
influence
the
results
However,
the
feature which
may
be most
significant,
at
least
in
the
case
of
built-up
embankments,
is
the
fact
that
they
are
constructed
in
layers
rather than
instantaneously.
Thus
when
the topmost
lift is
placed on
an
earth
embankment,
the
upper
material
does
not
undergo strain
due
to
elastic
deformation
of
the
embankment resulting
from
the
stresses imposed
by
the
entire mass. Rather,
the strains
are due
only to
the
increment
of
stress
imposed
by
this layer.
The degree
to
which the
results would
be
changed
is not
clear.
However,
it
is
believed
that
the
results
presented
herein,
provide
a
more
realistic
estimate
of
stress
conditions
than
that
computed
from
the normal
loading
approximation.
Effect of
Results on
Str
ess Bath
Determination
LAMBE
(196U)
has
suggested
that
the stress path
method for predic-
tion
of vertical
settlements
of
cohesive soils is
superior
to
conventional
analyses
in
cases where
compression
is
clearly
not
one-dimensional.
This
approach
involves
three
basic
steps
(LAMES,
I96U):
1.
Estimation
of
the
effective
stress
path
of
an
average
element
in
the compressible
layer, for
the
field
loading.
2.
Performance of a
laboratory compression
test
which
dupli-
cates, insofar
as
practicable,
the
field
effective
stress
path.
3.
Computation
of
settlement
by
multiplying
the
thickness
of
the
layer considered by
the
axial
(vertical) strain
from
the
laboratory
test.
7/17/2019 Perloff
http://slidepdf.com/reader/full/perloff 33/57
12
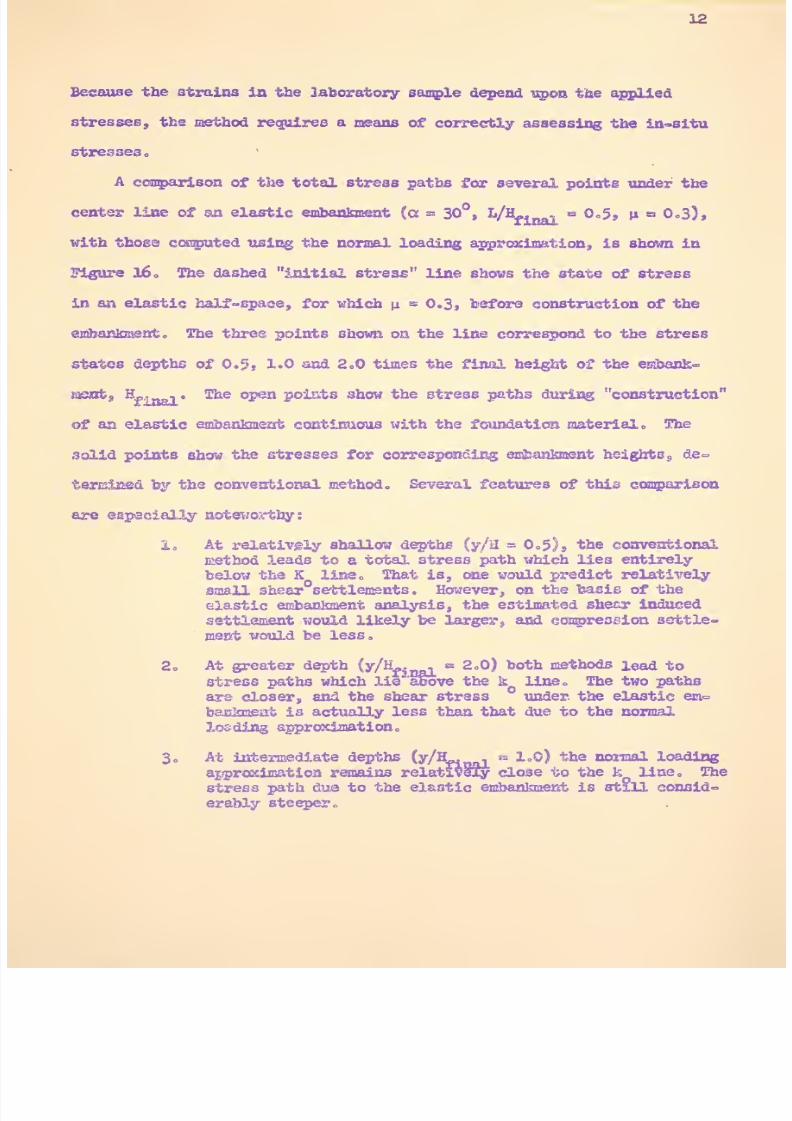
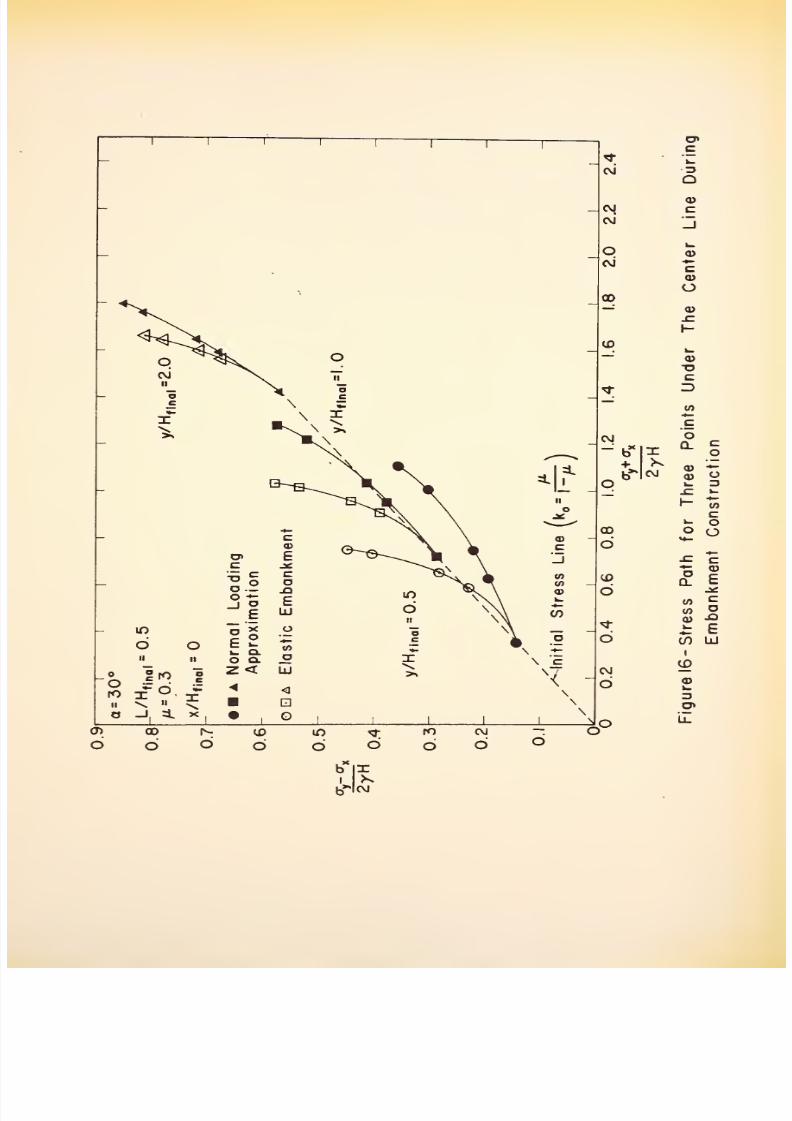
Because
the
strains
ia the
laboratory
sample
depend
upon
the
applied
stresses, the
method
requires
a
means
of
correctly
assessing
the
in«situ
stresses
A
comparison
of
the
total stress paths
for several
points
under
the
center
line
of an elastic embankment
{a
»
30
,
L/H
^ nft1|
=
Q„5,
u
«
0.3),
with those computed using
the normal
loading approximation,
is
shown
in
Figure 160
The
dashed
initial stress
line
shows the state
of
stress
in
an
elastic half-space,
for
which
ji
*
0.3,
before
construction
of the
embankment.
The three
points
shown
on the
line
correspond to the stress
states depths
of
0.5,
1*0 and
2.0 times
the
final height of the
embank-
meat, H-.
.
.
The
open points show
the
stress paths
during
construction
of
an
elastic embankment
continuous with
the foundation
material
„
The
solid points
show
the
stresses
for corresponding embankment
heights
9
de-
termined
by
the conventional
method.
Several features
of
this
comparison
are
especially
noteworthy;
lc
At
relatively
shallow
depths
(y/3
=
0.5),
the
conventional
method
leads
to
a
total
stress path
which
lies
entirely
below
the K line.
That
is, one
would predict
relatively
small
shear°settlements . However, on
the
basis
of
the
elastic
embankment
analysis, the
estimated
shear
induced
settlement
would likely
be
larger,
and compression
settle*,
ment
would
be less,
2
At greater
depth
(y/
H
final
e
2»0)
both
methods
lead
to
stress
paths
which
lie above
the
k
line. The two
paths
are closer, and
the
shear stress
under
the
elastic
em°
bankmeat
is actually
less
than
that due to the normal
loading
approximation.
3.
At intermediate
depths (y/H-.
.
»
1.0)
the
normal
loading
approximation
remains
relatively
close to the
k
line. The
stress
path
due to the elastic
embankment
is
still consid~
erably
steeper..
7/17/2019 Perloff
http://slidepdf.com/reader/full/perloff 34/57
o>
c
<*
k.
CM
3
Q
CD
<n
c
CVJ
_l
O
CD
<M
^
C
0)
o
00
CD
cd
^~
CO
o
c
* 3
to
c
rM
o
b*
I
Q.
c
o
+
X
cd
•~
h*
C\J
o
O
i_ 3
k_
co
c
o
00
O
o
O
x:
c
CD
CO
o
E
O
CO
(0
C
o
*-
a>
k_
x>
£
CJ>
co
i
CD
UJ
CM
O
CD
en
00
i^-
CO
m
<i-
ro
OJ
O
o
o
o 6
b
O
O
b
i
b
X
cvj

7/17/2019 Perloff
http://slidepdf.com/reader/full/perloff 35/57
13
Because of
the
influence
of the
applied
stress path
oa the measured
laboratory
settlements,
and
therefore on
the computed
field settlements,
it
would
seem
essential
to estimate the
predictive capability of the
method to
the
field
stresses
accurately.
In
the case
considered,
the
stresses
produced
by the
elastic embankment are
significantly
different
from
those
due to the
normal
loading
approximation,
at least
at
shallow
depths
.
The
effect
of
this difference on the
results
predicted
by
the
stress
path
method
is
not obvious,
however
this
question would
appear
to
deserve further
attention,,

7/17/2019 Perloff
http://slidepdf.com/reader/full/perloff 36/57
Ik
CONCLUSIONS
The analysis
presented
herein
permits
determination
of the
stresses
within and
tinder
long
elastic embankments
which
are
continuous
with
the
underlying
foundation
material,.
The
results
indicate
that the horizontal
distribution
of
vertical
stress is
more nearly uniform than is usually
assumed. Thus,
differential
settlements
computed
using the
normal
loading
approximation
will
be
larger than
those determined
using the
stress
distri-
butions
presented herein
The
horizontal
vertical
shear stresses
created
in
the foundation
mater-
ial by
the
embankment, are
found
to be
significantly
higher
at
shallow depths
for
the
elastic embankment
than
for
the
normal
loading
approximation.
The
influence
diagrams
presented, provide the
designer
with
what
is
believed
to
be a
more
realistic
estimate
of
the vertical
stresses
than
that usually
employed.
ACHJCWIBDGMBHTB
The
research
described
herein
was
supported in
part
by
the
Ohio
Department of
Highways
in
conjunction
with
the
U.
S. Bureau of
Public
Koads,
and
in
part
by
the
Joint
Highway Research
Project,
Purdue
University
in
conjunction
with
the U,
S, Bureau
of
Public
Roads.
The
assistance of
W. L.
DeGroff,
R.
Hoekema,
and B.
Corbett in
the
prepara-
tion of
the
drawings
is
gratefully
acknowledged.
7/17/2019 Perloff
http://slidepdf.com/reader/full/perloff 37/57
15
REFERENCES
CITED
BROWN,
Co
Bo
8
(1962)
Incremental Analysis
of
Gravitational Stresses
in
Embankments and
Their Effect
Upon
the
Failure
of Earth Structures,
Ph. D«
Dissertations University
of Minnesota „
CARLTON,
To
A., Jr.,
(1962),
The
Distribution of Gravity
Stresses
in
a
Symmetrical Trapezoidal Embankment
and its
Foundation, Ph„
Do
Thesis,
University
of
Texas,
1962.
CAROTRERS, S
D.,
(1920),
Direct
Determination
of
Stresses,
Proceedings,
The
Royal Society of London,
Series
A.,
Vol*
XCVII,
p.
110
CHURCHILL, Be. Vo,
(19*48),
Introduction
to Complex
Variables and
Applications,
McGraw-Hill Book Company,
Inc.,
Mew York.
CLGUGH,
Eo
and CHOPRA
s
A.
K.,
(I966)
Earthquake Stress Analysis
in
Earth
Dams, Journal of the
Engineering
Mechanics Division,
Proceed
ASCE,
Vol.
92,
Ho.
EU2,
April,
1966.
DAVIS,
E
Ho
and TAYLOR,
H.,
The Movement of Bridge
Approaches and
Abutments
on
Soft Foundation
Soils,
Paper
No.
37?
Proceedings
Australian
Research Board,
Part
2,
Vol.
1,
1962.
DINGWALL,
J.
Co
and SCRIVNER,,
?, H.,
(I95U)
Application
of
the
Elastic
Theory
to
Highway
Embankments
by
Use
of
Difference
Equations,
Proceedings,
Highway
Research
Board,
v.
33*
p°
^7U.
FINN,
Wo
Do
L.
s
(i960)
Stresses in
Soil
Masses
Under Various
Boundary
Conditions, Ph. D.
Thesis,
University of
Washington,
i960.
FINN,
Wo
Do L„,
(1966)
Static
and Dynamic
Stresses in
Slopes,
Proceedings,
of
the First
Congress
of the
International
Society of
Rock
Mechanics,
V. II,
p.
167.
GOODMAN,
Lo
E.
and
BROWN, C.
3.,
(1963)
Dead
Load
Stresses and Instability
of Slopes,
Journal
of
the
Soil
Mechanics and
Foundations
Division,
Proceedings
ASCE,
V.
89,
n
SM3,
May
1963.
HENDERSON, F.
Mo,
(i960)
Elliptic
Functions
with
Complex
Arguments,
University
of
Michigan
Fires
s
,
Ann
Arbor
HXLDEBRABD,
?. B.
s
(1956) Introduction
to
Numerical
Analysis,
McGraw-Hill,
New York.
JURGEIS3QN, L.
(1937)
The
Application
of Theories of
Elasticity
and
Plasticity
to
Foundation
Problems,
Journal of
the
Boston
Society of
Civil
Engineers, July,
193
1
*.
LAMBE, To
Wo,
(196U)
Methods
of
Estimating
Settlement ,
Proceedings
of
Control of

7/17/2019 Perloff
http://slidepdf.com/reader/full/perloff 38/57
IS
MUSKHELISHVILI.,
N„
l,
f
(1953^
Some
Basic
Problems
of
the
Mathematical
Theory
of
Elasticity
, P.
Noordhoff,
Groaingen,
—
—
—
3EHMARK, N.
M„
5,
(19^0)
Stress
Distribution
in
Soils,
Proceedings
Purdue
Conference
on Soil Mechanics
and its
Applications,
p,
295,
NEWMARK
S
No
M»
9
(1942)
''Influence
Charts
for
Computation
of
Elastic
Stresses
in Foundations
s
Bulletin.,
University of
Illinois
Engineering
Experiment
Station, No.
32$
«>
OSTEBEERGj
Jo
0,, (1957)
Influence
Value
for Vertical
Stresses
in
a
Semi-
Infinite
Mass Due to
an
Embankment
Loading,
Proceed
ings of
the Fourth
International Conference
on
Soil
Mechanics and
Foundation
Engineering,
Vol= I,
p.
393*
RENDULIC<,
L
os
(193S)
Der
Erddruck im
Strassenbau
und
Bruekenbau,
Forschungsoarbo
Strassenwesen,
Bd„
10,
Voile
u<»
Reich Verlag, Berlin
T3RZAGHE
K.
s
{I9U3)
^oretig
al
Soil
Mechanics,
John
Wiley,
Few
York.
TB5OSB&HK0,
S
c
and
GOCiDIERj,
Jo
N*
s
(1951)
Theory
of
Elasticity, McGraw~
Hill,
New
York.
TROLLOPE,
D.
fi,
5
(1957)
She
Systematic Arching Theory
Applied
to Stability
Analysis of
Embankmente
,
Proceedings 4
th International Conference
on
Soil
Mechanics
and
Foundation Engineering,
V.
2,
p.
382
WYLIE,
Co Ro
S
Jr.,
(1966)
A
dv^g^J
Etogj^eering
Mathematics, Third
Edition,
McGraw~I3.il,
New
York.~
ZIENKXEWICZ* 0. Co
j
(I9U7)
Stress Distribution in
Gravity
Dams,
Journal
of
the Institution
of Civil
Engineers,
V.
27,
January
1947,
p» W
ZIEMKIEWICZ
S
Oo Cc
and
CHEUNG* Y*
K*
3
(1964)
Buttress
Dams
on
Complex
Bock
Foundations,
Water Fover, Vol.
16,
No.
5,
May
1964,
p.
193.
ZIENKIEWICZ
a
Oo
Co
and
CHEUNG
9
Y*
K.,
(1965)
Stresses in
Buttress
Dams,
Water Power
,
Vol.
17?
No.
2,
February
1965,
p»
69.
ZIENEIEWICZ, Oo Co
and
GER3TNER,
R.
W
es
,
(I96I)
Foundation
Elasticity
Effects
in
Gravity
Dams,
Proceedings
of
the Institution
of
Civil
Engineers, V.
19»
p.
209

7/17/2019 Perloff
http://slidepdf.com/reader/full/perloff 39/57
17
APPENDIX
1
SOLUTION
OF
THE
PROBLEM
The method
of solution
is
a
modification of
the
I^KHELISHVTLI
(1953)
method
o
A
brief
outline
of
the solution
is
given
below
„ A
more congolete
discussion
of the
details will
be presented
in
a
forth-
coming paper.
For the plane strain
problem,
the stresses
can
be defined
in
terms of
an Airy stress
function,
U
(x,y)
as
a
x
'
~~
>
dy
-,
2
*
1
-
ja
7J
d
U(x,y)
f. %
where
«
.
a
,
t
are
the
horizontal
normal,
vertical
normal and
shear
x*
y*
xy
stress,
respectively
j
7
is
the unit
weight
of
the material,
^
is
the
Poissoa's
ratio o
For
a
case
in
which
weight is the only
body force
acting^
the requirements of equilibrium
and
compatibility
will
be
satisfied
if
(TIMOSHEMO and
GOCSD23S,
1951)
V
k
J3
far)
-
(2)
2
where
V
is
the
Laplacian
operator.
When
the boundary
conditions
of
the specific
problem
are also satisfied,
the
unique
solution
has
been
obtained.
In
considering
the boundary
conditions associated
with
the
embank«=

7/17/2019 Perloff
http://slidepdf.com/reader/full/perloff 40/57
IB
form.
Referring
to
the
plane in which
the
embankment
section is
shown
in Figure
lb,
as
the z-plane, a
point
within
the
medium
can be
repre-
sented
by
the
complex
number,
z
«
x
*
iy„
Assuming
that the
stress
•
function is
analytic
within
the
medium,
the
function
can
be
written as;
U(x,y)
-
Re
[
z*(z)
*
%(z)]
where z
a
x
-
iy,
<t>
and
3&
are
single-valued
analytic functions
through-
out the
z-plane « The functions *
and
X
are
determined from
the
condi~
tions that the
normal and tangential
stresses
on
the boundary are equal
to
zero,
Substituting Equation
3
into
Equations
1,
and
expressing
the
stresses
in
terms
of
the boundary
tractions leads
to:
zV'(z)
(U)
x
.(.)
+
p
(£&)]
,
?
(A.-]
where
a bar
indicates the
complex
conjugate
of the
quantity, 9 is
the
angle
between the
slope
and the
x-axis
measured in
a
clockwise
direction,
u
is
2toisson°s
ratio,
N
and
T
are the normal
and tangential components,
respectivelyj
of
the
boundary
traction.
Evaluation of
the
stresses is
then
accomplished
by
a two
step
trans-
format
ion.
o
First,
the
boundary of
the
z-plane
is
transformed
into
the
straight
line
boundary
of
an
auxiliary
plane, the t-plane,
t
<»
?*
+
itrj,
by
the
application
of
the
Schwarz-Christoffel
transformation
(CHURCHITI.,
19^8):
t
x
z
«
f(t)
«
R
f
l^^-^jt]
a
dX
*
S
(5)
>-0

7/17/2019 Perloff
http://slidepdf.com/reader/full/perloff 41/57
19
where
P.
and
S
are
constants,
p
is the
modulus
;
X
is a
dummy
variable
and
n
it/a. Note
that
when
n
a
2,
corresponding
to
a
slope angle
of
90°,
the
integral expression
in
Equation
5
is
aa
elliptic
integral of
the
second
kind, for which tables
or
charts
(HENBERSCK,
i960)
are available
For
those
cases where n
is
larger than
2,
the integral can
be
evaluated
numerically
on the computer
.
In this
analysis,
Equation
5
was evaluated
for
all
values
of
n
on
the
XEM
709U
digital computer by
a Simpson
°s
rule
integration
(KILDEBHAMD,
1956)
Because Equation
5
represents a
conforms transformation,
straight
lines
€«»
constant and
t) -
constant in
the t-plane,
correspond
to
orthogonal
curvilinear
coordinates
in
the
z-pXane,,
This is
illustrated
in
Figure
A„la.
Thus, the
boundary conditions
in terms
of
*(z)
and
7C(z)
can
be
written as
functions
of
* [f(t>]
-
{t)
and
3tff(t)J
-
7t(*)«
Then the boundary
tractions becomes
n
*
it
=
o=$ct)
*
ytsr
*
g(i
£
n
)
**
f
f
c*>]
m
4$f
*iw*
*[*&}*«*&
(6)
where
&(t)
«
'(t),
Wp(t)
•
X
8
(*)
a^
f
e
(t)
is
the
integrand
of
Equation
5<
Recognizing
>}
s
and
t
»
£
in
Equation
6,
and
rearranging
leads tos
sfo)
1+
(l-2u)
fTTT
Im
Jf(f),
:
(7)

7/17/2019 Perloff
http://slidepdf.com/reader/full/perloff 42/57
20
In
this
form,
Equation
7
expresses
the
effect
in the t~plane
of
the
geometric
shape
of the
embankment.
This
effect
can
be
visualized as
a
fictitious
loading
applied
to the
boundary
of
the
t-plane
The
real
and
imaginary
parts
of
this
fictitious
boundary
loading
are
shown in Figures A,
lb
and
A.lc,
respectively
Ifeving
expressed
the
desired
functions
of the boundary,
it
is
necessary
to
determine
them inside
the
boundary.
This
is
accomplished
by
the application of
the
Cauchy
integral
formula.
This formula
states
that
for
a
given
function
g(C)
along
a
closed
contour, C,
which
satis-
fies
certain conditions, the
value
of the function
at
an
interior
point,
t, is
(WYLIE,
1966):
g(t)
2ai
(8)
If
the point
t
is
exterior to the
closed
contour,
then
the
integral
expression
equals
zero.
By
this means,
the desired
functions
can be
evaluated inside
the
boundary.
Knowing
ty(t)
and ^(t),
and
substitu-
ting Equation
3
into
Equations
1,
leads
to
the
determination of
the
stresses
a
-
2
Re
3v
<JKt)
-Re
[fW
-f#
*#t)]
+
f^jrlm
[f(t)
o
y
-
2
Re
f
(t)
+
Re
[
fW
-$$
<£(t)
7
Im [f(t)]
(9)
v
-*

7/17/2019 Perloff
http://slidepdf.com/reader/full/perloff 43/57
MM
(a)
Geometrical
Transformation
stffi
,,,,
1
U
rrr
rr>
e
(b)
Transformation
of
Fictitious
Stresses on
Boundary
-Real
Part
(c)
Transformation
of.
Fictitious
Stresses
on
Boundary-
Imag.
Part
Fig.
A.I-
Graphical
Representation
of
Transformation
Procedure
7/17/2019 Perloff
http://slidepdf.com/reader/full/perloff 44/57
21
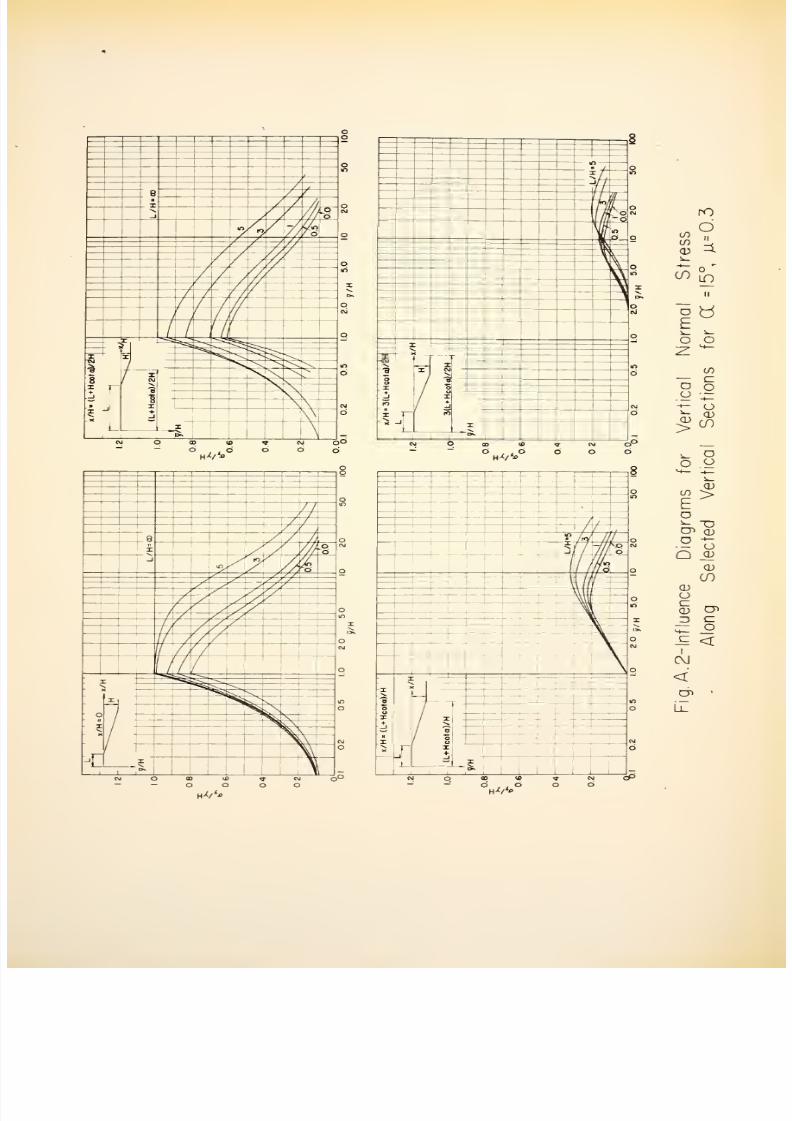
AEEESSD2X
2
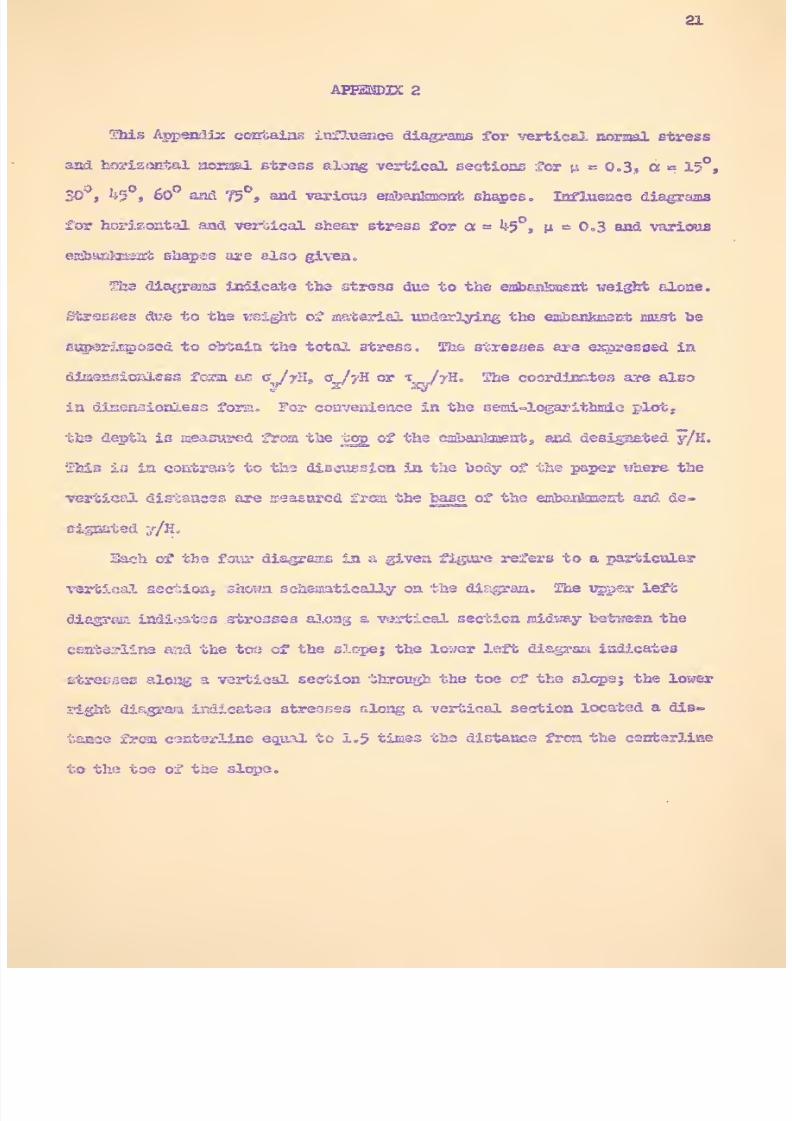
This
Appendix
contains
influence
diagrams
for
vertical
normal
stress
and
horisontal normal stress
along
vertical
sections for
\t.
e
0.3,
a
e
15
,
30°,
h%
,
60
and
75°,
and
various
eE&ankment
shapes.
Influence
diagrams
for
horizontal and
vertical shear
stress
for
a
=
^5°,
ne0,3
and various
ejBbaasioasafc shapes are
also
given*
The diagrams
indicate
the stress
due
to
the
embankment
weight alone.
Stresses
due
to
the weight of material
underlying the embankment
aaist be
superimposed
to
obtain
the total stress, The
stresses
are
expressed
in
disaensioslsss
form
as
JyH
9
o_/?H or
'^/?'
H
'•
2ite
coordinates
are
also
ia
dlmeaaionless
form. For convenience
in
the
seaa-logarithsie plot,
the
depth
is
measured
from
the tog
of ths
embankment, and
designated y/K.
This
is
ia
contrast
to
the
discussion
ia
the body of the paper
where
the
vertical distances
are
measured
from the
base
of
the embankment and de-
signated
y/H.
Each
of the four
diagrams in
a
given
figure
refers
to
a
particular
vertical section,
shoaa
schematically on
the
dis;gram.
The upper left
diagram
indicates
stresses
along a vertical
section
midday
between the
centerlins
and
the
tot?
of
the
slope;
the
lower left
diagram indicates
stresses
aloisg
a
vertical
section
through
the
toe
of the
slope;
the lower
right
diagram
indicates
stresses
along a
vertical
section
located
a
dis-
tance
from
centerline
equal
to
1.5
times
the
distance
from the
centerline
to the toe
of
the
slope.
7/17/2019 Perloff
http://slidepdf.com/reader/full/perloff 45/57
ID
8
-J o
N
V
-/
O
.
o
^
if)
//
3
/
*
/
'
/
/
//
O
/
/
/
//
/
CJ
Fi
/
1
-~.
7/
o
X
3
y
8
f
r
in
5
?
X
+•
_i
X
o
x
-
v.
-X
J
CM
v
o
r
<=
\
r
1—
t\
o
a
>
«
? r
o
o
hv*
9
/
:
tn
-jy
y
o
CM
in
o
m
i
o
N
o
^J
I
<\J
^
o
. u
X
-
m
X
f
/
m
O
t\l
O
E
-
H*fc*
o
O
\n
ft
/l<
X
///
.O
CM
_j
lO,
'
X
•
•
o
in
1
/
//
'
/
o
/
/
/
<M
UL
o
I
^^**^^z>~~
^~*-~~^
•
c
-
I
iEJ
^
\
in
/
o
ru
o
X
i i
-
R
O
in
£~
£/?
//
s/7
#§
CM
m
O
l>
^r—
o
CM
o
-x
o
a
X
+
_j
-X
I
-
h-
IO
o
J
/
2
u
X
-t-
-J
<\i
O
x
*
—
CN
c
a
9
U
1
5r
e
J
C
P
CO
C/)
CD
01
O
LO
D
b
o
o
D
n
(
)
H
i
>
i_
fi>
CD
>
CO
o
o
o
M
H
^_
CI)
co
>
b
o
i~
O
w>
CI)
n
-t—
C)
O
CD
CD
CO
a;
o
c~
a;
u>
-j
£Z
< >
<+—
_c_
<
CM
<
a>
•
H-^/'-o

7/17/2019 Perloff
http://slidepdf.com/reader/full/perloff 46/57
/
,
H
A
'
y/
v:
y
t
ID.
/
V
-/
r
/
/An
/
7©
o
o-
/
.
/
'/
X
.Si
5
X
/
—
i'S
s
«
V.
^?^
o
O
X
'
+
-J
X
\
-
-
X
I
»
o
t
CJ
/x
x
>
/
^
sz
Hi
V,
>.
III
CO
CO
°
/ <
°
1
/
»
//
zt
;
/
//
6
'
X
_l
in
.- '
*
>/
://
%
/
i
^
4 /
j
x
/ /
2
/m
J
^
/
'
/
^
y
O
,
-•
/
/
'
•
/
/
//
•
//
/
/
_
o
J
-
1
\
\.
t>
N^
&
\
\
\
\
/
1
V
\ \
\
\
J
s.
\
oO
8
IO
/,
i
o
1
/
~//ao
w
xl
ho/
/
°
Q
o
m
X
o
I o
o
u
X
•
_l
IO
X
_
X
/I
/
b
/
5
CO
-if k
I
hV*
1 p
1 1
1 1
1
o
1
'
«
1
1
1
/
J /I
//
/
/
//,
/*
/
//,
o
/
XI
OJ
—
/lO
^7
O
i
/
/
o
6
o
iD
\
1
w
\J
l>
o
OJ
T ?
^
K
B
o
U
X
-J
X
|
/
3
/
*
X.
— (
M
J
ll
d
00
cu
en
o
o
<D
>
o
rO
O
ii
3.
o
o
ii
b
O
oo
e
o
o
cu
01
D
O
oo
£
D
O
Q
o
O)
I
en
>
O
<D
U
_CD
a>
CO
en
tr
o
o
o
H
^/*-»
V/'*
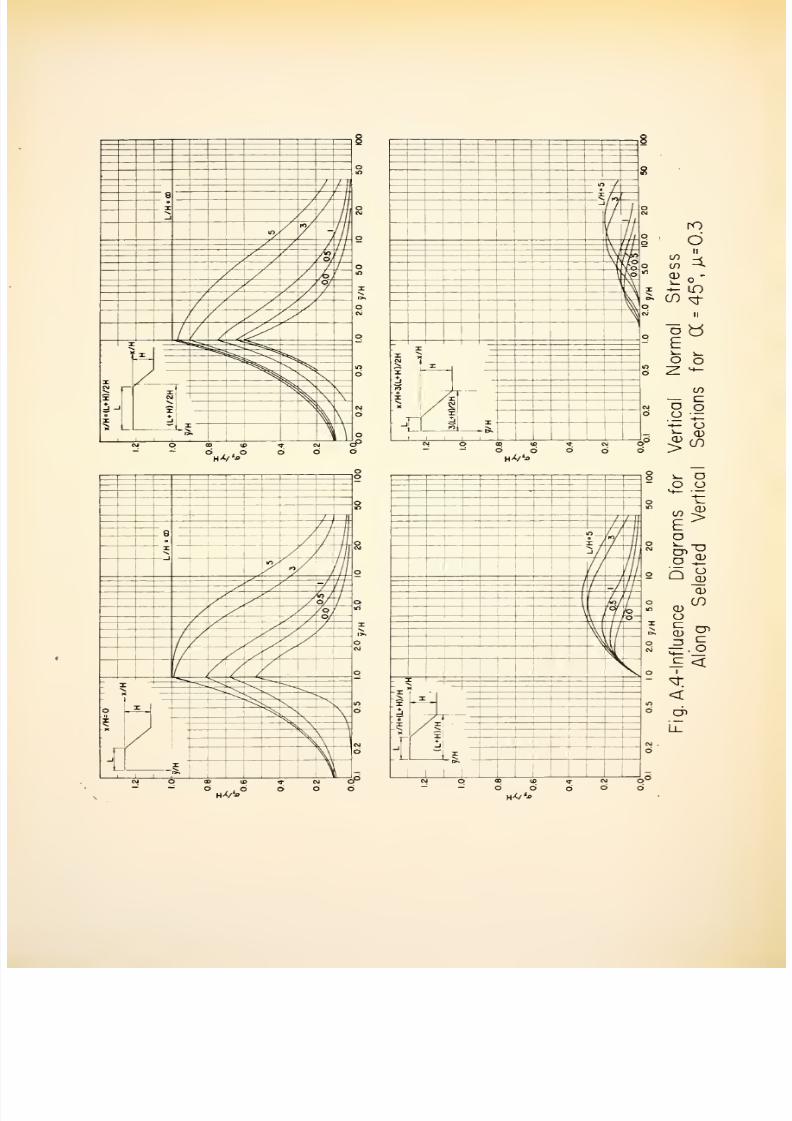
7/17/2019 Perloff
http://slidepdf.com/reader/full/perloff 47/57
8
o
if)
J
1
1
e
X
-1
f
/
'
/
/
/
//J
N
V
t<y
-
f
'
7
Of
/
7
O
/
4
/
'
if)
/
>
/
X
l>
o
M
S
^
o
X
X
''SS^
-n.
*
<N
X
+
_
\
lO
o
I
X
~5
1.
X
OJ
o
.
13
o
ctl
c
:>
C
u
>
*
t
c
SJ
1
f
8
8
„_
/
/
/
7
/
-1
i
CM
7
O
'//
, \ Kl
IZ<
o
iY*
IO
T
O
CO
o
X
x
S
'x
i
m
O
*
y
2
X
II
io
X
C\J
O
i
-:
CM
o
D to
«
CM
D
U
°
/ I
°
O
CO
-*•
—
in
en
^t
n
s
|«
b
o
LO
—
e
o
o
U
—
'•*-
o
*-
(V
O
If)
/
Z~j
9
/
/
/
l\
o
X
/
/
''1
1 //l
CM
«y
?
'
III
o
-
J
/
6/
o
O,
t
I
1
la
O
/
/
,'
/
'
/
o
*^
V
>
>*
* V
v
^
o
X
*
M
_l
**
\
~^
X
Vs
^
V
N
in
^
-
\
\
\
\
*
\
^
s,
A
X
\
O
w
I3K
—
c
J
C
i
a
3
«>
1
r
c
c
P
°
H0°

7/17/2019 Perloff
http://slidepdf.com/reader/full/perloff 48/57
X
o
m
e
O
-1
n.
*y
-
o
o
/
t>
//
y
K
—
/
1
A
^
o
*<
i*
•^
=-.
^
w
O
K
C\J
o
u
-<f
^\'
X
•
_i
T
X
**.
V
i
\
s>
s^
*
^
x
-r—
\\
&
\
\
o
u
x-
^
/
,
i
1
/
r?
<M
o
y
v\
\
\\
X
v
W
t>
V
-K
W
X
2
i
1
LI
Hco
x/H )/2
i
M
I
I
—
o
o
u
X
_l
^
1
<s <0
H>t/^
H>C/<o
1
o
—
o
o
/
/
Ul
/
1
8
o
CM
/
«,'
f
in
/
/-
z_
o
/
in
/
/
/
i
/
o
if
Q
-
o
•
I
X
^^
x
\
S
N
\
15.
o
(T)
o
>
^
/
/
o
/
J
<NJ
f
7-
o
/
/
1
1
I
I
/
1
'
1
,
I
/
(
l>
1
N
o
*
T
«
K
3
o
u
I
-J
^ ^
I
X
*
-I
I
-«*
M
X
/'
—
rO
O
n
en
4
LD
CD
i^
o
U)
<D
n
o
b
E
o
o
CO
c
D
O
'—
o
1^
CD
V
CO
>-
15
o o
in
v
E>
o
i-
__
2-
Q
°
cu
<D^
o
CD
C
1
<
<
2
^hV'^
H-C/o

7/17/2019 Perloff
http://slidepdf.com/reader/full/perloff 49/57
1
o
o
o
a
o
INJ
m
ro / —/in
6
o
j
f
t
j
o
in
'
1
/
'
/|
'
1/
y
l»
o
'
CO
//
o
—
X
X
«
ox
X*
o
Ji
m
*
_J
I
X
T
V
--^
^r^
Is
—
o
o
m
n
^
w
I
Ao
-7m
/
/6
1
o
in
>s
O
CU
X
o
in
*
K
o
X
x
-
I
-1
X
^
\
-
CJ
O
GO
. ,
U>
TT C\J
O
H^/V
1
o
n
m
u
X
-1
/
/
/
o
/
/
/
j
uy
/
s
o
/ ;
^
y- /
'
—v7-
7
t
/
/
i
o
/
/
/
X
y
>
o
'^^
CO
-^—
o
—
^^
X
'
o
X
X
^»
K
_l
^^-^
I
'
o
o
/
X
_l
.
o
/
1
KV
'-h
o
i
i
/
i /
o
1
\
/
i
7
*s
/
o
\
o
V
•3
Sx
|
m
X
x
o
u
I
_J
—
Ct c
>
D
,'
»
cii
o
r-O
O
ii
en
3.
CO
(D
o
*
^
LO
ii
CO
n
o
o
_,_
^_
o
^__
CD
CD
>
CO
i^
n
u
1
*l
H
i~
in a;
E
>
o
i_
cn-o
n
Q>
A
—
n
a
CD
a>
ro
<i»
o
05
en
—s
i_
o
4—
£_
<
<x>
<
cr
Ll_
^H//^
V/
'*

7/17/2019 Perloff
http://slidepdf.com/reader/full/perloff 50/57
//
4
H
#
in
-
/y
/
^fO
rt
/o
6
~y
/
/}
C>
—
</
4
V
**
i
\
\\
CM
^
5
o
u
X
_J
1
\
•
\
\
\
/
X
/
w
/
—
/
**
/
o
f
X
,
\
\\l
V
\
\
\
j
L
+
I
8
m
O
«
'
>,•
7 ?
*
M
/
iff
i
A
X
£
CM
o
i
CM
o
o
u
X
-1
m
X
*
_
:
/
*
/
n
/ s.
/
2
/
o
/
X
/
+
/ d.
io
tf)
o
CM
:
o
1
o
H-^/'-o
H
•*/ *>
8
O
o
CM
tn ,
1
y
' >
o
—
,
.
in
d
/
o
s
1
c
o
X
X
\
v
^T
\\
ID
_\
\\
O
L
\
\
\
\
\
\
\
V
\
CM
1
O
X
—
l>.
I
i
c
>
a
<i <
9
j
H-
1
<
t
i
e
<
>
<
3
C
o
o
/
n
o
In
/
W
O
m
/
II
•J,
N
|«n
Dp
r
o
CM
o
*j
_
X
—
IO
a
o
o
X
+
-J
X
/
X
/ s.
/
**
/
©
/
o
/
X
'
5
o
cvj
X
ft
o
_
<->
ro
CO
O
CO
ii
cd
=1
n
o
LO
n
o
E
d
o
o
co
c:
£Z
u
o
-f_
N
O
i_
O)
o
a)
X
n
o
o
M—
H
i_
CD
CO
>
E
o
O
en
CD
CJ
CJ
n
CD
CD
CO
0)
CJ
tz
rr
CD
ZJ
c:
o
_c
<
1
I
s
-
en
H//V>
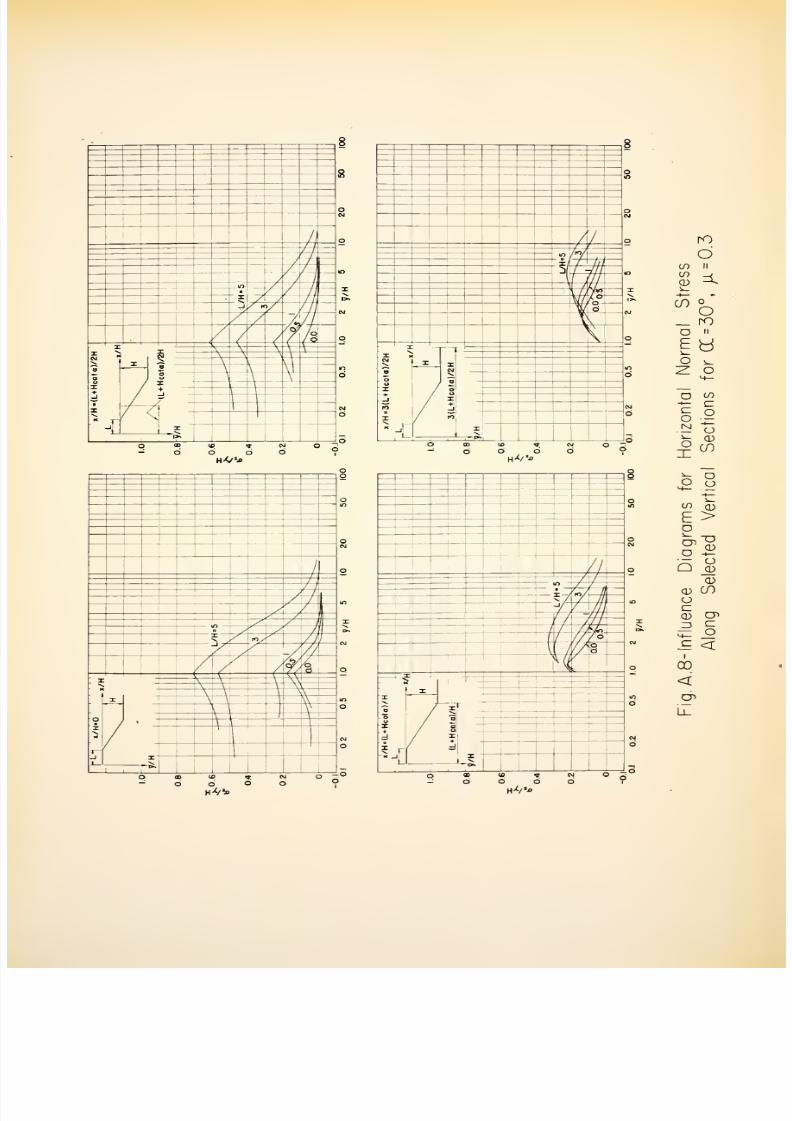
7/17/2019 Perloff
http://slidepdf.com/reader/full/perloff 51/57
4
ft
-
1
/
/
in /
/
X
/
1
/
II
-v
s*>/
fi
/
/
<
/
/
/
/
X
'
%
\
\
\-
5
;
\
\
\
a
u
V
A
\
^
\
V
\
)
\
\
\
t
C
K
«
O
n
o
/
/
o
/
T
/V
/
b
/
-^
i
/
yy
<
6
<>
^
o
X
X *
N
a
.
o
o
'X
'
#
_l
to
*
X
m
O
/
°
/
x
/
+
/
IO
-
C\J
X
O
**
A
hA/'j>
H
x
/'
/
//
/
/
/
1
/
/
1
V
V /
7
/
'
/
/
/
/
/o
/
o
o
\
h
•n
**
'I
.x.
o
O
-x
.
+
M
X
/
X
/
>v
/
°
/
o
/
°
/
X
/
+
X
Oh
c
>
<
D
<
s
<
>
C
J
>
c5
o
I
rO
O
CO
n
CO
<1>
=4.
^
H
••
(D
CJ>
ro
O
n
£
d
o
^_
7*
o
M
-
~n
co
-*
—
c~
i_
o
< >
M
o
^_
01
X
CO
i~
n
o
r
>
M—
^_
a)
0)
b
>
n
en
0)
u
Q
o
CD
CD
a)
CO
o
c~
0)
U'
~I
c_
O
£_
<
CD
<
CP
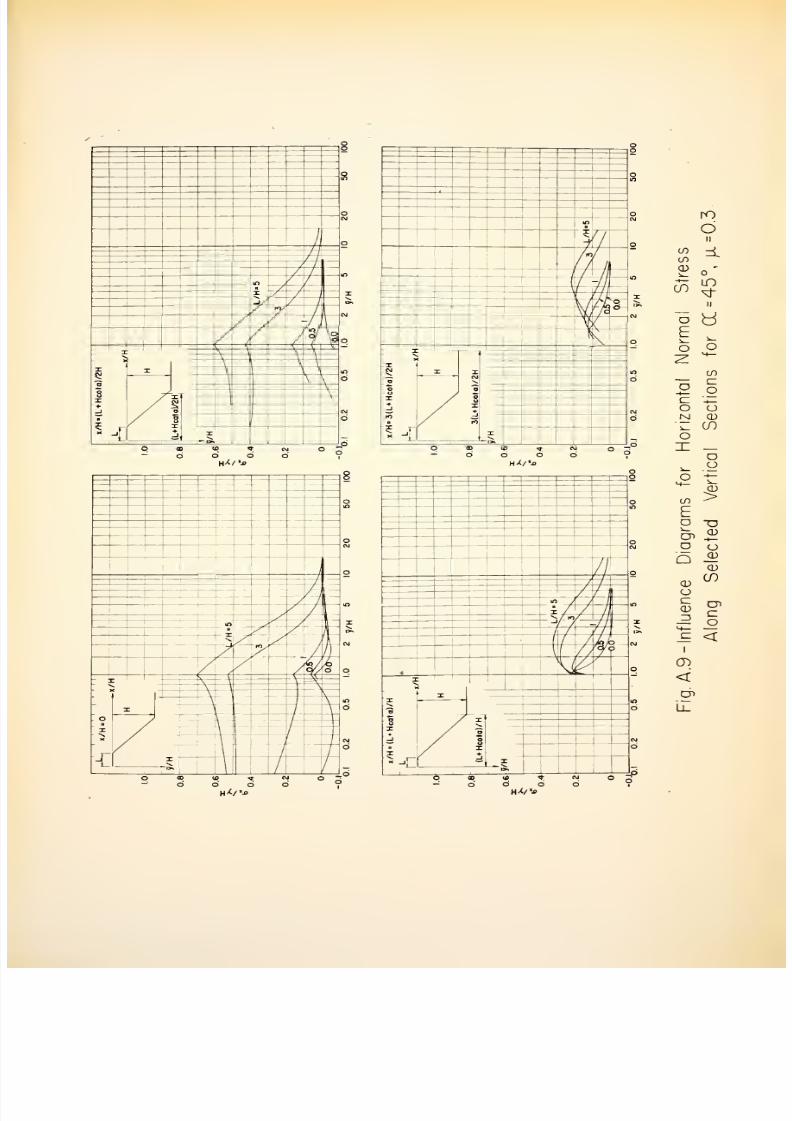
7/17/2019 Perloff
http://slidepdf.com/reader/full/perloff 52/57
8
8
O
C\J
/
O
/
/
/
/
/
m
N
X
X,
-
-*/
/
3
D
7
/
'
7
\§
O
X
1
X
<^
*3
o
o
X
•*
\
X
\
,
\
in
\
\
o
7i
/
a
/
o
/
X
r
\
CM
O
X
o
H-C/V)
o
o
If)
j
o
in
CM
//
1,
/
/ 1
/
/
-//
\
'
1
c
o
c>
V
CM
\
O
X
CM
K
.X
CM
O
o
u
X
.
+
X
in
O
/
«
/
X
CM
o
X
.o
>
q
CD
d
(1
c
>
>
o
CM
d
°
I
H-C/ .
O
o
//
o
/
/ /
/
/
1
z_
/]
n
/
x
/
•s.
/
«
—
/ /
l>
V
//
Ci
(
3
^
o
:
'X
v.
o
o
X
.J
X
i
3
o
y/
3
/
8
CM
o
:
i
o
ro
O
ii
W>
-i
CO
0>
-
i—
LO
CO
St
o
H
^_
o
o
^
4_
CO
£Z
u
o
£Z
H
o
o
M
CD
i_
CO
o
X
o
^_
o
o
i—
CI)
en
>
E
o
XI
en
CD
o
C)
n
CD
CD
CO
<x>
o
c
CD
Z3
Cn
o
H—
£Z
<
cn
<
cn
H-C/'-o
6
o

7/17/2019 Perloff
http://slidepdf.com/reader/full/perloff 53/57
o
o
o
i
o
t
'
i
/
IO
5
s.
X
try,
N
1
/SJ
o
i
/
X
c;
e
o
o
X
_J
X
1
/
X
/
IO
o
u
I
+
i
(
o
\
r l
\\ CVI
X
^
o
i
—
S
8
/
//
/
to
/
i
*
/
*y
i
/
in
i
n
/j
3
V
//
h
/
/
13
V
/
h
V
^
o
x
CM
\
o
o
u
I
+
Pi
X
T
M
X
X
CM
o
o
X
.n
O
(VI
O
I
HX/'j,
x.
s
—
o
o
/
in
/
H
\
i*
X
A
_
-/
^
'
/
/
o
X
M
\
o
X
/
IO
X
o
X
—
-/
\
/
OJ
o
X
/
1
>»
o
o
HX
f*e
R
O
'
o
4
o
/
j-
if
t
3
/
i
X
/
£
/
,
V
/,
V
/
o
I
3C
-
x
B
o
u
I
_J
'
X
O
m
3
C
o
J
CM
O
X
~
(
5
<
i
)
3
r
C
J
>
c
»
i
i
no
en
O
(/>
0)
l_
=i.
O
D
CD
F
n
o
«
c
-
c/>
o
i_
M
o
O
o
X
CO
^_
o
o
H—
o
^
1
<n
i_
E
ID
>
o
i_
m
u
O
cu
Q
o
CD
CD
cu
CO
o
<r
Q)
(_>•>
n
c
—
o
*
i
i_
<
O
<
en
H^/'*
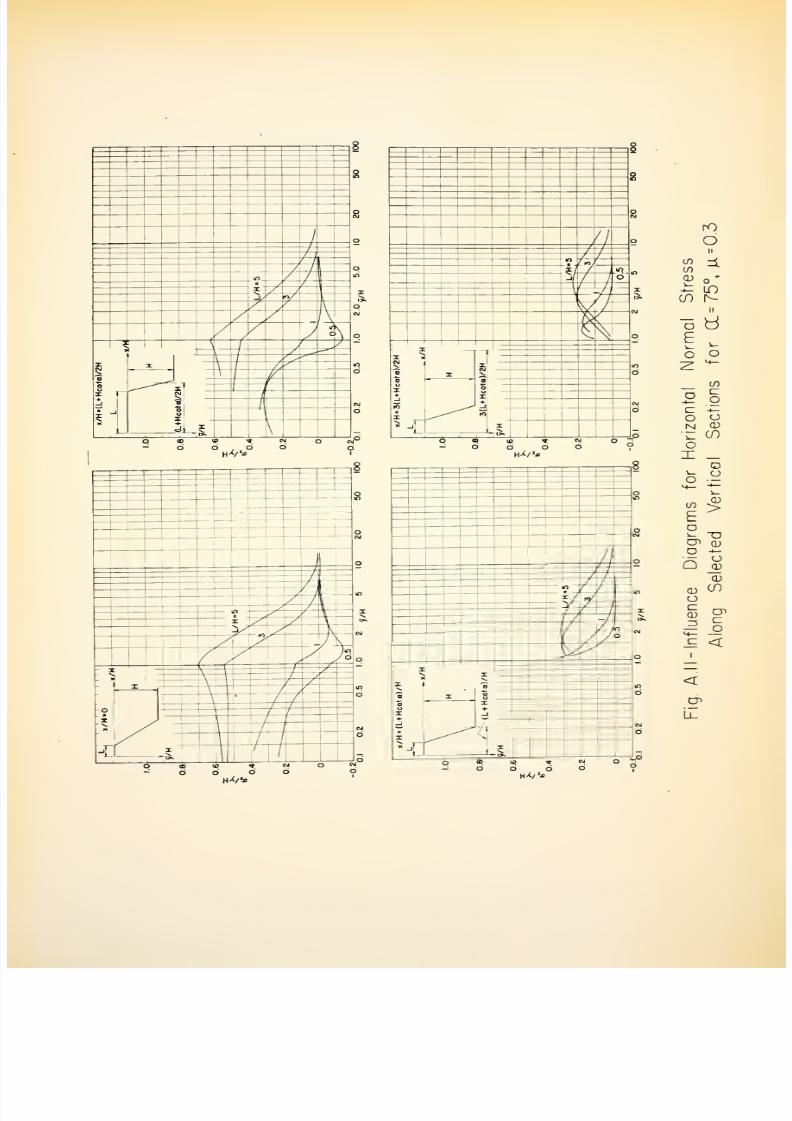
7/17/2019 Perloff
http://slidepdf.com/reader/full/perloff 54/57
8
°
o
C\J
-I
g
-
—
fl
t]\
/
1
o
in
X
-
/-
A
ID
y
/
_j
to/
O
/
]
\
N
O
3
t
—
X
2
a
1
r
/
X
\
-
-
/
,'
m
1
1
c
\
//
O
/
/
i
J
/
<vl
X
o
L
\
_
H-
V*
1
8
W
o
II
o
1
IT)
Ift
-
X
/
\
1
Z
o
-in
/
—
r^
(
/•
/
O
-
X
1
\
y
-o
-
X
-
^
X
\
)
\
/
A
1
\i
i
/
\]
1
/
1
/
/
/
/
C\J
/
/
O
'-O
1
1
'
1/
(
>
a>
<D
>f
c
3
c
.T
s
1
8
O
n
o
1
>
1
i
I
ni
lO
o
3f /
(
\
l>
\
o
x
*
X
o
o
u
I
o
u
X
+
_J
K)
X
X
\n
O
CNJ
^*^**^
**
I
O
X
-i.
H/>
«ji
8
O
O
4
o
o
/
4=
-?/
*
M
V
=/
l>
/
/
D
/
/
^
-•
--
o
'
I
a
o
u
X
*
-j
X
-
3
i
j
«o
•
o
j
eg
X
O
JI
o
no
O
U1
4
CO
in
n
a
ti
E
o
o
to
D
o
C
H
o
u
M
CD
i_
CO
o
o
^_
C 1
()
-*
—
i^
CI)
to
>
b
o
^_
n
u>
cu
I)
-<
b
o
CD
CD
CD
CO
O
e
fi)
=5
O
£ <
I
<
en
H-t/i
H-C/*

7/17/2019 Perloff
http://slidepdf.com/reader/full/perloff 55/57
8
tn
U)
X
10
o
,/
CvJ
--
-^
S-
/
1
\
s
'
/
$
/
1
n
/
/
k
,n
'
S*
^
/
T
•
s
/
s-
/
X
[^
3
k
- -
?x
x i
^
*
\
X
M
\
\\
X
I
v
\
O
-
ID
X
J
IO
7
/
<M
/
S
'
i
/
/
/
/t
y
V,
t
/
y
/
\,
f
ir-
'
=
/
f
/
\
N.
/
X
l>
s
\
X
CM
ij
^
T1
_l
I
X
I
li-
/
X
/
CM
/
>v
'
X
H-</<*l.
V
*->
o
^
X
_|
IO
o
/
'
'-,
X
/
X
/
U
o
S*
^
^
f
i
S
^
J
i\
<'
./
/
y
/
^
<>
i
li
^
/
A
/
-^
y
/«
*
1
> T
s
^<
^
2
X
CM
Q
'S;
S
\\
\
\
X
M
1
*
\\
\
\
\
V
\
M
X
o ..
m
8
°
o
o
X
_
1
IO
7
o
OJ
/
o
7r
/
/c
/I
y
S
/
y
y
/
y
/
o
/
y
/
7*
>
/
\
y
13
\v
/
<=]
*
&r
*•*
-X
**>-
o
5-
X
X
.J
X
X
/
X
/
>*
X
c
>
IO
<>
;
U
k
c
>
o
ro
cr>
O
£=
n
o
-<
<
—
o
co
Lf)
CO
^f
H)
i-
II
CO
d
^_
a
o
M—
CD
x:
CO
CO
£Z
o
^_
^_
o
o
>+—
cu
CO
co
F
o
o
D
i_
C_)
CJ>
h_
n
^_
<l>
CJ
>
O)
TI
o
O)
U)
C)
3
CU
M—
0)
1_
en
CVI
en
V/*a
NH^i

7/17/2019 Perloff
http://slidepdf.com/reader/full/perloff 56/57

7/17/2019 Perloff
http://slidepdf.com/reader/full/perloff 57/57