Embed Size (px)
Citation preview
Can permeability be determined from seismic data? Thisquestion has been around since Maurice Biot, working forShell in the 1950s, introduced the idea that seismic wavesinduce fluid flow in saturated rocks due to fluid-pressure equi-libration between the peaks and troughs of a compressionalwave (or due to grain accelerations in the case of a shear wave).Biot (1956) established a frequency-dependent analytical rela-tion between permeability and seismic attenuation. However,laboratory, sonic log, crosswell, VSP, and surface seismic haveall demonstrated that Biot’s predictions often greatly under-estimate the measured levels of attenuation—dramatically sofor the lower-frequency measurements.
Yet, if an unresolved link truly exists between seismicamplitudes and permeability, the potential benefit to the oilindustry is enormous. For this reason, the Department ofEnergy (DOE) brought together 15 participants from indus-try, national laboratories, and universities to concentrate fortwo days on whether permeability information is conceivablycontained in and retrievable from seismic data. The presentarticle represents much of the workshop discussion (whichtook place 5-6 December 2001 in Berkeley, California), but isnot strictly limited to it.
Not all connections between hydrological and seismicproperties are considered. Three-dimensional seismic imagesand time-lapse seismic monitoring are routinely used by reser-voir engineers in constructing and constraining their reservoirmodel. Such imaging applications of seismic surveys to hydro-logical modeling are not discussed. Furthermore, in fracturedreservoirs it is reasonable to postulate that any locally deter-mined seismic anisotropy defines a symmetry class for the geo-logic material that must also be satisfied by the permeabilitytensor. Neither are such material-symmetry constraints dis-cussed.
The focus here is only on whether the permeability of therocks through which seismic waves propagate directly influ-ences the decay of the wave amplitudes with distance. Key toaddressing this question is an up-to-date discussion of thelikely attenuation mechanisms operating in the explorationseismic band (10-103 Hz). We conclude that it indeed seemslikely that the permeability structure of a geologic material isinvolved in explaining the observed levels of attenuation inthe seismic band.
Possible inversion strategies for actually obtaining suchpermeability information are briefly discussed. However, webegin with the field measurements themselves.
Measuring attenuation in the field. A multitude of methodshave been used to determine attenuation from surface, VSP,or crosswell seismic data and we in no way attempt to beexhaustive in our coverage here.
In crosswell tomography, focus is most often placed onthe waveform of the first arrival. The amplitude spectrum ofthe first arrival divided by the amplitude spectrum of thesource is directly related to the average attenuation coefficientα (units of inverse length) along a raypath. This fact has beenthe basis for various tomographic strategies aimed at deter-mining the attenuation structure within a given depth inter-val. Nowack and Matheney (1997) and Quan and Harris (1997)provide two effective approaches and references to earlierwork.
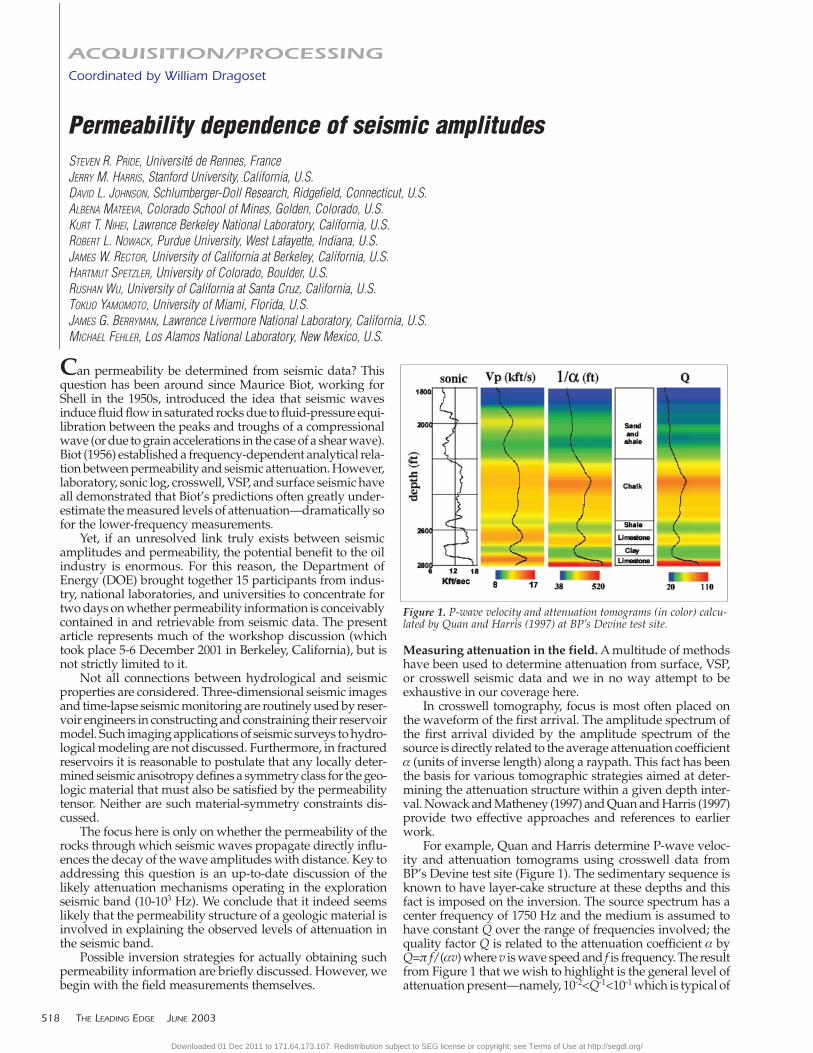
For example, Quan and Harris determine P-wave veloc-ity and attenuation tomograms using crosswell data fromBP’s Devine test site (Figure 1). The sedimentary sequence isknown to have layer-cake structure at these depths and thisfact is imposed on the inversion. The source spectrum has acenter frequency of 1750 Hz and the medium is assumed tohave constant Q over the range of frequencies involved; thequality factor Q is related to the attenuation coefficient α byQ=π f/(αv) where v is wave speed and f is frequency. The resultfrom Figure 1 that we wish to highlight is the general level ofattenuation present—namely, 10-2<Q-1<10-1 which is typical of
518 THE LEADING EDGE JUNE 2003 JUNE 2003 THE LEADING EDGE 0000
Permeability dependence of seismic amplitudesSTEVEN R. PRIDE, Université de Rennes, FranceJERRY M. HARRIS, Stanford University, California, U.S.DAVID L. JOHNSON, Schlumberger-Doll Research, Ridgefield, Connecticut, U.S.ALBENA MATEEVA, Colorado School of Mines, Golden, Colorado, U.S.KURT T. NIHEI, Lawrence Berkeley National Laboratory, California, U.S.ROBERT L. NOWACK, Purdue University, West Lafayette, Indiana, U.S.JAMES W. RECTOR, University of California at Berkeley, California, U.S.HARTMUT SPETZLER, University of Colorado, Boulder, U.S.RUSHAN WU, University of California at Santa Cruz, California, U.S.TOKUO YAMOMOTO, University of Miami, Florida, U.S.JAMES G. BERRYMAN, Lawrence Livermore National Laboratory, California, U.S.MICHAEL FEHLER, Los Alamos National Laboratory, New Mexico, U.S.
ACQUISITION/PROCESSINGCoordinated by William Dragoset
Figure 1. P-wave velocity and attenuation tomograms (in color) calcu-lated by Quan and Harris (1997) at BP’s Devine test site.
Downloaded 01 Dec 2011 to 171.64.173.107. Redistribution subject to SEG license or copyright; see Terms of Use at http://segdl.org/
crosswell studies in sedimentary rocks at these and shallowerdepths.
An important series of experiments have been performedby Sams et al. (1997) at the Imperial College borehole test sitein northeastern England. Four boreholes were drilled to a
depth of a few hundred meters through a layered sequenceof limestones, sandstones, siltstones, and mudstones. Coreswere taken at many depths from one of the boreholes and ultra-sonic measurements (300-900 kHz) of attenuation and veloc-ity performed. Full-waveform sonic log (8-24 kHz), crosswell(200-2300 Hz), and VSP (30-280 Hz) experiments were alsoused to obtain the velocity and attenuation structure at thetest site assuming constant Q for each measurement type andlayer-cake structure. Figure 2 summarizes their results. Thevariance of the individual measurements within each rectan-gular box is due to the rock heterogeneity in the layeredsequence. This is the only study we know of that has attemptedattenuation measurements over such a broad range of fre-quencies for a single geologic sequence of rocks.
Sams et al. correct both their VSP and sonic log measure-ments to allow for scattering attenuation from the known lay-ering present (to a first approximation, the horizontal crosswellmeasurements do not require such corrections). They deter-mine that for the sonic-log measurement, the scattering atten-uation is 1000/Qsc = 5.5 ± 2.3, while the remaining intrinsic(= total - scattering) attenuation is 1000/Qin = 96.5 ± 4.6 withthe variance again due to the range of rock types present. Forthe VSP measurements, they determine a scattering attenua-tion of 1000/Qsc = 8.3 ± 1.4 and an intrinsic attenuation of1000/Qin = 32 ± 4.5. Although there are uncertainties in esti-mating such scattering losses even for layer-cake structure, itmay safely be concluded that for the sedimentary-rocksequence at the Imperial College test site, intrinsic attenua-tion dominates the scattering attenuation across the seismicband.
Determining and subtracting the scattering attenuationfrom the total apparent attenuation of seismic waves has beenthe subject of much research over the past 20 or so years—e.g., Wu and Aki (1988, 1989, 1990). The scattering from wave-length-scale and smaller heterogeneity has an absorption-likeeffect on transmitted seismic energy. Accordingly, the totalapparent attenuation in transmission experiments is alwaysgreater than the intrinsic attenuation. This is not necessarilythe case for reflection experiments because backscattering cansometimes enhance the apparent amplitude of the reflectedenergy. Techniques for separating intrinsic and scatteringlosses in surface seismic (reflection) data are not yet welldeveloped (see Dasgupta and Clark, 1998, for a recent attempt).Accordingly, research on scattering attenuation has focusedprincipally on transmission-dominated data such as earth-quake, VSP, crosswell, sonic-log and laboratory data (thoughreflections can contribute significantly to both VSP and sonicdata).
To account for scattering losses in sedimentary basins, theearth is often modeled as being finely layered. The propertiesof the fine layers are estimated from well logs and the scat-tering losses are most often estimated using the O’Doherty-Anstey (1971) transmission formula. If the scattering is dueto random three-dimensional heterogeneity, radiative-trans-fer theory (see Sato and Fehler, 1998, for a review) is gener-ally used. This theory demonstrates that the intensity of aseismic wave in a strongly scattering random material is con-trolled by a diffusion equation and not a wave equation whenpropagation distances are large compared to the distancebetween scatterers.
Sato and Fehler (1998) present a method called “multipletime-lapse window analysis” that uses a scalar radiative-trans-fer equation to fit the decay of the intensity of S-waves overdifferent time windows in order to estimate the scattering con-tribution to the total attenuation of the wavefield. This methodhas been applied to both regional seismic data having prop-agation distances throughout the entire continental crust, and
0000 THE LEADING EDGE JUNE 2003 JUNE 2003 THE LEADING EDGE 519
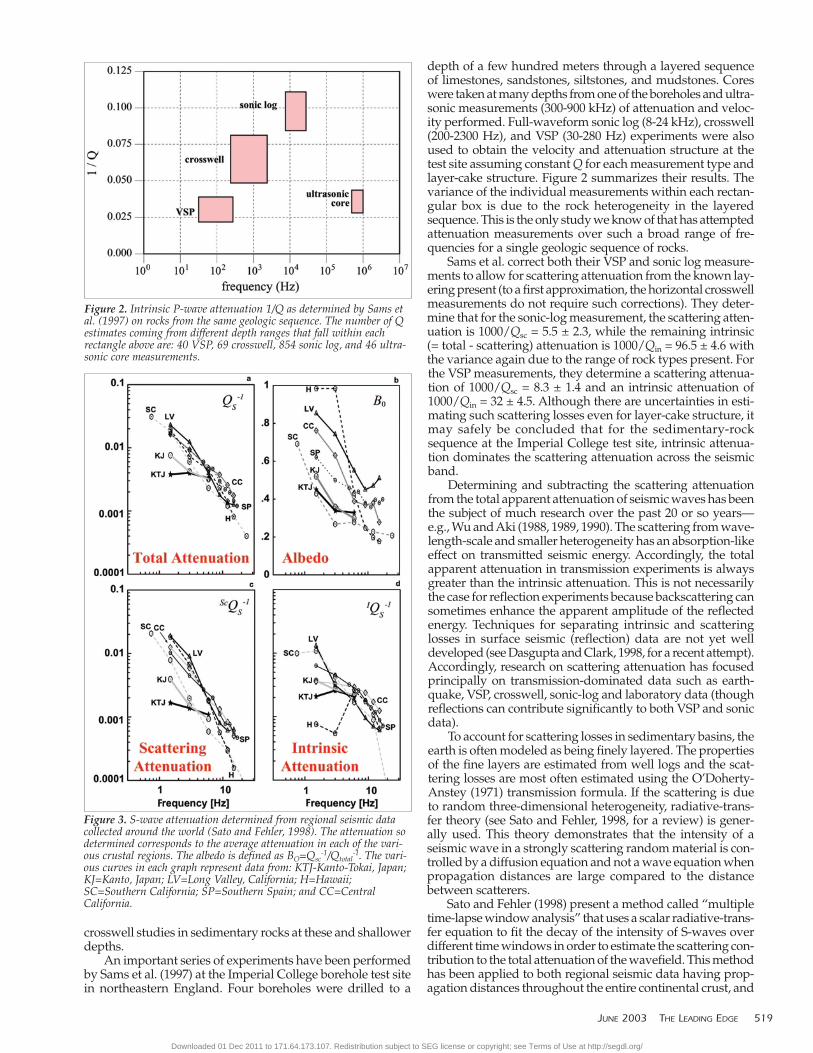
Figure 2. Intrinsic P-wave attenuation 1/Q as determined by Sams etal. (1997) on rocks from the same geologic sequence. The number of Qestimates coming from different depth ranges that fall within eachrectangle above are: 40 VSP, 69 crosswell, 854 sonic log, and 46 ultra-sonic core measurements.
Figure 3. S-wave attenuation determined from regional seismic datacollected around the world (Sato and Fehler, 1998). The attenuation sodetermined corresponds to the average attenuation in each of the vari-ous crustal regions. The albedo is defined as BO=Qsc
-1/Qtotal-1. The vari-
ous curves in each graph represent data from: KTJ-Kanto-Tokai, Japan;KJ=Kanto, Japan; LV=Long Valley, California; H=Hawaii;SC=Southern California; SP=Southern Spain; and CC=CentralCalifornia.
Downloaded 01 Dec 2011 to 171.64.173.107. Redistribution subject to SEG license or copyright; see Terms of Use at http://segdl.org/
to higher-frequency data collected over short distances. Forexample, Feustel et al. (1996) applied the method to 1 kHz datacollected in mines. Figure 3 shows the Sato and Fehler analy-sis of regional earthquake data (propagation distances of 100-300 km) collected by various authors from various tectonicregimes throughout the world. It can be seen that at the scaleof the entire crust, and for frequencies of 1-10 Hz, scatteringand intrinsic attenuation contributes roughly equally to thetotal attenuation with the scattering fraction (the so-called“albedo”) decreasing with increasing frequency. Interestingly,the scattering estimates of Sato and Fehler (1-10 Hz), Feustelet al. (1 kHz), and Sams et al. (100 Hz and 10 kHz) are all wellfit (perhaps coincidentally) by the simple scaling law Q-1
sc/Q-
1total ≈ f -0.3.
The conclusion we wish to draw from these field mea-surements is that over a range of frequencies and thereforespatial scales, the intrinsic attenuation is not hopelesslysmaller than the scattering attenuation; indeed, in theseexamples, it dominates the entire seismic band. Any directrelation between seismic amplitudes and permeability isnecessarily due to the intrinsic attenuation and so theseexamples provide a positive first result.
Nonetheless, there can certainly besituations where intrinsic attenuation issimply not operative so that all atten-uation is due to scattering. For exam-ple, Herkenhoff, Stefani, and Rector(results presented at a 2001 SEGregional conference in Baku,Azerbaijan) analyze deepwater offshoreVSPs (frequencies near 100 Hz) and cal-culate the attenuation in intervalsbetween 1300 and 2300 m below theseafloor. The rocks in this depth rangeare a stratified sequence of low-per-meability tertiary shales. The measuredinterval attenuation falls within therange 3 � 10-3 < Q-1 < 10-2 and theseauthors determine that scattering alone(O’Doherty-Anstey) can explain theserelatively small values. The absence ofintrinsic attenuation in this example isconsistent with the idea that not muchwave-induced flow can occur in sucha deep shale sequence.
Ideally, the entire seismogramwould be used to determine intrinsicattenuation and not just the waveformof the first arrival. One approach fordoing so is that of Tarantola (1986) inwhich the difference between recordedand synthetic seismograms is itera-tively minimized via conjugate-gradi-ent updates of the material propertiesat each voxel of the earth (the inversionvoxels have linear dimensions on theorder of, or larger than, the centralwavelength). The required Frechétderivatives defining how changes in amaterial property of a voxel affect thesynthetic geophone data are best deter-mined numerically; however, even withthe recent advances in low-cost super-computing, such direct calculations ofthe Frechét derivatives remain timeprohibitive. Analytical approximationsfor these derivatives are normally
employed, resulting in less-than-ideal updates. Furthermore,the success of a gradient search is controlled largely by theinitial velocity model provided. The initial model must bebuilt up from some combination of well-logs, moveout cor-rections, first-arrival tomography, and (ideally) Monte-Carlosearches using the entire seismic data set. Obtaining an accu-rate initial velocity structure is itself a nontrivial time-con-suming effort.
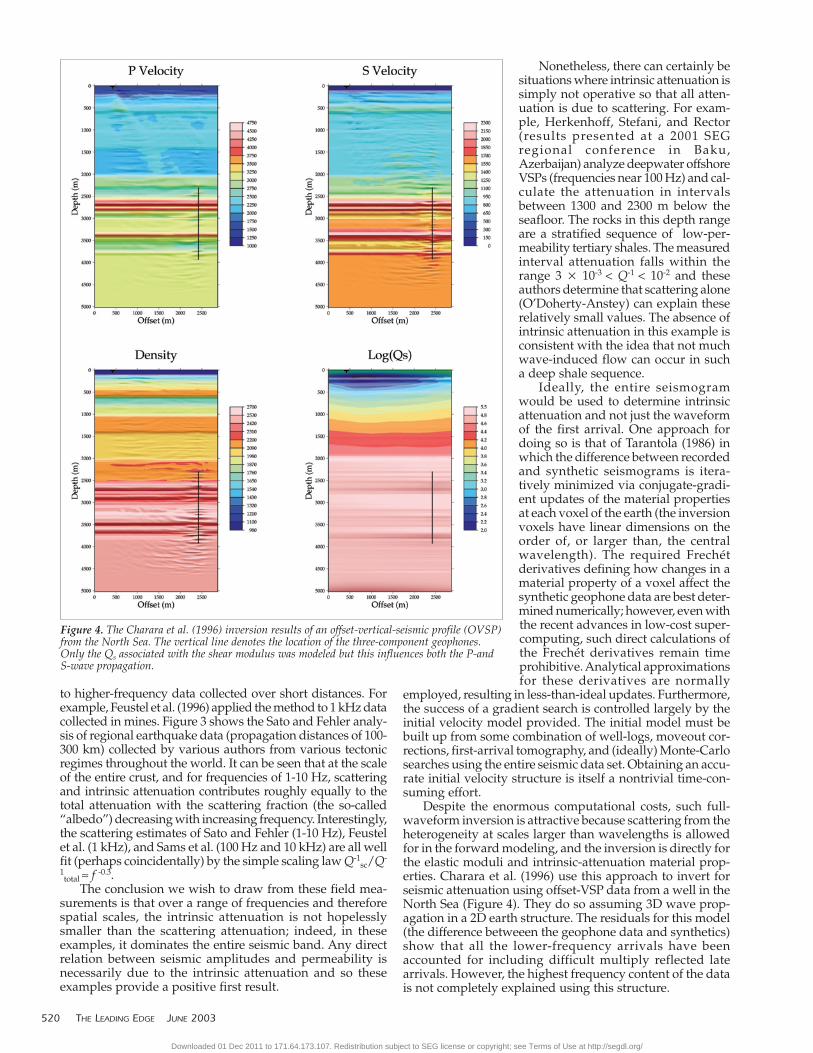
Despite the enormous computational costs, such full-waveform inversion is attractive because scattering from theheterogeneity at scales larger than wavelengths is allowedfor in the forward modeling, and the inversion is directly forthe elastic moduli and intrinsic-attenuation material prop-erties. Charara et al. (1996) use this approach to invert forseismic attenuation using offset-VSP data from a well in theNorth Sea (Figure 4). They do so assuming 3D wave prop-agation in a 2D earth structure. The residuals for this model(the difference betweeen the geophone data and synthetics)show that all the lower-frequency arrivals have beenaccounted for including difficult multiply reflected latearrivals. However, the highest frequency content of the datais not completely explained using this structure.
520 THE LEADING EDGE JUNE 2003 JUNE 2003 THE LEADING EDGE 0000
Figure 4. The Charara et al. (1996) inversion results of an offset-vertical-seismic profile (OVSP)from the North Sea. The vertical line denotes the location of the three-component geophones.Only the Qs associated with the shear modulus was modeled but this influences both the P-andS-wave propagation.
Downloaded 01 Dec 2011 to 171.64.173.107. Redistribution subject to SEG license or copyright; see Terms of Use at http://segdl.org/

A practical near-term approach for using surface seismicdata is to target certain regions or interfaces of interest, down-ward continue the prestack seismic wavefield to the targetedregion, and perform AVO analysis on the local reflection. Inorder to obtain information about the attenuation in the tar-geted region, the downward continuation must preserve therelative amplitudes of the wavefield. It therefore must be per-formed using a wave equation with sufficient knowledge ofthe velocity structure that focusing/defocusing effects, inter-ference of multiple arrivals, and diffraction/refraction effectsare all reasonably allowed for in reconstructing the local reflec-tion. Such “local inversion” of downward continued data hasbeen the focus of much recent research including that by Wuand Chen (2002) and Chen and Wu (2002).
The physics of intrinsic attenuation in the seismic band.When a P-wave propagates through a fluid-saturated porousrock, it induces three types (or regimes) of fluid flow withinan averaging volume. The averaging volume in this discus-sion may be thought of as the voxel or discretization elementin a finite-difference forward model and corresponds to thefinest resolution at which the seismic response is to be deter-mined. The three regimes of wave-induced flow are definedby the distance over which the fluid pressure attempts toequilibrate by diffusion and will be called “macro,” “micro,”and “meso.” The viscous flow in each case attenuates waveenergy. No other loss mechanisms need be considered since,as will be seen, such wave-induced flow can explain the mea-sured levels of intrinsic attenuation.
First, there is the macro or wavelength-scale equilibrationbetween the peaks and troughs of a P-wave that Biot (1956)allowed for. At the scale of the averaging volume (which ismuch smaller than the wavelength), the wavelength-scalefluid-pressure gradient is equivalent to a uniform body forcedriving an incompressible flow across the volume. Becausethis body force continuously varies from one voxel to the nextover a wavelength, there are fluid accumulations in the vox-els and a fluid-pressure diffusion between the peaks andtroughs of the wave. As for any diffusion process, the timenecessary for the fluid-pressure differences to equilibrate goesas λ2/D, where λ is the wavelength (the distance to be equili-brated) and D is the pore-pressure diffusivity. In a porous con-tinuum, D is given by D = Mk/η, where k is the Darcypermeability, η the fluid viscosity, and M an elastic moduluscalled the “fluid-storage coefficient” that is well approximatedas M ≈ Kf /φ where φ is porosity and Kf the bulk modulus ofthe saturating fluid. The wavelength can be written λ = √H/ρ/fwhere H is the P-wave elastic modulus, ρ the material den-sity, and f the frequency (Hz). Maximum loss (as measuredby 1/Q) occurs when the wave period 1/f just equals the equi-libration time λ2/D and thus occurs at the relaxation frequency
(1)
Implicitly assumed in this order of magnitude estimate is thatthe material is uniform at the scale of each wavelength.Interestingly, the frequency fc is of the same order of magni-tude as that when viscous boundary layers first begin todevelop in the pores of a rock (such boundary layers developas the viscous “parabolic-profile” flow in the pores is replacedby inertia-dominated ideal “plug-profile” flow at sufficientlyhigh frequencies). The onset of viscous-boundary layers for-mally occurs at the frequency η/(ρf kF) where ρf is the fluiddensity and F is the electrical formation factor. Since ρM/Hdoes not differ greatly from ρf F for many rocks, fluid-pres-sure equilibration and viscous-boundary-layer developmentoccur at about the same frequency. When f >> fc, all loss in the
Biot model is occurring in the viscous-boundary layers result-ing in Q-1 falling off as 1/√ f; when f << fc (where Biot loss isnot of seismological importance), Q-1 increases as fk/η.
Second, there is the micro equilibration that takes place atgrain scales. Laboratory samples often have broken grain con-tacts and/or microcracks in the grains. Much of this damageoccurs as a rock is brought from depth to the surface. Sincediagenetic processes in a sedimentary basin tend to cementmicrocracks and grain contacts, it is uncertain whether in-siturocks have significant numbers of open microcracks.Nonetheless, if such grain-scale damage is present, as it alwaysis in laboratory rock samples at ambient pressures, the fluid-pressure response in the microcracks will be greater than inthe principal porespace when the rock is compressed by a P-wave. Gary Mavko of Stanford University was the first to ana-lyze the resulting flow from crack to pore which he called“squirt flow.” Dvorkin et al. (1995) went on to establish aquantitative model for fully saturated rocks. In squirt flow,the time required for a microcrack of length R to equilibratewith a neighboring pore is R2/Dh where the fluid-pressure dif-fusivity Dh in this case is that for a crack of aperture h and isgiven by Dh ≈ Kf h2/η. Equating the wave period 1/f to theequilibration time again determines the order-of-magnitudefrequency at which the loss is maximum
(2)
This expression has several interesting features: (1) the depen-dence on fluid viscosity is just inverse to that in the Biot wave-length-scale equilibration; (2) there is no dependence on thepermeability of the material (microcracks in the grains and/orbroken grain contacts do not influence the permeability of asandstone); and (3) since for water Kf /η ≈ 1012 Hz, the onlyway that squirt loss can peak in the seismic band is if the micro-crack aspect ratios are quite small—e.g., h/R < 10-4. However,as the aspect ratio decreases, so does the microcrack volumewith the effect that the attenuation itself decreases with theaspect ratio. This idea is quantified momentarily.
Third, there is the flow at mesoscopic scales due to het-erogeneity of the porous-continuum properties within eachaveraging volume. Wavelengths in the exploration band (10-103 Hz) range from hundreds of meters to meters so that theaveraging volumes in seismic exploration have linear dimen-sions ranging from a few tens of centimeters (crosswell) to afew tens of meters (surface seismic). Earth materials withinvolumes of this size always have some degree of heterogeneitybeyond that associated with the grains and pores. This couldbe due to, for example, interbedded shales and sands orjoints/fractures embedded within a lower permeability sand-stone. Even within an apparently homogeneous sandstone,there can be zones or pockets where the grains are less wellcemented together (diagenesis is a transport-driven processand need not be spatially uniform). The physical effect of suchheterogeneity is similar to squirt flow: where the frameworkof grains is relatively weak, the fluid pressure response willbe greater than where it is relatively stiff. Fluid equilibrationensues but this time over some intermediate mesoscopic scaleL as fixed by the heterogeneity within an averaging volume.The maximum loss associated with such flow again occurswhen 1/fc = L2/D or
(3)
where M, k, and φ are the storage coefficient, permeability,and porosity of the porous matrix material within which thesofter material is embedded. The dependence of the relax-ation frequency on the ratio k/η is just opposite to that in
0000 THE LEADING EDGE JUNE 2003 JUNE 2003 THE LEADING EDGE 521
Downloaded 01 Dec 2011 to 171.64.173.107. Redistribution subject to SEG license or copyright; see Terms of Use at http://segdl.org/
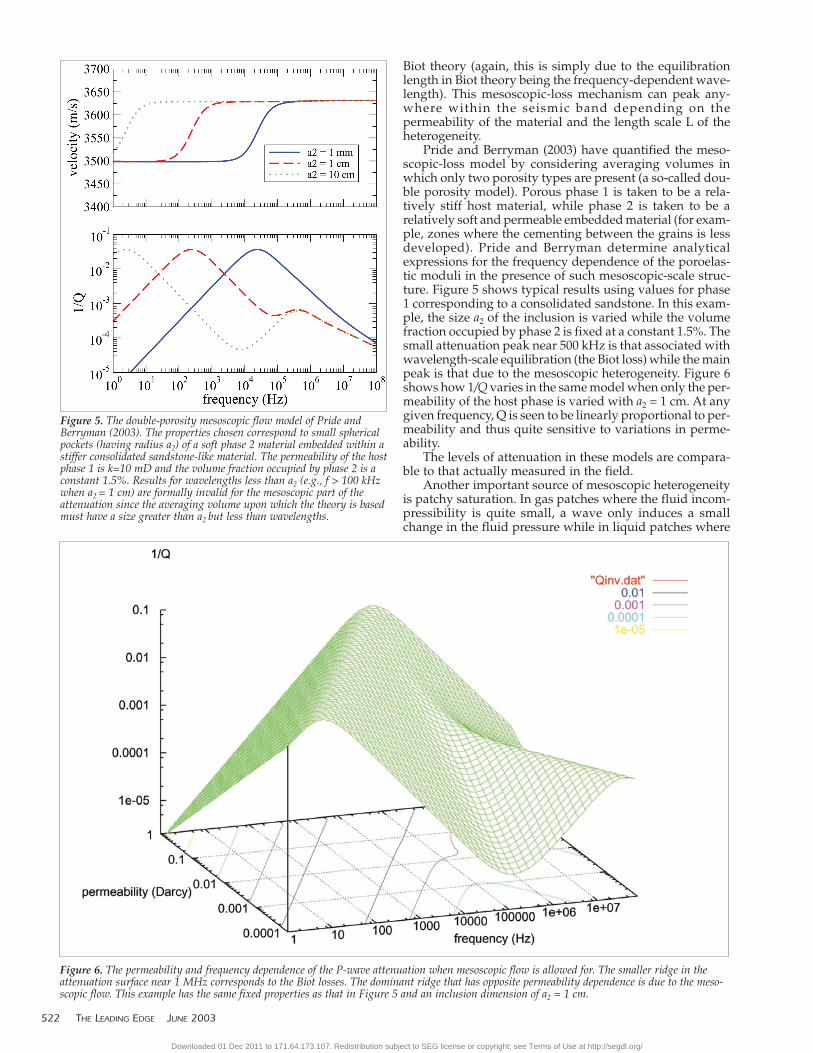
Biot theory (again, this is simply due to the equilibrationlength in Biot theory being the frequency-dependent wave-length). This mesoscopic-loss mechanism can peak any-where within the seismic band depending on thepermeability of the material and the length scale L of theheterogeneity.
Pride and Berryman (2003) have quantified the meso-scopic-loss model by considering averaging volumes inwhich only two porosity types are present (a so-called dou-ble porosity model). Porous phase 1 is taken to be a rela-tively stiff host material, while phase 2 is taken to be arelatively soft and permeable embedded material (for exam-ple, zones where the cementing between the grains is lessdeveloped). Pride and Berryman determine analyticalexpressions for the frequency dependence of the poroelas-tic moduli in the presence of such mesoscopic-scale struc-ture. Figure 5 shows typical results using values for phase1 corresponding to a consolidated sandstone. In this exam-ple, the size a2 of the inclusion is varied while the volumefraction occupied by phase 2 is fixed at a constant 1.5%. Thesmall attenuation peak near 500 kHz is that associated withwavelength-scale equilibration (the Biot loss) while the mainpeak is that due to the mesoscopic heterogeneity. Figure 6shows how 1/Q varies in the same model when only the per-meability of the host phase is varied with a2 = 1 cm. At anygiven frequency, Q is seen to be linearly proportional to per-meability and thus quite sensitive to variations in perme-ability.
The levels of attenuation in these models are compara-ble to that actually measured in the field.
Another important source of mesoscopic heterogeneityis patchy saturation. In gas patches where the fluid incom-pressibility is quite small, a wave only induces a smallchange in the fluid pressure while in liquid patches where
522 THE LEADING EDGE JUNE 2003 JUNE 2003 THE LEADING EDGE 0000
Figure 5. The double-porosity mesoscopic flow model of Pride andBerryman (2003). The properties chosen correspond to small sphericalpockets (having radius a2) of a soft phase 2 material embedded within astiffer consolidated sandstone-like material. The permeability of the hostphase 1 is k=10 mD and the volume fraction occupied by phase 2 is aconstant 1.5%. Results for wavelengths less than a2 (e.g., f > 100 kHzwhen a2 = 1 cm) are formally invalid for the mesoscopic part of theattenuation since the averaging volume upon which the theory is basedmust have a size greater than a2 but less than wavelengths.
Figure 6. The permeability and frequency dependence of the P-wave attenuation when mesoscopic flow is allowed for. The smaller ridge in theattenuation surface near 1 MHz corresponds to the Biot losses. The dominant ridge that has opposite permeability dependence is due to the meso-scopic flow. This example has the same fixed properties as that in Figure 5 and an inclusion dimension of a2 = 1 cm.
Downloaded 01 Dec 2011 to 171.64.173.107. Redistribution subject to SEG license or copyright; see Terms of Use at http://segdl.org/
the fluid incompressibility is relatively large, a large fluidpressure is induced. There is a subsequent fluid-pressureequilibration between the patches that attenuates waveenergy. Johnson (2001) has provided a rigorous model ofattenuation in such materials that is quite similar to thePride and Berryman model discussed above. In general, Q-
1 can be very large in the seismic band (exceeding 0.1) forsuch a patchy-saturation model with the peak in Q-1 againdependent on the permeability of the material and the effec-tive patch sizes.
We underline that the general features of the mesoscopic-scale loss are similar whether the heterogeneity is in the fluidproperties or in the elastic moduli of the framework ofgrains. In particular, the mesoscopic loss in either caseincreases as Q-1 α fk/η when f << fc which makes it quite dis-tinct from the Q-1 & fk/η low-frequency increase in the Biotmodel.
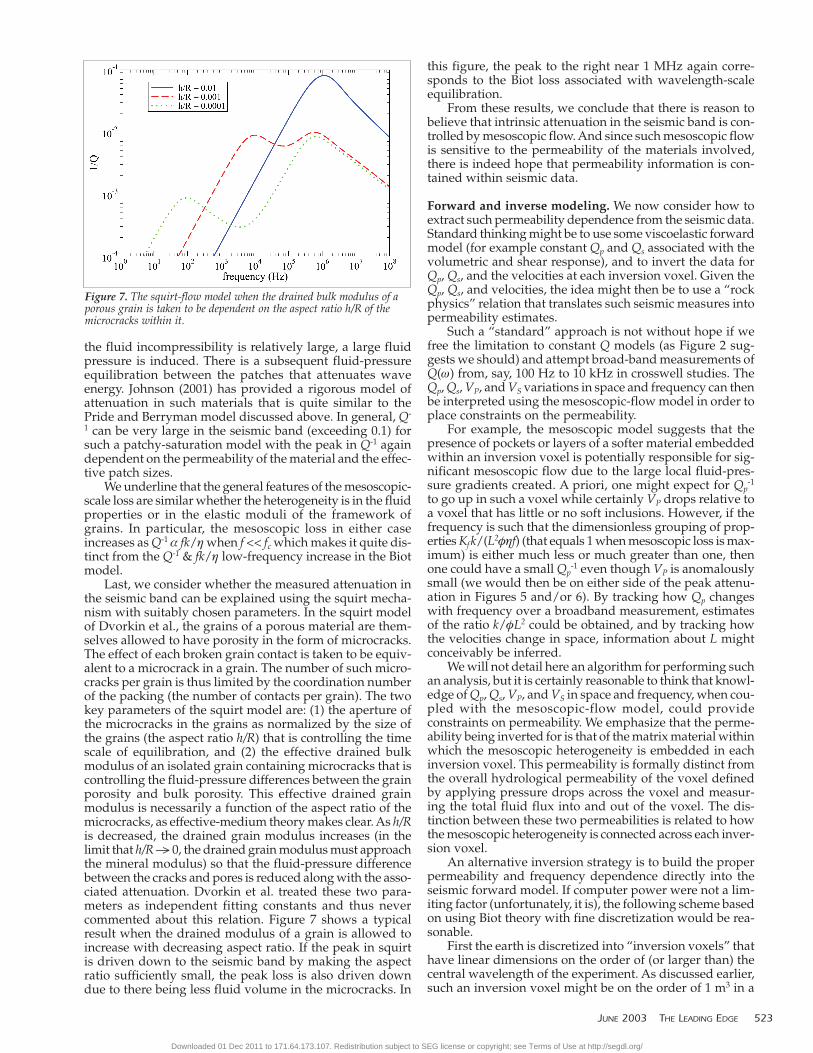
Last, we consider whether the measured attenuation inthe seismic band can be explained using the squirt mecha-nism with suitably chosen parameters. In the squirt modelof Dvorkin et al., the grains of a porous material are them-selves allowed to have porosity in the form of microcracks.The effect of each broken grain contact is taken to be equiv-alent to a microcrack in a grain. The number of such micro-cracks per grain is thus limited by the coordination numberof the packing (the number of contacts per grain). The twokey parameters of the squirt model are: (1) the aperture ofthe microcracks in the grains as normalized by the size ofthe grains (the aspect ratio h/R) that is controlling the timescale of equilibration, and (2) the effective drained bulkmodulus of an isolated grain containing microcracks that iscontrolling the fluid-pressure differences between the grainporosity and bulk porosity. This effective drained grainmodulus is necessarily a function of the aspect ratio of themicrocracks, as effective-medium theory makes clear. As h/Ris decreased, the drained grain modulus increases (in thelimit that h/R —> 0, the drained grain modulus must approachthe mineral modulus) so that the fluid-pressure differencebetween the cracks and pores is reduced along with the asso-ciated attenuation. Dvorkin et al. treated these two para-meters as independent fitting constants and thus nevercommented about this relation. Figure 7 shows a typicalresult when the drained modulus of a grain is allowed toincrease with decreasing aspect ratio. If the peak in squirtis driven down to the seismic band by making the aspectratio sufficiently small, the peak loss is also driven downdue to there being less fluid volume in the microcracks. In
this figure, the peak to the right near 1 MHz again corre-sponds to the Biot loss associated with wavelength-scaleequilibration.
From these results, we conclude that there is reason tobelieve that intrinsic attenuation in the seismic band is con-trolled by mesoscopic flow. And since such mesoscopic flowis sensitive to the permeability of the materials involved,there is indeed hope that permeability information is con-tained within seismic data.
Forward and inverse modeling. We now consider how toextract such permeability dependence from the seismic data.Standard thinking might be to use some viscoelastic forwardmodel (for example constant Qp and Qs associated with thevolumetric and shear response), and to invert the data forQp, Qs, and the velocities at each inversion voxel. Given theQp, Qs, and velocities, the idea might then be to use a “rockphysics” relation that translates such seismic measures intopermeability estimates.
Such a “standard” approach is not without hope if wefree the limitation to constant Q models (as Figure 2 sug-gests we should) and attempt broad-band measurements ofQ(ω) from, say, 100 Hz to 10 kHz in crosswell studies. TheQp, Qs, VP, and VS variations in space and frequency can thenbe interpreted using the mesoscopic-flow model in order toplace constraints on the permeability.
For example, the mesoscopic model suggests that thepresence of pockets or layers of a softer material embeddedwithin an inversion voxel is potentially responsible for sig-nificant mesoscopic flow due to the large local fluid-pres-sure gradients created. A priori, one might expect for Qp
-1
to go up in such a voxel while certainly VP drops relative toa voxel that has little or no soft inclusions. However, if thefrequency is such that the dimensionless grouping of prop-erties Kf k/(L2φηf) (that equals 1 when mesoscopic loss is max-imum) is either much less or much greater than one, thenone could have a small Qp
-1 even though VP is anomalouslysmall (we would then be on either side of the peak attenu-ation in Figures 5 and/or 6). By tracking how Qp changeswith frequency over a broadband measurement, estimatesof the ratio k/φL2 could be obtained, and by tracking howthe velocities change in space, information about L mightconceivably be inferred.
We will not detail here an algorithm for performing suchan analysis, but it is certainly reasonable to think that knowl-edge of Qp, Qs, VP, and VS in space and frequency, when cou-pled with the mesoscopic-flow model, could provideconstraints on permeability. We emphasize that the perme-ability being inverted for is that of the matrix material withinwhich the mesoscopic heterogeneity is embedded in eachinversion voxel. This permeability is formally distinct fromthe overall hydrological permeability of the voxel definedby applying pressure drops across the voxel and measur-ing the total fluid flux into and out of the voxel. The dis-tinction between these two permeabilities is related to howthe mesoscopic heterogeneity is connected across each inver-sion voxel.
An alternative inversion strategy is to build the properpermeability and frequency dependence directly into theseismic forward model. If computer power were not a lim-iting factor (unfortunately, it is), the following scheme basedon using Biot theory with fine discretization would be rea-sonable.
First the earth is discretized into “inversion voxels” thathave linear dimensions on the order of (or larger than) thecentral wavelength of the experiment. As discussed earlier,such an inversion voxel might be on the order of 1 m3 in a
0000 THE LEADING EDGE JUNE 2003 JUNE 2003 THE LEADING EDGE 523
Figure 7. The squirt-flow model when the drained bulk modulus of aporous grain is taken to be dependent on the aspect ratio h/R of themicrocracks within it.
Downloaded 01 Dec 2011 to 171.64.173.107. Redistribution subject to SEG license or copyright; see Terms of Use at http://segdl.org/
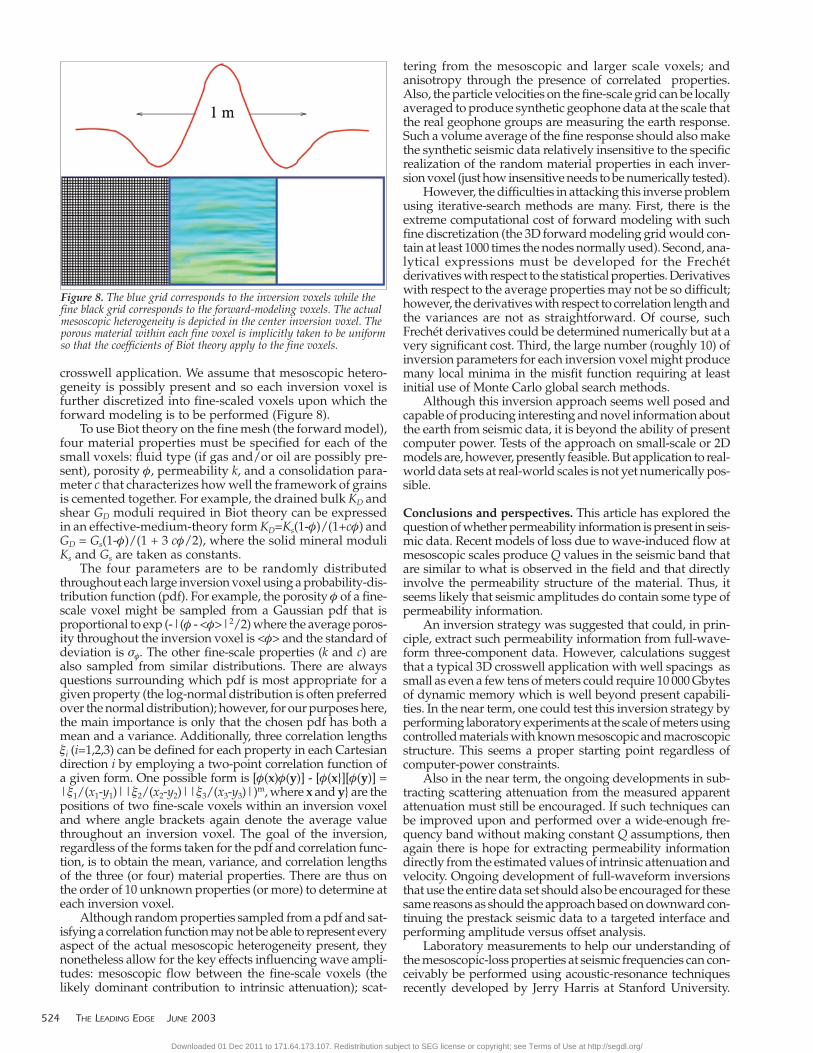
crosswell application. We assume that mesoscopic hetero-geneity is possibly present and so each inversion voxel isfurther discretized into fine-scaled voxels upon which theforward modeling is to be performed (Figure 8).
To use Biot theory on the fine mesh (the forward model),four material properties must be specified for each of thesmall voxels: fluid type (if gas and/or oil are possibly pre-sent), porosity φ, permeability k, and a consolidation para-meter c that characterizes how well the framework of grainsis cemented together. For example, the drained bulk KD andshear GD moduli required in Biot theory can be expressedin an effective-medium-theory form KD=Ks(1-φ)/(1+cφ) andGD = Gs(1-φ)/(1 + 3 cφ/2), where the solid mineral moduliKs and Gs are taken as constants.
The four parameters are to be randomly distributedthroughout each large inversion voxel using a probability-dis-tribution function (pdf). For example, the porosity φ of a fine-scale voxel might be sampled from a Gaussian pdf that isproportional to exp (-|(φ - <φ>|2/2) where the average poros-ity throughout the inversion voxel is <φ> and the standard ofdeviation is σφ. The other fine-scale properties (k and c) arealso sampled from similar distributions. There are alwaysquestions surrounding which pdf is most appropriate for agiven property (the log-normal distribution is often preferredover the normal distribution); however, for our purposes here,the main importance is only that the chosen pdf has both amean and a variance. Additionally, three correlation lengthsξi (i=1,2,3) can be defined for each property in each Cartesiandirection i by employing a two-point correlation function ofa given form. One possible form is [φ(x)φ(y)] - [φ(x}][φ(y)] =|ξ1/(x1-y1)||ξ2/(x2-y2)||ξ3/(x3-y3)|)m, where x and y} are thepositions of two fine-scale voxels within an inversion voxeland where angle brackets again denote the average valuethroughout an inversion voxel. The goal of the inversion,regardless of the forms taken for the pdf and correlation func-tion, is to obtain the mean, variance, and correlation lengthsof the three (or four) material properties. There are thus onthe order of 10 unknown properties (or more) to determine ateach inversion voxel.
Although random properties sampled from a pdf and sat-isfying a correlation function may not be able to represent everyaspect of the actual mesoscopic heterogeneity present, theynonetheless allow for the key effects influencing wave ampli-tudes: mesoscopic flow between the fine-scale voxels (thelikely dominant contribution to intrinsic attenuation); scat-
tering from the mesoscopic and larger scale voxels; andanisotropy through the presence of correlated properties.Also, the particle velocities on the fine-scale grid can be locallyaveraged to produce synthetic geophone data at the scale thatthe real geophone groups are measuring the earth response.Such a volume average of the fine response should also makethe synthetic seismic data relatively insensitive to the specificrealization of the random material properties in each inver-sion voxel (just how insensitive needs to be numerically tested).
However, the difficulties in attacking this inverse problemusing iterative-search methods are many. First, there is theextreme computational cost of forward modeling with suchfine discretization (the 3D forward modeling grid would con-tain at least 1000 times the nodes normally used). Second, ana-lytical expressions must be developed for the Frechétderivatives with respect to the statistical properties. Derivativeswith respect to the average properties may not be so difficult;however, the derivatives with respect to correlation length andthe variances are not as straightforward. Of course, suchFrechét derivatives could be determined numerically but at avery significant cost. Third, the large number (roughly 10) ofinversion parameters for each inversion voxel might producemany local minima in the misfit function requiring at leastinitial use of Monte Carlo global search methods.
Although this inversion approach seems well posed andcapable of producing interesting and novel information aboutthe earth from seismic data, it is beyond the ability of presentcomputer power. Tests of the approach on small-scale or 2Dmodels are, however, presently feasible. But application to real-world data sets at real-world scales is not yet numerically pos-sible.
Conclusions and perspectives. This article has explored thequestion of whether permeability information is present in seis-mic data. Recent models of loss due to wave-induced flow atmesoscopic scales produce Q values in the seismic band thatare similar to what is observed in the field and that directlyinvolve the permeability structure of the material. Thus, itseems likely that seismic amplitudes do contain some type ofpermeability information.
An inversion strategy was suggested that could, in prin-ciple, extract such permeability information from full-wave-form three-component data. However, calculations suggestthat a typical 3D crosswell application with well spacings assmall as even a few tens of meters could require 10 000 Gbytesof dynamic memory which is well beyond present capabili-ties. In the near term, one could test this inversion strategy byperforming laboratory experiments at the scale of meters usingcontrolled materials with known mesoscopic and macroscopicstructure. This seems a proper starting point regardless ofcomputer-power constraints.
Also in the near term, the ongoing developments in sub-tracting scattering attenuation from the measured apparentattenuation must still be encouraged. If such techniques canbe improved upon and performed over a wide-enough fre-quency band without making constant Q assumptions, thenagain there is hope for extracting permeability informationdirectly from the estimated values of intrinsic attenuation andvelocity. Ongoing development of full-waveform inversionsthat use the entire data set should also be encouraged for thesesame reasons as should the approach based on downward con-tinuing the prestack seismic data to a targeted interface andperforming amplitude versus offset analysis.
Laboratory measurements to help our understanding ofthe mesoscopic-loss properties at seismic frequencies can con-ceivably be performed using acoustic-resonance techniquesrecently developed by Jerry Harris at Stanford University.
524 THE LEADING EDGE JUNE 2003 JUNE 2003 THE LEADING EDGE 0000
Figure 8. The blue grid corresponds to the inversion voxels while thefine black grid corresponds to the forward-modeling voxels. The actualmesoscopic heterogeneity is depicted in the center inversion voxel. Theporous material within each fine voxel is implicitly taken to be uniformso that the coefficients of Biot theory apply to the fine voxels.
Downloaded 01 Dec 2011 to 171.64.173.107. Redistribution subject to SEG license or copyright; see Terms of Use at http://segdl.org/
In this method, the resonant peaks of an acoustic tank areperturbed by the presence of a rock sample. Depending onthe dimensions of the tank and the properties of the fluid fill-ing the tank, the fundamental resonant mode can be made tolie anywhere within the seismic band of frequencies. The shift-ing and broadening of the tank’s resonance peaks due to thepresence of the rock sample can be used to estimate the elas-tic and Q properties of the rock within the seismic band. Otherlaboratory approaches such as using 1-10 kHz piezoelectrictransducers on large rock samples (linear dimensions on theorder of meters) should also be encouraged.
So in order to obtain permeability information that is likelycontained within seismic data, more research is required on:the theoretical nature of forward modeling in porous materi-als containing mesoscopic heterogeneity; the numerical chal-lenges of using Biot theory on finely discretized grids as theforward model in various inverse schemes; seismic experi-ments at the meter scale using controlled materials havingknown mesoscopic and macroscopic heterogeneity; acousticresonance studies of attenuation in the seismic band; andimproving our current abilities to invert for frequency-depen-dent Q from broadband seismic experiments and to subtractthe scattering contribution to obtain the intrinsic attenuation.Such an ambitious research agenda has a real chance of resolv-ing the degree to which permeability information can beextracted from seismic data.
Suggested reading. “Inversion of seismic attributes for velocityand attenuation” by Nowack and Matheney (Geophysical JournalInternational, 1997). “Seismic attenuation and tomography usingthe frequency shift method” by Quan and Harris (GEOPHYSICS,1997). “The measurement of velocity dispersion and frequency-dependent intrinsic attenuation in sedimentary rocks” by Samset al. (GEOPHYSICS, 1997). “Scattering and attenuation of seismicwaves” by Wu and Aki (three special issues of Pure and AppliedGeophysics 1988, 1989, and 1990). “Estimation of Q from surfaceseismic reflection data” by Dasgupta and Clark (GEOPHYSICS,1998). “Reflections on amplitudes” by O’Doherty and Anstey(Geophysical Prospecting, 1971). Seismic Wave Propagation andScattering in the Heterogeneous Earth by Sato and Fehler (SpringerVerlag & AIP Press, 1998). “Rock mass characterization usingintrinsic and scattering attenuation estimates at frequencies from400 to 1600 Hz” by Feustel et al. (Pure and Applied Geophysics, 1996).“A strategy for nonlinear elastic inversion of seismic reflectiondata” by Tarantola (GEOPHYSICS, 1986). “The state of affairs in inver-sion of seismic data: An OVSP example” by Charara et al. (SEG1996 Expanded Abstracts). “Target-oriented prestack beamlet migra-tion using Gabor-Daubechies frames” by Chen and Wu (SEG 2002Expanded Abstracts). “Mapping directional illumination and aqui-sition-aperature efficiency by beamlet propagators” by Wu andChen (SEG 2002 Expanded Abstracts). “Linear dynamics of dou-ble-porosity dual-permeability materials” by Pride and Berryman(Physical Review E, 2003). “Theory of frequency dependentacoustics in patchy-saturated porous materials” by Johnson(Journal of the Acoustical Society of America, 2001). “Theory of prop-agation of elastic waves in a fluid-saturated porous solid” by Biot(Journal of the Acoustical Society of America, 1956). “Squirt flow infully saturated rocks” by Dvorkin et al. (GEOPHYSICS, 1995). TLE
Acknowledgments: Thanks to Roger Turpening of DOE for the vision andenergy to organize a workshop on this theme, and to Marwan Charara ofSchlumberger for Figure 4.
Corresponding author: [email protected]
0000 THE LEADING EDGE JUNE 2003 JUNE 2003 THE LEADING EDGE 525
Downloaded 01 Dec 2011 to 171.64.173.107. Redistribution subject to SEG license or copyright; see Terms of Use at http://segdl.org/