1
Example Ultrasound measurements of optic nerve sheath diameter (ONSD) was analyzed  to demonstrate the usefulness of the methods. Measurements were collected on 23 subjects during preflight (the year prior to launch) , inflight, postflight (within 7 days of landing). The data were highly unbalanced with 20 individuals with 12 preflight exams, 18 with 13 inflight exams, and 22 with postflight measurements. The techniques described are flexible enough to deal with the imbalance without underlying distributional assumptions on the data. Bootstrap Estimation Bootstrap estimation was used to construct 95% confidence limits on the mean of preinand immediate postflight measurements of ONSD. Estimates were made using 100,000 bootstrap samples. Permutation Testing Permutation testing was used to analyze whether the pre ‐to inflight shift in ONSD measurements was statistically significant. The difference metric used for testing was a difference in means. Below is the permutation distribution for 500,000 random permutations with the red vertical line representing the observed shift. There were no permutations that resulted in a difference more extreme than that observed  (0.05 cm) indicating a pvalue less than 1/500,000 (p<0.0001). Permutation Testing A permutation test is a type of statistical significance test which is conducted by estimating the distribution of the chosen statistic under the null hypothesis. In most cases, the null hypothesis states that there is no difference between one or more groups for some metric. Permutation testing permutes the group labels on the data to define the null distribution of specified test statistics. Then, the observed difference can be compared to determine significance. How it works: Suppose you want to test for differences between 2 groups (A and B) with sample sizes n a and n b . 1. Identify the difference metric you want to analyze (for instance, the difference in means between the 2 groups) and calculate the observed difference. 2. Pool the data from the 2 groups and permute the labels (group A or B) for each of the data points. In the permuted sample there should be n a assigned to group A and n b to group B. 3. Calculate the mean difference for the permuted test and store the result. 4. Using steps 2 and 3, create the distribution of differences in means under the null hypothesis (there is no difference between the samples in A and B). This can be done in 2 ways: 1) Calculate the mean difference for every possible permutation. This is the most thorough method and results in exact test pvalues. 2) Calculate the mean difference for a large sample (typically 10,000 or more) of random permutations. 5. Compare the observed mean difference calculated in 1 to the permutation distribution. The proportion of differences equal to or more extreme than the observed serve as the pvalue for the permutation test. Advantages Permutation tests can be created for any statistic so the user is free to choose a test statistic that will best estimate the difference of interest. Can be used for analyzing complicated unbalanced designs or for combined datasets including all types of data (categorical, ordinal, and numeric). Limitations Under the null hypothesis, it assumes that the observations are exchangeable. A consequence to this assumption is that tests of differences (like the ttest) require equal variance in the groups. Introduction Most traditional statistical testing and estimation methods involve underlying distributional assumptions. These procedures can result in biased results when the assumptions are not met. There are nonparametric approaches that do not rely on underlying distributional assumptions such as normality. A subset of these approaches makes use of resampling the observed data to generate estimates and conduct hypothesis testing. In essence, resamplingbased methods such as Bootstrapping and permutation testing allow for empirical statistical estimation and hypothesis testing using the observed data itself. Often, the only assumption of these methods is that the observed data are a representative sample from the underlying population. Bootstrap Resampling Bootstrapping involves randomly resampling with replacement the observed data many times to generate an empirical distribution for the statistic of interest. The resulting distribution is used to create statistical estimates of variability and confidence limits. There are no distributional assumptions but most bootstrap estimates are created under the premise that the observed data comes from an independent and identically distributed population. How it works: Suppose you have N observations of some measurement and you want to produce  a 95% confidence interval for the mean. 1. Randomly sample with replacement N observations from the original data (some observations will likely be repeated) 2. Calculate the mean of the sampled data 3. Accumulate many means on sampled data (typically 10,000 or more) to generate a distribution of the mean estimate 4. The 2.5% and 97.5% quantiles of the distribution serve as 95% confidence limits on the mean. Advantages Allows for estimation of the sampling distribution for almost any statistic of interest, even for more complicated statistics such as percentile points, proportions, odds ratios, and correlation coefficients. No distributional assumptions Limitations Although bootstrap estimates are asymptotically consistent, there are no guarantees for finite samples. Can require some manual coding of the sampling routine. Permutation Testing and Bootstrapping: Nonparametric Approaches to Statistical Testing and Estimation Millennia Young Wyle Science, Technology and Engineering Group https://ntrs.nasa.gov/search.jsp?R=20150001882 2019-08-28T23:20:02+00:00Z

Permutation Testing Bootstrapping: Approaches Statistical ... · Example Ultrasound measurements of optic nerve sheath diameter (ONSD) was analyzed to demonstrate the usefulness of

  • Upload
    dotram

  • View
    215

  • Download
    0

Embed Size (px)

Citation preview

ExampleUltrasound measurements of optic nerve sheath diameter (ONSD) was analyzed  to demonstrate the usefulness of the methods. Measurements were collected on 23 subjects during pre‐flight (the year prior to launch) , in‐flight, post‐flight (within 7 days of landing). The data were highly unbalanced with 20 individuals with 1‐2 pre‐flight exams, 18 with 1‐3 inflight exams, and 22 with post‐flight measurements. The techniques described are flexible enough to deal with the imbalance without underlying distributional assumptions on the data.

Bootstrap EstimationBootstrap estimation was used to construct 95% confidence limits on the mean of pre‐ in‐ and immediate post‐flight measurements of ONSD. Estimates were made using 100,000 bootstrap samples.

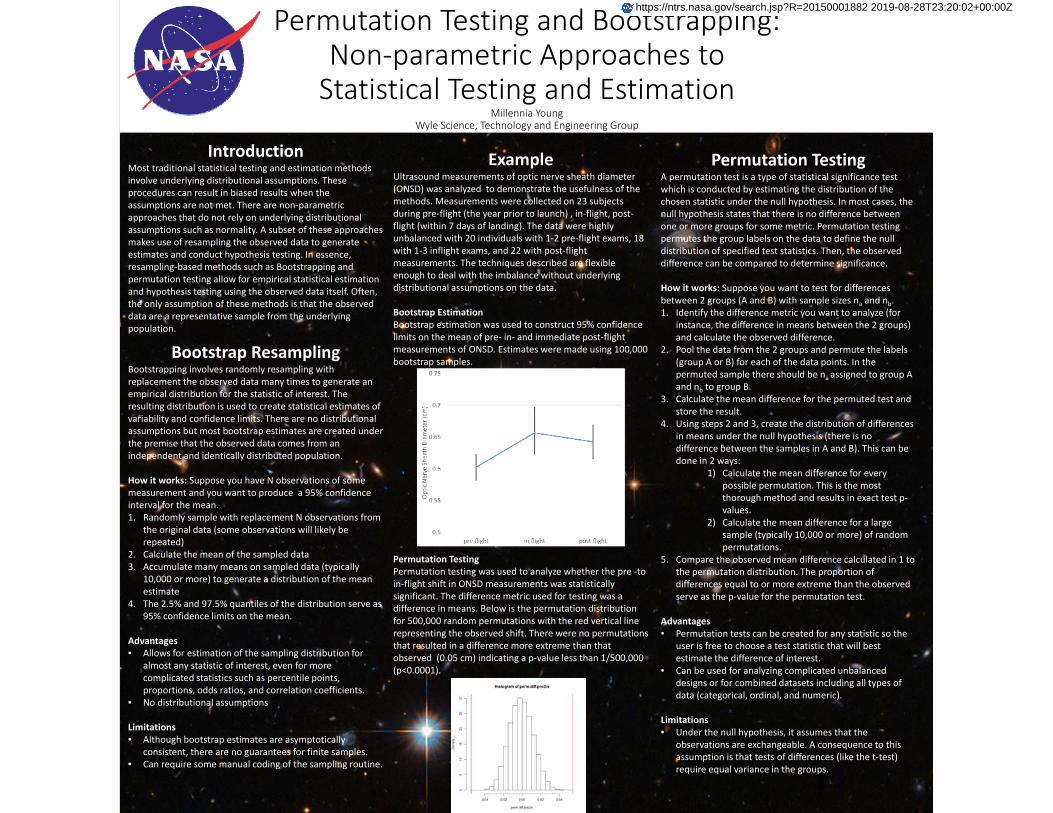
Permutation TestingPermutation testing was used to analyze whether the pre ‐to in‐flight shift in ONSD measurements was statistically significant. The difference metric used for testing was a difference in means. Below is the permutation distribution for 500,000 random permutations with the red vertical line representing the observed shift. There were no permutations that resulted in a difference more extreme than that observed  (0.05 cm) indicating a p‐value less than 1/500,000 (p<0.0001).

Permutation TestingA permutation test is a type of statistical significance test which is conducted by estimating the distribution of the chosen statistic under the null hypothesis. In most cases, the null hypothesis states that there is no difference between one or more groups for some metric. Permutation testing permutes the group labels on the data to define the null distribution of specified test statistics. Then, the observed difference can be compared to determine significance.

How it works: Suppose you want to test for differences between 2 groups (A and B) with sample sizes na and nb.1. Identify the difference metric you want to analyze (for 

instance, the difference in means between the 2 groups) and calculate the observed difference.

2. Pool the data from the 2 groups and permute the labels (group A or B) for each of the data points. In the permuted sample there should be na assigned to group A and nb to group B.

3. Calculate the mean difference for the permuted test and store the result.

4. Using steps 2 and 3, create the distribution of differences in means under the null hypothesis (there is no difference between the samples in A and B). This can be done in 2 ways:

1) Calculate the mean difference for every possible permutation. This is the most thorough method and results in exact test p‐values.

2) Calculate the mean difference for a large sample (typically 10,000 or more) of random permutations.

5. Compare the observed mean difference calculated in 1 to the permutation distribution. The proportion of differences equal to or more extreme than the observed serve as the p‐value for the permutation test.

Advantages• Permutation tests can be created for any statistic so the 

user is free to choose a test statistic that will best estimate the difference of interest.

• Can be used for analyzing complicated unbalanced designs or for combined datasets including all types of data (categorical, ordinal, and numeric).

Limitations• Under the null hypothesis, it assumes that the 

observations are exchangeable. A consequence to this assumption is that tests of differences (like the t‐test) require equal variance in the groups.

IntroductionMost traditional statistical testing and estimation methods involve underlying distributional assumptions. These procedures can result in biased results when the assumptions are not met. There are non‐parametric approaches that do not rely on underlying distributional assumptions such as normality. A subset of these approaches makes use of resampling the observed data to generate estimates and conduct hypothesis testing. In essence, resampling‐based methods such as Bootstrapping and permutation testing allow for empirical statistical estimation and hypothesis testing using the observed data itself. Often, the only assumption of these methods is that the observed data are a representative sample from the underlying population. 

Bootstrap ResamplingBootstrapping involves randomly resampling with replacement the observed data many times to generate an empirical distribution for the statistic of interest. The resulting distribution is used to create statistical estimates of variability and confidence limits. There are no distributional assumptions but most bootstrap estimates are created under the premise that the observed data comes from an independent and identically distributed population.

How it works: Suppose you have N observations of some measurement and you want to produce  a 95% confidence interval for the mean. 1. Randomly sample with replacement N observations from 

the original data (some observations will likely be repeated)

2. Calculate the mean of the sampled data3. Accumulate many means on sampled data (typically 

10,000 or more) to generate a distribution of the mean estimate

4. The 2.5% and 97.5% quantiles of the distribution serve as 95% confidence limits on the mean.

Advantages• Allows for estimation of the sampling distribution for 

almost any statistic of interest, even for more complicated statistics such as percentile points, proportions, odds ratios, and correlation coefficients.

• No distributional assumptions

Limitations• Although bootstrap estimates are asymptotically 

consistent, there are no guarantees for finite samples.• Can require some manual coding of the sampling routine.

Permutation Testing and Bootstrapping: Non‐parametric Approaches to Statistical Testing and Estimation

Millennia YoungWyle Science, Technology and Engineering Group

https://ntrs.nasa.gov/search.jsp?R=20150001882 2019-08-28T23:20:02+00:00Z