Embed Size (px)
Citation preview
Macrotech Developers Limited (Formerly known as Lodha Developers Limited): Lodha Excelus , NM Joshi Marg, Mahalaxmi, Mumbai 400 011, India • T + 91 22 6133 4400
Regd. Office : 412, Floor-4, 17G Vardhaman Chamber, Cawasji Patel Road, Horniman Circle, Fort, Mumbai 400 001, India
CIN: U45200MH1995PLC093041 www.lodhagroup.in
May 15, 2021 The Listing Dept., BSE Limited Corporate Relationship Department Phiroze Jeejeebhoy Towers Dalal Street Mumbai- 400001 Scrip Code: 543287 Scrip ID:-LODHA
The Listing Dept. National Stock Exchange of India Limited Exchange Plaza, C-1, Block G Bandra Kurla Complex Bandra (E), Mumbai – 400 051 Trading Symbol : LODHA Debt Segment - DB - LDPL23 & DB-LODL23
Dear Sir/Madam, Sub: Presentation made to analysts and media on Audited Financial Results for the quarter and
year ended March 31, 2021 In continuation of today’s our letter, we enclose herewith revised investor’s presentation on the Audited Financial Results for quarter and year ended March 31, 2021, made to the analysts and media. Kindly take the same on record. Thanking you, Yours faithfully, For Macrotech Developers Limited Sanjyot Rangnekar Company Secretary & Compliance Officer Membership No. F4154 Encl:- A/a
Investor Presentation
Fourth Quarter FY2021
15th May 2021
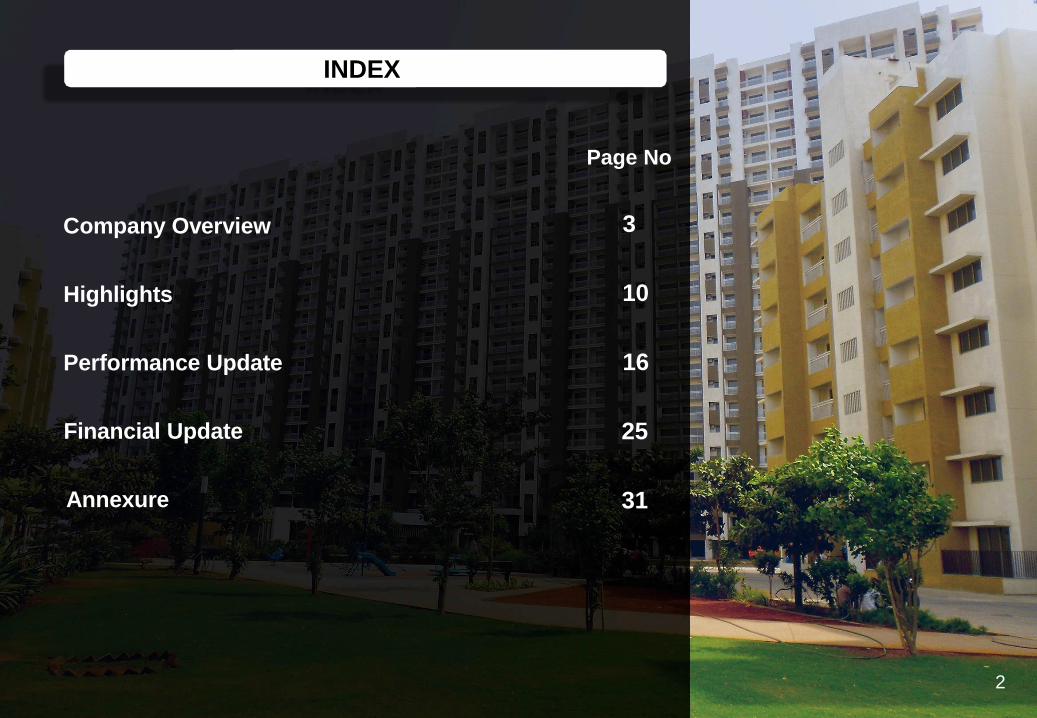
INDEX
Page No
16
25
31
3
Highlights
Performance Update
Annexure
Financial Update
Company Overview
10
2
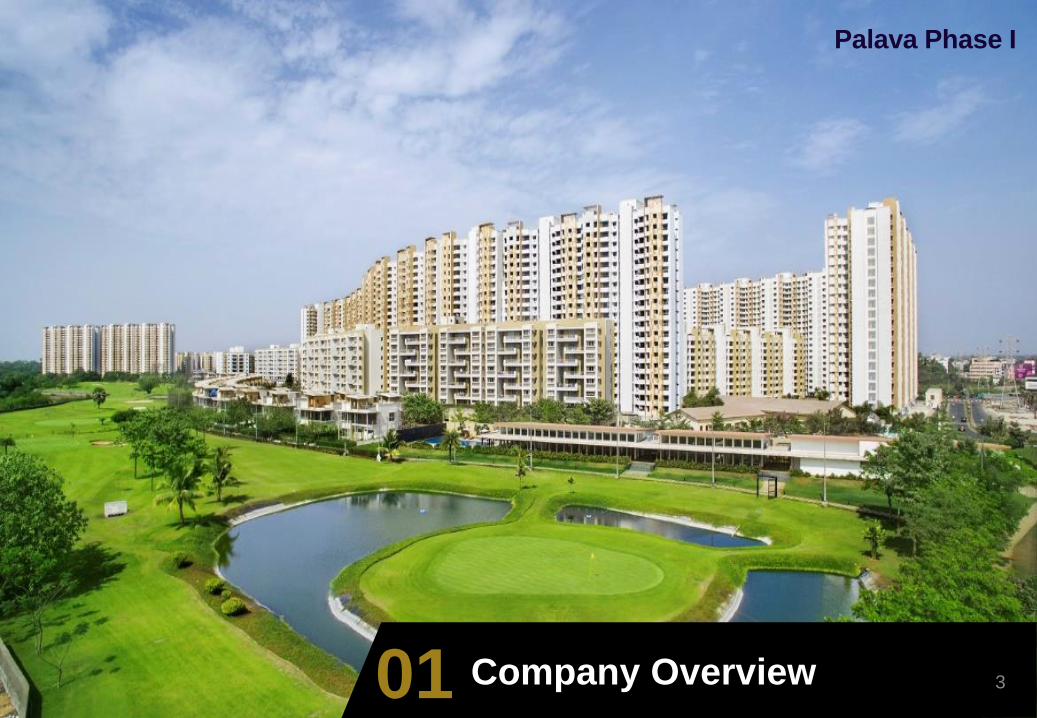
301 Company Overview
Palava Phase I
3

Leading Residential Platform
India’s Largest Real Estate Developer^
~INR 50,000 Cr of cumulative sales in the last seven fiscal years
~58% sales from affordable and mid-income
Market Leader in MMR Region
>10% market share
Operational Excellence & Strong Brand
High quality management
Strong focus on sustainable development
~80 msf developable area – completed
~74 msf developable area – ongoing & planned
Strong Financial Profile
Strong track record of profitability
Adj. EBITDA margin** of ~30%
PAT margin** of ~13%
High RoE** profile
Annuity like cashflow from townships
~1,100 acres strategic land reserves with developable area of ~93 msf (ex. land for industrial parks)
Average gross collections** #of INR 21.7bn
Cash flow visibility through inventory
~5.4msf of residential RTM inventory
13.8msf of ongoing residential inventory
Non core cash flows – delever faster
Monetization of ready commercial assets
Surplus cash from UK investment
Multiple Growth Drivers
Future potential to expand further in MMR & Pune
~INR 70,000 Cr. yearly absorption in micro-markets with insignificant presence
Asset light growth strategy
Leveraging our leadership position and marketing & sales capabilities to become a partner of choice for landowners through JVs / JDAs
Strong traction in industrial park segment
>3500 acre ongoing & planned industrial & logistics park
>250 acres monetized through JVs/ Outright sale
^by residential sales over last 7 years;
** ex FY21 which was a Covid impacted year; # average of FY18-20
4
Lodha – India’s leading real estate developer, focused on disciplined growth
5
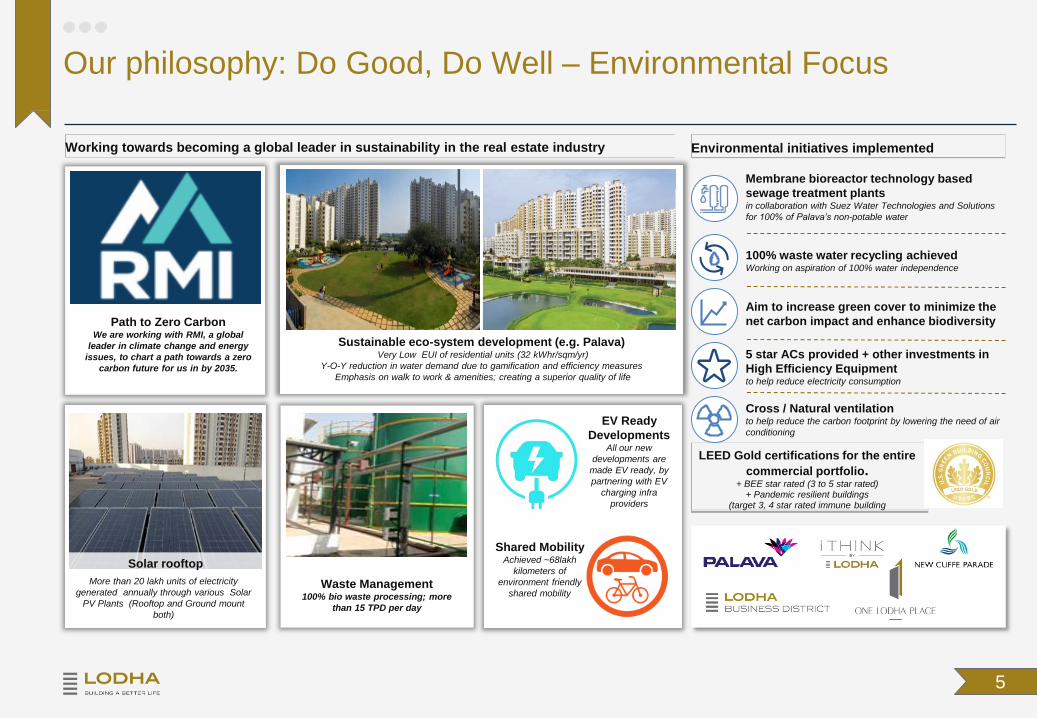
Working towards becoming a global leader in sustainability in the real estate industry
LEED Gold certifications for the entire
commercial portfolio.+ BEE star rated (3 to 5 star rated)
+ Pandemic resilient buildings (target 3, 4 star rated immune building
100% waste water recycling achievedWorking on aspiration of 100% water independence
5 star ACs provided + other investments in
High Efficiency Equipmentto help reduce electricity consumption
Cross / Natural ventilationto help reduce the carbon footprint by lowering the need of air
conditioning
Environmental initiatives implemented
Aim to increase green cover to minimize the
net carbon impact and enhance biodiversity
Membrane bioreactor technology based
sewage treatment plants in collaboration with Suez Water Technologies and Solutions
for 100% of Palava’s non-potable water
Solar rooftop
Large open green areas
Open space of ~15 acres in NCP and ~7 acres in Lodha Park
More than 20 lakh units of electricity
generated annually through various Solar
PV Plants (Rooftop and Ground mount
both)
Waste Management100% bio waste processing; more
than 15 TPD per day
Sustainable eco-system development (e.g. Palava) Very Low EUI of residential units (32 kWhr/sqm/yr)
Y-O-Y reduction in water demand due to gamification and efficiency measures
Emphasis on walk to work & amenities; creating a superior quality of life
EV Ready
DevelopmentsAll our new
developments are
made EV ready, by
partnering with EV
charging infra
providers
Shared MobilityAchieved ~68lakh
kilometers of
environment friendly
shared mobility
Path to Zero CarbonWe are working with RMI, a global
leader in climate change and energy
issues, to chart a path towards a zero
carbon future for us in by 2035.
Our philosophy: Do Good, Do Well – Environmental Focus
6
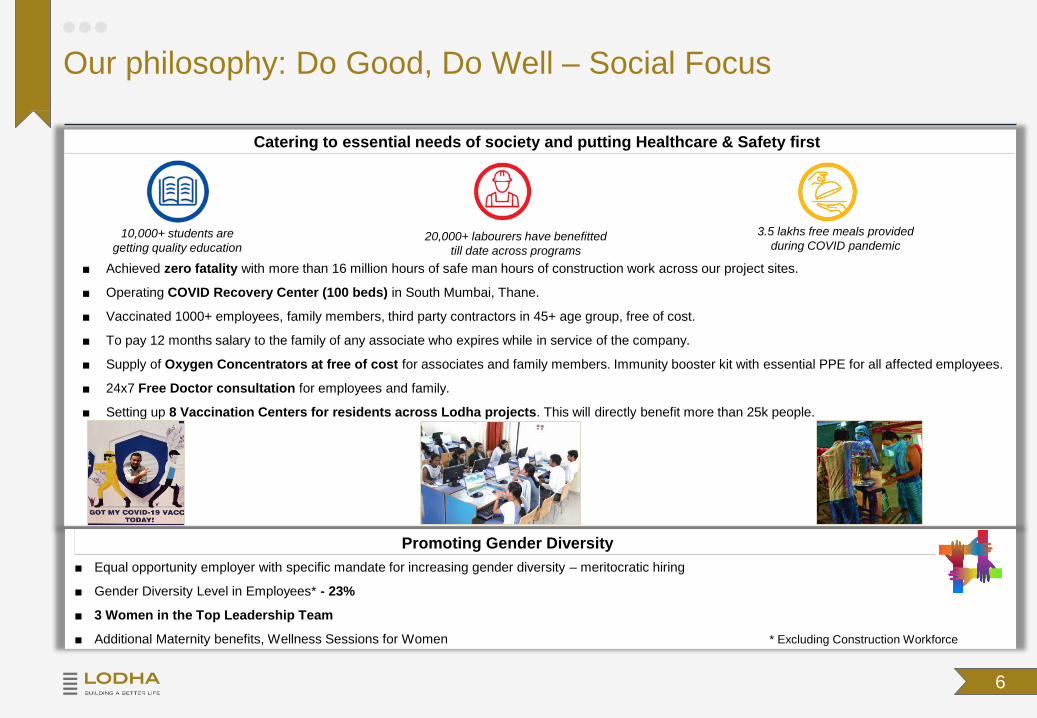
Promoting Gender Diversity
■ Equal opportunity employer with specific mandate for increasing gender diversity – meritocratic hiring
■ Gender Diversity Level in Employees* - 23%
■ 3 Women in the Top Leadership Team
■ Additional Maternity benefits, Wellness Sessions for Women * Excluding Construction Workforce
■ Achieved zero fatality with more than 16 million hours of safe man hours of construction work across our project sites.
■ Operating COVID Recovery Center (100 beds) in South Mumbai, Thane.
■ Vaccinated 1000+ employees, family members, third party contractors in 45+ age group, free of cost.
■ To pay 12 months salary to the family of any associate who expires while in service of the company.
■ Supply of Oxygen Concentrators at free of cost for associates and family members. Immunity booster kit with essential PPE for all affected employees.
■ 24x7 Free Doctor consultation for employees and family.
■ Setting up 8 Vaccination Centers for residents across Lodha projects. This will directly benefit more than 25k people.
Catering to essential needs of society and putting Healthcare & Safety first
3.5 lakhs free meals provided
during COVID pandemic10,000+ students are
getting quality education20,000+ labourers have benefitted
till date across programs
Our philosophy: Do Good, Do Well – Social Focus
7
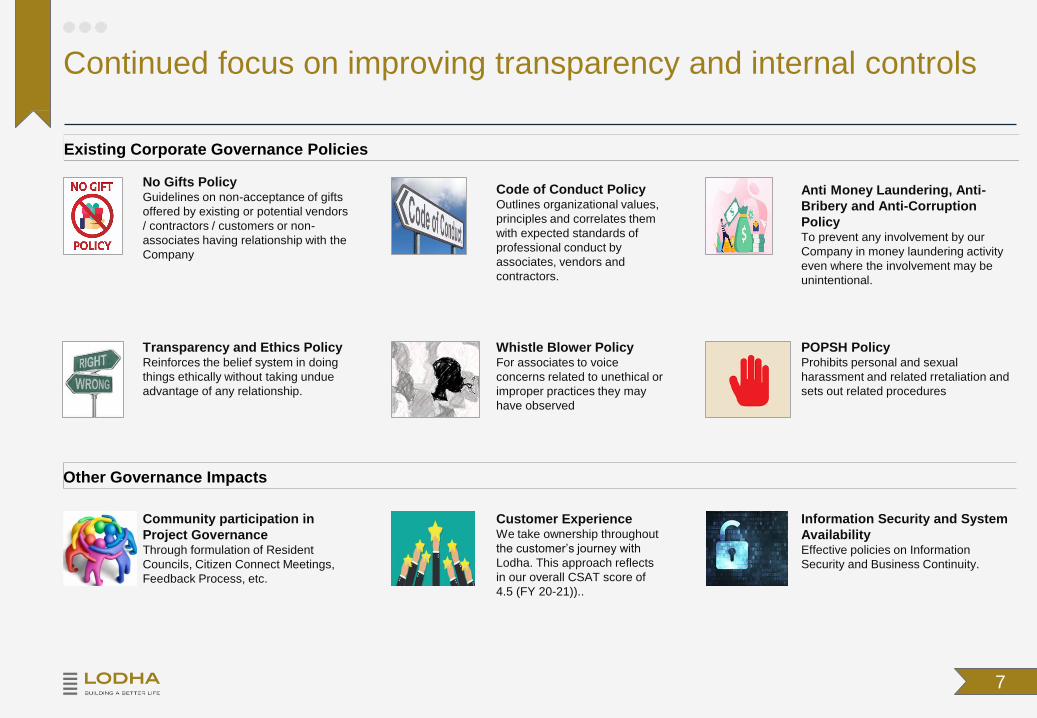
Existing Corporate Governance Policies
No Gifts PolicyGuidelines on non-acceptance of gifts
offered by existing or potential vendors
/ contractors / customers or non-
associates having relationship with the
Company
Code of Conduct PolicyOutlines organizational values,
principles and correlates them
with expected standards of
professional conduct by
associates, vendors and
contractors.
Anti Money Laundering, Anti-
Bribery and Anti-Corruption
PolicyTo prevent any involvement by our
Company in money laundering activity
even where the involvement may be
unintentional.
Transparency and Ethics PolicyReinforces the belief system in doing
things ethically without taking undue
advantage of any relationship.
Whistle Blower PolicyFor associates to voice
concerns related to unethical or
improper practices they may
have observed
POPSH PolicyProhibits personal and sexual
harassment and related rretaliation and
sets out related procedures
Customer ExperienceWe take ownership throughout
the customer’s journey with
Lodha. This approach reflects
in our overall CSAT score of
4.5 (FY 20-21))..
Community participation in
Project GovernanceThrough formulation of Resident
Councils, Citizen Connect Meetings,
Feedback Process, etc.
Information Security and System
AvailabilityEffective policies on Information
Security and Business Continuity.
Other Governance Impacts
Continued focus on improving transparency and internal controls
8
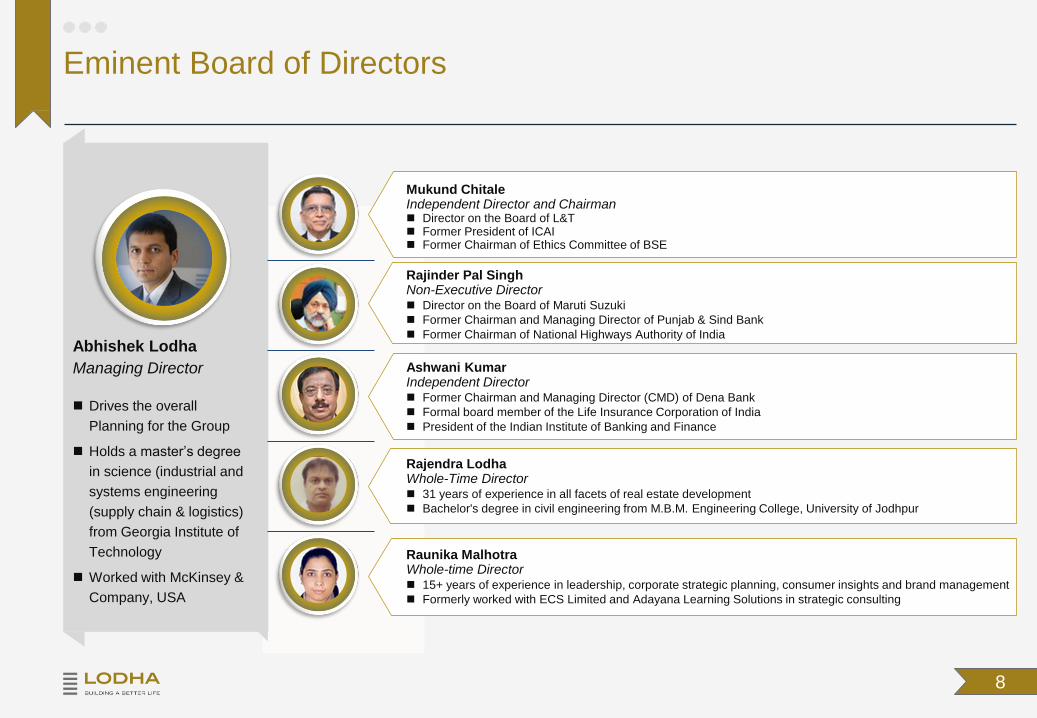
Abhishek Lodha
Managing Director
Drives the overall
Planning for the Group
Holds a master’s degree
in science (industrial and
systems engineering
(supply chain & logistics)
from Georgia Institute of
Technology
Worked with McKinsey &
Company, USA
Mukund ChitaleIndependent Director and Chairman Director on the Board of L&T Former President of ICAI Former Chairman of Ethics Committee of BSE
Rajinder Pal SinghNon-Executive Director Director on the Board of Maruti Suzuki
Former Chairman and Managing Director of Punjab & Sind Bank
Former Chairman of National Highways Authority of India
Ashwani KumarIndependent Director Former Chairman and Managing Director (CMD) of Dena Bank
Formal board member of the Life Insurance Corporation of India
President of the Indian Institute of Banking and Finance
Rajendra LodhaWhole-Time Director 31 years of experience in all facets of real estate development
Bachelor's degree in civil engineering from M.B.M. Engineering College, University of Jodhpur
Raunika MalhotraWhole-time Director 15+ years of experience in leadership, corporate strategic planning, consumer insights and brand management
Formerly worked with ECS Limited and Adayana Learning Solutions in strategic consulting
Eminent Board of Directors

xx Experience in the industryNote: 1As of 31 Dec, 2020
9
High quality management team
Significant experience across industries &
functionsDepth of Experience in Key Competencies Excellent domain knowledge
Strong senior-level
management team of 851
executives heading various
functions
Focus on hiring and
retaining talent - mix of
experienced & fresh talent
from premier education
institutes
Streamlined retention
strategy in place for key
associates (like long-term
incentives, housing benefit
plans etc)
Sushil Kumar Modi
Chief Financial Officer
Formerly served as Group CFO-
Strategic Finance at GMR Group
Shaishav Dharia
CEO – Townships and Rental Assets
Formerly worked with McKinsey &
Company and Logic Tools
Janhavi Sukhtankar
President – Human Resources
Formerly held senior positions at
Greenpeace International and Aventis
Pharma (now Sanofi India)
Prashant Bindal
Chief Sales Officer
Formerly worked with Spice Mobilitiy,
Walmart India (Cash and Carry) and
Hindustan Coca Cola Beverages
Prateek Bhattacharya
President – Mid-income and Affordable
Housing
Formerly served as Expert Associate
Principal at McKinsey and Company
Raunika Malhotra
President – Marketing and Corporate
Communications
Formerly worked at Adayana and ECS
Limited
Rajesh Sahana
President – Consumer Experience
Formerly associated with Globacom,
Reliance Jio, Bharti Airtel, ABN Amro
Bank and Bank of America
Gopal Menghani
President- Legal
Formerly held senior positions at
Reliance Industries Limited
Deepak Chitnis
Executive Vice President - Design
Experience in design and development
Previously served as senior architect at
Oberoi Constructions Private Ltd
Abhishek Lodha
Chief Executive Officer
Formerly worked with McKinsey &
Company, USA
33+
2620+
22+
20+
19
25+
25+
15+
24+

1002 Highlights 10
“World Tower – Ball Room”
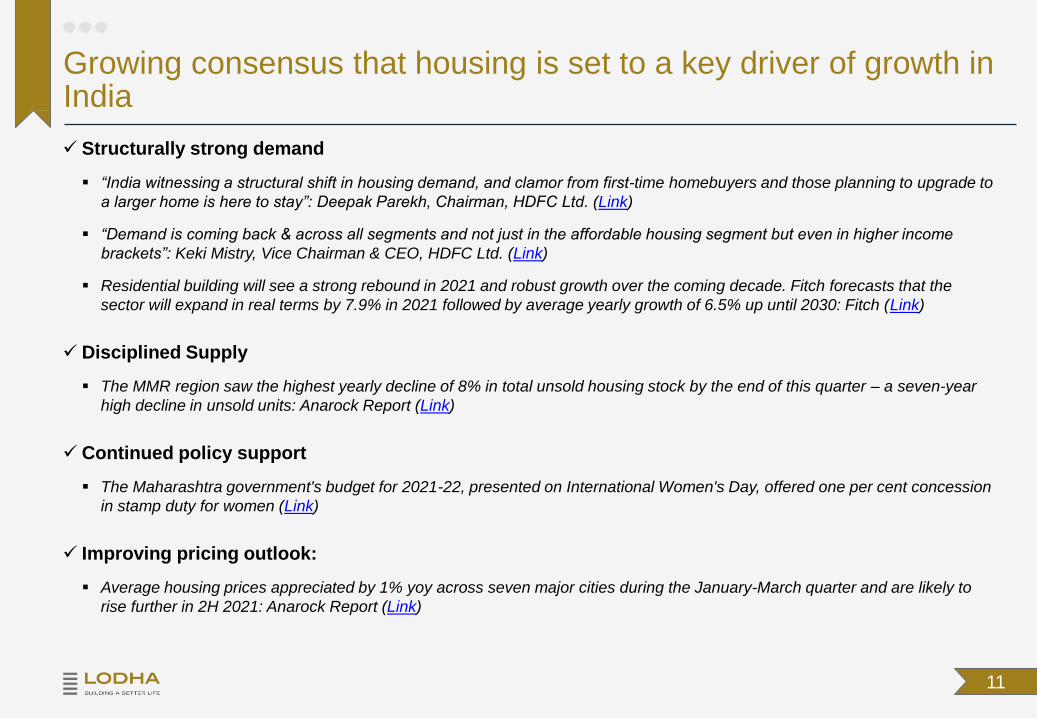
Structurally strong demand
“India witnessing a structural shift in housing demand, and clamor from first-time homebuyers and those planning to upgrade to
a larger home is here to stay”: Deepak Parekh, Chairman, HDFC Ltd. (Link)
“Demand is coming back & across all segments and not just in the affordable housing segment but even in higher income
brackets”: Keki Mistry, Vice Chairman & CEO, HDFC Ltd. (Link)
Residential building will see a strong rebound in 2021 and robust growth over the coming decade. Fitch forecasts that the
sector will expand in real terms by 7.9% in 2021 followed by average yearly growth of 6.5% up until 2030: Fitch (Link)
Disciplined Supply
The MMR region saw the highest yearly decline of 8% in total unsold housing stock by the end of this quarter – a seven-year
high decline in unsold units: Anarock Report (Link)
Continued policy support
The Maharashtra government's budget for 2021-22, presented on International Women's Day, offered one per cent concession
in stamp duty for women (Link)
Improving pricing outlook:
Average housing prices appreciated by 1% yoy across seven major cities during the January-March quarter and are likely to
rise further in 2H 2021: Anarock Report (Link)
11
Growing consensus that housing is set to a key driver of growth in India
Strong Structural
Demand
Best Ever
Affordability
Disciplined Supply
Situation
Ind
ustr
y a
t sta
rt o
f u
pcycle
with
in
cre
asin
g s
ha
re fo
r T
ier
1
pla
ye
rs lik
e L
od
ha a
nd
im
pro
ve
d p
rofita
bili
ty
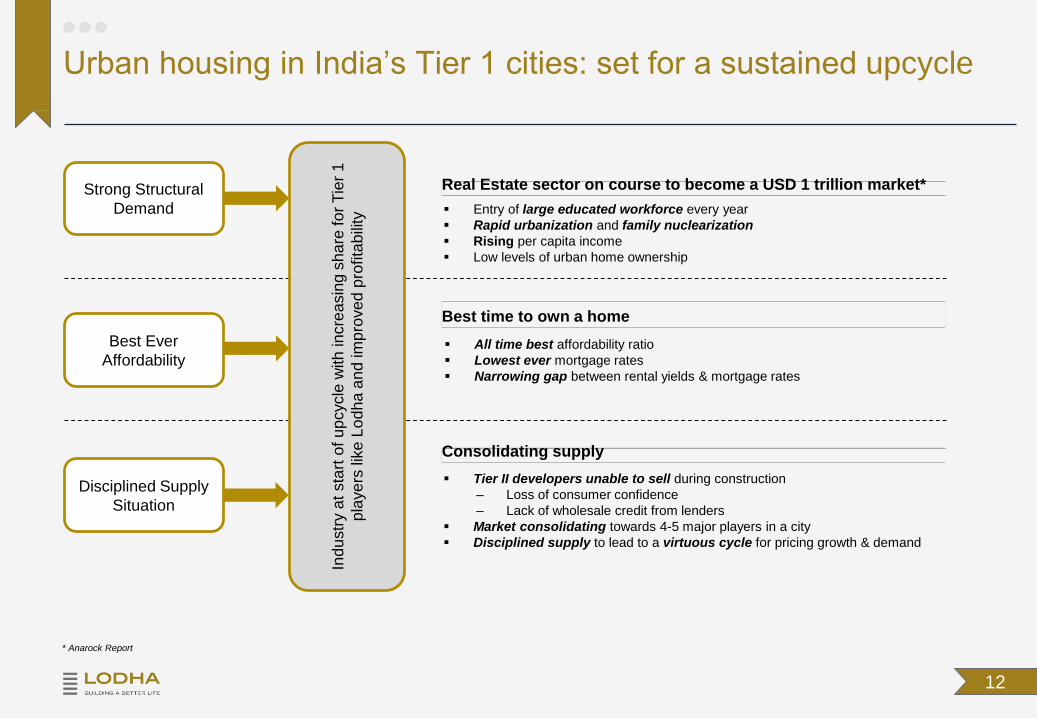
Real Estate sector on course to become a USD 1 trillion market*
Best time to own a home
Entry of large educated workforce every year
Rapid urbanization and family nuclearization
Rising per capita income
Low levels of urban home ownership
All time best affordability ratio
Lowest ever mortgage rates
Narrowing gap between rental yields & mortgage rates
Tier II developers unable to sell during construction
– Loss of consumer confidence
– Lack of wholesale credit from lenders
Market consolidating towards 4-5 major players in a city
Disciplined supply to lead to a virtuous cycle for pricing growth & demand
* Anarock Report
12
Urban housing in India’s Tier 1 cities: set for a sustained upcycle
Consolidating supply

13
Despite Covid, Strong Pre-sales performance of INR 2,531 crores 116% YoY & 36% QoQ
Adjusted EBITDA at INR 943 crores 87% YoY & 68% QoQ. Adjusted EBITDA margin improved to 37%.
PAT of INR 312 crores
Affordable & mid-income housing segment accounted for 57% and 58% pre-sales of the total residential
pre-sales for 4QFY21 and FY21 respectively.
Reduced net debt by INR 544 crores
For India operations
Q4 FY21: Strong performance across all key KPIs

14
Upper Thane received first set of OC - Boost to our Township business; Rising occupancies to fuel further
demand
Industrial Park- Monetized nearly 165 acres of industrial park (JV /outright sale) with marquee investors e.g.
Morgan Stanley, FM logistics (French 3 PL co.) and US based pharmaceutical company
Land monetization (other than industrial park) – INR 64 Cr.
On Growth Track; JDAs entered
• Western Suburbs (Malad): estimated GDV of ~INR 600 crores
• Pune (NIBM): estimated GDV of ~INR 900 crores
Other Highlights

Technology
People
ESG
Undergo a Tech. Transformation to achieve operational improvement, revenue growth, superior customer &
employee experience
2 yr. roadmap to ensure high value solutions implemented earliest; Initiatives identified - Data Lake, Virtual Home
Viewings, Integrated HR Solution, Robotic process automation etc.
Timely adoption of futuristic solutions which can disrupt the real estate market
Enhancing General Management capabilities to grow into more micro-markets
Strengthening our sales capabilities and improve our distribution reach
Imparting skill enhancement modules to associates including MDP programs at premier institutes
Retention plan for top talent
Adopting ESG framework to identify risks & deriving value e.g. resolving process & efficiency flaws
Committing a long term net zero carbon target (2035)- gain global sustainability leadership
Comparing with Global ESG benchmarks (DJSI, GRESB) and through a gap analysis identifying areas to improve
Three focus areas- Technology, People and ESG
Investing for the next phase of growth
15

“Palava Phase II”
03 Performance Update 16

17
Pre-Sales1,171
2,531
4Q FY20 4Q FY21
1,905 2,089
4Q FY20 4Q FY21
3.9
2.6
4Q FY20 4Q FY21
6,570 5,968
FY20 FY21
8,190
5,052
FY20 FY21
15.7
2.7
FY20 FY21
INR Cr
Collections
Completions
Mn. Sqft.
1.2 msf 1.8 msf 6.2 msf 5.1 msf
Average Selling Price (ASP) of ‘for sale’ product during the period
9,451 11,099 10,635 10,484
116%
17%
10%
-33%
XXX
Operational Performance

18
All data above is excluding impact of UK investments;
Adjusted EBITDA = EBITDA + interest included in cost of projects
Prior to exceptional items; Adjusted EBITDA margin / PAT margin for the duration xx%
Revenues
504
943
4Q FY20 4Q FY21
332 312
4Q FY20 4Q FY21
9,577
5,449
FY20 FY21
2,905
1,711
FY20 FY21
Adj. EBITDA
PAT
2,110 2,534
4Q FY20 4Q FY21
1,221
511
FY20 FY21^
20%
87%
-6%
24% 37% 30% 31%
16% 12% 13% 9%
Financial Performance
INR Cr

INR Cr
Micro-markets Pre-SalesAverage Sales
Price (INR psf)Collections
Construction
spend
Area delivered
(Mn. sq. ft.)
South & Central 858 22,097 833 183 --
Thane 689 9,826 625 75 --
Extended Eastern Suburbs 349 5,818 379 167 2.5
Western Suburbs 63 11,333 54 15 --
Pune 53 7,810 64 12 0.1
Offices & Retail (for rent) -- -- 28 41 --
Industrial park 454 -- 55 6 --
Others* 65 -- 51 6 --
Total 2,531 2,089 504 2.6
*Sales from “Others” include residential sales from other micro-markets as well as Land sale (other than industrial park);
Collections from “Others” include collections from residential sales from other micro-markets, and any land sale (other than industrial park)
19
Micro-market performance for 4QFY21
20
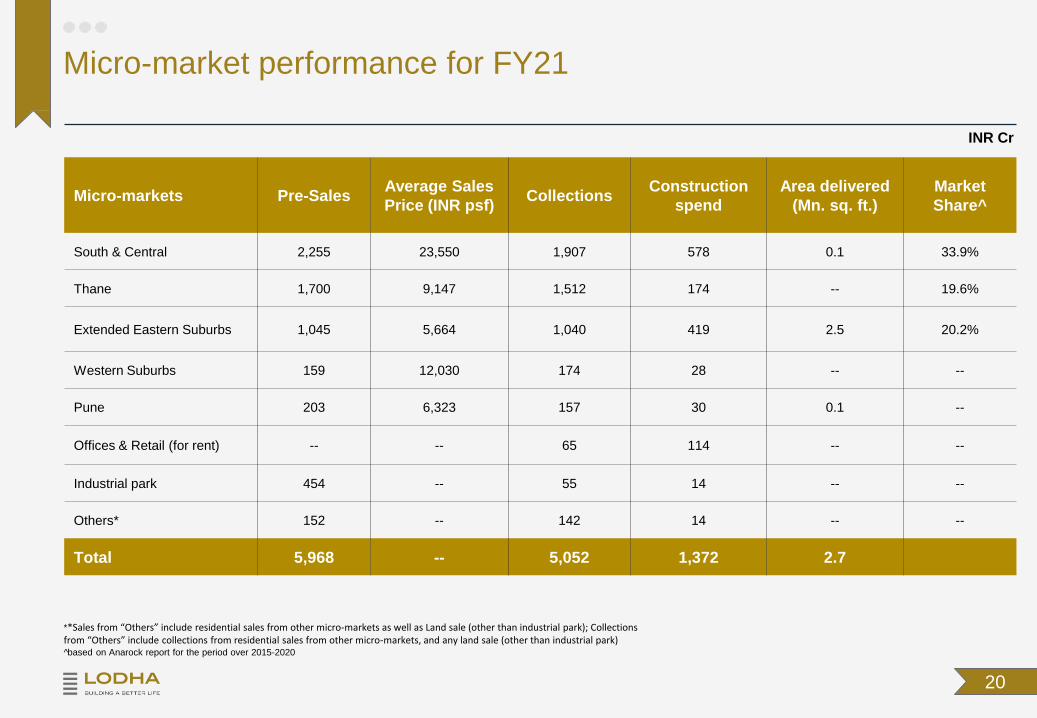
Micro-markets Pre-SalesAverage Sales
Price (INR psf)Collections
Construction
spend
Area delivered
(Mn. sq. ft.)
Market
Share^
South & Central 2,255 23,550 1,907 578 0.1 33.9%
Thane 1,700 9,147 1,512 174 -- 19.6%
Extended Eastern Suburbs 1,045 5,664 1,040 419 2.5 20.2%
Western Suburbs 159 12,030 174 28 -- --
Pune 203 6,323 157 30 0.1 --
Offices & Retail (for rent) -- -- 65 114 -- --
Industrial park 454 -- 55 14 -- --
Others* 152 -- 142 14 -- --
Total 5,968 -- 5,052 1,372 2.7
**Sales from “Others” include residential sales from other micro-markets as well as Land sale (other than industrial park); Collections from “Others” include collections from residential sales from other micro-markets, and any land sale (other than industrial park)^based on Anarock report for the period over 2015-2020
INR Cr
Micro-market performance for FY21

Micro-markets
Residual
Collections from
Sold units
Ready
unsold
Ongoing
unsold
Planned Inventory Launches
Land
Bank^In next 12 months Beyond 12 months
Own Land JDA Own Land JDA
INR Cr Mn. Sq. ft. Acres
South & Central 2,140 4,631 4,136 1.1 -- 1.4 -- --
Thane 1,757 514 3,375 0.7 -- 2.8 -- --
Extended Eastern
Suburbs1,256 1,434 3,962 1.3 -- 30.6 -- ~1,100
Western Suburbs 310 2 811 -- 0.4 -- -- --
Pune 170 210 563 -- 0.5 0.2 0.9 --
Offices & Retail (for
rent)10 1,025 3,125 -- -- 7.1 -- --
Industrial park 315 -- 300 acres -- -- 500 acres -- ~2,700
Others 88 -- -- 0.3 -- -- -- --
Total 6,047 7,866 15,972 3.3 0.9 42.2 0.9 ~3800
21
Micro-market supply overview
^Land bank is surplus land beyond the ongoing & planned projects
22
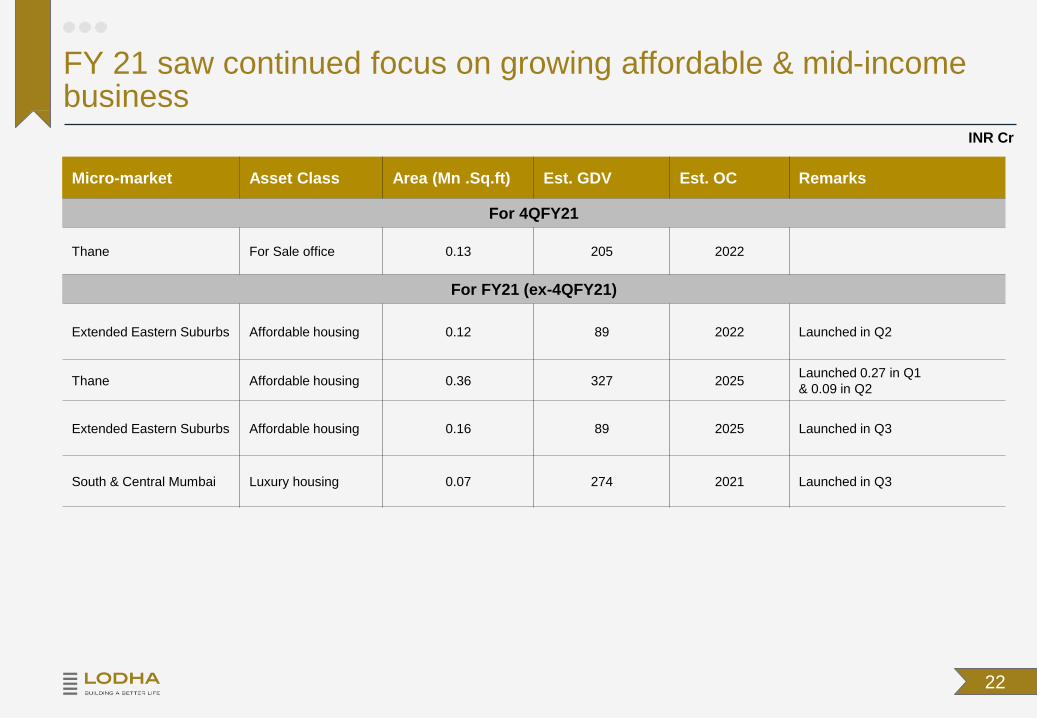
Micro-market Asset Class Area (Mn .Sq.ft) Est. GDV Est. OC Remarks
For 4QFY21
Thane For Sale office 0.13 205 2022
For FY21 (ex-4QFY21)
Extended Eastern Suburbs Affordable housing 0.12 89 2022 Launched in Q2
Thane Affordable housing 0.36 327 2025Launched 0.27 in Q1
& 0.09 in Q2
Extended Eastern Suburbs Affordable housing 0.16 89 2025 Launched in Q3
South & Central Mumbai Luxury housing 0.07 274 2021 Launched in Q3
FY 21 saw continued focus on growing affordable & mid-income business
INR Cr
23
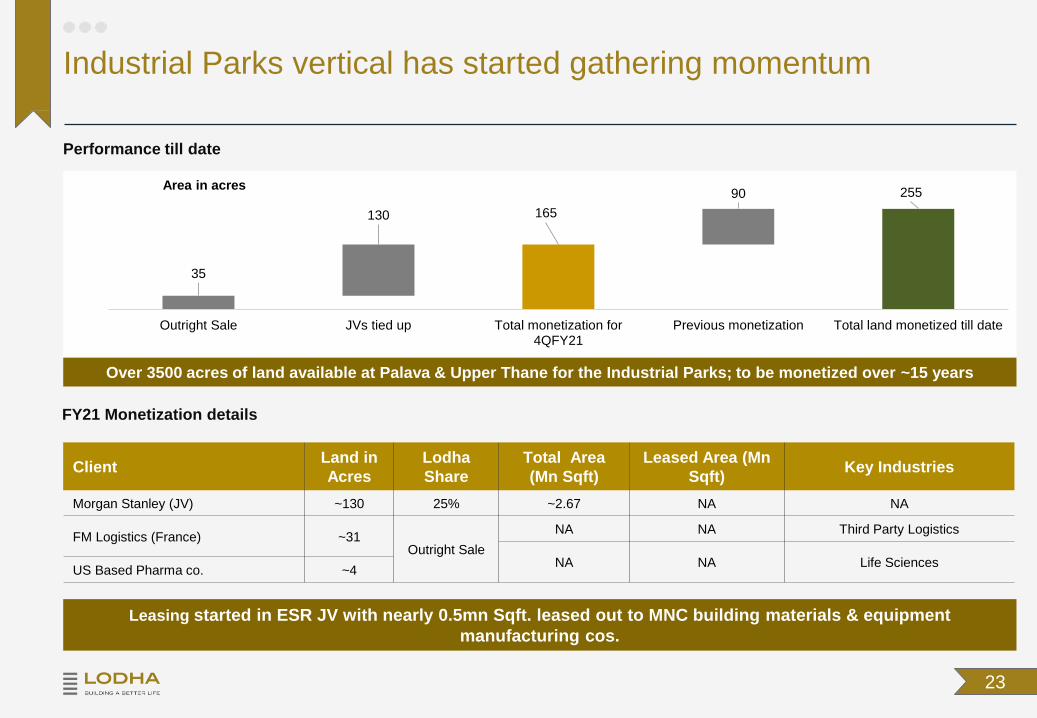
FY21 Monetization details
Client Land in
Acres
Lodha
Share
Total Area
(Mn Sqft)
Leased Area (Mn
Sqft)Key Industries
Morgan Stanley (JV) ~130 25% ~2.67 NA NA
FM Logistics (France) ~31Outright Sale
NA NA Third Party Logistics
NA NA Life SciencesUS Based Pharma co. ~4
35
130 165
90 255
Outright Sale JVs tied up Total monetization for4QFY21
Previous monetization Total land monetized till date
Area in acres
Over 3500 acres of land available at Palava & Upper Thane for the Industrial Parks; to be monetized over ~15 years
Leasing started in ESR JV with nearly 0.5mn Sqft. leased out to MNC building materials & equipment
manufacturing cos.
Performance till date
Industrial Parks vertical has started gathering momentum
24
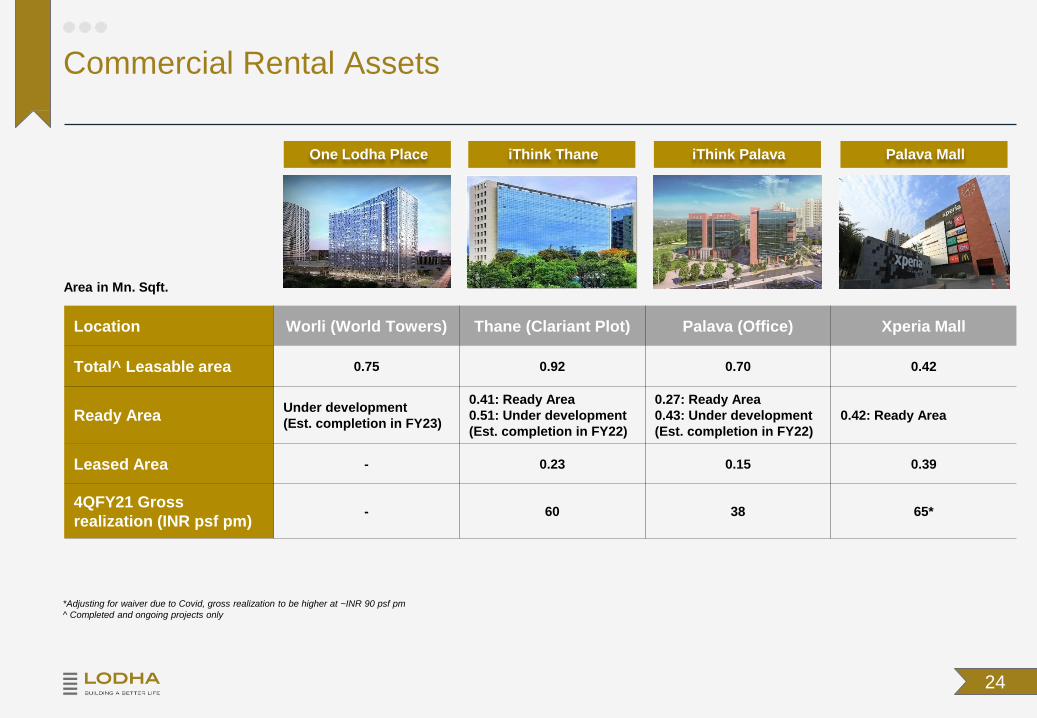
Location Worli (World Towers) Thane (Clariant Plot) Palava (Office) Xperia Mall
Total^ Leasable area 0.75 0.92 0.70 0.42
Ready AreaUnder development
(Est. completion in FY23)
0.41: Ready Area
0.51: Under development
(Est. completion in FY22)
0.27: Ready Area
0.43: Under development
(Est. completion in FY22)
0.42: Ready Area
Leased Area - 0.23 0.15 0.39
4QFY21 Gross
realization (INR psf pm)- 60 38 65*
Area in Mn. Sqft.
*Adjusting for waiver due to Covid, gross realization to be higher at ~INR 90 psf pm
^ Completed and ongoing projects only
Commercial Rental Assets
iThink ThaneOne Lodha Place iThink Palava Palava Mall
04 Financials
“Lodha Amara – Club House”
25
26
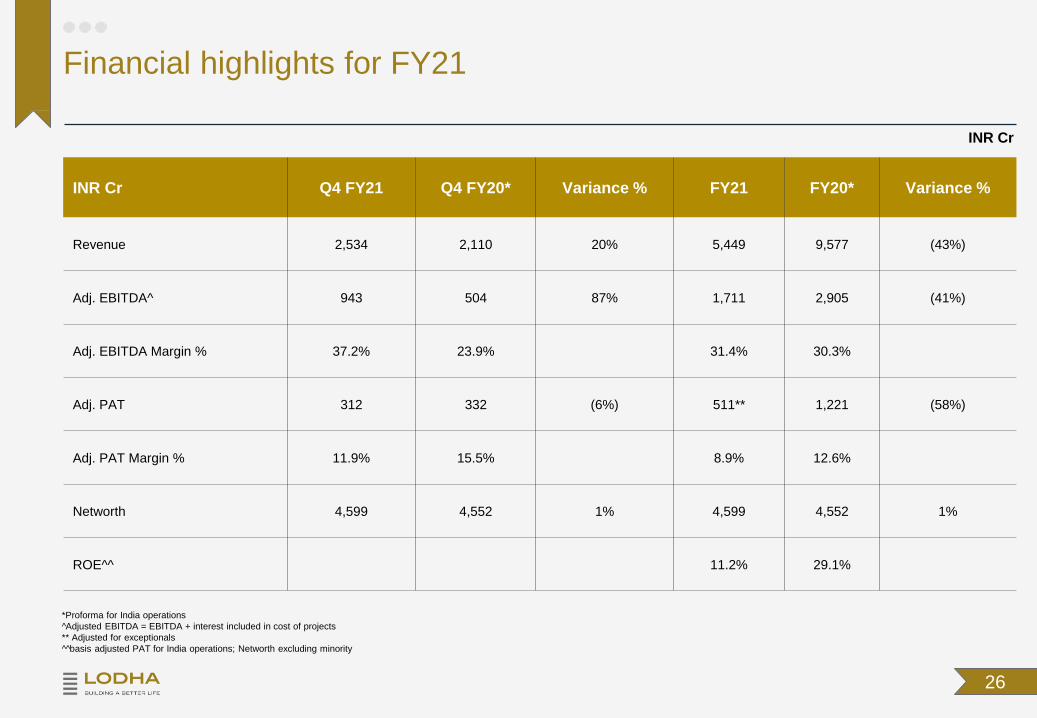
INR Cr Q4 FY21 Q4 FY20* Variance % FY21 FY20* Variance %
Revenue 2,534 2,110 20% 5,449 9,577 (43%)
Adj. EBITDA^ 943 504 87% 1,711 2,905 (41%)
Adj. EBITDA Margin % 37.2% 23.9% 31.4% 30.3%
Adj. PAT 312 332 (6%) 511** 1,221 (58%)
Adj. PAT Margin % 11.9% 15.5% 8.9% 12.6%
Networth 4,599 4,552 1% 4,599 4,552 1%
ROE^^ 11.2% 29.1%
*Proforma for India operations
^Adjusted EBITDA = EBITDA + interest included in cost of projects
** Adjusted for exceptionals
^^basis adjusted PAT for India operations; Networth excluding minority
Financial highlights for FY21
INR Cr
27
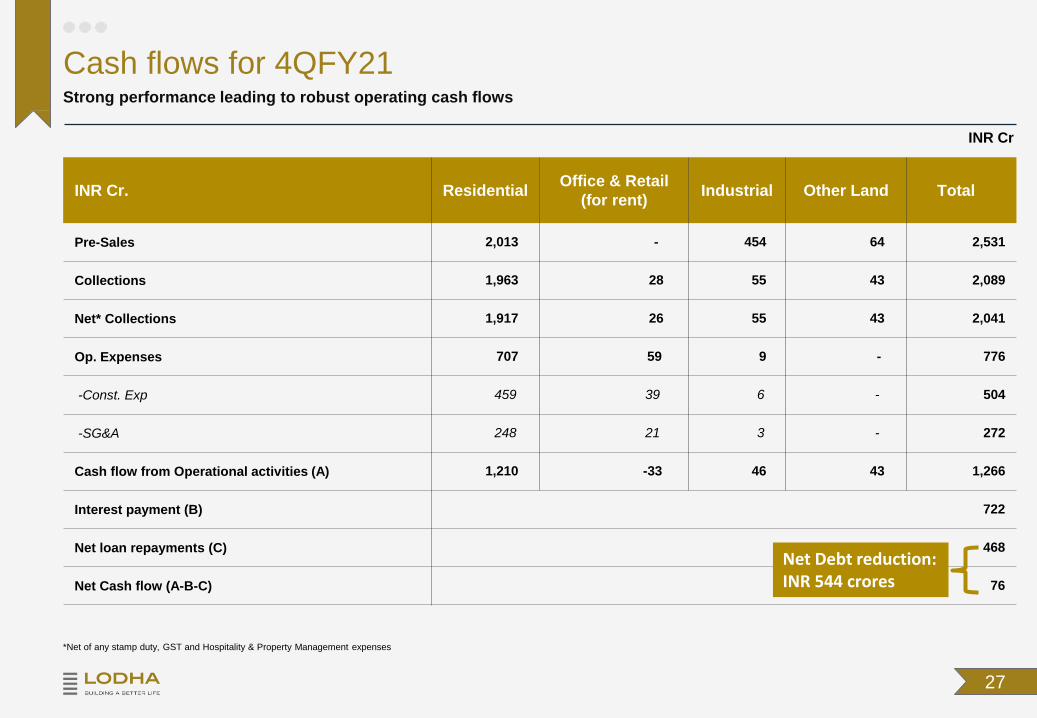
*Net of any stamp duty, GST and Hospitality & Property Management expenses
INR Cr. Residential Office & Retail
(for rent)Industrial Other Land Total
Pre-Sales 2,013 - 454 64 2,531
Collections 1,963 28 55 43 2,089
Net* Collections 1,917 26 55 43 2,041
Op. Expenses 707 59 9 - 776
-Const. Exp 459 39 6 - 504
-SG&A 248 21 3 - 272
Cash flow from Operational activities (A) 1,210 -33 46 43 1,266
Interest payment (B) 722
Net loan repayments (C) 468
Net Cash flow (A-B-C) 76
Strong performance leading to robust operating cash flows
Cash flows for 4QFY21
INR Cr
Net Debt reduction: INR 544 crores

28
During the quarter collection from UK projects amounted to GBP 13 million
Targeting repayment of USD denominated bond well ahead of maturity from UK cash flows
UK investments expected to repatriate INR 1500 -2000 crores over FY23/FY24 after repaying debt
Update on UK Investments
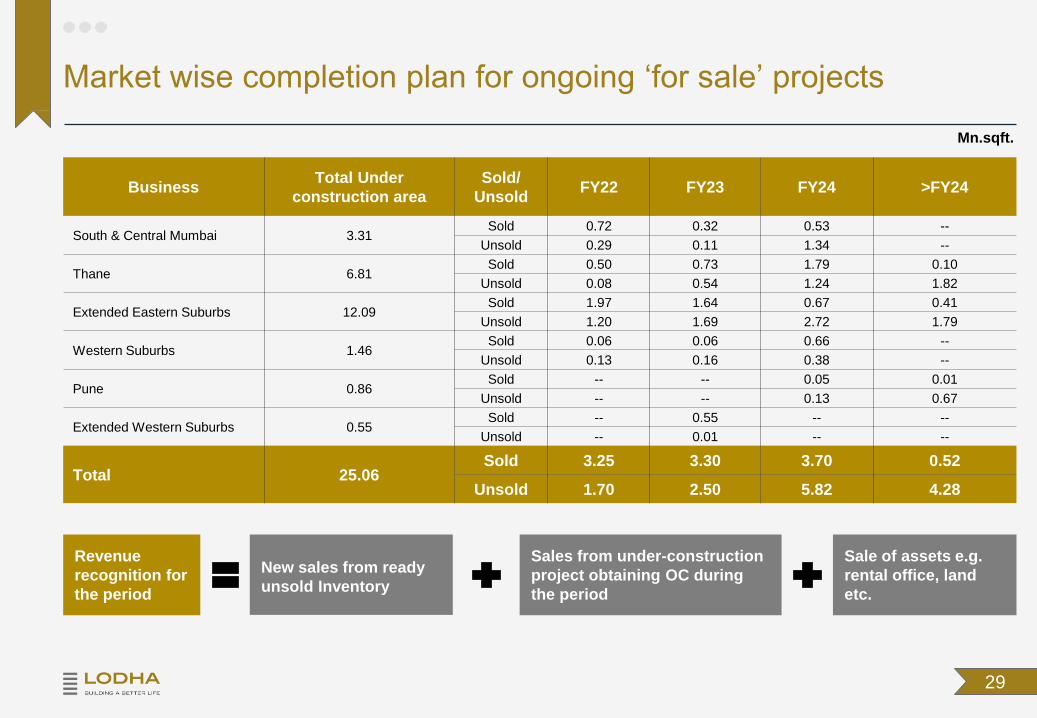
Revenue
recognition for
the period
New sales from ready
unsold Inventory
Sales from under-construction
project obtaining OC during
the period
Sale of assets e.g.
rental office, land
etc.
BusinessTotal Under
construction area
Sold/
UnsoldFY22 FY23 FY24 >FY24
South & Central Mumbai 3.31Sold 0.72 0.32 0.53 --
Unsold 0.29 0.11 1.34 --
Thane 6.81Sold 0.50 0.73 1.79 0.10
Unsold 0.08 0.54 1.24 1.82
Extended Eastern Suburbs 12.09Sold 1.97 1.64 0.67 0.41
Unsold 1.20 1.69 2.72 1.79
Western Suburbs 1.46Sold 0.06 0.06 0.66 --
Unsold 0.13 0.16 0.38 --
Pune 0.86Sold -- -- 0.05 0.01
Unsold -- -- 0.13 0.67
Extended Western Suburbs 0.55Sold -- 0.55 -- --
Unsold -- 0.01 -- --
Total 25.06Sold 3.25 3.30 3.70 0.52
Unsold 1.70 2.50 5.82 4.28
29
Market wise completion plan for ongoing ‘for sale’ projects
Mn.sqft.

30
Trend for Net Debt for India business
Key Leverage Indicators
Net Debt 16,075
Equity 4,599
Avg. cost of Debt** 12.3%
Net Debt/ Equity (Proforma adjusted for IPO) 1.9
Cash flow from ready & ongoing ‘for sale^^’ projects
Monetization of leased commercial assets
Monetization of Industrial Park through outright sale or JV
Receipt from Govt. on account of land acquisition for infrastructure
projects
Surplus repatriation from London projects
Further equity raise to meet MPS norms
INR Cr.
** As of 31st March 2021
*Surplus cashflows prior to overheads, interest, & taxes;
6,850
12,800
5,600
- 6,250
19,000
RTMI inventory Unsold ongoinginventory
Pending collections Pending const.costs
Surplus Cashflow*
Making progress towards the goal of net cash positive
16,625 16,075
13,575
12,075
Dec' 2020 Mar' 2021 Proforma adj. for IPOProforma adj. for IPO &
Promoter debt repayment
Other sources of cash flows over next 36 months
^^ ‘for sale” projects exclude office & retail (for rent), industrial parks & Land sale (other than industrial parks)

“Industrial Park- ESR Park”
05 Annexure 31
32
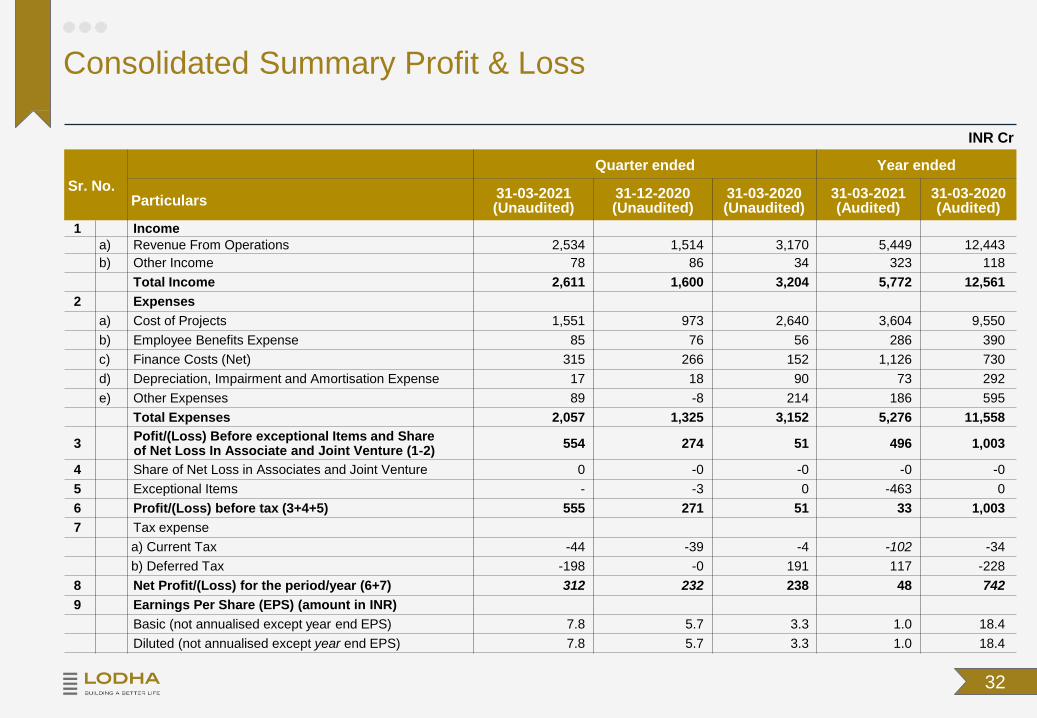
Consolidated Summary Profit & Loss
INR Cr
Sr. No.
Quarter ended Year ended
Particulars31-03-2021(Unaudited)
31-12-2020 (Unaudited)
31-03-2020 (Unaudited)
31-03-2021(Audited)
31-03-2020(Audited)
1 Income
a) Revenue From Operations 2,534 1,514 3,170 5,449 12,443
b) Other Income 78 86 34 323 118
Total Income 2,611 1,600 3,204 5,772 12,561
2 Expenses
a) Cost of Projects 1,551 973 2,640 3,604 9,550
b) Employee Benefits Expense 85 76 56 286 390
c) Finance Costs (Net) 315 266 152 1,126 730
d) Depreciation, Impairment and Amortisation Expense 17 18 90 73 292
e) Other Expenses 89 -8 214 186 595
Total Expenses 2,057 1,325 3,152 5,276 11,558
3Pofit/(Loss) Before exceptional Items and Share of Net Loss In Associate and Joint Venture (1-2)
554 274 51 496 1,003
4 Share of Net Loss in Associates and Joint Venture 0 -0 -0 -0 -0
5 Exceptional Items - -3 0 -463 0
6 Profit/(Loss) before tax (3+4+5) 555 271 51 33 1,003
7 Tax expense
a) Current Tax -44 -39 -4 -102 -34
b) Deferred Tax -198 -0 191 117 -228
8 Net Profit/(Loss) for the period/year (6+7) 312 232 238 48 742
9 Earnings Per Share (EPS) (amount in INR)
Basic (not annualised except year end EPS) 7.8 5.7 3.3 1.0 18.4
Diluted (not annualised except year end EPS) 7.8 5.7 3.3 1.0 18.4

33
Consolidated Summary Balance Sheet
INR Cr
EQUITY AND LIABLITIESAs at
31-Mar-21
As at
31-Mar-20
Equity Share Capital 396 396
Other Equity 4,203 4,156
Non-Controlling Interests 527 519
Total Equity 5,126 5,071
Borrowings 18,193 18,423
Trade Payables 1,698 2,273
Other Financial Liabilities 2,366 2,439
Provisions 21 24
Current Tax Liabilities (Net) 52 18
Deferred Tax Liabilities (Net) 0 0
Other Liabilities 11,852 12,444
Total Liabilities 34,183 35,621
Total Equity and Liabilities 39,308 40,693
ASSETSAs at
31-Mar-21
As at
31-Mar-20
Tangible Assets 1,406 1,480
Intangible Assets 547 548
Investments 1,579 1,553
Loans 3,952 4,673
Inventories 28,301 29,031
Trade Rec. (Incl. accrued rev.) 1425 1,304
Cash and Bank Balances 405 219
Other Financial Assets 273 206
Non-Current Tax Assets 209 364
Deferred Tax Assets 210 94
Other Assets 1,001 1,222
Total Asses 39,308 40,693
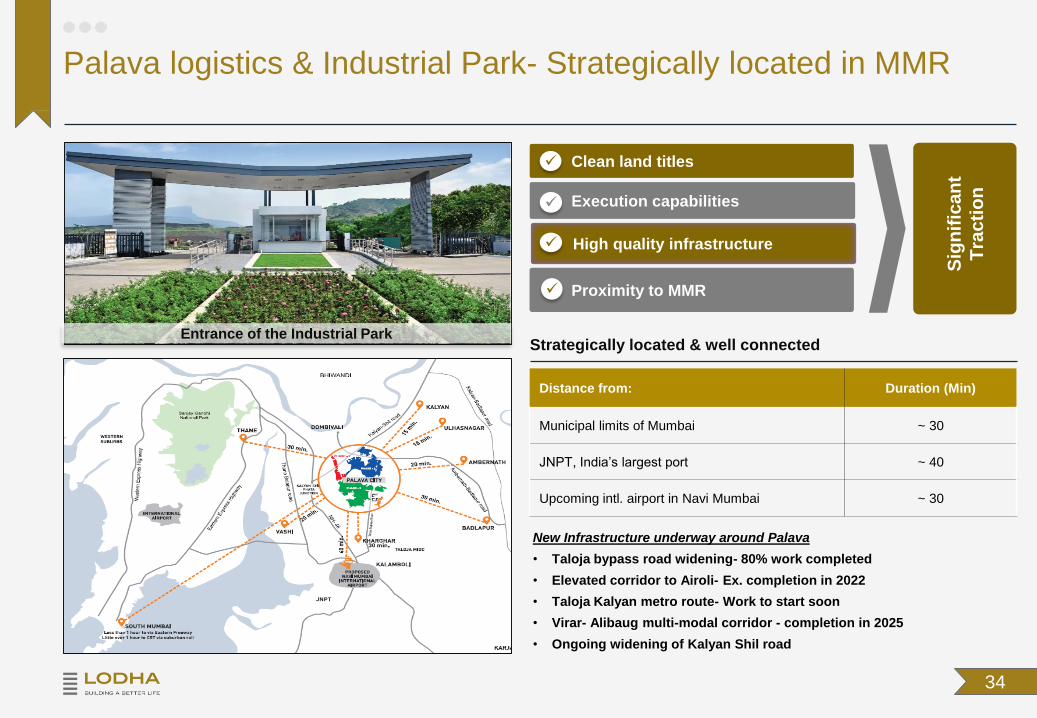
Entrance of the Industrial Park
New Infrastructure underway around Palava
• Taloja bypass road widening- 80% work completed
• Elevated corridor to Airoli- Ex. completion in 2022
• Taloja Kalyan metro route- Work to start soon
• Virar- Alibaug multi-modal corridor - completion in 2025
• Ongoing widening of Kalyan Shil road
• Proximity to MMR
• Clean land titles
• Execution capabilities
• High quality infrastructure
Sig
nif
ican
t
Tra
cti
on
Strategically located & well connected
Distance from: Duration (Min)
Municipal limits of Mumbai ~ 30
JNPT, India’s largest port ~ 40
Upcoming intl. airport in Navi Mumbai ~ 30
34
Palava logistics & Industrial Park- Strategically located in MMR

35
Lodha Upper Thane
Lodha Amara
Lodha SplendoraLodha Belmondo
Lodha Palava
Unique ability to create destinations
Key affordable & mid-income projects delivered

36
World Towers
New Cuffe Parade
Lodha Altamount Lodha Park
Unique ability to create destinations
Key premium & luxury projects delivered
37
Certain statements in this document may be forward-looking statements. Such forward-looking statements are subject to certain risks
and uncertainties like regulatory changes, local political or economic developments, technological risks, and many other factors that
could cause our actual results to differ materially from those contemplated by the relevant forward looking statements. Macrotech
Developers Limited will not be in any way responsible for any action taken based on such statements and undertakes no obligation to
publicly update these forward-looking statements to reflect subsequent events or circumstances.
Disclaimer

![WK 2FWREHU 'DODO 6WUHHW 6FULS &RGH · 2018-10-08 · 6FULS &RGH 1DWLRQDO 6WRFN ([FKDQJH RI ,QGLD /WG ([FKDQJH 3OD] ... recruitment, employee KRAs and incentivisation. ... we may have](https://img.pdfslide.net/doc/110x75/5edd06c5ad6a402d6667f5a7/wk-2fwrehu-dodo-6wuhhw-6fuls-rgh-2018-10-08-6fuls-rgh-1dwlrqdo-6wrfn.jpg)