Embed Size (px)
Citation preview

Investigation of the two- and three-fragment photodissociation of the tert-butylperoxy radical at 248 nmBethan Nichols, Erin N. Sullivan, Mikhail Ryazanov, Cynthia M. Hong, and Daniel M. Neumark
Citation: The Journal of Chemical Physics 147, 134304 (2017); doi: 10.1063/1.4994713View online: http://dx.doi.org/10.1063/1.4994713View Table of Contents: http://aip.scitation.org/toc/jcp/147/13Published by the American Institute of Physics
Articles you may be interested inExperimental and theoretical studies of the reactions of ground-state sulfur atoms with hydrogen anddeuteriumThe Journal of Chemical Physics 147, 134302 (2017); 10.1063/1.4991418
Detection and structural characterization of nitrosamide H2NNO: A central intermediate in deNOx processesThe Journal of Chemical Physics 147, 134301 (2017); 10.1063/1.4992097
A multi-plate velocity-map imaging design for high-resolution photoelectron spectroscopyThe Journal of Chemical Physics 147, 094201 (2017); 10.1063/1.4996011
Protonated ions as systemic trapping agents for noble gases: From electronic structure to radiativeassociationThe Journal of Chemical Physics 147, 134305 (2017); 10.1063/1.4994630
Imaging of rotational wave-function in photodissociation of rovibrationally excited HCl moleculesThe Journal of Chemical Physics 147, 013901 (2017); 10.1063/1.4973680
Advantage of spatial map ion imaging in the study of large molecule photodissociationThe Journal of Chemical Physics 147, 013904 (2017); 10.1063/1.4975671

THE JOURNAL OF CHEMICAL PHYSICS 147, 134304 (2017)
Investigation of the two- and three-fragment photodissociationof the tert-butyl peroxy radical at 248 nm
Bethan Nichols, Erin N. Sullivan, Mikhail Ryazanov,a) Cynthia M. Hong,and Daniel M. Neumarkb)
Department of Chemistry, University of California, Berkeley, California 94720, USA and Chemical SciencesDivision, Lawrence Berkeley National Laboratory, Berkeley, California 94720, USA
(Received 6 July 2017; accepted 19 September 2017; published online 5 October 2017)
The photodissociation dynamics of the tert-butyl peroxy (t-BuOO) radical are studied by fast-radical-beam coincidence translational spectroscopy. The neutral t-BuOO radical is formed by photodetach-ment of the corresponding t-BuOO� anion at 700 nm (1.77 eV), followed by dissociation at 248nm (5.00 eV). Photofragment mass and translational energy distributions are obtained. The majorchannel is found to be three-body fragmentation to form O, CH3, and acetone (83%), with minortwo-body fragmentation channels leading to the formation of O2 + tert-butyl radical (10%) and HO2
+ isobutene (7%). Experimental results show that the translational energy distribution for two-bodydissociation peaks is close to zero translational energy, with an isotropic angular distribution of frag-ments. These results indicate that two-body fragmentation proceeds via internal conversion to theground electronic state followed by statistical dissociation. For three-body dissociation, the trans-lational energy distribution peaks closer to the maximal allowed translational energy and shows ananisotropic distribution of the plane of the dissociating fragments, implying rapid dissociation on anexcited-state surface. A small shoulder in the three-body translational energy distribution suggests thatsome three-fragment dissociation events proceed by a different mechanism, involving internal conver-sion to the ground electronic state followed by sequential dissociation. Published by AIP Publishing.https://doi.org/10.1063/1.4994713
I. INTRODUCTION
Alkyl peroxy (RO2) radicals have long been understoodto be important species in both atmospheric and combustionchemistry. In atmospheric chemistry, these species are cru-cial intermediates in the formation of tropospheric ozone fromhydrocarbons and oxygen.1–3 Alkyl peroxy radicals, formedby the reaction of alkyl radicals with O2, react with NO inthe troposphere to form NO2 and an alkoxy radical (RO).NO2 is then photolyzed to produce NO and O(3P), and theatomic fragment goes on to react with O2 to produce ozone.The RO radical further reacts to form an aldehyde or ketoneand HO2, which can convert a second NO molecule to NO2
and lead to further ozone production. In low-temperature com-bustion processes, RO2 radicals are of particular interest, asthey can rearrange to form the corresponding hydroperoxyalkyl radical (QOOH).4–6 These QOOH radicals play a keyrole in autoignition processes, as they are very unstable andreadily decompose or can undergo secondary O2 addition toform OOQOOH radicals. Information on the energetics, spec-troscopy, and dynamics of RO2 radicals is therefore crucialfor accurate modeling of the atmospheric and combustionchemistry in which these species participate. In this article,we investigate the photodissociation of the tert-butyl per-oxy radical (t-BuOO) at 248 nm (5.00 eV), focusing on its
a)Current address: JILA, 440 University Ave., Boulder, Colorado 80309, USA.b)Author to whom correspondence should be addressed: dneumark@
berkeley.edu
primary photochemistry and dissociation mechanism throughmeasurements of product mass and translational energy distri-butions.
The spectroscopy of t-BuOO has been the focus of anumber of experimental and theoretical investigations. TheUV absorption spectrum of t-BuOO shows a strong, feature-less absorption around 240 nm, in common with many otheralkyl peroxy radicals.7 This UV absorption corresponds tothe B 2A′′ ← X 2A′′ transition, which for other RO2 radi-cals is known to be dissociative along the O–O bond.8 TheA 2A′ ← X 2A′′ transition has been characterized using cav-ity ringdown spectroscopy in the near IR, yielding the termenergy and several vibrational frequencies in the A 2A′ state.9
The X and A electronic states of the t-BuOO radical havealso been probed via anion photoelectron spectroscopy, inwhich an electron is photodetached from the t-BuOO� anion,yielding an electron affinity for t-BuOO of 1.196 eV, a termenergy of the A-state of 0.967 eV, and vibrational frequen-cies for a number of modes in both those states.10 Mostrecently, DeVine et al.11 employed slow-electron velocity-map imaging (SEVI) to obtain a high-resolution photoelectronspectrum of t-BuOO, yielding a refined electron affinity andresolving additional low-frequency vibrational modes of theradical.
Photodissociation experiments on peroxy radicals havepredominantly focused on HO2
12 and the methyl peroxy radi-cal13 (CH3OO). Initial theoretical investigations into the elec-tronic states of CH3OO found that the potential of the B statehas only a weak minimum along the O–O coordinate, and
0021-9606/2017/147(13)/134304/10/$30.00 147, 134304-1 Published by AIP Publishing.
134304-2 Nichols et al. J. Chem. Phys. 147, 134304 (2017)
therefore excitation to the B state would result in O–O bondcleavage, producing O and CH3O fragments.8 It was also sug-gested that three-body fragmentation to CH3 + O + O may beopen. In experimental studies of the 248 nm (5.00 eV) dissoci-ation of this system, CH3O and OH products were detected.13
These products were attributed to O–O bond cleavage fromeither direct dissociation from the CH3OO radical to formCH3O or breaking of the bond following isomerization tothe CH2OOH radical to produce OH. However, the quantumyields for these processes were low, and it was concluded thatthe dominant channel was O2 loss to form a methyl radical +O2.13 Recent studies on the photodissociation of a substitutedphenyl peroxy cation at 403 nm (3.08 eV) found that 60% ofthe photofragments corresponded to O2 loss, with 40% dueto loss of atomic oxygen.14 A theoretical study on the disso-ciation of the phenyl peroxy radical suggested that followingphotoexcitation to the B state, O2 loss would occur on thefirst excited state of phenyl peroxy and result in C6H5(X2A)+ O2(1∆g) products, whilst O loss would proceed directly alongthe B state to form C6H5O(X2A) + O(3P).14,15
The photodissociation of t-BuOO has been limited to insitu matrix photolysis studies.16 In these experiments, t-BuOOradicals were formed in an Ar/O2 matrix and photolyzed at254 nm (4.88 eV). The IR absorption spectrum was monitoredto observe the depletion of the radical and formation of water,carbon monoxide, and carbonyl compounds. The observed car-bonyl stretch was attributed to both formaldehyde and acetoneand was interpreted as being due to O–O bond cleavage onphotolysis, followed by oxidation of the products.16
FIG. 1. Energy diagram for t-BuOO dissociation. Energies, given in eV, rel-ative to the ground state of t-BuOO, are calculated at the RCCSD(T)/CBSlevel of theory with harmonic vibrational zero point energy and are takenfrom Ref. 24. The product energies differ slightly from those calculated fromexperimental heats of formation [given in Eqs. (1)–(4)].
In the present study, we report results on the photodisso-ciation of the gas-phase t-BuOO radical at 248 nm (5.00 eV),using the technique of fast-radical-beam photodissociation, inwhich t-BuOO is generated by photodetachment of the corre-sponding anion. At 248 nm, there are a number of energeticallyaccessible product channels, including dissociation to bothtwo and three fragments. The possible two body-dissociationchannels are
C4H9O2 → O2 + C4H9 (t-butyl), D0 = 1.63 eV,10,17,18 (1)
C4H9O2 → HO2 + C4H8 (isobutene), D0 = 1.07 eV,19,20 (2)
C4H9O2 → O + C4H9O (t-butoxy), D0 = 2.76 eV,21,22 (3)
C4H9O2 → OH + C4H8O (2,2-dimethyloxirane), D0 = 0.01 eV.22,23 (4)
Figure 1 shows a potential energy diagram for the competing two-body dissociation channels on the ground-state electronicsurface. The energies and structures are taken from Ref. 24 and are calculated at the RCCSD(T)/CBS level of theory withharmonic vibrational zero point energy. As can be seen in Fig. 1, the t-BuOO molecule can dissociate directly into t-butyl andO2, for example, or can first isomerize to form the QOOH radical, which subsequently dissociates.
In addition to two-fragment dissociation, there are two possible three-fragment dissociation pathways
C4H9O2 → O + CH3 + C3H6O (acetone), D0 = 2.96 eV,22,25 (5)
C4H9O2 → H + CH2O (formaldehyde) + C3H6O (acetone), D0 = −0.08 eV.22,25 (6)
We find that the dominant pathway for dissociation of t-BuOOat 248 nm (5.00 eV) is three-body fragmentation to O + CH3
+ acetone (channel 5). The lower-energy three-fragment dis-sociation (channel 6) is not observed in this work. The experi-mental translational energy distribution and Dalitz plots forchannel 5 are consistent with the fragmentation predomi-nantly occurring on the initially excited B-state surface. Wealso observe two-body dissociation to O2 + t-butyl and HO2
+ isobutene (channels 1 and 2), with little evidence of dissoci-ation via channel 3 or 4. Translational energy distributions and
branching ratios for these two-body dissociation channels arefound to be consistent with fragmentation occurring on theground state surface following internal conversion from the Bto the X state, with no evidence of isomerization to QOOHprior to dissociation.
II. METHODS
The fast-beam coincidence translational spectrome-ter employed in this study has been described in detail

134304-3 Nichols et al. J. Chem. Phys. 147, 134304 (2017)
previously,26,27 so only the details specific to this workwill be discussed here. While this instrument was originallydesigned to measure two-body photodissociation events, morerecent detector configurations have enabled coincidence-baseddetection of three-body dissociation.28–30
A fast beam of tert-butyl peroxide anions (t-BuOO�) wasgenerated by flowing 15 psi (1 bar) Ar through a tert-butylhydroperoxide solution (70% t-BuOOH in water). The gasmixture was supersonically expanded into the vacuum throughan Amsterdam Piezovalve31 operating at 100 Hz, coupled witha DC grid discharge source32 to produce t-BuOO� ions. Theions were accelerated to a beam energy of 6–8 keV and mass-selected using a collinear beam modulation time-of-flight massspectrometer as described by Bakker.33,34 Mass-selected t-BuOO� ions were subsequently photodetached at 700 nm(1.77 eV) with an Nd:YAG-pumped dye laser (Litron LPY742-100 and Radiant Dyes NarrowScan) to produce a fast beam ofneutral t-BuOO.
The neutral t-BuOO radicals formed in the detachmentstep were characterized by a photoelectron spectrometerinstalled in the photodetachment region.35 The photodetachedelectrons were extracted perpendicular to the beam of the neu-tral radicals and velocity-mapped onto a position-sensitivedetector consisting of a chevron stack of two multichannelplates (MCPs) and a phosphor screen. Events on the phos-phor screen were captured by a camera and transferred toa computer for analysis of the resulting image. Use of theAbel inversion (BASEX)36 allows the photoelectron kineticenergy (eKE) distributions to be obtained from the recordedimages, yielding information on the structure of the radicalformed, in addition to the internal energy of both the ions andneutrals.
After photodetachment of t-BuOO�, remaining anions inthe fast beam were deflected from the beam path using anelectric field. The resulting beam of fast neutral t-BuOO wasthen intersected by a 248 nm (5.00 eV) laser beam gener-ated by an excimer laser (GAM EX-50F). Photodissociationproducts that scatter from the beam path were then detected incoincidence on a time-and-position-sensitive Roentdek Hex80delay-line-anode detector,27,30 with any undissociated t-BuOOblocked by a 2.5 mm radius beam block in front of the detectorface. For each coincident event, which could be a two-body orthree-body dissociation, the arrival times and positions of thephotofragments were determined and then analyzed to yieldthe photofragment masses, translational energy release, andscattering angles. The two-body dissociation photofragmenttranslational energy and angular distributions are given by therelation
P (ET , θ) = P (ET ) ·[1 + β (ET ) P2 (cos θ)
], (7)
where β(ET ) is the energy-dependent anisotropy parameterand P2 is the 2nd-order Legendre polynomial. The β parame-ter for three-body dissociation is calculated directly from theangular distributions of the scattered products. In the currentexperiments, the unpolarized output of the excimer laser isused for dissociation, so θ is defined as the angle between thedissociation recoil axis (or in the case of the three-body disso-ciation, the normal to the dissociation plane) and the directionof propagation of the laser. In this case, β takes on values
between �1 for parallel and +½ for perpendicular transitions,corresponding to the β parameters for linearly polarized light(βlin) multiplied by �½.35
For events with very low or high translational energyrelease, one or both fragments can either hit the beam blockor miss the detector entirely and therefore go undetected. Inorder to account for this variation of the detection efficiency asa function of scattering angle and translational energy release,the experimental translational energy distributions for two- andthree-body dissociation events and corresponding Dalitz plotspresented in this work have been corrected using a detectoracceptance function (DAF).30,37
III. RESULTS AND ANALYSISA. Photoelectron spectrum
Figure 2 displays the photoelectron spectrum of t-BuOO�
at a photodetachment wavelength of λ = 700 nm (hν = 1.771eV). Ideally, a detachment photon energy just above the elec-tron affinity of t-BuOO (1.196 eV) would be used so as toproduce radicals in their ground vibrational state. However,the vibrational origin, peak A, is quite weak owing to Franck–Condon effects. Hence, a slightly higher photon energy waschosen to achieve reasonable production of neutral t-BuOO.As a result, neutral t-BuOO radicals are formed with up to0.5 eV of internal energy.
To aid in assignment of the photoelectron spectrum,Franck–Condon simulations were performed using EZSpec-trum.38 Geometries and vibrational frequencies of the ground-state anion and neutral were calculated via density-functionaltheory using the B3LYP functional with the 6-311+G(d,p)basis set in the Gaussian 09 package.39 Frequencies werescaled by 0.9679 as is appropriate for this basis set.40 Thesimulation is performed at 300 K to account for the presenceof a hot band observed at slightly higher eKE (0.62 eV) thanthe vibrational origin in the experimental spectrum in Fig. 2.Clifford et al.10 have previously acquired and assigned the
FIG. 2. Anion photoelectron spectrum of tert-butyl peroxide at λ = 700nm (hν = 1.771 eV) with Franck–Condon simulations (red) overlaying theexperimental spectrum (black).
134304-4 Nichols et al. J. Chem. Phys. 147, 134304 (2017)
experimental spectrum, identifying the major active modes intheir experimental spectrum to be the O–O stretch (1130 cm�1)and the C–O–O bend (245 cm�1) and reporting an electronaffinity of 1.196 eV.
Our spectrum (Fig. 2) looks slightly different from thatpreviously published by Clifford et al.10 due to a difference inthe temperature of the ions produced, but as in the previouslyreported work, the two most active modes correspond to theO–O stretch and a low-frequency mode involving the C–O–Obend and torsion of the methyl groups. As can be seen by com-paring our experimental spectrum to the simulation, there isconsiderable unresolved structure, and the simulation indicatescontributions from numerous different modes. These contri-butions are more concretely identified in a recently publishedhigh-resolution photoelectron spectrum.11 For the purposesof this work, the consistency between the experimental spec-trum and simulation confirms the formation of the t-BuOOradical by photodetachment. The most intense feature around0.31 eV corresponds to two quanta of excitation in the O–Ostretch, indicating an excess 0.28 eV of energy imparted in theradicals prior to dissociation.
B. Photofragment mass distributions
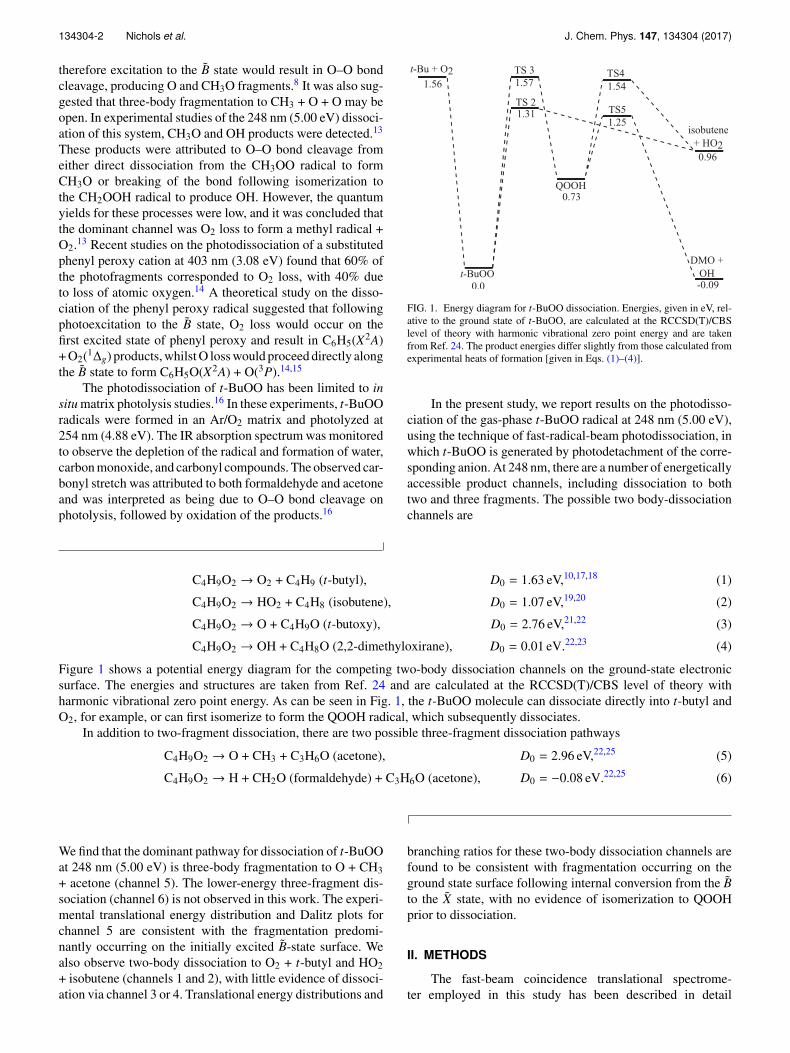
Figure 3 shows the mass distributions of coincident eventsfor two- and three-fragment dissociation of the t-BuOO radi-cal at 248 nm (5.00 eV). The three-fragment mass distribution[Fig. 3(a)] shows two peaks (see below) around 15.5 and58 Da. For two-fragment dissociation, shown in Fig. 3(b),two pairs of peaks can be seen in the photofragment massdistributions: the dominant channel peaking around 32 and57 Da and less intense mass peaks around 18 and 71 Da. Themoderate photofragment mass resolution m/∆m = 10 of theinstrument27,41 is not sufficient to distinguish mass peaks thatare only 1 Da apart.
The three-fragment mass distribution is consistent withthree-fragment dissociation via channel 5 to form O (16 Da),CH3 (15 Da), and acetone (58 Da). The peak at 15.5 Da is twiceas intense as that at 58 Da, as the two individual mass peakscorresponding to O and CH3 are not resolved. No evidenceis seen in the three-body mass distribution for dissociationvia channel 6 to form H, CH2O (formaldehyde, 30 Da), andC3H6O (acetone). It should be noted that due to the geome-try of the detector, light fragments such as H atoms are noteasily detectable, as they are likely to recoil beyond the edgeof the detector. Additionally, H atoms have a low laboratory-frame kinetic energy and therefore a low detection efficiencyfor those atoms that do impinge on the active area of thedetector. However, the remaining two fragments, CH2O andC3H6O, would likely be observed in the two-fragment massdistributions as peaks around 30 and 58 Da. Since the peaksin the two-fragment mass distribution appear at slightly differ-ent masses (around 32–33 and 57–56 Da), we conclude thatdissociation via channel 6 is not observed.
The major two-fragment channel, with peaks at 32 and57 Da, could correspond to dissociation to either O2 + t-butyl (channel 1), HO2 + isobutene (channel 2), or a mixtureof the two. The mass resolution of the photofragment spec-trometer is insufficient to distinguish between these channels
FIG. 3. Photofragment coincident mass distributions for three- (a) and two-body (b) dissociation of t-BuOO at 248 nm (5.00 eV).
based on the mass distributions alone. Performing this exper-iment with deuterated tert-butyl peroxy (C4D9O2) could aidwith a more definitive assignment for this channel, but ourattempts to synthesize the deuterated tert-butyl hydroperoxideprecursor were unsuccessful. Some insight into the possiblecontributions from channels 1 and 2 can be gained by per-forming simulations of the mass distribution using the experi-mental conditions and translational energy distributions andvarying the contributions of the two channels.27 A samplesimulation for these channels is shown in the supplementarymaterial. Simulating the mass distribution assuming disso-ciation occurs only via channel 1 or channel 2 gives pooragreement with the experimental distribution, and the bestagreement is obtained using a branching ratio between channel1 and channel 2 of 1:0.66 ± 0.13. This ratio is consistent withRice–Ramsperger–Kassel–Marcus (RRKM) calculations asdescribed in Sec. IV A.
The smaller features in Fig. 3(b) peak around 18 and71 Da, but these peaks are very broad and are asymmetric inappearance. Simulations (shown in the supplementary mate-rial) suggest that they result from detecting two fragments
134304-5 Nichols et al. J. Chem. Phys. 147, 134304 (2017)
from a three-body dissociation occurring via channel 5. Theundetected fragment either hits the beam block, falls out-side the detector face, or is simply not detected. The detectorhas a finite one-particle detection efficiency, which has previ-ously been determined to be p = 0.6, thus the probability ofdetecting all three fragments for a three-body dissociation isp3 = 0.22.30 Therefore, there is a significant probabilitythat only 2 of the 3 fragments are detected [p2/3 = 3p2(1� p)= 0.43]. The majority of these events should be rejected duringthe analysis process, as the center of mass of the two observedfragments will be shifted from the center of the beam. How-ever, it is possible that some events in which two fragmentsfrom a three-body dissociation event are detected contributeto the two-body mass distribution. In order to assess the effectthat these incorrectly classified events have on the two-bodymass distribution, we performed simulations in which one ofthe three fragments is not detected. We found that these “false”two-body events manifest as broad peaks around 18 and 71 Da,i.e., where the smaller features in Fig. 3(b) are seen. We there-fore attribute these peaks to three-fragment events in whichone fragment remains undetected. Although it is possible thatthere is some contribution to these peaks from dissociationvia channels 3 or 4, either would be a very minor channel,as these peaks correspond to less than 1% of all coincidentevents.
Using the estimate for the one-particle detection prob-ability, it is also possible to calculate the branching ratiobetween the two- and three-fragment dissociation channels.It was found to be 1:5 ± 1, so the majority of dissociationevents result in fragmentation to O, CH3, and acetone.
C. Photofragment translational energyand angular distributions
The translational energy available to the dissociationproducts can be calculated according to
ET = hν + Eint − E ′int − D0, (8)
where hν is the photon energy, Eint is the internal energy ofthe t-BuOO radical prior to dissociation, E ′int is the internalenergy of the fragments, and D0 is the dissociation energy.From the photoelectron spectrum presented in Sec. III A, it isclear that the majority of the t-BuOO radicals are not pro-duced in the ground vibrational state but have an internalenergy between 0 and 0.5 eV. The largest peak in the photo-electron spectrum corresponds to an internal energy of around0.28 eV; therefore Eint = 0.28 eV will be used when calculat-ing the most probable maximal available translational energyfor each channel. For two-fragment dissociation via channels1 and 2, Eq. (1) implies that these energies are 3.65 eV and4.21 eV, respectively.
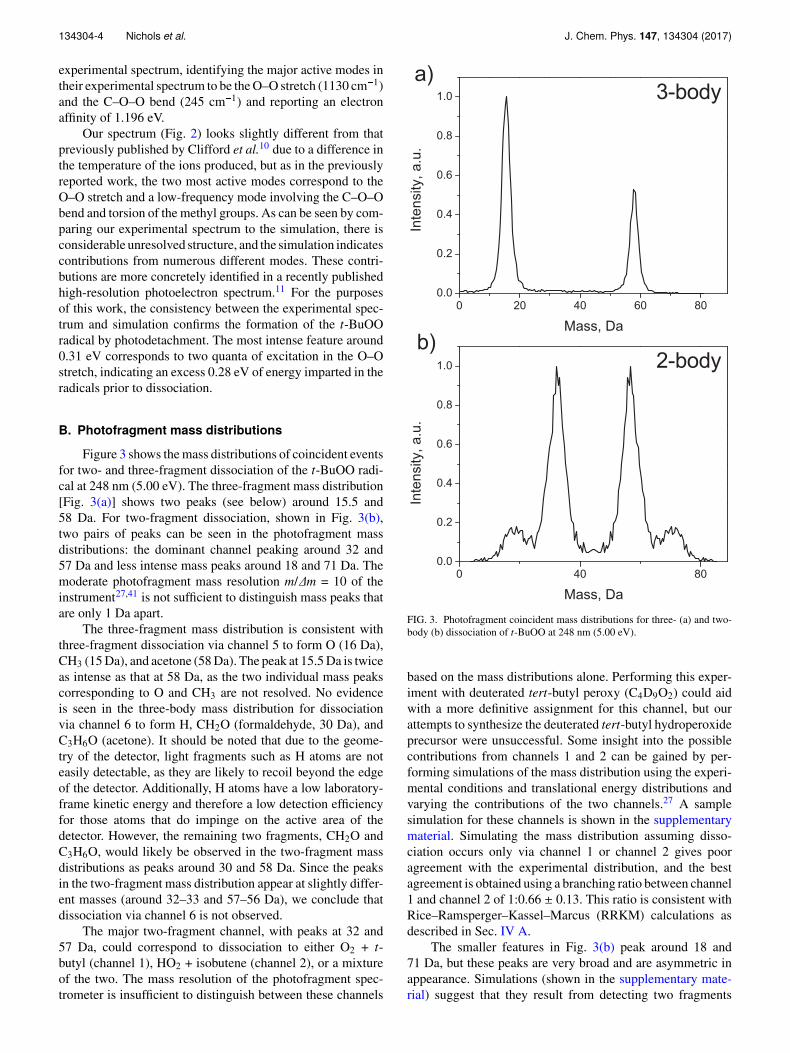
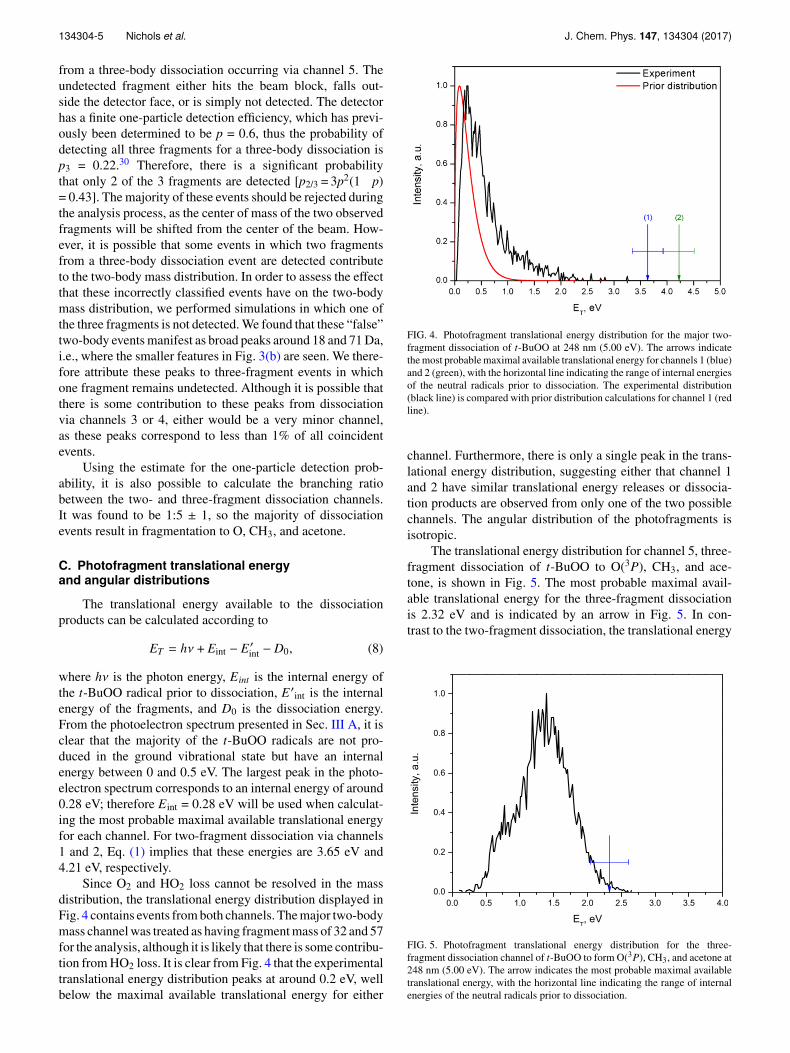
Since O2 and HO2 loss cannot be resolved in the massdistribution, the translational energy distribution displayed inFig. 4 contains events from both channels. The major two-bodymass channel was treated as having fragment mass of 32 and 57for the analysis, although it is likely that there is some contribu-tion from HO2 loss. It is clear from Fig. 4 that the experimentaltranslational energy distribution peaks at around 0.2 eV, wellbelow the maximal available translational energy for either
FIG. 4. Photofragment translational energy distribution for the major two-fragment dissociation of t-BuOO at 248 nm (5.00 eV). The arrows indicatethe most probable maximal available translational energy for channels 1 (blue)and 2 (green), with the horizontal line indicating the range of internal energiesof the neutral radicals prior to dissociation. The experimental distribution(black line) is compared with prior distribution calculations for channel 1 (redline).
channel. Furthermore, there is only a single peak in the trans-lational energy distribution, suggesting either that channel 1and 2 have similar translational energy releases or dissocia-tion products are observed from only one of the two possiblechannels. The angular distribution of the photofragments isisotropic.
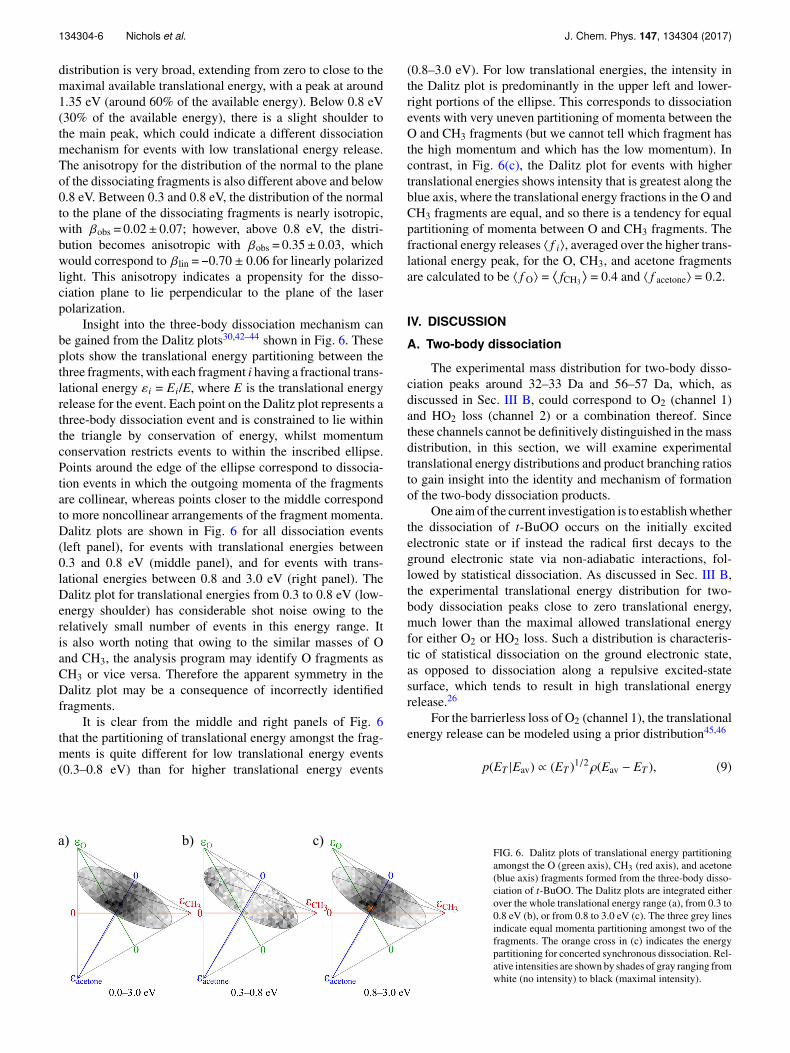
The translational energy distribution for channel 5, three-fragment dissociation of t-BuOO to O(3P), CH3, and ace-tone, is shown in Fig. 5. The most probable maximal avail-able translational energy for the three-fragment dissociationis 2.32 eV and is indicated by an arrow in Fig. 5. In con-trast to the two-fragment dissociation, the translational energy
FIG. 5. Photofragment translational energy distribution for the three-fragment dissociation channel of t-BuOO to form O(3P), CH3, and acetone at248 nm (5.00 eV). The arrow indicates the most probable maximal availabletranslational energy, with the horizontal line indicating the range of internalenergies of the neutral radicals prior to dissociation.
134304-6 Nichols et al. J. Chem. Phys. 147, 134304 (2017)
distribution is very broad, extending from zero to close to themaximal available translational energy, with a peak at around1.35 eV (around 60% of the available energy). Below 0.8 eV(30% of the available energy), there is a slight shoulder tothe main peak, which could indicate a different dissociationmechanism for events with low translational energy release.The anisotropy for the distribution of the normal to the planeof the dissociating fragments is also different above and below0.8 eV. Between 0.3 and 0.8 eV, the distribution of the normalto the plane of the dissociating fragments is nearly isotropic,with βobs = 0.02± 0.07; however, above 0.8 eV, the distri-bution becomes anisotropic with βobs = 0.35± 0.03, whichwould correspond to βlin =�0.70 ± 0.06 for linearly polarizedlight. This anisotropy indicates a propensity for the disso-ciation plane to lie perpendicular to the plane of the laserpolarization.
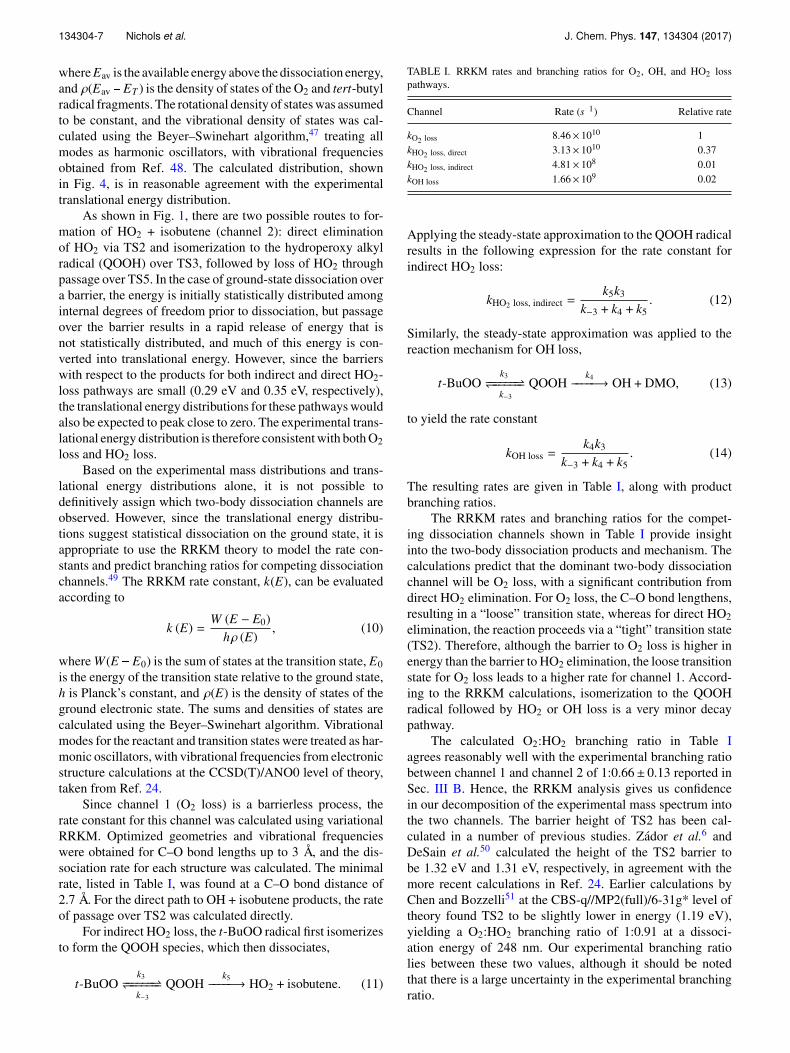
Insight into the three-body dissociation mechanism canbe gained from the Dalitz plots30,42–44 shown in Fig. 6. Theseplots show the translational energy partitioning between thethree fragments, with each fragment i having a fractional trans-lational energy εi = Ei/E, where E is the translational energyrelease for the event. Each point on the Dalitz plot represents athree-body dissociation event and is constrained to lie withinthe triangle by conservation of energy, whilst momentumconservation restricts events to within the inscribed ellipse.Points around the edge of the ellipse correspond to dissocia-tion events in which the outgoing momenta of the fragmentsare collinear, whereas points closer to the middle correspondto more noncollinear arrangements of the fragment momenta.Dalitz plots are shown in Fig. 6 for all dissociation events(left panel), for events with translational energies between0.3 and 0.8 eV (middle panel), and for events with trans-lational energies between 0.8 and 3.0 eV (right panel). TheDalitz plot for translational energies from 0.3 to 0.8 eV (low-energy shoulder) has considerable shot noise owing to therelatively small number of events in this energy range. Itis also worth noting that owing to the similar masses of Oand CH3, the analysis program may identify O fragments asCH3 or vice versa. Therefore the apparent symmetry in theDalitz plot may be a consequence of incorrectly identifiedfragments.
It is clear from the middle and right panels of Fig. 6that the partitioning of translational energy amongst the frag-ments is quite different for low translational energy events(0.3–0.8 eV) than for higher translational energy events
(0.8–3.0 eV). For low translational energies, the intensity inthe Dalitz plot is predominantly in the upper left and lower-right portions of the ellipse. This corresponds to dissociationevents with very uneven partitioning of momenta between theO and CH3 fragments (but we cannot tell which fragment hasthe high momentum and which has the low momentum). Incontrast, in Fig. 6(c), the Dalitz plot for events with highertranslational energies shows intensity that is greatest along theblue axis, where the translational energy fractions in the O andCH3 fragments are equal, and so there is a tendency for equalpartitioning of momenta between O and CH3 fragments. Thefractional energy releases 〈 f i〉, averaged over the higher trans-lational energy peak, for the O, CH3, and acetone fragmentsare calculated to be 〈 f O〉 =
⟨fCH3
⟩= 0.4 and 〈 f acetone〉 = 0.2.
IV. DISCUSSIONA. Two-body dissociation
The experimental mass distribution for two-body disso-ciation peaks around 32–33 Da and 56–57 Da, which, asdiscussed in Sec. III B, could correspond to O2 (channel 1)and HO2 loss (channel 2) or a combination thereof. Sincethese channels cannot be definitively distinguished in the massdistribution, in this section, we will examine experimentaltranslational energy distributions and product branching ratiosto gain insight into the identity and mechanism of formationof the two-body dissociation products.
One aim of the current investigation is to establish whetherthe dissociation of t-BuOO occurs on the initially excitedelectronic state or if instead the radical first decays to theground electronic state via non-adiabatic interactions, fol-lowed by statistical dissociation. As discussed in Sec. III B,the experimental translational energy distribution for two-body dissociation peaks close to zero translational energy,much lower than the maximal allowed translational energyfor either O2 or HO2 loss. Such a distribution is characteris-tic of statistical dissociation on the ground electronic state,as opposed to dissociation along a repulsive excited-statesurface, which tends to result in high translational energyrelease.26
For the barrierless loss of O2 (channel 1), the translationalenergy release can be modeled using a prior distribution45,46
p(ET |Eav) ∝ (ET )1/2ρ(Eav − ET ), (9)
FIG. 6. Dalitz plots of translational energy partitioningamongst the O (green axis), CH3 (red axis), and acetone(blue axis) fragments formed from the three-body disso-ciation of t-BuOO. The Dalitz plots are integrated eitherover the whole translational energy range (a), from 0.3 to0.8 eV (b), or from 0.8 to 3.0 eV (c). The three grey linesindicate equal momenta partitioning amongst two of thefragments. The orange cross in (c) indicates the energypartitioning for concerted synchronous dissociation. Rel-ative intensities are shown by shades of gray ranging fromwhite (no intensity) to black (maximal intensity).
134304-7 Nichols et al. J. Chem. Phys. 147, 134304 (2017)
where Eav is the available energy above the dissociation energy,and ρ(Eav �ET ) is the density of states of the O2 and tert-butylradical fragments. The rotational density of states was assumedto be constant, and the vibrational density of states was cal-culated using the Beyer–Swinehart algorithm,47 treating allmodes as harmonic oscillators, with vibrational frequenciesobtained from Ref. 48. The calculated distribution, shownin Fig. 4, is in reasonable agreement with the experimentaltranslational energy distribution.
As shown in Fig. 1, there are two possible routes to for-mation of HO2 + isobutene (channel 2): direct eliminationof HO2 via TS2 and isomerization to the hydroperoxy alkylradical (QOOH) over TS3, followed by loss of HO2 throughpassage over TS5. In the case of ground-state dissociation overa barrier, the energy is initially statistically distributed amonginternal degrees of freedom prior to dissociation, but passageover the barrier results in a rapid release of energy that isnot statistically distributed, and much of this energy is con-verted into translational energy. However, since the barrierswith respect to the products for both indirect and direct HO2-loss pathways are small (0.29 eV and 0.35 eV, respectively),the translational energy distributions for these pathways wouldalso be expected to peak close to zero. The experimental trans-lational energy distribution is therefore consistent with both O2
loss and HO2 loss.Based on the experimental mass distributions and trans-
lational energy distributions alone, it is not possible todefinitively assign which two-body dissociation channels areobserved. However, since the translational energy distribu-tions suggest statistical dissociation on the ground state, it isappropriate to use the RRKM theory to model the rate con-stants and predict branching ratios for competing dissociationchannels.49 The RRKM rate constant, k(E), can be evaluatedaccording to
k (E) =W (E − E0)
hρ (E), (10)
where W (E � E0) is the sum of states at the transition state, E0
is the energy of the transition state relative to the ground state,h is Planck’s constant, and ρ(E) is the density of states of theground electronic state. The sums and densities of states arecalculated using the Beyer–Swinehart algorithm. Vibrationalmodes for the reactant and transition states were treated as har-monic oscillators, with vibrational frequencies from electronicstructure calculations at the CCSD(T)/ANO0 level of theory,taken from Ref. 24.
Since channel 1 (O2 loss) is a barrierless process, therate constant for this channel was calculated using variationalRRKM. Optimized geometries and vibrational frequencieswere obtained for C–O bond lengths up to 3 Å, and the dis-sociation rate for each structure was calculated. The minimalrate, listed in Table I, was found at a C–O bond distance of2.7 Å. For the direct path to OH + isobutene products, the rateof passage over TS2 was calculated directly.
For indirect HO2 loss, the t-BuOO radical first isomerizesto form the QOOH species, which then dissociates,
t-BuOOk3
−−−−−−⇀↽−−−−−−k−3
QOOHk5
−−−−−→ HO2 + isobutene. (11)
TABLE I. RRKM rates and branching ratios for O2, OH, and HO2 losspathways.
Channel Rate (s�1) Relative rate
kO2 loss 8.46× 10¹⁰ 1kHO2 loss, direct 3.13× 10¹⁰ 0.37kHO2 loss, indirect 4.81× 10⁸ 0.01kOH loss 1.66× 10⁹ 0.02
Applying the steady-state approximation to the QOOH radicalresults in the following expression for the rate constant forindirect HO2 loss:
kHO2 loss, indirect =k5k3
k−3 + k4 + k5. (12)
Similarly, the steady-state approximation was applied to thereaction mechanism for OH loss,
t-BuOOk3
−−−−−−⇀↽−−−−−−k−3
QOOHk4
−−−−−→ OH + DMO, (13)
to yield the rate constant
kOH loss =k4k3
k−3 + k4 + k5. (14)
The resulting rates are given in Table I, along with productbranching ratios.
The RRKM rates and branching ratios for the compet-ing dissociation channels shown in Table I provide insightinto the two-body dissociation products and mechanism. Thecalculations predict that the dominant two-body dissociationchannel will be O2 loss, with a significant contribution fromdirect HO2 elimination. For O2 loss, the C–O bond lengthens,resulting in a “loose” transition state, whereas for direct HO2
elimination, the reaction proceeds via a “tight” transition state(TS2). Therefore, although the barrier to O2 loss is higher inenergy than the barrier to HO2 elimination, the loose transitionstate for O2 loss leads to a higher rate for channel 1. Accord-ing to the RRKM calculations, isomerization to the QOOHradical followed by HO2 or OH loss is a very minor decaypathway.
The calculated O2:HO2 branching ratio in Table Iagrees reasonably well with the experimental branching ratiobetween channel 1 and channel 2 of 1:0.66± 0.13 reported inSec. III B. Hence, the RRKM analysis gives us confidencein our decomposition of the experimental mass spectrum intothe two channels. The barrier height of TS2 has been cal-culated in a number of previous studies. Zador et al.6 andDeSain et al.50 calculated the height of the TS2 barrier tobe 1.32 eV and 1.31 eV, respectively, in agreement with themore recent calculations in Ref. 24. Earlier calculations byChen and Bozzelli51 at the CBS-q//MP2(full)/6-31g* level oftheory found TS2 to be slightly lower in energy (1.19 eV),yielding a O2:HO2 branching ratio of 1:0.91 at a dissoci-ation energy of 248 nm. Our experimental branching ratiolies between these two values, although it should be notedthat there is a large uncertainty in the experimental branchingratio.
134304-8 Nichols et al. J. Chem. Phys. 147, 134304 (2017)
B. Three-body dissociation
In contrast to the two-body dissociation pathways dis-cussed in Sec. IV A, the translational energy distribution forthree-body dissociation to O, CH3, and acetone is broad andpeaks well away from zero, with intensity up to the maximalavailable translational energy. As discussed in Sec. III B, themain distribution peaks at around 1.35 eV, but there is a smallshoulder in the distribution at a lower translational energy,around 0.75 eV, which could indicate different dissociationmechanisms in these two translational energy ranges. Above0.8 eV, the translational energy distribution and anisotropy ofthe normal to the plane of the dissociating fragments are con-sistent with rapid dissociation along an excited-state surface,resulting in production of the ground-state products.
Three-body dissociation mechanisms are often classifiedaccording to the time interval between which the bonds break.A dissociation event can be classified as either concertedor sequential, depending on whether the bond-breaking pro-cess takes place as one single or two distinct kinetic events,respectively.52 Concerted processes can be further classified
into (a) synchronous, in which the bonds break simultane-ously, on a time period much less than the rotational period,and (b) asynchronous, in which the time interval is nonzerobut less than or comparable to the rotational period. In asequential dissociation event, one bond is cleaved first, andone of the resulting fragments subsequently undergoes furtherdissociation on a time scale exceeding the rotational period.
The Dalitz plots presented in Fig. 6 can be used to helpelucidate the mechanism for the three-body dissociation oft-BuOO. A concerted mechanism, in which the C–C and O–O bonds break simultaneously, would result in nearly equalmomenta in the O and CH3 fragments because their massesare so similar.52 This type of concerted mechanism is there-fore consistent with the intense “stripe” along the blue axisthat is observed in the Dalitz plot for high translational ener-gies in Fig. 6(c). Along the blue axis, which represents theenergy fraction in the acetone fragment, the translationalenergy fractions in the O and CH3 fragments are equal. For asynchronous concerted dissociation with sudden recoil alongthe bonds, the energy fractions in each fragment would begiven by52
εacetone =1
1 +(macetone/4µCH3, O
) [1 + tan2 (θ/2)
] = 0.29, (15)
εCH3 =1
4(mCH3/macetone
)cos2 (θ/2) +
[(mCH3 + mO
)/mCH3
] = 0.35, (16)
εO =1
4 (mO/macetone) cos2 (θ/2) +[(
mCH3 + mO)/mO] = 0.36, (17)
where θ is the angle between the O–O and C–C bonds that arebreaking. Although the intensity in the Dalitz plot is centeredaround the point given by these energy fractions, shown byan orange cross in Fig. 6(c), and these values are similar tothe experimental average fractional energy release, presentedin Sec. III B, the very broad distribution around this pointand the geometry of the radical are also consistent with asyn-chronous concerted dissociation. Either concerted dissociationmechanism could lead to the observed intensity pattern in theDalitz plot in Fig. 6(c), but we propose that an asynchronousmechanism is more likely than C–O and C–C bond cleavageoccurring instantaneously, as discussed below.
No calculated potential energy surfaces for electronicallyexcited t-BuOO exist to our knowledge, but previous work onthe methyl peroxy8 and phenyl peroxy15 radicals suggests thatthe B state is repulsive along the O–O bond, with a shallowminimum at large O–O distances. It has previously been pre-dicted that after excitation to the B state, the major dissociationchannel for the methylperoxy radical (CH3OO) would be O +CH3O due to the repulsive nature of the B state.8 A possiblemechanism for the formation of the three-body dissociationcould therefore be direct O–O bond cleavage on the B state,followed by fragmentation of the t-BuO radical. Although atfirst glance this may appear to be a sequential mechanism,RRKM calculations for the dissociation of the t-BuO radical
predict a rate of 2.4× 10¹² s�1, faster than the rotational periodof the t-BuO radical. Hence, the overall mechanism would beclassified as an asynchronous concerted dissociation, consis-tent with the experimental Dalitz plots. A similar mechanismhas previously been observed for the 248 nm dissociation oftert-butyl hypochlorite to form Cl, O, and acetone.53 In thatexperiment, the O–Cl bond directly dissociated on an excited-state surface to form t-BuO and Cl fragments, with an averagetranslational energy around 60% of the available energy. Itwas found that the majority (90%) of the t-BuO fragmentsdecomposed to form CH3 + acetone.
As discussed in Sec. III A, the t-BuOO radical has anaverage internal energy of 0.28 eV prior to the dissociation,localized in the O–O bond stretching mode. It should be notedthat as the three body-dissociation mechanism for high trans-lational energy release involves repulsive dissociation alongthe O–O bond, this additional energy in the O–O stretchingmode will likely result in a translational energy distributionthat peaks slightly higher than if all t-BuOO radicals were inthe vibrational ground state. This would not be expected toaffect the ground state dynamics that are observed for two-body dissociation of t-BuOO, as the internal energy in theO–O stretch prior to the dissociation is much less than 5 eVavailable to the radical after internal conversion to the groundstate.
134304-9 Nichols et al. J. Chem. Phys. 147, 134304 (2017)
For dissociation events with translational energies below0.8 eV, the distribution of the normal to the dissociation planeis isotropic, consistent with dissociation occurring on a timescale that is much longer compared with molecular rotation.Internal conversion to the ground electronic state followedby dissociation generally yields more isotropic distributionsof the fragments and lower translational energy release thandissociation along an excited state, and so this could explainthe shoulder in the translational energy distribution shown inFig. 5.
For these low translational energy release events, theDalitz plot shows unequal momenta partitioning between the Oand CH3 fragments. Therefore low translational energy releaseevents are not consistent with the repulsive, concerted dis-sociation mechanism discussed above. Unequal partitioningof momenta between the O and CH3 fragments could resultfrom a sequential dissociation, in which the energy fractionof one of the fragments is determined in the first dissociationevent.28,30,54,55 The Dalitz plot in Fig. 6(b) shows two areasof intensity, one in the top left of the inscribed ellipse corre-sponding to a large εO and εacteone and small εCH3 , and theother in the bottom right of the ellipse with a large εCH3 andεacteone and small εO. As mentioned previously, the similarmasses of CH3 and O will result in some mislabeling of thefragments in the analysis process, and so it is likely that thesymmetry in this plot is an artifact and there should be onlya single area of intensity, with either small εO and large εCH3
or vice versa. The sequential dissociation of t-BuOO on theground electronic state will result in little translational energyimparted in the O fragment in a barrierless first dissociationstep.51 The secondary dissociation of t-BuO over a barrier,which has been calculated to be 0.47 eV above the products,will result in a larger translational energy release and thereforea large value of εacteone and εCH3 , which is consistent with theintensity pattern in the Dalitz plot.
V. CONCLUSIONS
The current work has studied the photodissociation oft-BuOO at 248 nm (5.00 eV) by means of fast-beam coin-cidence translational spectroscopy. Photodissociation via bothtwo- and three-body fragmentation channels is observed, andthe mass and translational energy distributions were reported.The dominant channel (83%) is found to be 3-body dissocia-tion into O + CH3 + acetone products. Above a translationalenergy release of 0.8 eV, the experimental translational energydistribution and anisotropy for this channel are found to be con-sistent with dissociation on an electronically excited surface,whilst the momentum partitioning amongst the three fragmentssuggests an asynchronous concerted fragmentation process.For translational energy release below 0.8 eV, the isotropicdistribution of the normal to the dissociation plane and veryuneven partitioning of momenta between the O and CH3 frag-ments are consistent with internal conversion to the groundelectronic state, followed by sequential dissociation. The two-body channels, O2 + t-butyl (10%) and HO2 + isobutene (7%),were attributed to internal conversion from the initially excitedB state to the ground electronic state, followed by dissocia-tion. Experimental product branching ratios for the two-body
channels are found to be in good agreement with RRKM cal-culations and suggest that the HO2 loss proceeds directly fromthe t-BuOO radical, as opposed to following isomerization tothe QOOH radical.
SUPPLEMENTARY MATERIAL
See supplementary material for simulations of the two-body mass distribution.
ACKNOWLEDGMENTS
This research was supported by the Director, Office ofBasic Energy Science, Chemical Sciences Division of theU.S. Department of Energy under Contract No. DE-AC02-05CH11231.
1F. Kirchner and W. R. Stockwell, J. Geophys. Res. 101, 21007, doi:10.1029/96jd01519 (1996).
2B. J. Finlayson-Pitts and J. N. Pitts, Science 276, 1045 (1997).3G. S. Tyndall, R. A. Cox, C. Granier, R. Lesclaux, G. K. Moortgat, M. J.Pilling, A. R. Ravishankara, and T. J. Wallington, J. Geophys. Res. 106,12157, doi:10.1029/2000jd900746 (2001).
4J. Zador, C. A. Taatjes, and R. X. Fernandes, Prog. Energy Combust. Sci.37, 371 (2011).
5C. F. Goldsmith, W. H. Green, and S. J. Klippenstein, J. Phys. Chem. A 116,3325 (2012).
6J. Zador, H. Huang, O. Welz, J. Zetterberg, D. L. Osborn, and C. A. Taatjes,Phys. Chem. Chem. Phys. 15, 10753 (2013).
7T. J. Wallington, P. Dagaut, and M. J. Kurylo, Chem. Rev. 92, 667 (1992).8J. A. Jafri and D. H. Phillips, J. Am. Chem. Soc. 112, 2586 (1990).9B. G. Glover and T. A. Miller, J. Phys. Chem. A 109, 11191 (2005).
10E. P. Clifford, P. G. Wenthold, R. Gareyev, W. C. Lineberger, C. H. DePuy,V. M. Bierbaum, and G. B. Ellison, J. Chem. Phys. 109, 10293 (1998).
11J. A. DeVine, M. L. Weichman, M. C. Babin, and D. M. Neumark, J. Chem.Phys. 147, 013915 (2017).
12A. Sinha, J. Coleman, and R. Barnes, J. Phys. Chem. 98, 12462 (1994).13D. Hartmann, J. Karthauser, and R. Zellner, J. Phys. Chem. 94, 2963 (1990).14A. T. Maccarone, B. B. Kirk, C. S. Hansen, T. M. Griffiths, S. Olsen, A. J.
Trevitt, and S. J. Blanksby, J. Am. Chem. Soc. 135, 9010 (2013).15X. He, Z.-X. Zhao, and H.-X. Zhang, Comput. Theor. Chem. 1068, 104
(2015).16G. Chettur and A. Snelson, J. Phys. Chem. 91, 5873 (1987).17I. R. Slagle, E. Ratajczak, and D. Gutman, J. Phys. Chem. 90, 402 (1986).18P. W. Seakins, M. J. Pilling, J. T. Niiranen, D. Gutman, and L. N.
Krasnoperov, J. Phys. Chem. 96, 9847 (1992).19E. Prosen, F. Maron, and F. Rossini, J. Res. Natl. Bur. Stand. 46, 106
(1951).20B. Ruscic, R. E. Pinzon, M. L. Morton, N. K. Srinivasan, M.-C. Su, J. W.
Sutherland, and J. V. Michael, J. Phys. Chem. A 110, 6592 (2006).21D. F. McMillen and D. M. Golden, Annu. Rev. Phys. Chem. 33, 493
(1982).22M. W. Chase, NIST-JANAF Thermochemical Tables (NIST, Gaithersberg,
MD, 1998).23C. D. Wijaya, R. Sumathi, and W. H. Green, J. Phys. Chem. A 107, 4908
(2003).24K. B. Moore III, J. M. Turney, and H. F. Schaefer III, J. Chem. Phys. 146,
194304 (2017).25K. B. Wiberg, L. S. Crocker, and K. M. Morgan, J. Am. Chem. Soc. 113,
3447 (1991).26D. L. Osborn, H. Choi, D. H. Mordaunt, R. T. Bise, D. M. Neumark, and
C. M. Rohlfing, J. Chem. Phys. 106, 3049 (1997).27A. W. Harrison, J. S. Lim, M. Ryazanov, G. Wang, S. Gao, and D. M.
Neumark, J. Phys. Chem. A 117, 11970 (2013).28P. E. Crider, A. W. Harrison, and D. M. Neumark, J. Chem. Phys. 134,
134306 (2011).29A. W. Harrison, J. S. Lim, P. E. Crider, and D. M. Neumark, Chem. Phys.
Lett. 512, 30 (2011).30M. Ryazanov, A. W. Harrison, G. Wang, P. E. Crider, and D. M. Neumark,
J. Chem. Phys. 140, 234304 (2014).
134304-10 Nichols et al. J. Chem. Phys. 147, 134304 (2017)
31D. Irimia, D. Dobrikov, R. Kortekaas, H. Voet, D. A. van den Ende, W. A.Groen, and M. H. Janssen, Rev. Sci. Instrum. 80, 113303 (2009).
32E. Garand, T. I. Yacovitch, and D. M. Neumark, J. Chem. Phys. 130, 064304(2009).
33J. M. B. Bakker, J. Phys. E: Sci. Instrum. 6, 785 (1973).34J. M. B. Bakker, J. Phys. E: Sci. Instrum. 7, 364 (1974).35A. W. Harrison, M. Ryazanov, E. N. Sullivan, and D. M. Neumark, J. Chem.
Phys. 145, 024305 (2016).36V. Dribinski, A. Ossadtchi, V. A. Mandelshtam, and H. Reisler, Rev. Sci.
Instrum. 73, 2634 (2002).37R. E. Continetti, D. R. Cyr, D. L. Osborn, D. J. Leahy, and D. M. Neumark,
J. Chem. Phys. 99, 2616 (1993).38V. A. Mozhayskiy and A. I. Krylov, ezSpectrum 3.0, iOpenShell
Center for Computational Studies of Electronic Structure and Spec-troscopy of Open-Shell and Electronically Excited Species, Los Angeles,http://iopenshell.usc.edu/downloads.
39M. J. Frisch, G. W. Trucks, H. B. Schlegel, G. E. Scuseria, M. A. Robb,J. R. Cheeseman, G. Scalmani, V. Barone, B. Mennucci, G. A. Petersson,H. Nakatsuji, M. Caricato, X. Li, H. P. Hratchian, A. F. Izmaylov, J. Bloino,G. Zheng, J. L. Sonnenberg, M. Hada, M. Ehara, K. Toyota, R. Fukuda,J. Hasegawa, M. Ishida, T. Nakajima, Y. Honda, O. Kitao, H. Nakai,T. Vreven, J. A. Montgomery, Jr., J. E. Peralta, F. Ogliaro, M. J. Bearpark,J. Heyd, E. N. Brothers, K. N. Kudin, V. N. Staroverov, R. Kobayashi,J. Normand, K. Raghavachari, A. P. Rendell, J. C. Burant, S. S. Iyengar,J. Tomasi, M. Cossi, N. Rega, N. J. Millam, M. Klene, J. E. Knox, J. B.Cross, V. Bakken, C. Adamo, J. Jaramillo, R. Gomperts, R. E. Stratmann,O. Yazyev, A. J. Austin, R. Cammi, C. Pomelli, J. W. Ochterski, R. L. Martin,K. Morokuma, V. G. Zakrzewski, G. A. Voth, P. Salvador, J. J. Dannenberg,S. Dapprich, A. D. Daniels, O. Farkas, J. B. Foresman, J. V. Ortiz,
J. Cioslowski, and D. J. Fox, gaussian 09, Revision B.01 Gaussian, Inc.,Wallingford, CT, USA, 2009.
40M. P. Andersson and P. Uvdal, J. Phys. Chem. A 109, 2937 (2005).41D. R. Cyr, D. J. Leahy, D. L. Osborn, R. E. Continetti, and D. M. Neumark,
J. Chem. Phys. 99, 8751 (1993).42R. H. Dalitz, Philos. Mag. 44, 1068 (1953).43L. M. Wiese, O. Yenen, B. Thaden, and D. H. Jaecks, Phys. Rev. Lett. 79,
4982 (1997).44D. Babikov, E. A. Gislason, M. Sizun, F. Aguillon, V. Sidis, M. Barat, J. C.
Brenot, J. A. Fayeton, and Y. J. Picard, J. Chem. Phys. 116, 4871(2002).
45T. Baer and W. L. Hase, Unimolecular Reaction Dynamics: Theory andExperiments (Oxford University Press on Demand, 1996).
46B. Leyh, E. Gridelet, R. Locht, and J.-C. Lorquet, Int. J. Mass Spectrom.249-250, 330 (2006).
47T. Beyer and D. Swinehart, Commun. ACM 16, 379 (1973).48A. Y. Sokolov, S. Mittal, A. C. Simmonett, and H. F. Schaefer III, J. Chem.
Theory Comput. 8, 4323 (2012).49R. Marcus and O. Rice, J. Phys. Chem. 55, 894 (1951).50J. D. DeSain, C. A. Taatjes, J. A. Miller, S. J. Klippenstein, and D. K. Hahn,
Faraday Discuss. 119, 101 (2002).51C.-J. Chen and J. W. Bozzelli, J. Phys. Chem. A 103, 9731 (1999).52C. Maul and K.-H. Gericke, Int. Rev. Phys. Chem. 16, 1 (1997).53M. A. Thelen, P. Felder, J. Frey, and J. R. Huber, J. Phys. Chem. 97, 6220
(1993).54A. Matsuda, M. Fushitani, R. D. Thomas, V. Zhaunerchyk, and A.
Hishikawa, J. Phys. Chem. A 113, 2254 (2009).55J. D. Savee, J. E. Mann, and R. E. Continetti, J. Phys. Chem. A 113, 3988
(2009).