Embed Size (px)
Citation preview
1
Persistence Criteria in the REACH Legislation:
Critical Evaluation and Recommendations
Final Report, 21.12.2006
Authors
PD Dr. Martin Scheringer
Dr. Matthew MacLeod
Institut für Chemie- und Bioingenieurwissenschaften
Eidgenössische Technische Hochschule Zürich
Wolfgang-Pauli-Str. 10
CH-8093 Zürich
Prof. Dr. Michael Matthies
Dr. Jörg Klasmeier
Dipl.-Systemwiss. Johannes Witt
Institut für Umweltsystemforschung
Universität Osnabrück
Barbarastr. 12
D-49069 Osnabrück

2
Table of contents
Zusammenfassung
Introduction
1 Status description
1.1 Data requirements
1.2 Property estimation methods
1.3 PBT assessment methods
1.4 Weaknesses in the P assessment under REACH
2 Evaluation of screening criteria for the identification of possible P chemicals
2.1 Compilation of a set of example chemicals
2.2 Evaluation of P screening criteria
2.3 Screening criterion for persistence in air
2.4 Uncertainties
3 Evaluation of P criteria
3.1 Proposal for a P criterion for air
3.2 Proposal for defining and applying P criteria under REACH
3.3 Uncertainties of measured degradation half-lives
3.4 Uncertainties of estimated degradation half-lives
3.5 Overall persistence
3.6 Long-range transport potential
3.7 Combined Pov/LRTP criteria
4 Proposed P testing strategy
References
Appendix 1: List of example chemicals
Appendix 2: Determination of soil biodegradation half-lives from simulation
tests
Appendix 3: Determination of biodegradation half-lives from water/sediment
simulation tests
3
Zusammenfassung
Im vorliegenden Gutachten wird auf der Grundlage der Datenanforderungen gemäß
REACH, Anhang VII bis IX, ein zweistufiger Vorschlag zur Identifizierung von
Stoffen mit persistenten Eigenschaften erarbeitet. Im ersten Schritt (screening)
werden die leichte biologische Abbaubarkeit und das Potential für photochemischen
Abbau zur Klassifikation herangezogen. Anhand von 70 Beispielchemikalien wird die
Eignung der leichten biologischen Abbaubarkeit als Screening-Kriterium untersucht.
Im zweiten Schritt (PBT assessment) werden Abbauhalbwertszeiten zum Vergleich
mit den Kriterien des Anhangs XIII aus quantitativen Struktur-Abbaubarkeits-
Beziehungen (QSAR) für Stoffe, die in Mengen größer als 10 t/a produziert oder
importiert werden, und aus Simulationstests für Stoffe über 100 t/a herangezogen. Es
wird empfohlen, die Persistenzkriterien um eine Abbauhalbwertszeit in Luft von zwei
Tagen zu erweitern. Die aus QSAR und Simulationstests resultierenden
Unsicherheiten bei der Identifizierung persistenter Stoffe werden durch eine
Bewertung weiterer verfügbarer Befunde (weight of evidence) abgeschätzt. Als
Alternative zur PBT-Bewertung mittels Referenzchemikalien wird vorgeschlagen, die
zeitliche Verweildauer in der Umwelt (Gesamtpersistenz) und die Ausdehnung der
räumlichen Verteilung (Ferntransportpotenzial) zu begrenzen.
4
Introduction
Persistence (P) has long been recognized as a property of concern in the assessment of
chemicals. This is particularly the case when high P occurs in combination with
potential for bioaccumulation (B) and toxicity (T). Possible adverse impacts of
substances that combine P, B and T are difficult to anticipate because they may result
from chronic, low-level exposure and/or they may occur by mechanisms not
identified in acute toxicity assessments. The current risk assessment approach of
comparing exposure against effect levels therefore does not provide a complete
picture of possible adverse impacts of persistent and bioaccumulative substances.
Consequently, environmental legislation increasingly focuses special attention on
persistent compounds, as in the Stockholm Convention, which limits or prohibits the
production and use of certain persistent organic pollutants (UNEP, 2001). Moreover,
persistent chemicals may be transported over long distances; in particular those
substances that have appreciable vapour pressure and are slowly degraded in air.
The European chemicals legislation and several international conventions have
issued criteria to regulate persistent chemicals. Persistence plays an essential role in
the EU legislation proposal REACH (Registration, Evaluation and Authorisation of
Chemicals) (European Council, 2006). A substance is considered persistent (or very
persistent) if its degradation half-lives in water, sediment or soil exceed specific
values given in Annex XIII of the draft REACH regulation. The approach of
assessing substances by comparison to half-life criteria has already been used in other
national and international assessment and prioritization schemes (Environment
Canada, 1995; UNECE, 1998; US EPA, 1999; UNEP, 2001). Whereas the Stockholm
Convention and other international conventions (OSPAR, 1992; UNECE, 1998) do
not explicitly indicate how degradation half-lives should be determined, REACH has
established the standard information required for substances manufactured or
imported in quantities of more than 1 tonnes/year in Annex VII and additional
standard information in Annexes VIII and IX for more than 10 and 100 t/a,
respectively.
There are two main problems in connection with the persistence evaluation under
REACH. First, registrants are not required to submit half-life data for chemicals
below 100 t/a, which makes it impossible to apply the persistence criteria defined in
Annex XIII to these chemicals (about 20 000 compounds). Second, the persistence
criteria defined in Annex XIII of REACH are not comprehensive because there is no
criterion for air, which means that there are persistent chemicals that will not be
identified under REACH.
In the present report, we discuss these two problems and propose possible
solutions. In Section 1, we describe the information requirements for the P assessment
under REACH along with property estimation methods that may be used to fill data
gaps. In Section 2, we explore screening criteria that can be used to identify possible
P chemicals among the compounds below 100 t/a. In Section 3, we discuss the P
evaluation criteria in REACH and propose a half-life criterion for air. We also discuss
uncertainties of measured and estimated half-life data and explore in which way
overall persistence (Pov) and long-range transport potential (LRTP) can be used in the
persistence assesment under REACH. Finally, we propose a testing strategy for
persistent chemicals in Section 4.
5
1 Status description
1.1 Data requirements
Standard information requirements related to the P criterion are established in
Annexes of REACH for substances manufactured or imported in quantities of more
than:
1 t/a: vapour pressure p°, water solubility Sw, n-octanol-water partition
coefficient, Kow, and ready biodegradability test result (Annex VII).
For substances between 1 and 10 t/a, information on persistence is only
required if application of (Q)SARs or other evidence indicates that they are likely
to meet the criteria in Annex XIII or the classification criteria for any human
health or environmental effects endpoints under Directive 67/548/EEC (Annex
III).
10 t/a: as above, plus hydrolysis as a function of pH and adsorption/desorption
screening, i.e. Kd and Koc values (Annex VIII).
100 t/a: same as above, plus dissociation constant pKa, simulation testing on
ultimate degradation in surface water, soil simulation testing if Koc is high,
sediment simulation testing if Koc is high, and identification of degradation
products (Annex IX).
No details are specified about the test conditions, e.g. which OECD or other test
guidelines should be used.
1.2 Property estimation methods
For Annex-VII substances (below 10 t/a) no information that can be readily
transformed into degradation half-lives is required; for Annex-VIII substances (below
100 t/a) only pH-dependent hydrolysis testing is required. Thus methods have to be
used to calculate or estimate degradability of these substances from other available
properties, screening test results, or from chemical structure. Howard (2000),
Jaworska et al. (2003), and Arnot et al. (2005) give overviews on structure-
biodegradability relationships (SBR) and quantitative structure-biodegradability
relationships (QSBR) for primary and ultimate biodegradation under aerobic and
anaerobic conditions. Six of these methods have been compiled as BIOWIN1_6,
which are available online in EpiSuite (US EPA, 2006). Other QSBR methods are
CATABOL (Jaworska et al., 2002) and the structure similarity approach through
atom-centered fragments (ACF) (Kühne et al., in press). EpiSuite contains also
estimation methods for photodegradation by OH-radicals (AOPWIN) and hydrolysis
(HYDROWIN). AOPWIN has been shown to yield reliable results for volatile
compounds (small compounds as in the training set of AOPWIN) (Müller, 2005).
Biodegradation estimation, in contrast, is much more diverse and uncertain. Several
authors have used empirical test data to correlate BIOWIN estimates with primary
and ultimate biodegradation half-lives in water, soil and sediment (Howard, 2000;
Aronson et al., 2006; Fenner et al., 2006). Most interesting are data from screening
tests on ready biodegradability, because they will be available for most substances
manufactured or imported in quantities greater than 1 t/a (see Section 1.1).
Partition coefficients are not explicitly required for P assessments but are helpful
for taking into consideration the environmental distribution and identifying the most
relevant degradability information for a substance. Kow is available for all substances
and Koc can be estimated from Kow or fragment methods (see PCKOCWIN in

6
EpiSuite). Henry‟s law constant, H, can be estimated as the quotient of vapour
pressure and water solubility: H = p°/Sw, which is also available for all substances
regulated under REACH.
1.3 PBT assessment methods
The PBT profiler developed by EPA (US EPA, 2003) contains QSARs to estimate
environmental degradation half-lives and other related information from chemical
structure. BIOWIN, AOPWIN, HYDROWIN and others have been adopted from
EpiSuite (see Section 1.2) to support manufacturers, importers, risk assessors and the
general public with a quick online PBT screening assessment. A steady-state non-
equilibrium multimedia model is used to calculate the environmental distribution and
the environmental compartments of concern. Half-lives used as model input are
derived from AOPWIN (air) and BIOWIN (water, soil, sediment). It is assumed that
the half-life for aerobic biodegradation obtained from BIOWIN is valid for water; for
soil and sediment, half-lives two and nine times as long as in water are assumed. The
main output of the PBT profiler is a comparison of the chemical‟s individual half-
lives, BCF and toxicity to the corresponding PBT criteria used by the US EPA (US
EPA, 1999). Overall persistence and long-range transport potential are also
calculated by the PBT profiler and are reported on a background page called “P2
considerations and more information”.
1.4 Weaknesses in P assessment under REACH
There are five problems associated with the P evaluation procedure as it will be
implemented under the REACH legislation. First, insufficient data are required under
REACH to apply the P criteria. This is especially the case for chemicals below 100
t/a, for which no information from simulation testing on biodegradation will be
required (see Section 1.1). For chemicals over 100 t/a, results from simulation tests
will be available. However, it is not clear whether these data actually represent
degradation kinetics (and not degradation and other processes such as transfer to other
media in combination, see Section 3.3 and Appendix 3). Second, the half-life criteria
are not comprehensive because they do not include a criterion for persistence in air.
Third, the selection of the numerical values of the half-life criteria in Annex XIII is
not optimal because they are based on the half-lives of certain reference chemicals
(chemicals similar to Persistent Organic Pollutants with highest half-lives in soil and
lowest half-lives in air). This means that persistent chemicals with other half-life
combinations (high persistence in air, lower persistence in soil and water) will not be
identified by these criteria. Fourth, the criteria defined in Annex XIII require
“available half-life data collected under adequate conditions” so that half-lives
estimated from chemical structure are probably not sufficient for classifying a
chemical as P. Finally, long-range transport, which is a problem occurring on a
shorter time scale than local contamination by persistent chemicals, is not addressed
at all. With the P criteria as they are defined in REACH, it is not ensured that long-
range transport in air or water will not occur. Taking these problems together, it is
clear that the possibility exists that some chemicals which are persistent in the
environment will not be identified as persistent under REACH.
7
2 Evaluation of screening criteria for the identification of possible P
chemicals
In the present European Technical Guidance Document (TGD) (European
Commission, 2003), screening criteria are defined for P and B, which have the
purpose to identify possible PBT chemicals which are then further evaluated in the
actual PBT assessment. So far, similar screening criteria have not been defined under
REACH. However, screening criteria will be needed under REACH to enable
registrants to identify possible P chemicals. Application of the screening criteria will
be an important element of the chemical safety assessment, particularly for chemicals
below 100 t/a, for which no actual half-life data are available.
The present TGD mentions the following P screening criteria: test for ready
biodegradability, test for inherent biodegradability, and estimated half-life data (p.
165/166 and Table 31 on p. 168 of part II of the present TGD). The objective of this
part of our project is to evaluate whether the ready biodegradability test or half-life
data estimated from chemical structure are more useful as screening criteria under
REACH.
2.1 Compilation of a set of example chemicals
From the data set of OECD high production volume chemicals provided by UBA,
72 chemicals were selected as example chemicals, see Tables A1 and A2
(Appendix 1). 36 of the 72 chemicals are readily biodegradable, 36 are not. The
chemicals selected cover several orders of magnitude of air/water and octanol/water
partition coefficient, indicating that they represent a wide range of environmental
partitioning behavior. The half-lives estimated from BIOWIN of the example
chemicals cover a range from 0.7 d to 1230 d for water/soil and from 1 hr to 200 d for
air.
Results (yes/no) for the ready biodegradability test (“rbt” in the following) were
taken from the data file provided by UBA, half-life values were estimated with
BIOWIN and AOPWIN and partition coefficients were mainly taken from the
handbook by Howard and Meylan (1997). BIOWIN output was converted into half-
lives with the relationships for primary biodegradation and ultimate biodegradation
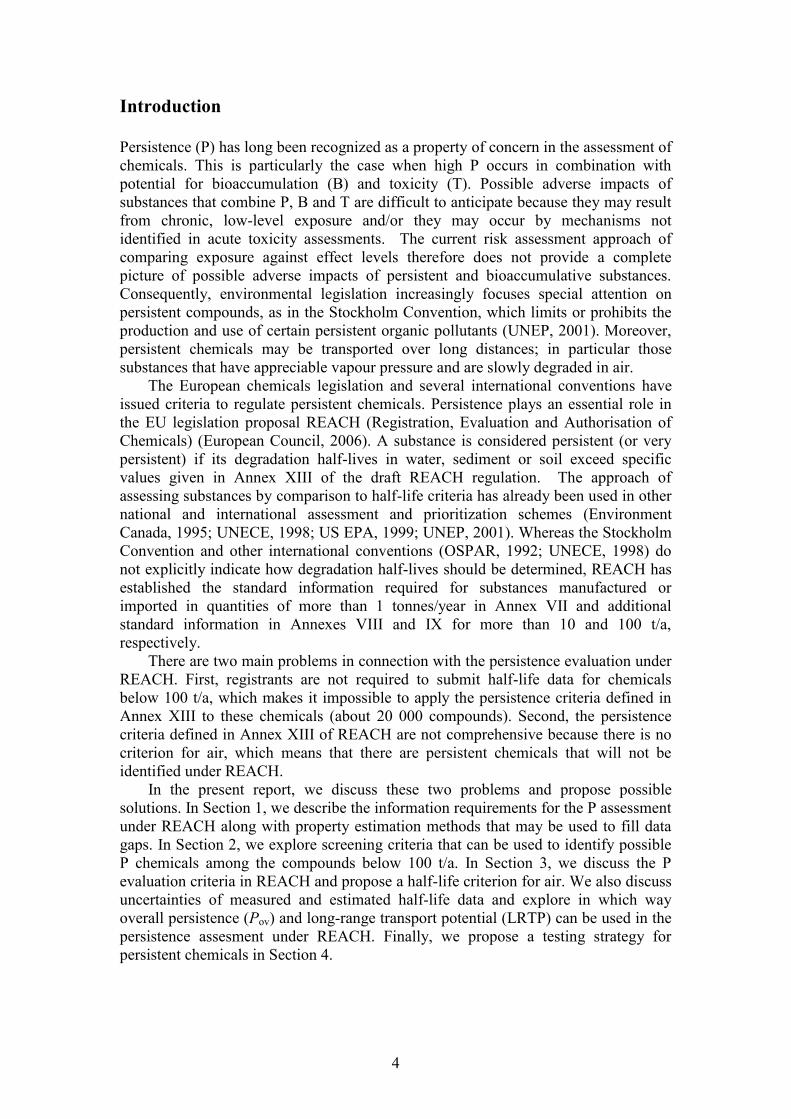
derived by Arnot et al. (2005). The distribution of the example chemicals in the
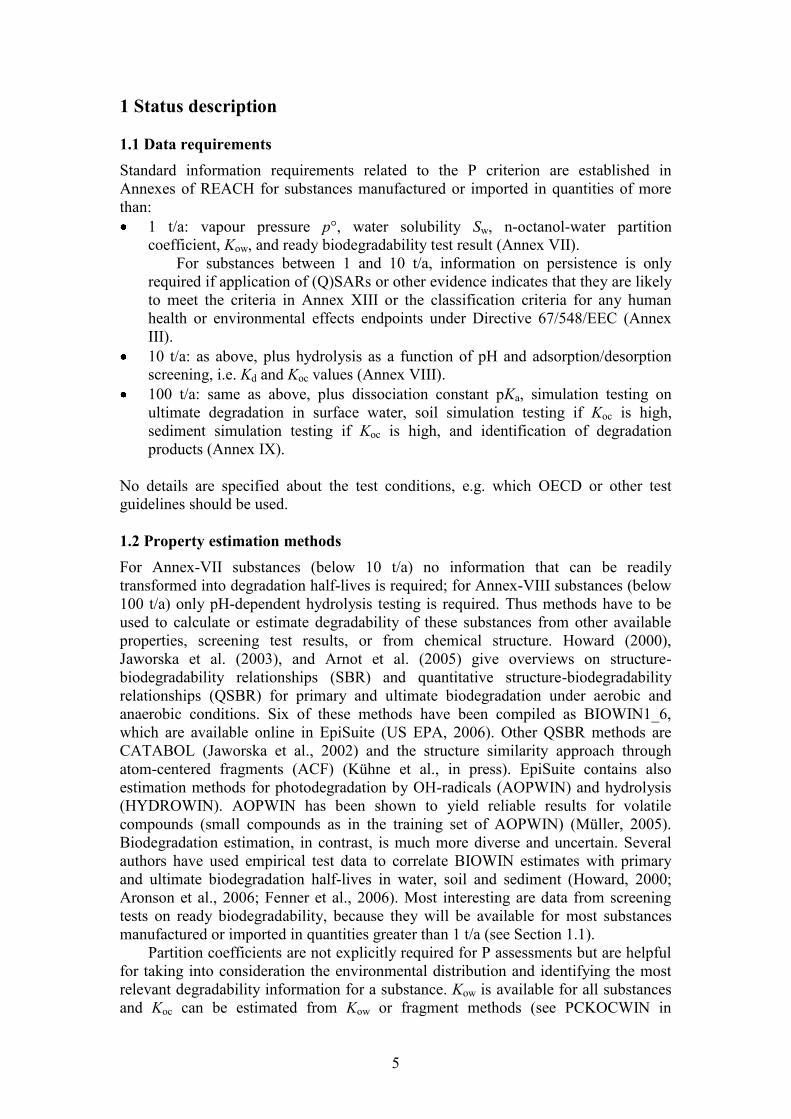
chemical space defined by log Kow and log Kaw is shown in Figure 1. Figure 2 shows
distributions of the half-lives for aerobic biodegradation as derived with BIOWIN
(Primary Survey Model) and for reaction with OH radicals as obtained with
AOPWIN.

8
Figure 1: log Kaw and log Kow values for the 72 example chemicals.
Figure 2: Histograms showing the distribution of half-life values of the 72 example
chemicals. A: half-lives in air derived from AOPWIN. B: half-lives for biodegradation in
water and soil, derived from BIOWIN-4 (Primary Survey Model) output and the
corresponding regression equation in Arnot et al. (2005, p. 18). Distributions of
biodegradation half-lives obtained with BIOWIN-3 (Ultimate Survey Model) output and the
corresponding regression equation in Arnot et al. (2005, p. 17) and with the conversion
scheme proposed by Aronson et al. (2006, p. 1957) are shown in Figure A1 in Appendix 1.
BIOWIN-3 and BIOWIN-4 results indicate the potential for aerobic biodegradation in
general, i.e. without a reference to particular degradation processes in water or in soil.
Boethling et al. (1995) found that degradation half-lives in soil can be shorter or
longer than in water and that the ratio of half-lives in the two media is approximately
log-normally distributed. Therefore, we did not introduce a constant factor to
distinguish soil half-lives from water half-lives but use the BIOWIN output (after
conversion into half-lives) for both water and soil. This is different from the approach
used in the US EPA PBT profiler, where it is assumed that half-lives in soil are twice
as long as half-lives in water (US EPA, 2003).
9
We performed the analysis presented in Section 2.2 below several times and with
increasing numbers of example chemicals. This showed that with 50 or more
chemicals the distribution of half-lives and their relationship to the ready test results
as described below is approximately stable. In other words, it is unlikely that the
results described below will significantly change if a higher number of example
chemicals are used.
There is only one very persistent chemical in the set of example chemicals
(pentabromodiphenylether). Persistent or very persistent chemicals (PCBs,
organochlorine pesticides, additional brominated diphenylethers) are likely to be not
degradable in the ready test. Therefore, most of them would increase the number of
chemicals with consistent results (high half-lives and not readily biodegradable). In
other words, our knowledge of cases in which ready-test results and estimated
degradation half-lives are not consistent would not improve with a higher number of
known persistent chemicals in the set of example chemicals. If the set of example
chemicals is to be expanded, chemicals with half-lives between 10 and 60 days are of
most interest because they would help to identify cases in which estimated half-life
and result from the ready test are not consistent.
2.2 Evaluation of P screening criteria
The ideal screening criterion for P under REACH would have several defining
characteristics. First, it must be possible to apply the screening criterion to all
substances, regardless of the tonnage level produced or imported. Second, the
screening criterion should produce very few, or ideally even zero, “false negatives”,
where a false negative is a substance that is classified as “not P” by the screening
criterion, but is in reality persistent. Third, to avoid excess work in the evaluation
process, the screening criterion should produce as few “false positives” as possible,
where a false positive is a substance that is classified as “P” by the screening
criterion, but is in reality non-persistent.
With these ideal characteristics in mind, we compare two possible screening
criteria for P under REACH; (i) results from the ready biodegradability test, and (ii)
half-life threshold values in combination with half-lives estimated from chemical
structure with the BIOWIN model. The ready-test results are compared with rankings
of the 72 substances according to estimated half-lives in water or soil. Except for a
few outliers (see below), the two types of degradation information are consistent, i.e.
most of the chemicals ranked in the lower 50% according to half-lives also have a
“yes” in the rbt and most of the chemicals ranked in the upper 50% according to half-
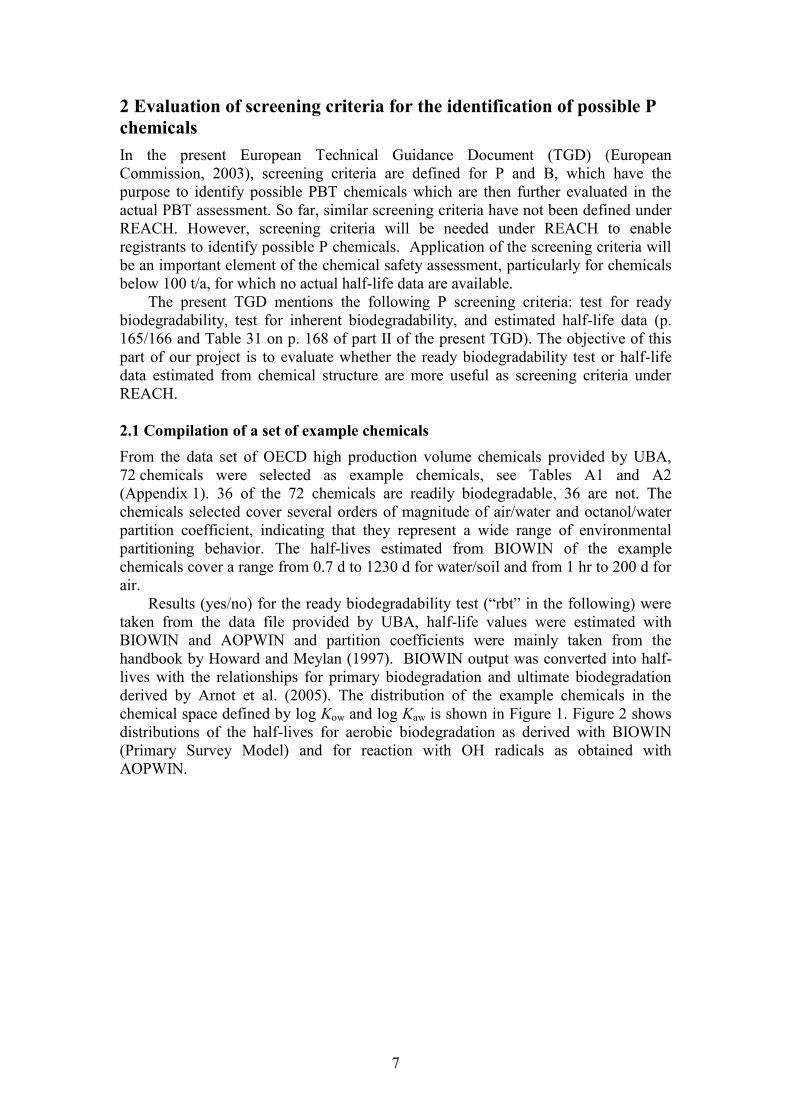
lives have “no” in the rbt, see Figure 3. The upper and lower 50% of estimated half-
lives are divided by a half-life of 13.7 days.
10
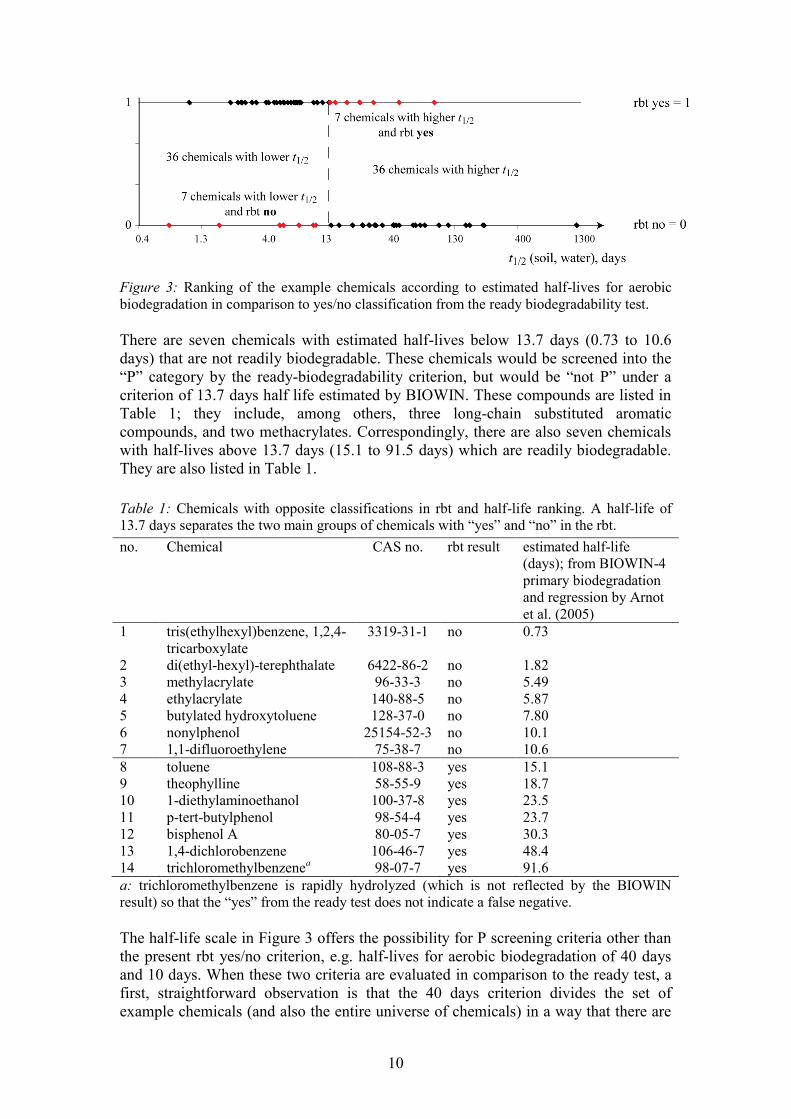
Figure 3: Ranking of the example chemicals according to estimated half-lives for aerobic
biodegradation in comparison to yes/no classification from the ready biodegradability test.
There are seven chemicals with estimated half-lives below 13.7 days (0.73 to 10.6
days) that are not readily biodegradable. These chemicals would be screened into the
“P” category by the ready-biodegradability criterion, but would be “not P” under a
criterion of 13.7 days half life estimated by BIOWIN. These compounds are listed in
Table 1; they include, among others, three long-chain substituted aromatic
compounds, and two methacrylates. Correspondingly, there are also seven chemicals
with half-lives above 13.7 days (15.1 to 91.5 days) which are readily biodegradable.
They are also listed in Table 1.
Table 1: Chemicals with opposite classifications in rbt and half-life ranking. A half-life of
13.7 days separates the two main groups of chemicals with “yes” and “no” in the rbt.
no. Chemical CAS no. rbt result estimated half-life
(days); from BIOWIN-4
primary biodegradation
and regression by Arnot
et al. (2005)
1 tris(ethylhexyl)benzene, 1,2,4-
tricarboxylate
3319-31-1 no 0.73
2 di(ethyl-hexyl)-terephthalate 6422-86-2 no 1.82
3 methylacrylate 96-33-3 no 5.49
4 ethylacrylate 140-88-5 no 5.87
5 butylated hydroxytoluene 128-37-0 no 7.80
6 nonylphenol 25154-52-3 no 10.1
7 1,1-difluoroethylene 75-38-7 no 10.6
8 toluene 108-88-3 yes 15.1
9 theophylline 58-55-9 yes 18.7
10 1-diethylaminoethanol 100-37-8 yes 23.5
11 p-tert-butylphenol 98-54-4 yes 23.7
12 bisphenol A 80-05-7 yes 30.3
13 1,4-dichlorobenzene 106-46-7 yes 48.4
14 trichloromethylbenzenea 98-07-7 yes 91.6
a: trichloromethylbenzene is rapidly hydrolyzed (which is not reflected by the BIOWIN
result) so that the “yes” from the ready test does not indicate a false negative.
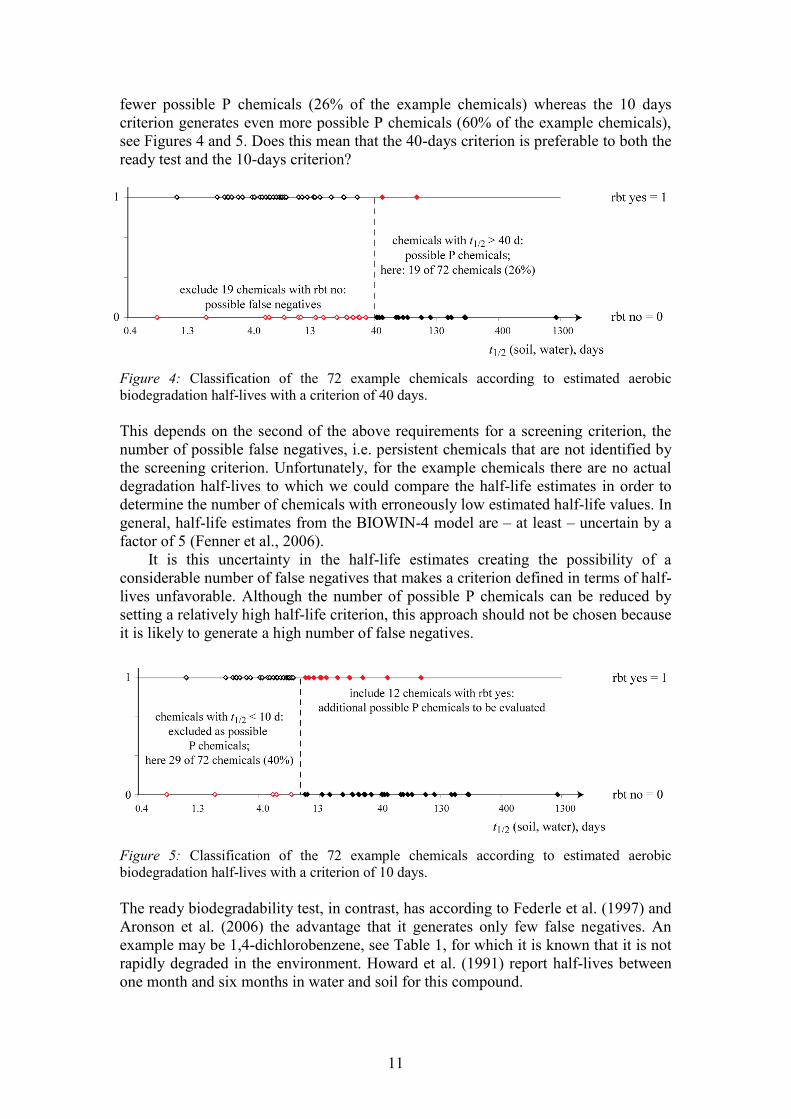
The half-life scale in Figure 3 offers the possibility for P screening criteria other than
the present rbt yes/no criterion, e.g. half-lives for aerobic biodegradation of 40 days
and 10 days. When these two criteria are evaluated in comparison to the ready test, a
first, straightforward observation is that the 40 days criterion divides the set of
example chemicals (and also the entire universe of chemicals) in a way that there are
11
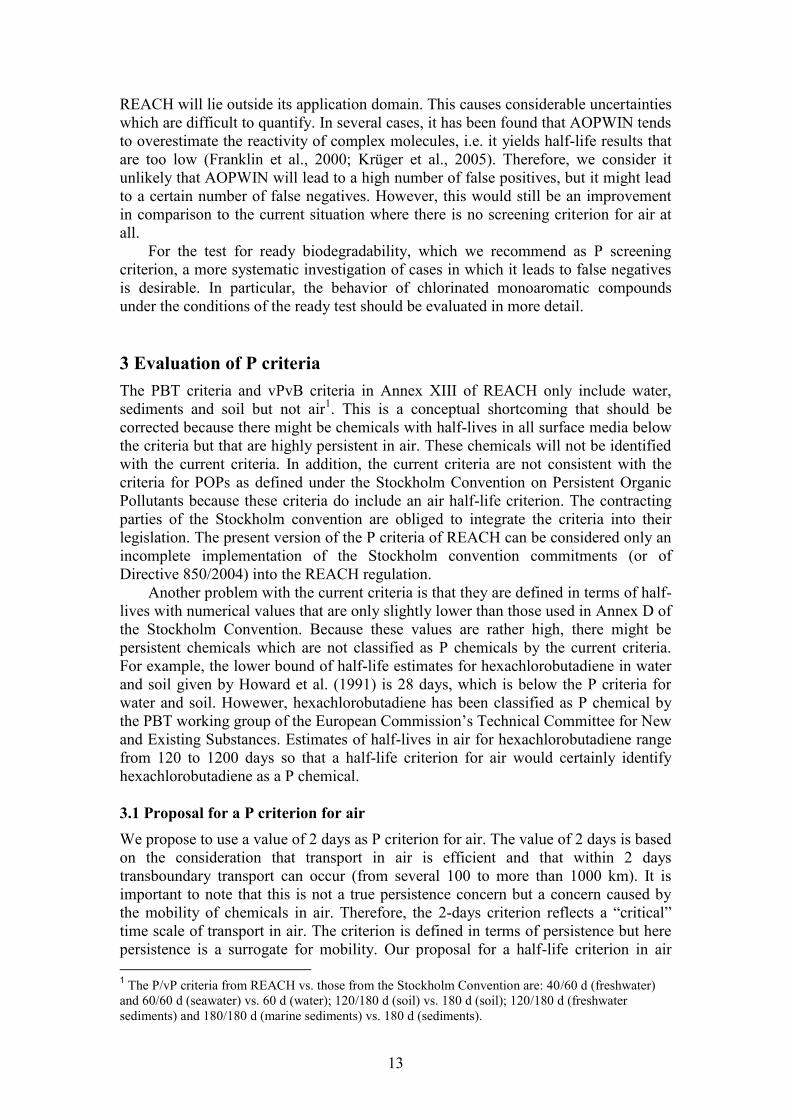
fewer possible P chemicals (26% of the example chemicals) whereas the 10 days
criterion generates even more possible P chemicals (60% of the example chemicals),
see Figures 4 and 5. Does this mean that the 40-days criterion is preferable to both the
ready test and the 10-days criterion?
Figure 4: Classification of the 72 example chemicals according to estimated aerobic
biodegradation half-lives with a criterion of 40 days.
This depends on the second of the above requirements for a screening criterion, the
number of possible false negatives, i.e. persistent chemicals that are not identified by
the screening criterion. Unfortunately, for the example chemicals there are no actual
degradation half-lives to which we could compare the half-life estimates in order to
determine the number of chemicals with erroneously low estimated half-life values. In
general, half-life estimates from the BIOWIN-4 model are – at least – uncertain by a
factor of 5 (Fenner et al., 2006).
It is this uncertainty in the half-life estimates creating the possibility of a
considerable number of false negatives that makes a criterion defined in terms of half-
lives unfavorable. Although the number of possible P chemicals can be reduced by
setting a relatively high half-life criterion, this approach should not be chosen because
it is likely to generate a high number of false negatives.
Figure 5: Classification of the 72 example chemicals according to estimated aerobic
biodegradation half-lives with a criterion of 10 days.
The ready biodegradability test, in contrast, has according to Federle et al. (1997) and
Aronson et al. (2006) the advantage that it generates only few false negatives. An
example may be 1,4-dichlorobenzene, see Table 1, for which it is known that it is not
rapidly degraded in the environment. Howard et al. (1991) report half-lives between
one month and six months in water and soil for this compound.

12
In conclusion, we can state that it is difficult to reduce the number of false positives
(which is in principle desired to reduce the number of chemicals undergoing P
evaluation) without increasing the number of false negatives. It is very likely that the
BIOWIN estimation method in combination with a half-life criterion of, for example,
40 days will create a considerable number of false negatives, which should be
avoided. At the same time, it would be difficult to specify the kind and number of
these false negatives because the uncertainties of the BIOWIN model are poorly
characterized. Therefore, we recommend using the rbt yes/no result under REACH as
the screening criterion for identification of possible P chemicals. This meets the
requirement that rbt results are available for most chemicals over 1 t/a. In addition, we
recommend that the kind of false negatives caused by the rbt (environmentally
persistent chemicals showing ready biodegradability) be further investigated.
2.3 Screening criterion for persistence in air
A “no” result in the rbt reflects the potential for persistence caused by low biological
degradability, which only reflects a subset of degradation processes in water,
sediment and soil. It does not reflect the reactivity of a chemical in air, where mainly
reaction with OH radicals determines persistence. Accordingly, it is possible that a
chemical that is readily biodegradable but persistent in air is not identified as a
possible P chemical if only the rbt is used as P screening criterion.
Therefore, we propose to complement the screening criterion for biodegradability
by a second screening criterion for degradability in air. Because for most chemicals
no measured rate constants for the reaction with OH radicals are available, we
propose that the estimation software AOPWIN be used to derive an estimate of the
atmospheric half-life of organic chemicals under REACH. AOPWIN is publicly
available and easily applied. We propose a half-life of 2 days as screening criterion
for persistence in air. This criteria value mostly reflects concern about long-range
transport in the atmosphere (see below, Section 3.1).
2.4 Uncertainties
There are major uncertainties related to both measurements and estimation of
degradation half-lives. In this report, we focus on the uncertainties associated with
estimation methods that we propose to use in the P screening and/or actual P
evaluation under REACH. The estimation software for reactions with OH radicals,
AOPWIN, is discussed here; the estimation software for aerobic biodegradation is
discussed in Section 3.4.
The methods used in the AOPWIN software have been developed by R. Atkinson
and co-workers (Atkinson et al., 1999). The actual software has been developed by
Syracuse Research Inc.; it is available free of charge from the web site of the US EPA
(US EPA, 2003). AOPWIN (version 1.91) has recently been compared with other
estimation software for reaction with OH radicals (Müller, 2005) and has been found
to be the most accurate method and is, at the same time, relatively easy to use. The
main limitation of AOPWIN is that its training set is not exactly known and that the
program has not been trained for complex molecules. Only degradation of compounds
in the gas phase can be estimated but AOPWIN does not provide information about
the reactivity of semivolatile organic compounds (SOCs) bound to aerosol particles.
However, for many SOCs, sorption to aerosol particles is important and influences
their fate in the atmosphere, including long-range transport. Therefore, the application
domain of AOPWIN is relatively limited and many chemicals to be assessed under
13
REACH will lie outside its application domain. This causes considerable uncertainties
which are difficult to quantify. In several cases, it has been found that AOPWIN tends
to overestimate the reactivity of complex molecules, i.e. it yields half-life results that
are too low (Franklin et al., 2000; Krüger et al., 2005). Therefore, we consider it
unlikely that AOPWIN will lead to a high number of false positives, but it might lead
to a certain number of false negatives. However, this would still be an improvement
in comparison to the current situation where there is no screening criterion for air at
all.
For the test for ready biodegradability, which we recommend as P screening
criterion, a more systematic investigation of cases in which it leads to false negatives
is desirable. In particular, the behavior of chlorinated monoaromatic compounds
under the conditions of the ready test should be evaluated in more detail.
3 Evaluation of P criteria
The PBT criteria and vPvB criteria in Annex XIII of REACH only include water,
sediments and soil but not air1. This is a conceptual shortcoming that should be
corrected because there might be chemicals with half-lives in all surface media below
the criteria but that are highly persistent in air. These chemicals will not be identified
with the current criteria. In addition, the current criteria are not consistent with the
criteria for POPs as defined under the Stockholm Convention on Persistent Organic
Pollutants because these criteria do include an air half-life criterion. The contracting
parties of the Stockholm convention are obliged to integrate the criteria into their
legislation. The present version of the P criteria of REACH can be considered only an
incomplete implementation of the Stockholm convention commitments (or of
Directive 850/2004) into the REACH regulation.
Another problem with the current criteria is that they are defined in terms of half-
lives with numerical values that are only slightly lower than those used in Annex D of
the Stockholm Convention. Because these values are rather high, there might be
persistent chemicals which are not classified as P chemicals by the current criteria.
For example, the lower bound of half-life estimates for hexachlorobutadiene in water
and soil given by Howard et al. (1991) is 28 days, which is below the P criteria for
water and soil. Howewer, hexachlorobutadiene has been classified as P chemical by
the PBT working group of the European Commission‟s Technical Committee for New
and Existing Substances. Estimates of half-lives in air for hexachlorobutadiene range
from 120 to 1200 days so that a half-life criterion for air would certainly identify
hexachlorobutadiene as a P chemical.
3.1 Proposal for a P criterion for air
We propose to use a value of 2 days as P criterion for air. The value of 2 days is based
on the consideration that transport in air is efficient and that within 2 days
transboundary transport can occur (from several 100 to more than 1000 km). It is
important to note that this is not a true persistence concern but a concern caused by
the mobility of chemicals in air. Therefore, the 2-days criterion reflects a “critical”
time scale of transport in air. The criterion is defined in terms of persistence but here
persistence is a surrogate for mobility. Our proposal for a half-life criterion in air
1 The P/vP criteria from REACH vs. those from the Stockholm Convention are: 40/60 d (freshwater)
and 60/60 d (seawater) vs. 60 d (water); 120/180 d (soil) vs. 180 d (soil); 120/180 d (freshwater
sediments) and 180/180 d (marine sediments) vs. 180 d (sediments).
14
corresponds to the long-range transport criterion defined in Annex D of the
Stockholm Convention.
Air is the main transport medium of chemicals in the environment and it is
therefore important to address not only persistence but also long-range transport. A
pure persistence criterion for air should be consistent with persistence criteria for
water/soil/sediment (see below); this would then be a value greater than 2 days,
depending on the value for water/soil/sediment, see below. However, LRT has a
shorter time scale and in order to address LRT as well, the proposed criterion for half-
life in air is 2 days.
3.2 Proposals for defining and applying P criteria under REACH
In this section, we propose a possible procedure for identifying P chemicals under
REACH. To identify P chemicals, comparison should be made against all single-
media half-lives using an “OR” relationship – i.e. if a substance exceeds any of the
half life criteria it should be flagged as P. This makes it possible to identify chemicals
that are persistent or mobile in air. An “AND” relationship would miss chemicals that
are (highly) persistent in water, soil and sediment but are rapidly degraded in air
(these chemicals could well cause severe local contamination) and also chemicals that
are sufficiently long-lived in the air and, therefore, have high mobility but are not
persistent in surface media. These chemicals can well cause transboundary pollution.
Proposal for defining P criteria under REACH
A substance fulfils the persistence/vP criterion (P/vP) if:
the half-life in marine water is higher than 60 days, OR
the half-life in fresh- or estuarine water is higher than 40/60 days, OR
the half-life in marine sediment is higher than 180 days, OR
the half-life in fresh- or estuarine water sediment is higher than 120/180 days, OR
the half-life in soil is higher than 120/180 days, OR
the half-life in air is higher than 2 days.
For chemicals below 100 t/a that are not readily biodegradable, biodegradation half-
lives will have to be initially estimated with BIOWIN and the regression equations of
Arnot et al. (2005) or Aronson et al. (2006). Simulation tests could be requested or
provided based on the results of the BIOWIN and AOPWIN estimations. For
chemicals over 100 t/a, half-lives from simulation tests (water, in some cases (Koc
high) also soil) will be available unless testing is not technically feasible. For these
chemicals, the quality of the measured data has to be evaluated (see Section 3.3 and
Appendices 2 and 3). It might be helpful to compare the measured data to estimates
obtained with BIOWIN. Half-lives in air have to be estimated with AOPWIN also for
these chemicals.
To evaluate the current P criteria defined in Annex XIII of REACH, it is helpful
to consider that there are two conceptually different approaches to defining P criteria:
1. REFERENCE CHEMICALS APPROACH: Under this approach, it is assumed
that the objective of the P assessment is to avoid chemicals similar to known
POPs such as PCBs. These known POPs have different half-lives in different
media (typically half lives in the different media are in the order air < freshwater
15
< seawater and soil < sediment). In this approach, the half-life criteria reflect the
half-lives of these identified “reference chemicals” and are different for different
media. We call this approach the reference chemicals approach.
It is important to note that the half-life criteria in REACH are different for the
different media because they are intended to reflect the half-lives of actual
chemicals that have been recognized as too hazardous to be released to the
environment in any amount (reference chemicals). Other aspects such as
systematically slower degradation of chemicals in soil, formation of bound
residues in soil etc. are no reason for setting different half-life criteria for
different media.
2. MANAGEMENT APPROACH: An alternative approach is to attempt to limit
the actual persistence of chemicals in the environment as the goal of the
assessment scheme. The objective is to control the presence of chemicals in the
environment and, for this purpose, a half-life criterion around 90 days seems to
be suitable because contamination by chemicals with half-lives of 90 days or less
can be significantly reduced within one year. One year is a reasonable timescale
because it is sufficiently short to evaluate and adjust measures for controlling
releases of a chemical. Within this approach, all half-life criteria should be equal
and be around 90 days. (A half-life criterion for air can be shorter because it is
intended to address the mobility of chemicals, which is a different problem that
occurs on a shorter timescale.) We call this approach the management approach
to controlling P chemicals.
The management approach is more comprehensive because it covers all types of
chemicals and helps to avoid contamination by any kind of persistent chemical. The
reference chemical approach has “loopholes” for chemicals that are persistent in a
way different from the reference chemicals, e.g. chlorofluorocarbons, which are
highly persistent in air. We therefore suggest that the P criteria under REACH be
defined according to the management approach, i.e. a value of 90 days is used for soil,
water, and sediment and, to avoid long-range transport in air, a value of 2 days is used
for air.
3.3 Uncertainties of measured degradation half-lives
For substances produced or imported in amounts greater than 100 t/a results from
simulations tests on ultimate degradation in surface water, degradation in soil and
sediment are required in Annex IX of REACH. Simulation test guidelines are
available from the OECD (1996) for biodegradability in seawater (OECD 306), for
aerobic sewage treatment (OECD 303A), for water and sediment (OECD 308/309),
and for inherent biodegradability in soil (OECD 304A). A draft report from a
workshop on “Strategies for selecting biodegradation simulation tests and their
interpretation in persistence evaluation and risk assessment” (STEP, 2006) has
recently been issued. The participants discussed various aspects for selecting
simulation tests and environmental conditions for PBT evaluation and proposed a new
waste water treatment simulation test. Simulation tests are also used in the pesticide
licensing process, e.g OECD 308/309 for water/sediment (see also BBA (1990) and
SETAC (1995)). Various test guidelines are also available for aerobic and anaerobic
degradation in laboratory and field soils (see Appendix 2). Simulation tests are carried
out with radiolabelled compounds. The time after which 50% or 90% of the applied
quantity has dissipated or disappeared is used to quantify degradation. Mineralization,

16
expressed as the evolution of 14
CO2, and the amount of metabolites and bound
residues are also relevant information. Dissipation or disappearance times, DT50 and
DT90, include effects of many different processes (degradation, transport, adsorption,
formation of bound residues, even volatilization). Bound (or non-extractable) residues
are of particular concern because the chemical species still available in the sample are
not identifiable and their (bio)availability not known. The FOCUS group (2005) has
issued a report describing how the kinetics of the various fate processes in water and
sediment can be separated and “true biodegradation” half-lives, DegT50, can be
quantified by kinetic modeling. We used data for some pesticides from
water/sediment tests to investigate the various fate and transport processes and to
derive compartment-specific half-lives for water and sediment (see Appenidx 3). In
Appendix 2 we develop and apply a kinetic model by using results from soil
simulations tests for several pesticides to derive DegT50/DegT90 instead of DT50/DT90.
Although the conclusions are based on results for pesticides, they are also valid for
the interpretation of simulation test for chemicals under REACH.
3.4 Uncertainties of estimated degradation half-lives
In our case study we estimated degradation half-lives from output from BIOWIN
using the regression equation derived by Arnot et al. (2005). Uncertainty in these
estimations arises from two sources: (i) uncertainty in the Arnot et al. regression, and
(ii) uncertainty in the numerical output from BIOWIN. As for (i), Fenner et al. (2006)
calculated the mean squared error from the regression data reported by Arnot et al.
(2005). They found a value of 0.7 log units for the mean squared error of the
regression equation in the top panel on p. 18 in Arnot et al. (2005), which converts
into a factor of five in the half-lives. (ii) The uncertainty in the BIOWIN output was
specified by Boethling et al. (1994) in their original publication describing the
BIOWIN primary and ultimate degradation survey models. Boethling et al. (1994)
report 95% confidence limits on the numerical output of the two models to be
approximately 0.5 units. This encompasses 10% of the complete range of possible
output from the models, thus at best BIOWIN can separate chemicals into one of 9
“noniles” of biodegradability.
The two conversion schemes from Arnot et al. (2005, p. 18, top) and Aronson et
al. (2006, p. 1957) are shown in Figure 6, see also Figure 2 above and Figure A1 in
Appendix 1 with results for the 72 example chemicals.

17
Figure 6: Methods for converting BIOWIN-4 output into half-lives.
Aronson et al. (2006, p. 1959) state that BIOWIN output yields too low half-lives for
persistent chemicals, which implies that the regression by Arnot et al. is a better
choice.
In the following, we discuss the relationship between BIOWIN and results from the
ready biodegradability test in more detail.
The ready test is not meant to provide kinetic information about biodegradation.
It seems that the ready test, although it does not provide kinetic information2, is
relatively reliable in the identification of non-persistent chemicals (few false
negatives but more false positives). This is supported by the analysis by Aronson et
al. (2006, p. 1955), who find that 92.7% of their example chemicals with a
degradation of more than 40% in the ready test also have low half-lives but that only
58.3% of the example chemicals with less than 40% degradation in the ready test are
actually persistent.3 However, it has to be kept in mind that there is quite some
uncertainty in the empirical half-life data used by Aronson et al. (2006). They
compiled data from different data sources such as river die-away tests, simulation
tests and field observations) In summary, the studies of Federle et al. (1997) and
Aronson et al. (2006) support our recommendation that the ready test be used as a
persistence screening criterion in the P assessment under REACH, see Section 4 and
Figure 7.
2 Federle et al. (1997) observed “almost perfect non-correlation” between rates measured in ready tests
and mineralization rates measured in activated sludge, river water and soil. However, they also state
“Despite this limitation, ready tests remain very powerful tools for demonstrating the complete
biodegradation of a chemical and the existing distribution of degradative microorganisms”. 3 In our own analysis we investigated the results yielded by the ready test for a selection of persistent
chemicals. The chemicals examined in Appendix 2 (see Section 3.3) are all not readily biodegradable
(only two of them show noteworthy degradation in the ready-test at all; all other substances are only 0–
3% mineralized after 28d). In Appendix 2 we describe the procedure to compare mineralization in a
ready-test with that in soil. It shows that for these persistent chemicals no correlation exists between
ready test results and mineralization half-lives in soil or DegT50.
18
3.5 Overall persistence
Although single media half-life criteria are likely to be adopted in the final version of
REACH, it is important to recognize that there are many advantages of calculating
overall persistence, Pov, using a multimedia model, compared to a single-media half-
life approach. Overall persistence includes information about the environmental
partitioning of a chemical and thereby assigns realistic weights to the single-media
half-lives. It is a conceptually satisfying approach to estimating P since it incorporates
limits on the influence of the individual half-lives based on estimated partitioning in
the environment. Pov information can also help to identify chemicals that are
classified as P because of a high half-life in a compartment to which they might be
released but where they do not reside (these chemicals can be considered to be type of
“false positive” since they will be identified as P by the single media half-life criteria,
but they will not be persistent in the environment). To reflect partitioning information
in the P assessment, the PBT profiler (EPA, 2003) uses a Level III-multimedia model
to calculate the relative distribution of a chemical and to dermine which half-lives are
most relevant. Pov information even goes a step further by considering the temporal
remote state, i.e. the environmental partitioning of a chemical that is observed in the
long term (Stroebe et al. 2004). The temporal remote state is independent of the
emission scenario. In addition, Pov calculations also yield estimates of long-range
transport potential in air and/or water.
At this time, a consensus model for calculating Pov is available (OECD Pov and
LRTP Estimation Tool) and also an approach that makes Pov results independent of
the release compartment (the temporal remote state as described by Stroebe et al.
(2004)). P evaluations in terms of Pov can be based either on the management
approach (Pov below 90 days, CTD below 4 m/s times 2 days) or on the reference
chemicals approach (below Pov of a reference chemical; reference chemicals in this
context should be less persistent than the POPs reference chemicals selected by
Klasmeier et al. (2006)).
To compare the ranking of chemicals according to Pov with the P evaluation
based on the REACH criterion of 40 days for fresh water, we calulated Pov results for
the 72 example chemicals with the OECD Tool. With one exception, the chemicals
with water half-lives exceeding the 40-days criterion (19 chemicals) are identical to
the 19 chemicals with the highest Pov values. Methylchloride is the chemical that is
among the high-Pov chemicals but has half-lives in water/soil below 40 days. In other
words, the two evaluation schemes are highly consistent when we look at the set of
example chemicals. The effect of considering Pov is that volatile chemicals with high
half-lives in air are identified as persistent, because their Pov is strongly influenced by
the half-life in air. With the half-life criteria for water, soil and sediment, in contrast,
these chemicals are not identified unless they have also high half-lives in water or
soil. As illustrated by the examples of methylchloride and hexachlorobutadiene, this is
not necessarily the case.
3.6 Long-range transport potential
Long-range transport potential describes the tendency of a substance to be distributed
over the whole globe. The contamination of remote areas such as the arctic or pristine
mountain areas is of particular concern. Persistence is only one of the governing
processes; the other is transport with the mobile environmental media air and water.
Semivolatile compounds are particularly prone to LRTP, which is considered as a
selection criterion in the Stockholm Convention and the UNECE protocol but neither
19
in REACH nor in the present TGD. In the Stockholm Convention, for example, it is
suggested to use as screening criterion for LRTP “environmental fate properties
and/or model results that demonstrate that the chemical has the potential for long-
range environmental transport through air, water and migratory species, with the
potential for transfer to a receiving environment in locations distant from the sources
of release”. LRTP can be calculated with the same multimedia models used to
calculate overall persistence, Pov. The approach of the spatial remote state makes it
independent of the compartment of release. All of these benefits can be realized by
applying The OECD Pov and LRTP Screening Tool to calculate Pov and LRTP as a
complementary activity to the formal P screening process under REACH.
3.7 Combined Pov/LRTP criteria
Fenner et al. (2005) compared nine different multimedia models and came to the
conclusions that rankings of chemicals according to Pov and LRTP are highly
correlated among models and are largely determined by chemical properties. Domains
of chemical properties in which model differences lead to different results were
identified, and guidance on model selection is provided for model users. Klasmeier et
al. (2006) derived a novel approach based on acknowledged POPs as reference
chemicals to derive classification boundaries for Pov and LRTP. They recommended
adoption of the model-based classification method as a complement to screening
against defined half-life criteria. The approach can yield classifications qualitatively
different from those based on the single-media half-life criteria. We recommend that
P evaluation criteria based on half-life cut-off values should be supported by the
additional insights provided by multimedia models.
In addition to the reference chemicals approach used by Klasmeier et al. (2006),
it is possible to apply the the management approach to set criteria for persistence and
LRTP of chemicals in combined Pov/LRTP evaluations. Applying the management
approach merely requires regulators to define acceptable absolute limits on Pov and
LRTP for chemicals. As discussed above (p. 14), we recommend a 90-day overall
persistence in the environment as a reasonable criterion for Pov based on a
management approach since this would allow significant reductions in environmental
concentrations to be achieved within the timeframe of one year. Criteria for LRTP
could be similarly derived, but they will have to be selected to be consistent with the
metric of LRTP used in the modelling study. For example, a volatile chemical with a
2-day half life in air has a characteristic travel distance (CTD) of 500 km. The 2-day
half-life in air was defined as a reasonable limit without reference to any specific
chemicals, therefore, 500 km would represent a reasonable CTD criteria under the
management approach.
4. Proposed P testing strategy
Our proposed strategy for evaluating organic substances for persistence under
REACH is summarized in Figure 7. There are three main assessment stages in our
proposed strategy:
1. Screening P assessment: All substances are initially categorized to the left or
right side of the decision tree based on the ready biodegradability test and the
estimated half-life for reaction with OH radicals.
2. REACH-defined P assessment: Substances are evaluated against the defined
half-life criteria in REACH by using measured or estimated half-lives derived
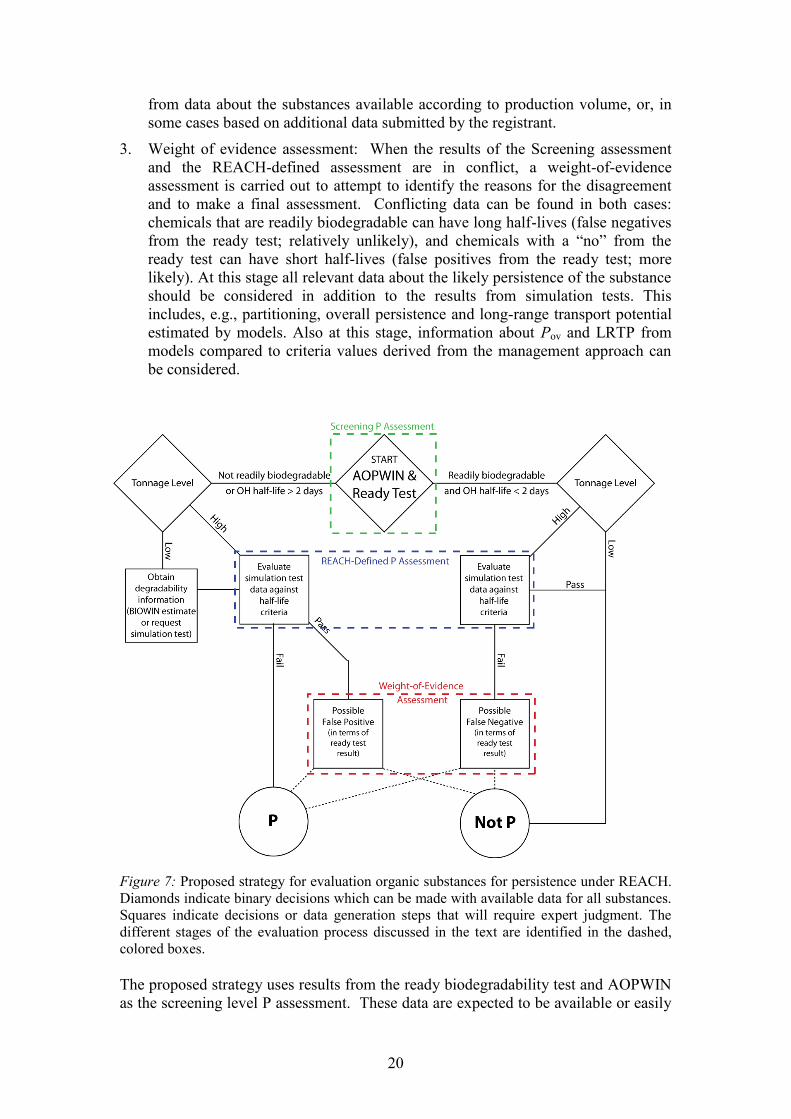
20
from data about the substances available according to production volume, or, in
some cases based on additional data submitted by the registrant.
3. Weight of evidence assessment: When the results of the Screening assessment
and the REACH-defined assessment are in conflict, a weight-of-evidence
assessment is carried out to attempt to identify the reasons for the disagreement
and to make a final assessment. Conflicting data can be found in both cases:
chemicals that are readily biodegradable can have long half-lives (false negatives
from the ready test; relatively unlikely), and chemicals with a “no” from the
ready test can have short half-lives (false positives from the ready test; more
likely). At this stage all relevant data about the likely persistence of the substance
should be considered in addition to the results from simulation tests. This
includes, e.g., partitioning, overall persistence and long-range transport potential
estimated by models. Also at this stage, information about Pov and LRTP from
models compared to criteria values derived from the management approach can
be considered.
Figure 7: Proposed strategy for evaluation organic substances for persistence under REACH.
Diamonds indicate binary decisions which can be made with available data for all substances.
Squares indicate decisions or data generation steps that will require expert judgment. The
different stages of the evaluation process discussed in the text are identified in the dashed,
colored boxes.
The proposed strategy uses results from the ready biodegradability test and AOPWIN
as the screening level P assessment. These data are expected to be available or easily

21
accessible for all chemicals registered under REACH. The categorization in the
screening assessment places the substance onto either the right or left side of the
decision tree. Substances on the right side of the decision tree are most likely on the
path to a “Not P” assessment, while substances on the left side are more likely to
receive a “P” assessment. Once they are initially categorized at the screening level,
the only way a substance can cross from one side of the decision tree to the other is by
a weight-of-evidence judgment that it was incorrectly classified by the screening
assessment.
Based on our case study of 72 substances, we believe a large majority of the
substances placed on the right-hand side of the decision tree by the screening level P
categorization will ultimately be assessed as being “Not P” because the ready
biodegradability test is expected to produce only a small number of false negatives. It
is much more likely that substances placed on the left-hand side of the decision tree
will cross over to the right side and ultimately be assessed as “Not P”.
Substances at the lowest two tonnage levels, i.e. below 100 t/a, that are placed on
the right side of the decision tree by the screening assessment are essentially
automatically assessed as “Not P” because it is expected that in most cases there are
no other data available for making comparisons against the half-life criteria defined
under REACH. If such data are available for the low-tonnage level substances, they
should be compared against the half-life criteria defined in REACH.
For high tonnage level substances classified on the right side of the decision tree
in the screening level analysis, information about degradation from the simulation
tests should be available and can be evaluated against the defined half-life criteria
under REACH. As mentioned above, we expect the majority of these substances will
pass the criteria and be assessed as “Not P”. Some substances may fail the criteria
and enter the more detailed weight of evidence assessment since the data from the
ready test and the experimentally derived half-lives are in conflict.
All substances classified to the left side of the decision tree enter the P evaluation
procedure defined under REACH. For chemicals over 100 t/a, data from simulation
tests in surface water and, depending on Koc, in sediment and soil (see Section 1.1)
will be available. It needs to be evaluated whether these data actually represent
degradation DT50 data (see Section 3.4). Where necessary, degradation DT50 data
should be derived from the measured data on degradation, which can then be
compared to the half-life criteria values in Annex XIII of REACH. For chemicals
below 100 t/a, there are several options: (i) simulation tests could be requested from
the registrant during the evaluation, (ii) half-lives could be estimated with BIOWIN
and a conversion of BIOWIN output into half-lives for aerobic biodegradation, or,
(iii) additional information could be provided by the registrant to support the
evaluation of the substances degradability against the half-life criteria.
Substances on the left side of the decision tree that are judged to pass the half-life
criteria are possible false positives from the screening assessment using results from
the ready test. Based on a weight-of-evidence approach that should include results
from a multimedia model and evaluation against criteria values derived from a
management approach, such substances might cross the decision tree to be classified
as “Not P”. This model-based evaluation could include a calculation of the chemical‟s
fractions in different media so that it can be determined which half-lives are most
influential. For these half-lives, improved empirical information could be requested.
A suitable model available for that purpose is the OECD Pov and LRTP Screening
Tool.
22
Note that there remains significant scientific uncertainty about how reliable
estimates of degradability in the real environment are. Data from simulation tests
may represent DT50, and not DegT50. Correlations between BIOWIN and DT50 or
DegT50 can be very poor, and there is current scientific debate about whether this
conversion works at all. The best conversion scheme (Arnot et al., 2005) has an
uncertainty of a factor of at least 5 in half-lives. In the worst case, the uncertainty is so
high that a quantitative estimation of half-lives is impossible.
Therefore, an entirely different approach could be used in the weight of evidence
assessment. For example, the half-lives or reaction rate constants of a chemical could
be compared to those determined for reference chemicals in a well-defined reactivity
test system (reference chemicals approach). Green and Bergman (2005) have
suggested this approach and have identified as suite of relevant reaction types
including oxidation, reduction, nucleophilic substitution, photolysis, and radical
reactions. While still highly experimental, we believe this method of assessing
environmental persistence holds considerable promise, and that further research in
this area should be supported.
References
Arnot, J., Gouin, T., Mackay, D. (2005) Practical Methods for Estimating
Environmental Biodegradation Rates. Draft Guidance Report for Environment
Canada in partial fulfillment of the Cooperative Agreement between Environment
Canada and the Canadian Environmental Modelling Network, Canadian
Environmental Modelling Network, March 2005.
Aronson, D., Boethling, R. Howard, P., Stiteler, W. (2006) Estimating biodegradation
half-lives for use in chemical screening. Chemosphere 63, 1953–1969.
Atkinson, R., Guicherit, R., Hites, R.A., Palm, W.-U., Seiber, J.N., de Voogt, P.
(1999) Transformation of Pesticides in the Atmosphere: a State of the Art, Water,
Air, and Soil Pollution 115, 219–243.
BBA (1990) Richtlinien für die Prüfung von Pflanzenschutzmitteln im
Zulassungsverfahren. Teil IV, 5-1: Abbaubarkeit und Verbleib von
Pflanzenschutzmitteln im Wasser/Sediment-System. Biologische Bundesanstalt
für Land- und Forstwirtschaft, Braunschweig, Germany.
Boethling, R.S., Howard, P.H., Meylan, W.M., Stiteler, W., Beauman, J., and Tirado,
N. (1994) Group Contribution Method for Predicting Probability and Rate of
Aerobic Biodegradation, Environ. Sci. Technol. 28, 459–465.
Boethling, R.S., Howard, P.H., Beauman, J.A., Larosche, M.E. (1995) Factors for
Intermedia Extrapolation in Biodegradability Assessment, Chemosphere 30, 741–
752.
Environment Canada (1995) Toxic Substances Management Policy, Ottawa, Canada,
http://www.ec.gc.ca/toxics/TSMP/en/execsum.cfm
European Council (2006) Council of the European Union, Common position adopted
by the Council (REACH); (7524/06) Luxembourg, 2006,
http://register.consilium.europa.eu/pdf/en/06/st07/st07524.en06.pdf
European Commission (2003) Technical Guidance Document in Support of the
Commission Directive 93/67/EEC on Risk Assessment for New Notified
Substances and the Commission Regulation (EC) 1488/94 on Risk Assessment of
Existing Substances, European Chemicals Bureau, Ispra, Italy.
(http://ecb.jrc.it/tgdoc).

23
Federle, T.W., Gasior, S., Nuck, B.A. (1997) Extrapolating mineralization rates from
the ready CO2 screening test to activated sludge, river water, and soil. Environ.
Toxicol. Chem. 16, 127–134.
Fenner, K., Canonica, S., Escher, B.I., Gasser, L., Tülp, H. (2006) Developing
Methods to Predict Chemical Fate and Effect Endpoints for Use Within REACH,
Chimia 60, 683–690.
Fenner, K., Scheringer, M., MacLeod, M., Matthies, M., McKone, T.E., Stroebe, M.,
Beyer, A., Bonnell, M., Le Gall, A.-C., Klasmeier, J., Mackay, D., van de Meent,
D.W., Pennington, D., Scharenberg, B., Suzuki, N., Wania, F. (2005) Comparing
Estimates of Persistence and Long-range Transport Potential among Multimedia
Models. Environ. Sci. Technol. 39, 1932–1942.
Franklin, J., Atkinson, R., Howard, P.H., Orlando, J.J., Seigneur, C., Wallington, T.J.,
Zetzsch, C. (2000) Quantitative Determination of Persistence in Air, in: G. Klecka
et al. (Eds.) Evaluation of Persistence and Long-Range Transport of Organic
Chemicals in the Environment. SETAC Press, Pensacola, Florida, p. 7–62.
FOCUS (2005) Guidance Document on Estimating Persistence and Degradation
Kinetics from Environmental Fate Studies on Pesticides in EU Registration',
Technical report, FOCUS Work Group on Degradation Kinetics.
Green, N., Bergman, A. (2005) Chemical Reactivity as a Tool for Estimating
Persistence, Environ. Sci. Technol. 39, 480A–486A.
Howard (2000) Biodegradation. In: Handbook of Property Estimation Methods for
Chemicals: Environmental and Health Sciences. R.S. Boethling and D. Mackay,
eds. CRC Press: Boca Raton, FL, USA.
Howard, P.H., Boethling, R.S., Jarvis, W.F., Meylan, W.M., Michalenko, E.M. (Eds.)
(1991) Handbook of Environmental Degradation Rates. Lewis Publishers,
Chelsea, MI.
Howard, P.H., Meylan, W.M. (1997) Handbook of Physical Properties of Organic
Chemicals. CRC Press, Boca Raton, FL, USA.
Jaworska, J., Dimitrov, S., Nikolova, N., Mekenyan, O. (2002) Probabilistic
assessment of biodegradability based on metabolic pathways: Catabol system.
SAR QSAR Environ. Res. 2002, 13, 307–323.
Jaworska, J., Boethling, R.S., Howard, P.H. (2003) Recent developments in broadly
applicable structure-biodegradability relationships. Environ. Toxicol. Chem. 22,
1710–1723.
Klasmeier, J., Matthies, M., MacLeod, M., Fenner, K., Scheringer, M., Stroebe, M.,
Le Gall, A.C., McKone, T.E., van de Meent, D., Wania, F. (2006) Application of
Multimedia Models for Screening Assessment of Long-range Transport Potential
and Overall Persistence, Environ. Sci. Technol. 39, 53–60.
Krüger, H.-U., Gavrilov, R., Liu, Q., Zetzsch, C. (2005) Entwicklung eines
Persistenz-Messverfahrens für den troposphärischen Abbau von mittelflüchtigen
Pflanzenschutzmitteln durch OH-Radikale. Umweltbundesamt, Berlin, Germany,
FKZ 201 67 424/02.
Kühne, R., Ebert, R.-U., Schüürmann, G. (in press) Estimation of Compartmental
Half-lives of Organic Compounds – Structural Similarity vs. EPI-Suite. QSAR &
Comb. Sci.
Kwok, E.S.C., Atkinson, R. (1995) Estimation of Hydroxyl Radical Reaction Rate
Constants for Gas-Phase Organic Compounds Using a Structure-Reactivity
Relationship: an Update. Atmos. Environ. 29, 1685–1695.
Mackay, D., Shiu, W.Y., Ma, K.C. (1992) Illustrated Handbook of Physical-Chemical
Properties and Environmental Fate for Organic Chemicals. Vol. I: Monoaromatic

24
Hydrocarbons, Chlorobenzenes, and pcbs; Vol. II: Polynuclear Aromatic
Hydrocarbons, Polychlorinated Dioxins, and Dibenzofurans; Vol. III (1993):
Volatile Organic Chemicals; Vol. IV (1995): Oxygen, Nitrogen, and Sulfur
Containing Compounds; Vol. V (1997): Pesticide Chemicals; CD-ROM 2000,
Lewis Publishers, Boca Raton and New York.
Müller, M. (2005) Study for Validation of QSAR Models for Estimation of
Atmospheric Degradation Based on a Data Set of 768 Substances. Fraunhofer
Institute for Molecular Biology and Applied Ecology, Schmallenberg, Germany.
OECD (1996) OECD Guidelines for the Testing of Chemicals. OECD Paris.
OSPAR (1992) Convention for the Protection of the Marine Environmentof the
North-East Atlantic, OSPAR Commission, London, 1992,
(http://www.ospar.org).
Schenker, U., MacLeod, M., Scheringer, M., Hungerbühler, K. (2005) Improving
Data Quality for Environmental Fate Models: A Least-Squares Adjustment
Procedure for Harmonizing Physicochemical Properties of Organic Compounds,
Environ. Sci. Technol 39, 8434–8441
SETAC (1995) Procedures for Assessing the Environmental Fate and Ecotoxicology
of Pesticides. SETAC-Press, Pensacola, FL, USA.
STEP (2006) Strategies for selecting biodegradation simulation tests and their
interpretation in persistence evaluation and risk assessment. Draft report with
comments of a workshop held in Rotterdam, 4-5 October, 2004.
Stroebe, M., Scheringer, M., Hungerbühler, K. (2004) Measures of Overall
Persistence and the Temporal Remote State, Environ. Sci. Technol. 38, 5665–
5673.
UNECE (1998) Convention on Long-Range Transboundary Air Pollution:Protocol on
Persistent Organic Pollutants, United Nations Economic Commission for Europe,
Geneva, Switzerland, (http://www.unece.org/env/lrtap/pops_h1.htm).
UNEP (2001) Stockholm Convention on Persistent Organic Pollutants, United
Nations Environment Programme, Geneva, Switzerland, (http://www.pops.int).
US EPA (1999) Persistent Bioaccumulative Toxic (PBT) Chemicals, Final Rule.
Federal Register Volume 64, No. 209, Washington D.C., USA,
http://www.epa.gov/fedrgstr/EPA-WASTE/1999/October/Day-29/f28169.htm.
US EPA (2003) PBT Profiler [Online]. Available by Environmental Sciences Center
and US EPA Office of Pollution Prevention and Toxics, www.pbtprofiler.net.
US EPA (2006) EpiSuite (Online)
(http://www.epa.gov/opptintr/exposure/pubs/episuite.htm)
25
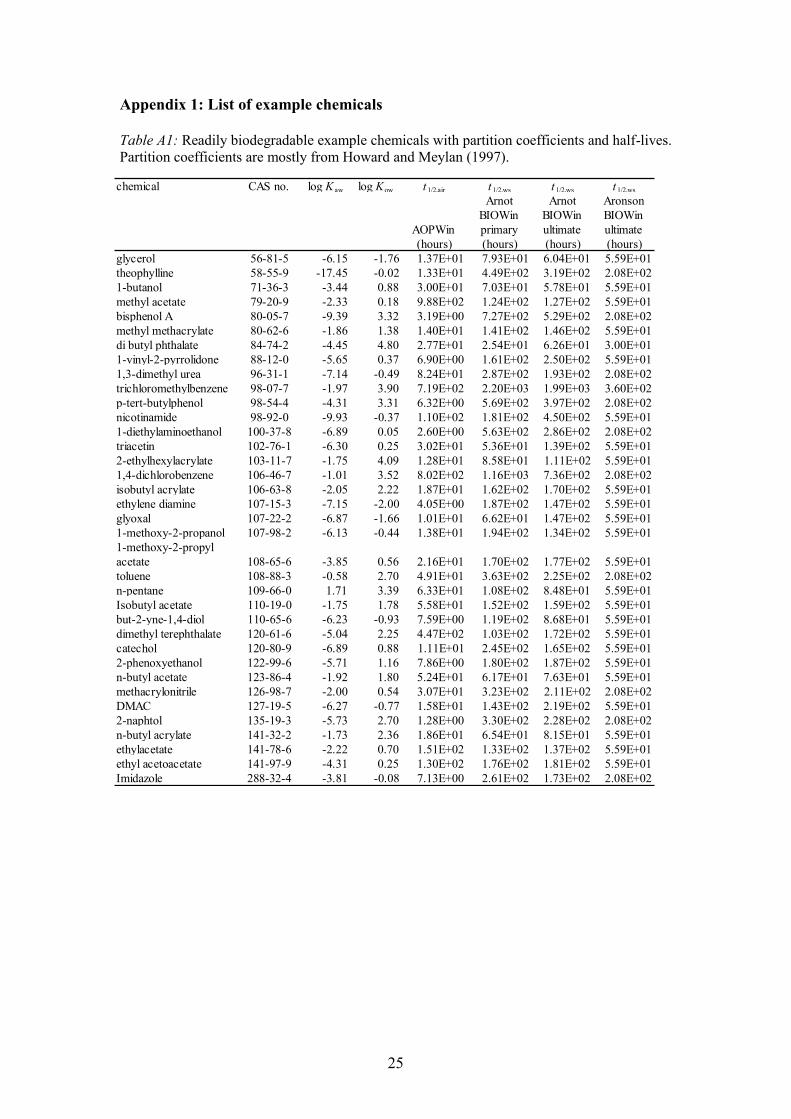
Appendix 1: List of example chemicals
Table A1: Readily biodegradable example chemicals with partition coefficients and half-lives.
Partition coefficients are mostly from Howard and Meylan (1997).
chemical CAS no. log K aw log Kow t 1/2,air t 1/2,ws t 1/2,ws t 1/2,ws
AOPWin
(hours)
Arnot
BIOWin
primary
(hours)
Arnot
BIOWin
ultimate
(hours)
Aronson
BIOWin
ultimate
(hours)
glycerol 56-81-5 -6.15 -1.76 1.37E+01 7.93E+01 6.04E+01 5.59E+01
theophylline 58-55-9 -17.45 -0.02 1.33E+01 4.49E+02 3.19E+02 2.08E+02
1-butanol 71-36-3 -3.44 0.88 3.00E+01 7.03E+01 5.78E+01 5.59E+01
methyl acetate 79-20-9 -2.33 0.18 9.88E+02 1.24E+02 1.27E+02 5.59E+01
bisphenol A 80-05-7 -9.39 3.32 3.19E+00 7.27E+02 5.29E+02 2.08E+02
methyl methacrylate 80-62-6 -1.86 1.38 1.40E+01 1.41E+02 1.46E+02 5.59E+01
di butyl phthalate 84-74-2 -4.45 4.80 2.77E+01 2.54E+01 6.26E+01 3.00E+01
1-vinyl-2-pyrrolidone 88-12-0 -5.65 0.37 6.90E+00 1.61E+02 2.50E+02 5.59E+01
1,3-dimethyl urea 96-31-1 -7.14 -0.49 8.24E+01 2.87E+02 1.93E+02 2.08E+02
trichloromethylbenzene 98-07-7 -1.97 3.90 7.19E+02 2.20E+03 1.99E+03 3.60E+02
p-tert-butylphenol 98-54-4 -4.31 3.31 6.32E+00 5.69E+02 3.97E+02 2.08E+02
nicotinamide 98-92-0 -9.93 -0.37 1.10E+02 1.81E+02 4.50E+02 5.59E+01
1-diethylaminoethanol 100-37-8 -6.89 0.05 2.60E+00 5.63E+02 2.86E+02 2.08E+02
triacetin 102-76-1 -6.30 0.25 3.02E+01 5.36E+01 1.39E+02 5.59E+01
2-ethylhexylacrylate 103-11-7 -1.75 4.09 1.28E+01 8.58E+01 1.11E+02 5.59E+01
1,4-dichlorobenzene 106-46-7 -1.01 3.52 8.02E+02 1.16E+03 7.36E+02 2.08E+02
isobutyl acrylate 106-63-8 -2.05 2.22 1.87E+01 1.62E+02 1.70E+02 5.59E+01
ethylene diamine 107-15-3 -7.15 -2.00 4.05E+00 1.87E+02 1.47E+02 5.59E+01
glyoxal 107-22-2 -6.87 -1.66 1.01E+01 6.62E+01 1.47E+02 5.59E+01
1-methoxy-2-propanol 107-98-2 -6.13 -0.44 1.38E+01 1.94E+02 1.34E+02 5.59E+01
1-methoxy-2-propyl
acetate 108-65-6 -3.85 0.56 2.16E+01 1.70E+02 1.77E+02 5.59E+01
toluene 108-88-3 -0.58 2.70 4.91E+01 3.63E+02 2.25E+02 2.08E+02
n-pentane 109-66-0 1.71 3.39 6.33E+01 1.08E+02 8.48E+01 5.59E+01
Isobutyl acetate 110-19-0 -1.75 1.78 5.58E+01 1.52E+02 1.59E+02 5.59E+01
but-2-yne-1,4-diol 110-65-6 -6.23 -0.93 7.59E+00 1.19E+02 8.68E+01 5.59E+01
dimethyl terephthalate 120-61-6 -5.04 2.25 4.47E+02 1.03E+02 1.72E+02 5.59E+01
catechol 120-80-9 -6.89 0.88 1.11E+01 2.45E+02 1.65E+02 5.59E+01
2-phenoxyethanol 122-99-6 -5.71 1.16 7.86E+00 1.80E+02 1.87E+02 5.59E+01
n-butyl acetate 123-86-4 -1.92 1.80 5.24E+01 6.17E+01 7.63E+01 5.59E+01
methacrylonitrile 126-98-7 -2.00 0.54 3.07E+01 3.23E+02 2.11E+02 2.08E+02
DMAC 127-19-5 -6.27 -0.77 1.58E+01 1.43E+02 2.19E+02 5.59E+01
2-naphtol 135-19-3 -5.73 2.70 1.28E+00 3.30E+02 2.28E+02 2.08E+02
n-butyl acrylate 141-32-2 -1.73 2.36 1.86E+01 6.54E+01 8.15E+01 5.59E+01
ethylacetate 141-78-6 -2.22 0.70 1.51E+02 1.33E+02 1.37E+02 5.59E+01
ethyl acetoacetate 141-97-9 -4.31 0.25 1.30E+02 1.76E+02 1.81E+02 5.59E+01
Imidazole 288-32-4 -3.81 -0.08 7.13E+00 2.61E+02 1.73E+02 2.08E+02
26
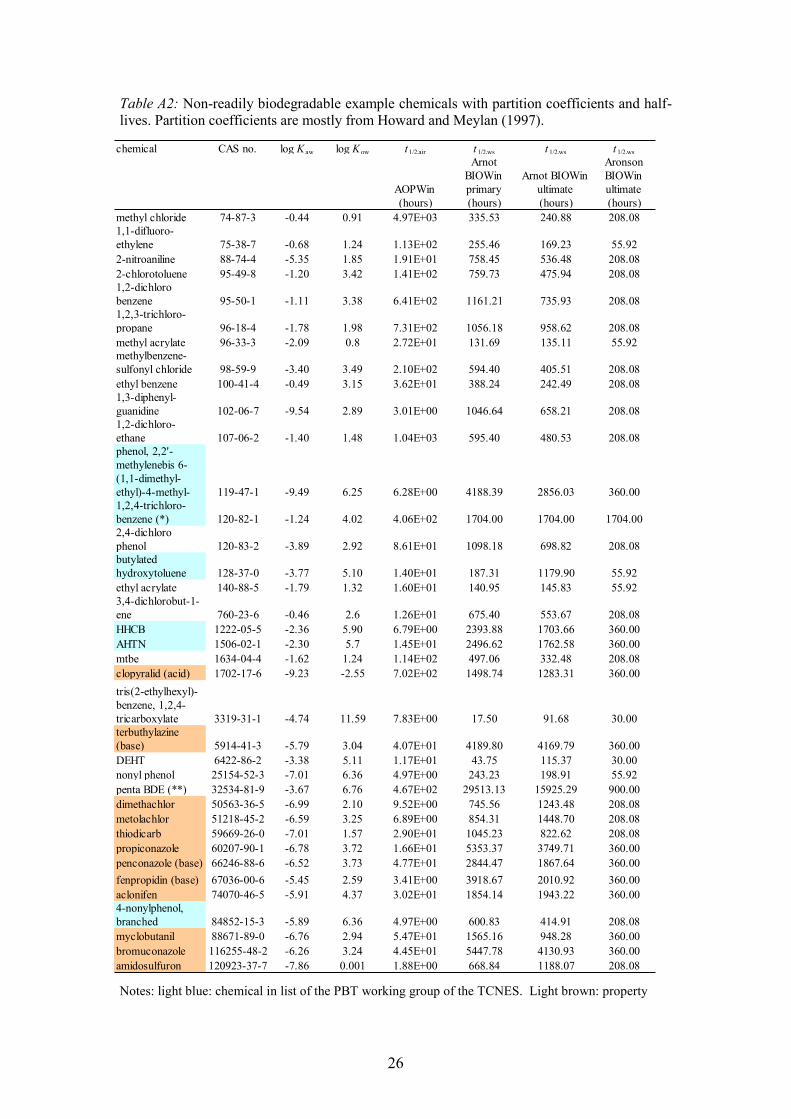
Table A2: Non-readily biodegradable example chemicals with partition coefficients and half-
lives. Partition coefficients are mostly from Howard and Meylan (1997).
Notes: light blue: chemical in list of the PBT working group of the TCNES. Light brown: property
chemical CAS no. log K aw log K ow t 1/2,air t 1/2,ws t 1/2,ws t 1/2,ws
AOPWin
(hours)
Arnot
BIOWin
primary
(hours)
Arnot BIOWin
ultimate
(hours)
Aronson
BIOWin
ultimate
(hours)
methyl chloride 74-87-3 -0.44 0.91 4.97E+03 335.53 240.88 208.08
1,1-difluoro-
ethylene 75-38-7 -0.68 1.24 1.13E+02 255.46 169.23 55.92
2-nitroaniline 88-74-4 -5.35 1.85 1.91E+01 758.45 536.48 208.08
2-chlorotoluene 95-49-8 -1.20 3.42 1.41E+02 759.73 475.94 208.08
1,2-dichloro
benzene 95-50-1 -1.11 3.38 6.41E+02 1161.21 735.93 208.08
1,2,3-trichloro-
propane 96-18-4 -1.78 1.98 7.31E+02 1056.18 958.62 208.08
methyl acrylate 96-33-3 -2.09 0.8 2.72E+01 131.69 135.11 55.92
methylbenzene-
sulfonyl chloride 98-59-9 -3.40 3.49 2.10E+02 594.40 405.51 208.08
ethyl benzene 100-41-4 -0.49 3.15 3.62E+01 388.24 242.49 208.08
1,3-diphenyl-
guanidine 102-06-7 -9.54 2.89 3.01E+00 1046.64 658.21 208.08
1,2-dichloro-
ethane 107-06-2 -1.40 1.48 1.04E+03 595.40 480.53 208.08
phenol, 2,2'-
methylenebis 6-
(1,1-dimethyl-
ethyl)-4-methyl- 119-47-1 -9.49 6.25 6.28E+00 4188.39 2856.03 360.00
1,2,4-trichloro-
benzene (*) 120-82-1 -1.24 4.02 4.06E+02 1704.00 1704.00 1704.00
2,4-dichloro
phenol 120-83-2 -3.89 2.92 8.61E+01 1098.18 698.82 208.08
butylated
hydroxytoluene 128-37-0 -3.77 5.10 1.40E+01 187.31 1179.90 55.92
ethyl acrylate 140-88-5 -1.79 1.32 1.60E+01 140.95 145.83 55.92
3,4-dichlorobut-1-
ene 760-23-6 -0.46 2.6 1.26E+01 675.40 553.67 208.08
HHCB 1222-05-5 -2.36 5.90 6.79E+00 2393.88 1703.66 360.00
AHTN 1506-02-1 -2.30 5.7 1.45E+01 2496.62 1762.58 360.00
mtbe 1634-04-4 -1.62 1.24 1.14E+02 497.06 332.48 208.08
clopyralid (acid) 1702-17-6 -9.23 -2.55 7.02E+02 1498.74 1283.31 360.00
tris(2-ethylhexyl)-
benzene, 1,2,4-
tricarboxylate 3319-31-1 -4.74 11.59 7.83E+00 17.50 91.68 30.00
terbuthylazine
(base) 5914-41-3 -5.79 3.04 4.07E+01 4189.80 4169.79 360.00
DEHT 6422-86-2 -3.38 5.11 1.17E+01 43.75 115.37 30.00
nonyl phenol 25154-52-3 -7.01 6.36 4.97E+00 243.23 198.91 55.92
penta BDE (**) 32534-81-9 -3.67 6.76 4.67E+02 29513.13 15925.29 900.00
dimethachlor 50563-36-5 -6.99 2.10 9.52E+00 745.56 1243.48 208.08
metolachlor 51218-45-2 -6.59 3.25 6.89E+00 854.31 1448.70 208.08
thiodicarb 59669-26-0 -7.01 1.57 2.90E+01 1045.23 822.62 208.08
propiconazole 60207-90-1 -6.78 3.72 1.66E+01 5353.37 3749.71 360.00
penconazole (base) 66246-88-6 -6.52 3.73 4.77E+01 2844.47 1867.64 360.00
fenpropidin (base) 67036-00-6 -5.45 2.59 3.41E+00 3918.67 2010.92 360.00
aclonifen 74070-46-5 -5.91 4.37 3.02E+01 1854.14 1943.22 360.00
4-nonylphenol,
branched 84852-15-3 -5.89 6.36 4.97E+00 600.83 414.91 208.08
myclobutanil 88671-89-0 -6.76 2.94 5.47E+01 1565.16 948.28 360.00
bromuconazole 116255-48-2 -6.26 3.24 4.45E+01 5447.78 4130.93 360.00
amidosulfuron 120923-37-7 -7.86 0.001 1.88E+00 668.84 1188.07 208.08
27
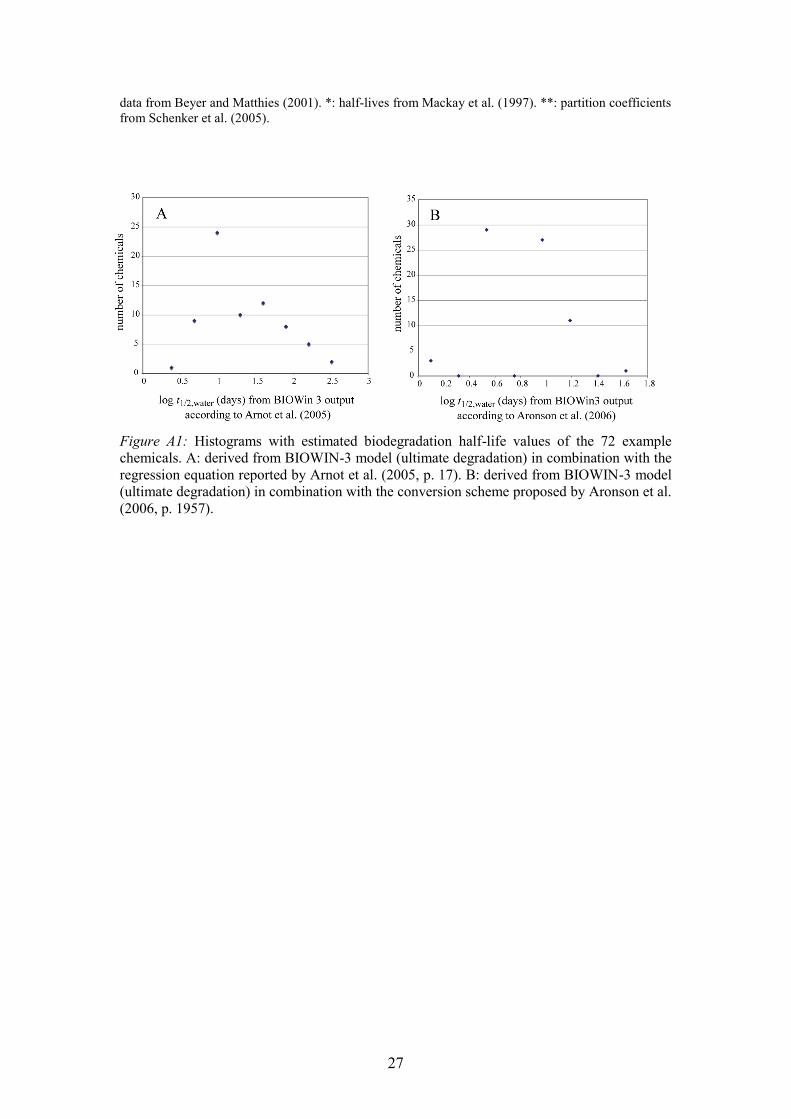
data from Beyer and Matthies (2001). *: half-lives from Mackay et al. (1997). **: partition coefficients
from Schenker et al. (2005).
Figure A1: Histograms with estimated biodegradation half-life values of the 72 example
chemicals. A: derived from BIOWIN-3 model (ultimate degradation) in combination with the
regression equation reported by Arnot et al. (2005, p. 17). B: derived from BIOWIN-3 model
(ultimate degradation) in combination with the conversion scheme proposed by Aronson et al.
(2006, p. 1957).
28
Appendix 2: Determination of Soil Biodegradation Half-lives from Simulation
Tests
Abstract
The current definition of half-life in soil is not appropriate in the context of PBT
assessment as it includes formation of non-extractable residues as a loss process. A
pure degradation half-life DegT50 is therefore defined. A first approach for
determination of this endpoint by inverse modeling is presented. Experimental data
from various soil simulation tests can well be fitted to the model. Several compounds
classified as not persistent with the current definition would be classified as very
persistent based on DegT50 values. An attempt to derivate DegT50 values from tests
for ready biodegradability fails.
Introduction
Persistence is a property of increasing concern in assessment of chemicals. This is
particularly the case in combination with bioaccumulation, as no trustworthy
prediction about exposure is then possible. The current risk assessment approach of
comparing exposure and effect can therefore not be applied to persistent
bioaccumulative substances. Furthermore, long-term effects cannot be excluded
(UBA, 2005).
Consequently, environmental legislation increasingly attends to persistent
compounds, as in the Stockholm Convention limiting or prohibiting the production
and use of certain persistent organic pollutants (UNEP, 2001).
Persistence also plays an essential role in the EU legislation proposal REACH
(Registration, Evaluation and Authorisation of Chemicals (Commission of the
European Communities, 2003)). Within the scope of PBT-assessment, the crucial
parameter for persistence of a chemical is its half-life4 in different compartments. The
threshold value for considering a substance as (very) persistent in soil is 120 d (180
d). The notion of half-life should therefore be defined very carefully, and with regard
to the issue of persistence.
In this article, it is argued that the current notion of half-life (DT50) in soil is
inappropriate in the context of PBT assessment, as it includes formation of non-
extractable residues as a loss process. Instead, a half-life restricted to pure degradation
processes (DegT50) is proposed. First approaches on how to derive this endpoint from
soil simulation tests and tests for ready biodegradability are presented and evaluated.
Non-Extractable Residues
The current approach of DT50 determination refers to the amount of extractable
parent compound in soil. However, considerable unextracted amounts remain in the
soil and are thus regarded as degraded in this approach. The current knowledge about
these non-extractable residues shall therefore be resumed here in order to evaluate
whether or not it is justified to consider NER as degraded.
4 Some authors distinguish between dissipation half-life (first order kinetics) and DT50 (any kinetics).
In this article, both terms are used synonymously, thus adopting the use in REACH.
29
Definition
The International Union of Pure and Applied Chemistry (IUPAC) defines non-
extractable or bound residues (NER) as “chemical species originating from pesticides,
used according to good agricultural practice, that are unextracted by methods which
do not significantly change the chemical nature of these residues” (Kearney, 1982;
Roberts, 1984).
At a DFG workshop in 1996 a modification of this definition was proposed insofar as
they “represent compounds in soils, plants or animals which persist in the matrix in
the form of the parent substance or its metabolite(s) after extraction. The extraction
method must not substantially change the compounds themselves or the structure of
the matrix” (DFG, 1998).
Both definitions are problematic as the nature of the extracted fraction depends
qualitatively and quantitatively on the employed extraction procedure (Craven and
Hoy, 2005). Roberts (1984) therefore stresses that “in each reference to a non-
extractable residue, the extraction procedure must be given”.
The operational definition of NER causes not only a problem due to the different
extraction procedures employed. Additionally, the extractability of a compound is
“not related to any specific parameter, such as bioavailability” (Craven and Hoy,
2005):
On the one hand, the “free”, extractable chemical - however defined - may be
reversibly sorbed to soil particles and consequently be less bioavailable (Gevao et al.,
2000). On the other hand, it has been reported that NER are to some extent
bioavailable to microorganisms, plants, and earthworms (Gevao et al., 2001; Verma
and Pillai, 1991; Khan, 1980; Fuhremann and Lichtenstein, 1978).
A number of authors have proposed to develop a different definition of extractability,
with milder extraction procedures and being more related to environmentally
meaningful measures such as bioavailability (e.g. Craven and Hoy, 2005; Yu et al.,
2005; Reid et al., 2000; Alexander, 2000; Calderbank, 1989). However,
bioavailability has been shown to be species-dependent (e.g. Yu et al., 2005; Reid et
al., 2000; Guerin and Boyd, 1992), so that a single chemical test will never be able to
mimic bioavailability (Reid et al., 2000). Craven and Hoy (2005) propose “to
determine bioavailability for a wide range of organisms and compounds under a
variety of soils and conditions” in order to identify an extraction procedure replicating
bioavailability best in most circumstances, yet keeping some conservatism.
State of the Art
The binding of NER may be the result of covalent binding to soil organic matter
(SOM) or physical entrapment (Barraclough et al., 2005).
NER may consist of the parent compound, or the metabolites/degradation products, or
both, depending on the considered compound (Ostiz and Khan, 1994; Loiseau and
Barriuso, 2002; Dec et al., 1997). Due to the nature of NER, their analytical
characterization remains a very difficult task, as the required powerful extraction
procedures may alter the chemical nature of the compound (Calderbank, 1989). This
step will therefore probably not become a routine step in risk assessment
(Barraclough et al., 2005). Whereas the nature of NER is mostly unknown, “it is […]
generally considered that exposure should be less than that resulting from initial use

30
of a compound, even if all the bound residue was re-mobilised through some
mechanism” (Craven and Hoy, 2005).
It is believed that the primary cause of NER release is the activity of microorganisms.
Further factors include “changes in agricultural practice and the introduction of
certain chemicals that may change the chemistry of the soil” (Gevao et al., 2000).
Barraclough et al. (2005) hypothesize that degradation of the organic matter matrix is
a prerequisite for release of NER, whether entrapped or covalently bond. Release
estimated based on this assumption would be very low even after decades.
Hartlieb et al. (2003) report a decline of pyrene NER in biowaste from 26% of applied
radioactivity after 120 d to 23.8% of applied radioactivity after 370 d. This confirms
Calderbank‟s (1989) view that release of NER is a slow process.
On the other hand, Gevao et al. (2001) report release of considerable amounts (up to
24%) of previously non-extractable pesticides after a 28d-period.
In any case, the long-term risk of NER formed after multiple administration of several
compounds is yet unclear (Barraclough et al., 2005).
Relevance of NER
The regulatory significance of NER is currently discussed and uncertain (Craven and
Hoy, 2005). A great deal of uncertainty is due to the incomplete understanding of the
underlying processes. Many studies detect a decline of bioavailability and toxicity
during aging of pesticides in soil, as summarized in the review of Reid et al. (2000),
but “the extent to which this decline is reversible is still unclear” (Barraclough et al.,
2005).
Barraclough et al. (2005) stress that “the difficulty of hazard identification and the
problems estimating bioavailability” render conventional procedures for risk
assessment inapplicable. “We should [therefore] not be loading soil with chemicals
whose future behavior and toxicity we cannot predict”.
In contrast, Alexander (2000) emphasizes that the currently used harsh extraction
procedures already overestimate bioavailability.
Jones et al. (2000) sum up the double-edged nature of NER assessment:
On the one hand, NER formation may be considered as the first step to deactivation of
the pesticide, finally ending with the complete incorporation in the SOM. On the other
hand, certain bound residues are formed from potentially toxic/biologically active
molecules and persist in soil. Though they are not extractable, they may have long-
term effects on soil fertility, or enter the food chain, or be remobilized.
Since formation of NER renders chemicals less active and less bioavailable, it may be
sufficient in conventional risk assessment to consider NER as degraded, as the
immediate risk emanating from them appears to be marginal.
PBT assessment on the other hand is based on the precautionary principle. Long term
exposure of persistent bioaccumulative substances cannot reliably be estimated, and
long term effects can never be excluded for chemicals with PBT properties.
As NER may consist of the parent compound and may also be released in the long
term, NER in PBT assessment must be considered as undegraded while no further
knowledge about their composition and fate exists. DT50 values are therefore
inappropriate for use in PBT assessment.
31
If DT50 values cannot serve as an endpoint in PBT assessment, an alternative
endpoint is called for. The idea of taking a “pure” degradation half life (DegT50)
including only real degradation processes suggests itself. However, such an endpoint
cannot easily be determined analytically, because NER may consist of metabolites, or
parent compound, or both, and the analytical procedures for their characterization are
too complex to become standard tools.
A straightforward conservative approach would consider all NER as undegraded
parent compound. After addition of the amount of NER to the extractable amount of
parent compound, the degradation rate constant could then be determined by simple
curve-fitting. However, this approach would systematically underestimate the true
degradation.
The authors therefore present a first pragmatic approach to determine rate constants
for primary degradation, formation of NER from the parent compound and formation
of NER from metabolites/degradation products from data of soil simulation tests by
inverse modeling.
The developed model was tested with data from soil simulation tests of 8 different 14
C-labelled pesticides in different soils and conditions.
Development of a Kinetic Model
The underlying model should be complex enough to contain the basic state variables,
but at the same time, it should be kept as simple and general as possible.
Therefore, all processes are assumed to follow first order kinetics. Furthermore, the
compartments parent compound (P), non-extractable residues (N), volatile
degradation products (V), and metabolites/degradation products (M) are considered.
Volatile degradation products can easily be combined to one state variable, as only
small amounts of substances other than CO2 were measured for the considered
compounds. Combining the metabolites to one state variable containing identified and
non-identified degradation products is a way of simplifying the model and of
increasing the comparability of the different compounds.
Volatile degradation products and NER are considered as sinks. In fact, release from
bound residues has been observed (see above), but in most literature reports it does
not play a role for the observed time scales. Direct mineralization of the parent
compound turned out to be an unnecessary pathway for the considered compounds, as
the respective rate constant was mostly 0 and no considerable ameliorations of the fit
were achieved in the other cases. This pathway was therefore eliminated from the
model.
The resulting model structure is shown in Figure 1.
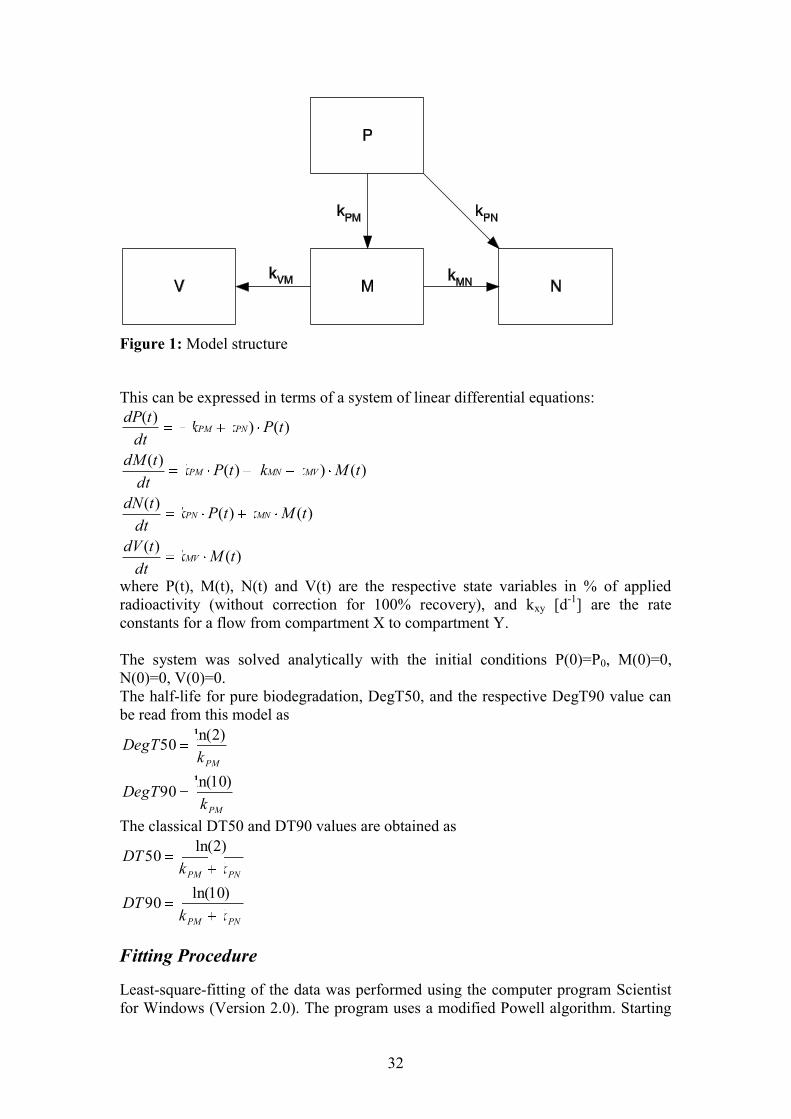
32
Figure 1: Model structure
This can be expressed in terms of a system of linear differential equations:
)()(
)()()(
)()()()(
)()()(
tMkdt
tdV
tMktPkdt
tdN
tMkktPkdt
tdM
tPkkdt
tdP
MV
MNPN
MVMNPM
PNPM
where P(t), M(t), N(t) and V(t) are the respective state variables in % of applied
radioactivity (without correction for 100% recovery), and kxy [d-1
] are the rate
constants for a flow from compartment X to compartment Y.
The system was solved analytically with the initial conditions P(0)=P0, M(0)=0,
N(0)=0, V(0)=0.
The half-life for pure biodegradation, DegT50, and the respective DegT90 value can
be read from this model as
PM
PM
kDegT
kDegT
)10ln(90
)2ln(50
The classical DT50 and DT90 values are obtained as
PNPM
PNPM
kkDT
kkDT
)10ln(90
)2ln(50
Fitting Procedure
Least-square-fitting of the data was performed using the computer program Scientist
for Windows (Version 2.0). The program uses a modified Powell algorithm. Starting
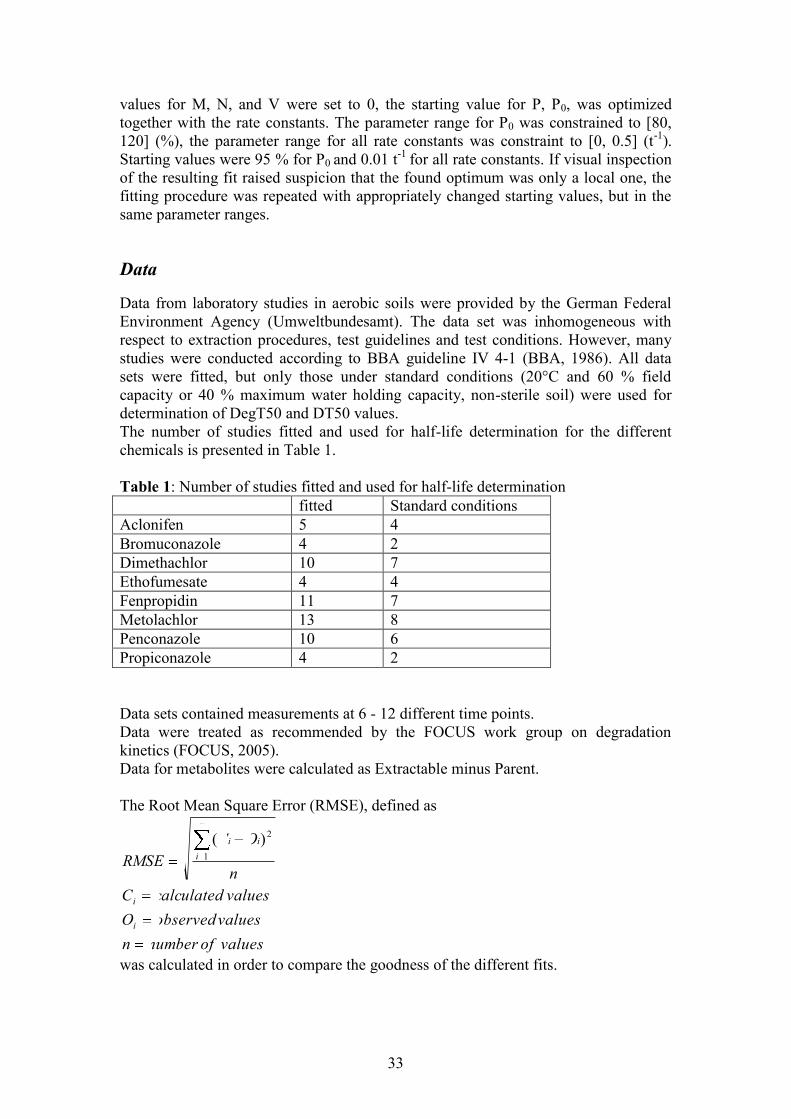
33
values for M, N, and V were set to 0, the starting value for P, P0, was optimized
together with the rate constants. The parameter range for P0 was constrained to [80,
120] (%), the parameter range for all rate constants was constraint to [0, 0.5] (t-1
).
Starting values were 95 % for P0 and 0.01 t-1
for all rate constants. If visual inspection
of the resulting fit raised suspicion that the found optimum was only a local one, the
fitting procedure was repeated with appropriately changed starting values, but in the
same parameter ranges.
Data
Data from laboratory studies in aerobic soils were provided by the German Federal
Environment Agency (Umweltbundesamt). The data set was inhomogeneous with
respect to extraction procedures, test guidelines and test conditions. However, many
studies were conducted according to BBA guideline IV 4-1 (BBA, 1986). All data
sets were fitted, but only those under standard conditions (20°C and 60 % field
capacity or 40 % maximum water holding capacity, non-sterile soil) were used for
determination of DegT50 and DT50 values.
The number of studies fitted and used for half-life determination for the different
chemicals is presented in Table 1.
Table 1: Number of studies fitted and used for half-life determination
fitted Standard conditions
Aclonifen 5 4
Bromuconazole 4 2
Dimethachlor 10 7
Ethofumesate 4 4
Fenpropidin 11 7
Metolachlor 13 8
Penconazole 10 6
Propiconazole 4 2
Data sets contained measurements at 6 - 12 different time points.
Data were treated as recommended by the FOCUS work group on degradation
kinetics (FOCUS, 2005).
Data for metabolites were calculated as Extractable minus Parent.
The Root Mean Square Error (RMSE), defined as
valuesofnumbern
valuesobservedO
valuescalculatedC
n
OC
RMSE
i
i
n
i
ii
1
2)(
was calculated in order to compare the goodness of the different fits.
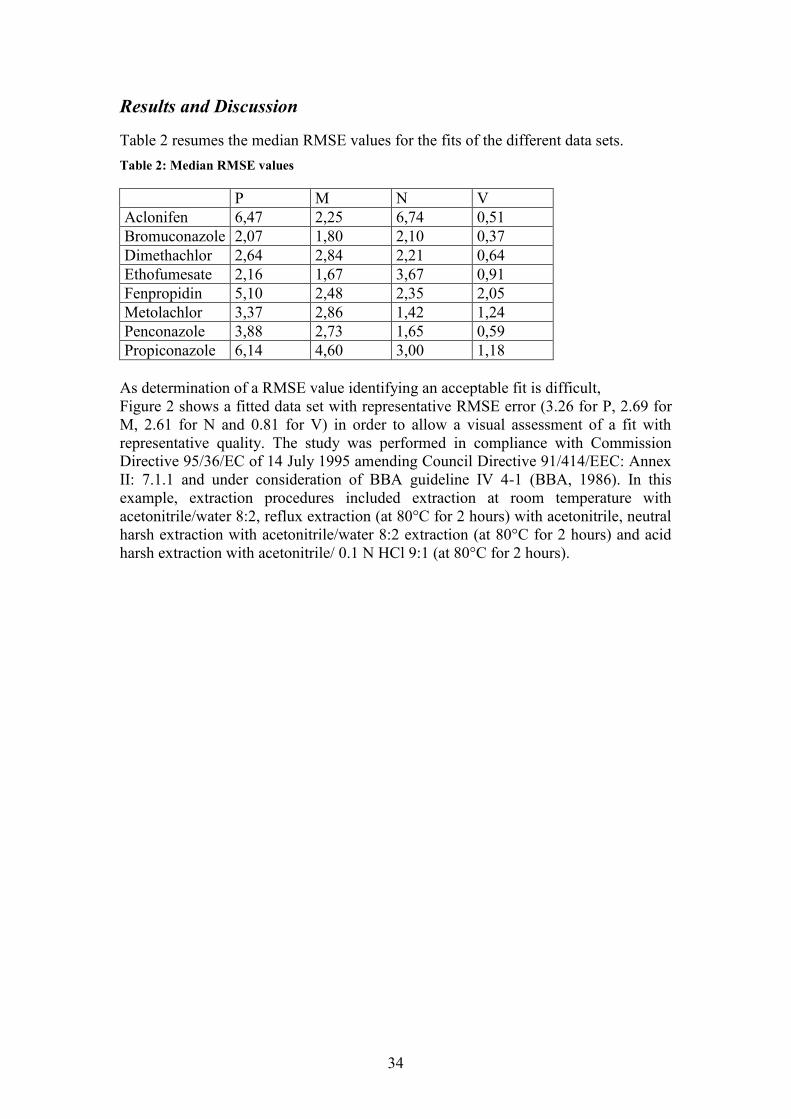
34
Results and Discussion
Table 2 resumes the median RMSE values for the fits of the different data sets.
Table 2: Median RMSE values
P M N V
Aclonifen 6,47 2,25 6,74 0,51
Bromuconazole 2,07 1,80 2,10 0,37
Dimethachlor 2,64 2,84 2,21 0,64
Ethofumesate 2,16 1,67 3,67 0,91
Fenpropidin 5,10 2,48 2,35 2,05
Metolachlor 3,37 2,86 1,42 1,24
Penconazole 3,88 2,73 1,65 0,59
Propiconazole 6,14 4,60 3,00 1,18
As determination of a RMSE value identifying an acceptable fit is difficult,
Figure 2 shows a fitted data set with representative RMSE error (3.26 for P, 2.69 for
M, 2.61 for N and 0.81 for V) in order to allow a visual assessment of a fit with
representative quality. The study was performed in compliance with Commission
Directive 95/36/EC of 14 July 1995 amending Council Directive 91/414/EEC: Annex
II: 7.1.1 and under consideration of BBA guideline IV 4-1 (BBA, 1986). In this
example, extraction procedures included extraction at room temperature with
acetonitrile/water 8:2, reflux extraction (at 80°C for 2 hours) with acetonitrile, neutral
harsh extraction with acetonitrile/water 8:2 extraction (at 80°C for 2 hours) and acid
harsh extraction with acetonitrile/ 0.1 N HCl 9:1 (at 80°C for 2 hours).
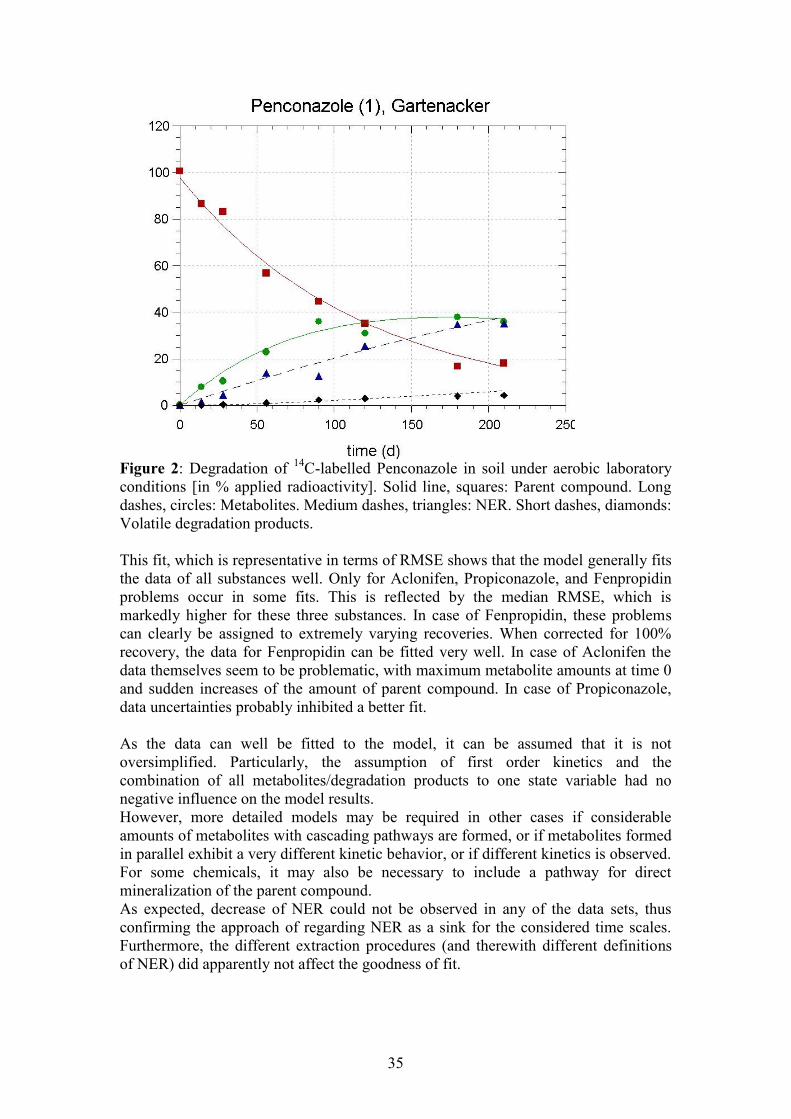
35
Figure 2: Degradation of
14C-labelled Penconazole in soil under aerobic laboratory
conditions [in % applied radioactivity]. Solid line, squares: Parent compound. Long
dashes, circles: Metabolites. Medium dashes, triangles: NER. Short dashes, diamonds:
Volatile degradation products.
This fit, which is representative in terms of RMSE shows that the model generally fits
the data of all substances well. Only for Aclonifen, Propiconazole, and Fenpropidin
problems occur in some fits. This is reflected by the median RMSE, which is
markedly higher for these three substances. In case of Fenpropidin, these problems
can clearly be assigned to extremely varying recoveries. When corrected for 100%
recovery, the data for Fenpropidin can be fitted very well. In case of Aclonifen the
data themselves seem to be problematic, with maximum metabolite amounts at time 0
and sudden increases of the amount of parent compound. In case of Propiconazole,
data uncertainties probably inhibited a better fit.
As the data can well be fitted to the model, it can be assumed that it is not
oversimplified. Particularly, the assumption of first order kinetics and the
combination of all metabolites/degradation products to one state variable had no
negative influence on the model results.
However, more detailed models may be required in other cases if considerable
amounts of metabolites with cascading pathways are formed, or if metabolites formed
in parallel exhibit a very different kinetic behavior, or if different kinetics is observed.
For some chemicals, it may also be necessary to include a pathway for direct
mineralization of the parent compound.
As expected, decrease of NER could not be observed in any of the data sets, thus
confirming the approach of regarding NER as a sink for the considered time scales.
Furthermore, the different extraction procedures (and therewith different definitions
of NER) did apparently not affect the goodness of fit.

36
The DT50 for the study in Figure 2 is 82 d, the DegT50 is 112 d. This exemplifies
that on the one hand substances that are classified as not persistent with the DT50
approach may be considered persistent with the DegT50 approach. On the other hand,
it shows that the formation of relatively large amounts of NER does not necessarily
lead to a greatly increased DegT50. This is particularly visible taking into account
that the conservative approach of considering all NER as parent compound would
result in a DegT50 longer than 210 d.
For a better handling of the results, the median DT50 and DegT50 values from studies
under standard experimental conditions were calculated for the 8 pesticides. If the
number of values was even, the geometric mean of the two median values was
calculated for the rate constants. Median DT50/90 and DegT50/90 values are
summarized in Table 7.
Table 3: Comparison of DegT50/90 and DT50/90 of the eight pesticides
DegT50 [d] DT50 [d] DegT90[d] DT90[d] Deg/DT
Aclonifen 321 79 1068 262 4.1
Bromuconazole 1370 504 4553 1674 2.7
Dimethachlor 10 5 33 18 1.9
Ethofumesate 364 100 1209 331 3.6
Fenpropidin 125 93 415 310 1.3
Metolachlor 24 15 79 51 1.6
Penconazole 229 136 761 453 1.7
Propiconazole 111 87 368 290 1.3
Though the absolute values must be interpreted very carefully, as the experimental
conditions do not correspond to the field conditions, it is obvious that DegT50 values
are often considerably larger than DT50 values. Particularly, the DT50 values of
Aclonifen, Ethofumesate, and Penconazole are below 180d, while their DegT50
values are beyond this threshold defining substances as “very persistent” according to
the REACH legislation proposal.
While DegT50 values can well be estimated with the present model,
the estimation of DegT90 values has to be judged more critically in the case of
Dimethachlor and partly Metolachlor. For these substances, bi-phasic kinetics for the
degradation of the parent compound seem to be more appropriate, as its concentration
is systematically overestimated in the terminal phase. This may result in an
underestimation of the DegT90 values if determined with the present model. For
DegT50 values, this influence is negligible.
Determination of DegT50 Values from Ready-Tests
As soil simulation tests are laborious and time-consuming, it would be tempting to
derive biodegradation rates from less complex tests such as the screening tests for
ready biodegradability (“ready-tests”) defined by the OECD (1996). Since most data
are available for the “modified Sturm test” (OECD 301b test) this test will particularly
be considered here.

37
First investigations by Federle et al. (1997) yielded “almost perfect noncorrelation”
between rates in ready-tests and mineralization rates in activated sludge, river water
and soil. The use of Aronson et al. (2006) for binning chemicals into persistence
categories based on half-life in water was only successful for readily degradable
substances. It shall be investigated here whether the presented DegT50 approach may
lead to a better predictability of half-lives from ready test results.
The chemicals examined in this study are all not readily degradable. Only two of them
show noteworthy degradation in the ready-test at all: Fenpropidin (15.8% at 10 mg/l,
4.7% at 20mg/l after 27d) and Aclonifen (22% at 5 mg/l, 0% at 10 mg/l after 28d). All
other substances are only 0-3% mineralized after 28d.
In order to compare mineralization in the ready-test to mineralization in the soil,
model results for the mineralized amount were determined taking the median rate
constants as parameters and assuming P(0)=100. The mineralized amount after 180 d
was used for comparison.
Degradation was fastest for Fenpropidin (50%) and slowest for Aclonifen (0%).
DegT50 of these two compounds was in the middle of the DegT50 range of the 8
compounds. Degradation of the chemicals showing no mineralization in the ready test
ranged from 3% to 43%. Obviously, no correlation between ready-test result and
mineralization in soil or DegT50 can be established for these 8 compounds. Table 4
summarizes these results.
Table 4: Mineralization in ready-test and soil, and DegT50. Mineralization in soil was
determined with model runs using median rate constants.
Substance Ready-test result
% mineralization in soil
after 180d
Median
DegT50 [d]
Aclonifen
5 mg/l: 22%
10mg/l: 0% 0,0 315
Bromuconazole < 1% 2,6 1386
Propiconazole 0-3% 3,1 110
Penconazole 0% (29d) 4,3 231
Ethofumesate 0% 18,1 365
Metolachlor 0% 28,2 24
Dimethachlor 0% (29d) 43,1 10
Fenpropidin
10 mg/l: 15.8%
20 mg/l: 4.7 % (27d) 50,3 124
These results confirm the finding that no degradation half-lives can be derived from
ready-test results of not readily degradable substances though it may not be
impossible to extrapolate biodegradation rates of chemicals passing the ready-test.
Conclusions and Outlook
The current approach for determination of DT50 of chemicals in soil is not
appropriate for use in PBT assessment as the DT50 considers NER as degraded.
Instead, the use of a true degradation half-life DegT50 is recommended.
Determination of this rate constant by inverse modeling yields good fits thus
suggesting that the model structure is not oversimplified.
38
Application of the DegT50 approach in PBT assessment would result in classifying
several previously non-persistent substances as persistent. Determination of the
DegT50 using tests on ready biodegradation fails. It may however be possible for
readily degrading substances which were not considered in this work.
Adaptations of the model structure may be required in some cases. Examination of
more substances is therefore necessary in order to determine how generally this model
can be applied. Furthermore, soil simulation tests in combination with experimental
determination of the composition of NER for some substances will be required in
order to soundly validate the model.
Literature
Alexander, M. (2000), 'Aging, Bioavailability, and Overestimation of Risk from
Environmental Pollutants', Environ. Sci. Technol. 34, 20.
Aronson, D.; Boethling, R.; Howard, P. & Stiteler, W. (2006), 'Estimating
biodegradation half-lives for use in chemical screening', Chemosphere 63, 1953-1960.
Barraclough, D.; Kearney, T. & Croxford, A. (2005), 'Bound Residues: environmental
solution or future problem?', Environmental Pollution 133, 85-90.
BBA (1986), „Richtlinien für die amtliche Prüfung von Pflanzenschutzmitteln Teil
IV, 4 -1: Verbleib von Pflanzenschutzmitteln im Boden: Abbau, Umwandlung und
Metabolismus. Biologische Bundesanstalt für Land- und Forstwirtschaft,
Bundesrepublik Deutschland.
Beyer, A. and Matthies, M. (2002), „Criteria for Atmospheric Long-range Transport
Potential and Persistence of Pesticides and Industrial Chemicals‟. Bericht 7/02
des Umweltbundesamtes. E.Schmidt-Verlag. Berlin
Calderbank, A. (1989), 'The occurrence and significance of bound residues in soil',
Reviews of Environmental Contamination and Toxicology 108, 72-103.
Craven, A. & Hoy, S. (2005), 'Pesticide persistence and bound residues in soil -
regulatory significance', Environmental Pollution 133, 5-9.
Commission of the European Communities (2003), Proposal for a REGULATION OF
THE EUROPEAN PARLIAMENT AND OF THE COUNCIL concerning the
Registration, Evaluation, Authorisation and Restriction of Chemicals (REACH),
http://europa.eu.int/eur-lex/en/com/pdf/2003/com2003_0644en.html
Dec, J.; Haider, K.; Schaeffer, A.; Fernandes, E. & Bollag, J. (1997), 'Use of a
silylation procedure and 13
C-NMR spectroscopy to characterize bound and
sequestered residues of cyprodinil in soil', Environmental Science and Technology 31,
2991-2997.
ECB (2003), „EUSES – The European Union System for Evaluation of Substances‟,
39
European Chemical Bureau, Ispra.
Federle, T.; Gasior, S. & Nuck, B. (1997), 'Extrapolating mineralization rates from
the ready CO2 screening test to activated sludge, river water, and soil', Environmental
Toxicology and Chemistry 16 (2), 127-134.
FOCUS (2005),'Guidance Document on Estimating Persistence and Degradation
Kinetics from Environmental Fate Studies on Pesticides in EU Registration',
Technical report, FOCUS Work Group on Degradation Kinetics.
DFG, ed. (1998), Pesticide Bound residues in Soil: Workshop, September 3rd-4th
1996, Wiley-VCH.
Fuhremann, T. & Lichtenstein, E. (1978), 'Release of Soil-Bound Methyl
[14
C]Parathion Residues and Their Uptake by Earthworms and Oat Plants', J. Agric.
Food Chem. 26, 605-610.
Gevao, B.; Mourdaunt, C.; Semple, K.; Piearce, T. & Jones, K. (2001),
'Bioavailability of Nonextractable (Bound) Pesticide Residues to Earthworms',
Environ. Sci. Technol. 35, 501-507.
Gevao, B.; Semple, K. & Jones, K. (2000), 'Bound Pesticide residues in soil: a
review', Environmental pollution 108, 3-14.
Guerin, W. & Boyd, S. (1992), 'Differential Bioavailability of Soil-Sorbed
Naphtalene to Two Bacterial Species', Applied and Environmental Microbiology 58
(4), 1142-1152.
Hartlieb, N.; Etrunc, T.; Schaeffer, A. & Klein, W. (2003), 'Mineralization,
metabolism and formation of non-extractable residues of 14C-labelled organic
contaminants during pilot-scale composting of municipal biowaste', Environmental
Pollution 126, 83-91.
Jones, K.; Gevao, B.; Mordaunt, C.; Northcott, G. & Semple, K. (2000), 'Introductory
remarks to the Special Issue', Environmental Pollution 108, 1-2.
Kearney, P. (1982), 'IUPAC pesticide commission report', Journal of the Association
of Official Analytical Chemists 65, 1030-1032.
Khan, S. (1980), 'Plant Uptake of Unextracted (Bound) Residues from an Organic
Soil Treated with Prometryn', J. Agric. Food Chem. 28, 1096-1098.
Loiseau, L. & Barriuso, E. (2002), 'Characterization of the atrazine's bound
(nonextractable) residues using fractionation techniques for soil organic matter',
Environmental Science and Technology 53, 907-912.
OECD (1996),'OECD Guideline for Testing of Chemicals', Technical report, Paris.
Ostiz, S. & Khan, S. (1994), 'Nonextractable (Bound) Residues of Cypermethrin in
Soils', Bull. Environ. Contam. Toxicol. 53, 907-912.
40
Reid, B.; Jones, K. & Semple, K. (2000), 'Bioavailability of persistent organic
pollutants in soils and sediments', Environmental pollution 108, 103-112.
Roberts, T. (1984), 'Non-extractable pesticide residues in soils and plants', Pure and
Applied Chemistry 56, 945-956.
Struijs, J. & van den Berg, R. (1995), 'Standardized biodegradability tests:
Extrapolation to aerobic environments', Water Research 29, 255-262.
UBA (2005), ‟Positionen zu REACH (08.08.2005)‟. Umweltbundesamt Dessau.
http://www.reach-info.de/03_entwicklung/07_1_stoffe/
UBA_Position_PBT_Bewertung_050808.pdf
UNEP (2001), United Nations Environment Programme. Stockholm Convention on
Persistent Organic Pollutants (POPs). http://www.pops.int/
Verma, A. & Pillai, M. (1991), 'Bioavailability of soil-bound residues of DDT and
HCH to earthworms', Current Science (Bangalore) 61, 840-843.
Wolters, A., Klein, M. und Vereecken, H. (2004), „An improved description of
pesticide volatilization: Refinement of the pesticide leaching model (PELMO)‟, J.
Environ. Qual. 33, 1629-1637
Yu, Y.; Wu, X.; Li, S.; Fang, H.; Tan, Y. & Yu, J. (2005), 'Bioavailability of
butachlor and myclobutanil residues in soil to earthworms', Chemosphere 59, 961-
967.
41
Appendix 3: Determination of Biodegradation Half-lives from Water/Sediment
Simulation Tests
In the framework of the registration of pesticides, experiments in standardized water-
sediment test systems are required for substances which are not readily biodegradable.
These experiments are useful to evaluate the dissipation of the substances under
realistic and practice-relevant conditions (BBA, 1990; SETAC, 1995, OECD Nr.
308/309). Experiments are conducted with radio-labeled compounds in cylindrical
vessels containing 2-2.5 cm of natural sediment and 6 cm of water above. Two water-
sediment systems of different origin and with different properties were investigated in
parallel. Active ingredients are spiked onto the surface of the water phase after
allowing the system to acclimate for a certain amount of time. Radioactivity of the
parent compound and of identified metabolites is analyzed separately in water and
sediment over a time period of 90-150 days in regular intervals. Test data are
exploited to estimate DT50 and DT90 values for the disappearance of the active
ingredient from water, from sediment and from the total sediment-water system by
means of regression analysis. However, this analysis does not distinguish the
different processes governing the fate of the compound in the test system. One of the
major drawbacks of the experimental setup is that kinetically limited transport of the
compound from the water phase into the sediment competes with the loss by
biodegradation. Thus, DT50 values for the water phase do not distinguish between
transport and degradation. It must also be pointed out that the experimental setup
allows for settling of suspended solids during the acclimatization phase. Thus, the
microbial biomass in the water phase during the experiment is most likely very low
and biodegradation is negligible in the bulk water phase. In this context, it is not
feasible to assign dissipation times for water to primary degradation of the active
ingredient in water or sediment or both without kinetic modelling.
A compartment model that allows for separate fitting of the kinetic rate constants
for transport and degradation has been used to analyze data from water-sediment tests
for eight pesticides. For all investigated substances, which are resistant against
hydrolysis and stable under UV-light, a satisfying agreement of experimental data and
model results could be achieved with the assumption of no degradation in bulk water.
None of these data sets gave a significantly better fit if degradation in water was
allowed. It is thus not surprising that estimated half-lives for transport from water to
sediment are always very close to the reported DT50 values (water) in the official
documents. However, this finding has very important consequences for the derivation
of degradation rate constants from such experiments. It must be concluded that
biodegradation rates for bulk water cannot be derived from water-sediment tests,
because this process (biodegradation) apparently does not occur under the
experimental conditions of the tests.
On the other hand, this implies that true loss processes largely occur in the
sediment. Abiotic loss processes are generally of minor importance in this
compartment and, thus, biodegradation is most likely responsible for the decrease of
the active ingredient in the sediment. The compartment model allows for estimation
of a first-order degradation rate constant for bulk sediment in each test system. This
rate constant describes the only true removal process in the system. However,
formation of bound residues could not be modeled since only the percentage at the
end of the study has been reported. Percentages of bound residues vary between the
two parallel experiments and tend to be higher for fast than for slowly degradable
pesticides. This supports the assumption that unidentified metabolites are the major
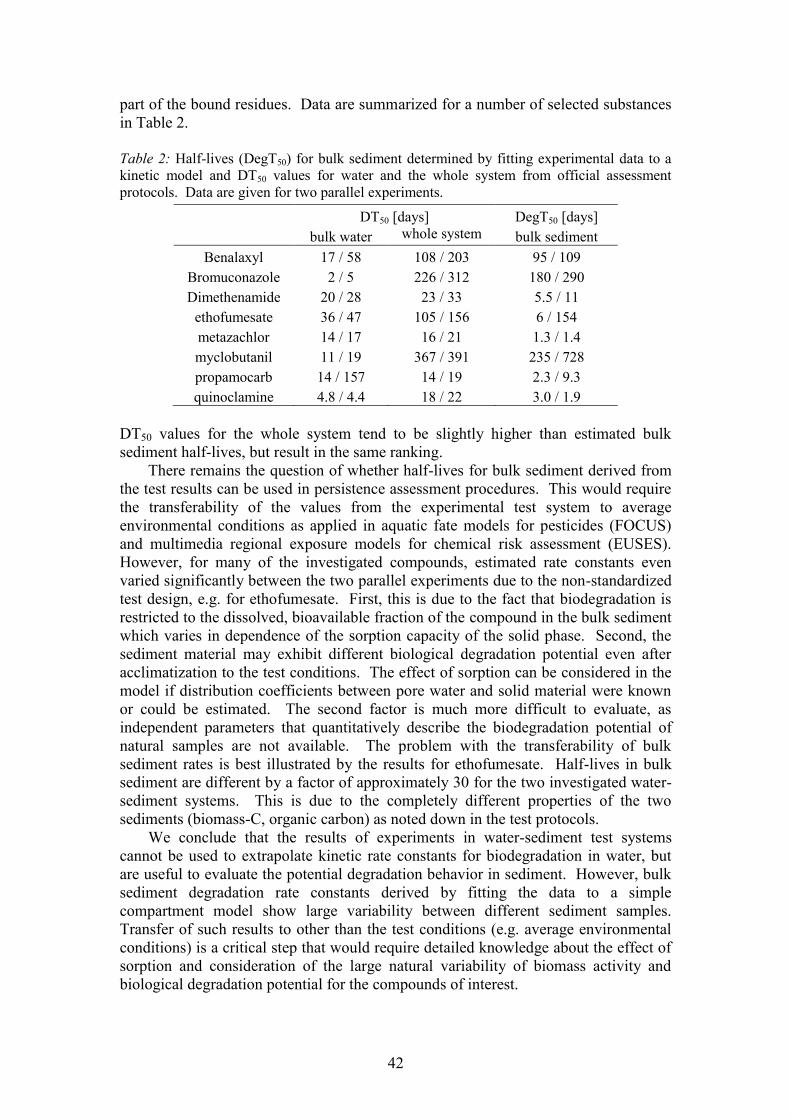
42
part of the bound residues. Data are summarized for a number of selected substances
in Table 2.
Table 2: Half-lives (DegT50) for bulk sediment determined by fitting experimental data to a
kinetic model and DT50 values for water and the whole system from official assessment
protocols. Data are given for two parallel experiments.
DT50 [days] DegT50 [days]
bulk water whole system bulk sediment
Benalaxyl 17 / 58 108 / 203 95 / 109
Bromuconazole 2 / 5 226 / 312 180 / 290
Dimethenamide 20 / 28 23 / 33 5.5 / 11
ethofumesate 36 / 47 105 / 156 6 / 154
metazachlor 14 / 17 16 / 21 1.3 / 1.4
myclobutanil 11 / 19 367 / 391 235 / 728
propamocarb 14 / 157 14 / 19 2.3 / 9.3
quinoclamine 4.8 / 4.4 18 / 22 3.0 / 1.9
DT50 values for the whole system tend to be slightly higher than estimated bulk
sediment half-lives, but result in the same ranking.
There remains the question of whether half-lives for bulk sediment derived from
the test results can be used in persistence assessment procedures. This would require
the transferability of the values from the experimental test system to average
environmental conditions as applied in aquatic fate models for pesticides (FOCUS)
and multimedia regional exposure models for chemical risk assessment (EUSES).
However, for many of the investigated compounds, estimated rate constants even
varied significantly between the two parallel experiments due to the non-standardized
test design, e.g. for ethofumesate. First, this is due to the fact that biodegradation is
restricted to the dissolved, bioavailable fraction of the compound in the bulk sediment
which varies in dependence of the sorption capacity of the solid phase. Second, the
sediment material may exhibit different biological degradation potential even after
acclimatization to the test conditions. The effect of sorption can be considered in the
model if distribution coefficients between pore water and solid material were known
or could be estimated. The second factor is much more difficult to evaluate, as
independent parameters that quantitatively describe the biodegradation potential of
natural samples are not available. The problem with the transferability of bulk
sediment rates is best illustrated by the results for ethofumesate. Half-lives in bulk
sediment are different by a factor of approximately 30 for the two investigated water-
sediment systems. This is due to the completely different properties of the two
sediments (biomass-C, organic carbon) as noted down in the test protocols.
We conclude that the results of experiments in water-sediment test systems
cannot be used to extrapolate kinetic rate constants for biodegradation in water, but
are useful to evaluate the potential degradation behavior in sediment. However, bulk
sediment degradation rate constants derived by fitting the data to a simple
compartment model show large variability between different sediment samples.
Transfer of such results to other than the test conditions (e.g. average environmental
conditions) is a critical step that would require detailed knowledge about the effect of
sorption and consideration of the large natural variability of biomass activity and
biological degradation potential for the compounds of interest.