Embed Size (px)
Citation preview

Persistent Effects of IntensiveGlycemic Control on Retinopathyin Type 2 Diabetes in the Actionto Control Cardiovascular Riskin Diabetes (ACCORD) Follow-OnStudyDiabetes Care 2016;39:1089–1100 | DOI: 10.2337/dc16-0024
OBJECTIVES
This study investigated whether the beneficial effects of intensive glycemic con-trol and fenofibrate treatment of dyslipidemia in reducing retinopathy progres-sion demonstrated in the Action to Control Cardiovascular Risk in Diabetes(ACCORD) Eye Study persisted beyond the clinical trial.
RESEARCH DESIGN AND METHODS
The ACCORD Study (2003–2009) randomized participants with type 2 diabetes tointensive or standard treatment for glycemia (A1C level at <6.0% [42 mmol/mol]vs. 7.0–7.9% [53–63 mmol/mol]), systolic blood pressure (<120 vs. 140 mmHg),and dyslipidemia (fenofibrate [160 mg] plus simvastatin or placebo plus simvas-tatin). ACCORD Eye Study participants, who had baseline and year 4 eye exami-nations and fundus photographs, were reexamined in the ACCORD Follow-On(ACCORDION) Eye Study (2010–2014) 4 years after the ACCORD trial closeout.The outcome measure was diabetic retinopathy progression of three or moresteps on the Early Treatment Diabetic Retinopathy Study scale.
RESULTS
Diabetic retinopathy progressed in 5.8% with intensive glycemic treatment versus12.7% with standard (adjusted odds ratio [aOR] 0.42, 95% CI 0.28–0.63, P <
0.0001), 7.5% with intensive blood pressure treatment versus 6.0% for standard(aOR 1.21, 95% CI 0.61–2.40, P = 0.59), and 11.8% with fenofibrate versus 10.2%with placebo (aOR 1.13, 95% CI 0.71–1.79, P = 0.60) in ACCORDION Eye participants(n = 1,310).
CONCLUSIONS
Prior intensive glycemic control continued to reduce diabetic retinopathy progres-sion, despite similar A1C levels, when the ACCORD Study ended. This is the firststudy in people with type 2 diabetes of 10 years’ duration and established car-diovascular disease, unlike the newly diagnosed participants of the UK Prospec-tive Diabetes Study, to demonstrate this effect. The benefit of fenofibrate,however, did not persist. Intensive blood pressure control had no effect.
Corresponding author: Emily Y. Chew, [email protected].
Received 5 January 2016 and accepted 24February 2016.
Clinical trial reg. no. NCT00000620 for theACCORD study and NCT00542178 for theACCORD Eye study, clinicaltrials.gov.
This article contains Supplementary Data onlineat http://care.diabetesjournals.org/lookup/suppl/doi:10.2337/dc16-0024/-/DC1.
*The ACCORDION Eye Study Group is listed inSupplementary Appendix 1, Section 1, and theACCORDION Study Group is listed in Supplemen-tary Appendix 1, Section 2.
© 2016 by the American Diabetes Association.Readersmayuse this article as longas thework isproperly cited, the use is educational and not forprofit, and the work is not altered.
The Action to Control Cardiovascular Risk
in Diabetes Follow-On (ACCORDION) Eye
Study Group and the Action to Control
Cardiovascular Risk in Diabetes Follow-On
(ACCORDION) Study Group*
Diabetes Care Volume 39, July 2016 1089
DIABETES
CARESYMPOSIU
M
The United Kingdom Prospective Diabe-tes Study (UKPDS) (ISRCTN75451837)demonstrated that intensive glycemiccontrol and intensive blood pressure(BP) control (,150/85 mmHg) slowedthe progression of diabetic retinopathyin people with newly diagnosed type 2diabetes (1,2). The continued beneficialeffects of intensive glycemic control formicrovascular complications were ob-served 10 years after the clinical trial(3). Similarly, the Diabetes Control andComplications Trial (DCCT) showed that;6.5 years of intensive glycemic controlwas effective in reducing the risk of pro-gression of diabetic retinopathy andthat the effect persisted for at least 10years after the trial ended in people withtype 1 diabetes (4). The Fenofibrate Inter-vention and Event Lowering in Diabetes(FIELD) study found that fenofibrate re-duced retinopathy progression in peoplewith type 2 diabetes and additional riskfactors for cardiovascular outcomes (5).For type 1 diabetes, the DCCT showedthat;6.5 years of intensive glycemic con-trol was effective in reducing the risk ofprogression of diabetic retinopathy andthat the effect persisted for at least 10years after the trial ended (4). Most re-cently, theAction toControl CardiovascularRisk in Diabetes (ACCORD) Eye Study dem-onstrated that intensive glycemic controland fenofibrate both reduced retinopathyprogression in people with established
type2diabetes andadditional cardiovascu-lar risk factors, whereas lowering of systolicBP (,120 mmHg) did not affect progres-sion compared with,140 mmHg (6).
After the ACCORD trial was completed,surviving participants who were invitedfor follow-up in the main study and whohad fundus photographs at baseline wereinvited to have additional photographs8 years after randomization. The effects ofa mean of 3.7 years of intensive glycemiccontrol and ;5 years of intensive BP con-trol and/or fenofibrate on the progressionof diabetic retinopathy during 8 yearsof follow-up in the ACCORD Follow-On(ACCORDION) Eye Study are reported here.
RESEARCH DESIGN AND METHODS
ACCORD Study and ACCORD EyeStudyThe designs of the original ACCORD Studyand the ACCORD Eye Study were previ-ously reported (7,8). Briefly, the ACCORDStudy, a randomized trial conducted inthe U.S. and Canada, enrolled 10,251volunteers who had type 2 diabeteswith glycosylated hemoglobin of $7.5%(58 mmol/mol). All participants wererandomized to receive intensive glyce-mic control (targeting glycated hemo-globin level of ,6.0% [42 mmol/mol]) orstandard control (target of 7.0–7.9%[53–63 mmol/mol]). The 5,518 partici-pants with dyslipidemia in the lipid trialwere given simvastatin to lower the level
of LDL cholesterol and were randomly as-signed to fenofibrate (160mg/day), to de-crease triglyceride levels and to increaseHDL cholesterol levels, or to placebo. Theremaining 4,733 participants were ran-domly assigned intensive BP control (target-ing systolic BP of,120 mmHg) or standardtreatment (,140 mmHg). The primaryoutcome was a composite end point oftime until the first occurrence of nonfatalstroke, nonfatal myocardial infarction, ordeath from cardiovascular causes.
The ACCORD Eye Study analyzed asubset of 2,856 participants who hadnot received laser photocoagulation orvitrectomy for proliferative diabetic reti-nopathy and who had baseline and year-4 data. These participants had seven-fieldstereoscopic fundus photographs thatwere assessed using a standard protocolat the University of Wisconsin-MadisonFundus Photograph Reading Center bytrained graders with no knowledge oftreatment assignments. The photographswere graded using an abbreviated andmodified version of the Early TreatmentDiabetic Retinopathy Study (ETDRS) FinalRetinopathy Severity Scale for Persons,which accounts for both eyeswith 17 steps(from 1, which is no retinopathy in eithereye, to 17, which is high-risk proliferativediabetic retinopathy in both eyes) (9).
At each annual ACCORD visit, weasked participants whether they had un-dergone retinal laser photocoagulationor vitrectomy for proliferative diabeticretinopathy. Visual acuity wasmeasuredin the study clinics every 2 years in allACCORD participants using a standardizedvisual acuity chart (ETDRS chart) to assessmoderate vision loss, definedasworseningin either eye by three or more lines on thevisual acuity chart from baseline.
The primary outcome for ACCORD Eyewas a composite of progression of retinop-athy of three steps or more or vitrectomyor laser photocoagulation for proliferativediabetic retinopathy. The primary goal wasto determine whether any of three medi-cal interventions would affect diabetic ret-inopathy progression. The ACCORD Studydemonstrated that both intensive glyce-mic control and fenofibrate, but not in-tensive BP control, reduced retinopathyprogression (6).
ACCORDION Eye StudyThe ACCORDION Eye Study evaluatedACCORD Eye Study participants who hadphotographs at the ACCORD Eye Study
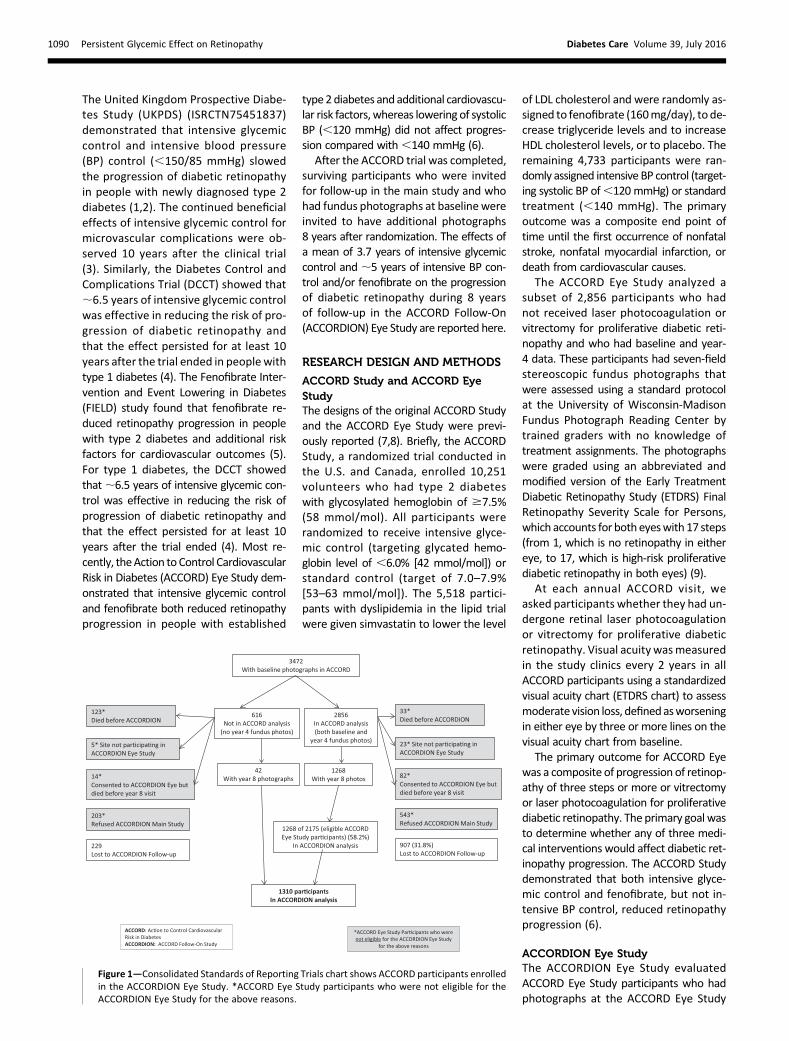
Figure 1—Consolidated Standards of Reporting Trials chart shows ACCORD participants enrolledin the ACCORDION Eye Study. *ACCORD Eye Study participants who were not eligible for theACCORDION Eye Study for the above reasons.
1090 Persistent Glycemic Effect on Retinopathy Diabetes Care Volume 39, July 2016
baseline. The ACCORDION Eye Study ex-amination was;8 years after randomiza-tion and 3 to 5 years after the end of therandomized clinical trial. The8-year exam-ination included stereoscopic fundus pho-tographs, but no additional clinical datawere collected. The primary outcomewas progression of diabetic retinopathyby three or more steps on the ETDRS per-son scale based on fundus photographs atyear 8 compared with baseline. Measure-mentofvisual acuitycontinuedevery2yearsin all participants at the ACCORDION clinics.A secondary outcome was the effect of themedical therapies on moderate visual loss,defined as in ACCORD Eye, three or morelines of vision loss compared with baseline.
Statistical AnalysesComparisons of groups were made usinga two-sample t test, x2 test, or trend test(baseline retinopathy). Separate modelswere used for each of the three primaryhypotheses (glycemic control, lipid con-trol, and BP control). In the ACCORDIONEye Study, the main comparisons weremadeusing likelihood-ratio tests from logis-tic regression models with adjustment forthe same factors used in the ACCORDIONprimary analyses (the trial [lipid vs. BP],the other treatments, prior cardiovascularevents, and the network centers that su-pervised the clinics in each of the localregions). All analyses were based on theintention-to-treatprinciple. Interval-censoredCox proportional hazards models wereused to assess three-step ETDRS progres-sion using data at 0, 4, and 8 years insensitivity analyses. Similar models wereused to test for visual acuity loss in theentire ACCORDION cohort. Finally, mod-els accounting for the competing risk ofdeath were examined (10).We performed 36 protocol-specified
comparisons of subgroups defined on thebasis of cutoff points that had been pre-viously chosen (8) or used in the mainACCORD studies (11–13). Tests of interac-tion of baseline characteristics and othervariables with treatment effect were per-formed by adding the subgroup and theinteraction term to the primary modelsand using a likelihood-ratio test for theinteraction. No adjustment for multiplecomparisons was made. Multiple imputa-tion was used for sensitivity analyses.
RESULTS
Of 2,856 ACCORD participants with base-line and year 4 eye examinations, 543
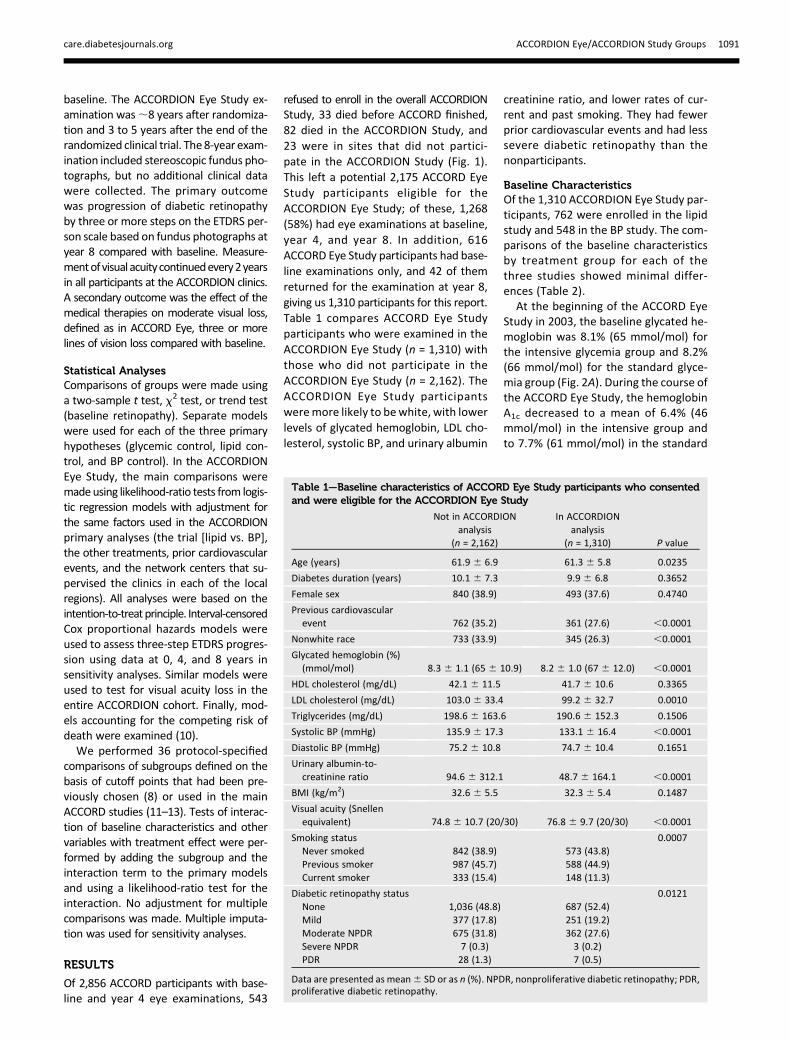
refused to enroll in the overall ACCORDIONStudy, 33 died before ACCORD finished,82 died in the ACCORDION Study, and23 were in sites that did not partici-pate in the ACCORDION Study (Fig. 1).This left a potential 2,175 ACCORD EyeStudy participants eligible for theACCORDION Eye Study; of these, 1,268(58%) had eye examinations at baseline,year 4, and year 8. In addition, 616ACCORD Eye Study participants had base-line examinations only, and 42 of themreturned for the examination at year 8,giving us 1,310 participants for this report.Table 1 compares ACCORD Eye Studyparticipants who were examined in theACCORDION Eye Study (n = 1,310) withthose who did not participate in theACCORDION Eye Study (n = 2,162). TheACCORDION Eye Study participantsweremore likely to bewhite, with lowerlevels of glycated hemoglobin, LDL cho-lesterol, systolic BP, and urinary albumin
creatinine ratio, and lower rates of cur-rent and past smoking. They had fewerprior cardiovascular events and had lesssevere diabetic retinopathy than thenonparticipants.
Baseline CharacteristicsOf the 1,310 ACCORDION Eye Study par-ticipants, 762 were enrolled in the lipidstudy and 548 in the BP study. The com-parisons of the baseline characteristicsby treatment group for each of thethree studies showed minimal differ-ences (Table 2).
At the beginning of the ACCORD EyeStudy in 2003, the baseline glycated he-moglobin was 8.1% (65 mmol/mol) forthe intensive glycemia group and 8.2%(66 mmol/mol) for the standard glyce-mia group (Fig. 2A). During the course ofthe ACCORD Eye Study, the hemoglobinA1c decreased to a mean of 6.4% (46mmol/mol) in the intensive group andto 7.7% (61 mmol/mol) in the standard
Table 1—Baseline characteristics of ACCORD Eye Study participants who consentedand were eligible for the ACCORDION Eye Study
Not in ACCORDIONanalysis
(n = 2,162)
In ACCORDIONanalysis
(n = 1,310) P value
Age (years) 61.9 6 6.9 61.3 6 5.8 0.0235
Diabetes duration (years) 10.1 6 7.3 9.9 6 6.8 0.3652
Female sex 840 (38.9) 493 (37.6) 0.4740
Previous cardiovascularevent 762 (35.2) 361 (27.6) ,0.0001
Nonwhite race 733 (33.9) 345 (26.3) ,0.0001
Glycated hemoglobin (%)(mmol/mol) 8.3 6 1.1 (65 6 10.9) 8.2 6 1.0 (67 6 12.0) ,0.0001
HDL cholesterol (mg/dL) 42.1 6 11.5 41.7 6 10.6 0.3365
LDL cholesterol (mg/dL) 103.0 6 33.4 99.2 6 32.7 0.0010
Triglycerides (mg/dL) 198.6 6 163.6 190.6 6 152.3 0.1506
Systolic BP (mmHg) 135.9 6 17.3 133.1 6 16.4 ,0.0001
Diastolic BP (mmHg) 75.2 6 10.8 74.7 6 10.4 0.1651
Urinary albumin-to-creatinine ratio 94.6 6 312.1 48.7 6 164.1 ,0.0001
BMI (kg/m2) 32.6 6 5.5 32.3 6 5.4 0.1487
Visual acuity (Snellenequivalent) 74.8 6 10.7 (20/30) 76.8 6 9.7 (20/30) ,0.0001
Smoking status 0.0007Never smoked 842 (38.9) 573 (43.8)Previous smoker 987 (45.7) 588 (44.9)Current smoker 333 (15.4) 148 (11.3)
Diabetic retinopathy status 0.0121None 1,036 (48.8) 687 (52.4)Mild 377 (17.8) 251 (19.2)Moderate NPDR 675 (31.8) 362 (27.6)Severe NPDR 7 (0.3) 3 (0.2)PDR 28 (1.3) 7 (0.5)
Data are presented as mean6 SD or as n (%). NPDR, nonproliferative diabetic retinopathy; PDR,proliferative diabetic retinopathy.
care.diabetesjournals.org ACCORDION Eye/ACCORDION Study Groups 1091

Table
2—Base
linech
aracteristicsoftheACCORDIO
NEyeStudyparticipants
ACCORDIONEye
Glycemia
Lipid
BP
Overall
(N=1,310)
Intensive
(n=658)
Stan
dard
(n=652)
Pvalue
Fibrate
plus
simvastatin
(n=399)
Placeb
oplus
simvastatin
(n=363)
Pvalue
Intensive
(n=280)
Stan
dard
(n=268)
Pvalue
Age
(years)
61.3
65.8
61.4
65.9
61.2
65.7
0.51
61.8
65.8
61.1
65.6
0.14
61.3
65.8
61.1
66.1
0.63
Diabetes
duration
(years)
9.96
6.8
9.66
6.7
10.1
66.9
0.18
9.86
6.5
9.46
6.6
0.37
10.5
66.8
10.1
67.3
0.59
Femalesex
493(37.6)
240(36.5)
253(38.8)
0.38
110(27.6)
134(36.9)
0.006
127(45.4)
122(45.5)
0.97
Previous
cardiovascular
even
t361(27.6)
187(28.4)
174(26.7)
0.48
108(27.1)
100(27.5)
0.88
78(27.9)
75(28.0)
0.97
Nonwhiterace
345(26.3)
165(25.1)
180(27.6)
0.30
105(26.3)
96(26.4)
0.97
69(24.6)
75(28.0)
0.37
Glycated
hem
oglobin
(%)
(mmol/mol)
8.26
1.0(666
10.9)
8.16
0.9(656
9.8)
8.26
1.0(666
10.9)
0.08
8.26
1.0(666
10.9)
8.16
0.9(656
9.8)
0.17
8.36
1.0(676
10.9)
8.26
1.0(666
10.9)
0.35
HDLcholesterol
(mg/dL)
41.7
610.6
41.9
611.0
41.4
610.3
0.44
38.2
67.4
38.9
67.6
0.24
46.2
612.5
45.9
612
.80.72
LDLcholesterol
(mg/dL)
99.2
632.7
97.7
632.7
100.7
632.6
0.10
94.9
630.4
96.4
629.8
0.49
106.1
636
.4102.1
634.4
0.19
Triglycerides
(mg/dL)
190.6
6152.3
197.3
6175.0
183.8
6125.1
0.11
186.5
6101.4
182.8
6104.7
0.61
199.1
6167.2
198.5
6232.7
0.97
Systolic
BP(m
mHg)
133.1
616.4
132.7
616.1
133.4
616.7
0.47
129.9
615.6
129.4
616.8
0.66
136.8
615
.9138.6
615.0
0.17
Diastolic
BP(m
mHg)
74.7
610.4
74.7
610.1
74.7
610.6
0.98
73.6
610.0
73.2
610.5
0.54
75.4
610.3
77.4
610
.20.02
Urinaryalbumin-to-
creatinineratio
48.7
6164.1
44.9
6133.5
52.5
6190.1
0.41
44.5
6126.2
58.7
6229.0
0.28
43.9
6133.7
46.3
6134.6
0.84
BMI(kg/m
2)
32.3
65.4
32.4
65.2
32.3
65.6
0.81
32.0
65.4
32.6
65.3
0.17
32.3
65.6
32.4
65.3
0.83
Visualacuity
76.8
69.7
76.7
69.7
76.9
69.6
0.75
76.8
69.8
77.2
69.6
0.56
76.9
69.2
76.1
610
.00.33
Smokingstatus
0.83
0.42
0.98
Never
smoked
573(43.8)
284(43.2)
289(44.4)
164(41.2)
166(45.7)
123(43.9)
120(44.8)
Previoussm
oker
588(44.9)
301(45.7)
287(44.1)
183(46.0)
157(43.3)
128(45.7)
120(44.8)
Curren
tsm
oker
148(11.3)
73(11.1)
75(11.5)
51(12.8)
40(11.0)
29(10.4)
28(10.4)
Diabeticretinopathy
status
0.35
0.32
0.44
None
687(52.4)
350(53.2)
337(51.7)
219(54.9)
191(52.6)
143(51.1)
134(50.0)
Mild
251(19.2)
119(18.1)
132(20.2)
75(18.8)
73(20.1)
51(18.2)
52(19.4)
ModerateNPD
R362(27.6)
186(28.3)
176(27.0)
103(25.8)
98(27.0)
81(28.9)
80(29.9)
Severe
NPD
R3(0.2)
1(0.2)
2(0.3)
1(0.3)
0(0.0)
1(0.4)
1(0.4)
PDR
7(0.5)
2(0.3)
5(0.8)
1(0.3)
1(0.3)
4(1.4)
1(0.4)
NPD
R,n
onproliferativediabeticretinopathy;PD
R,p
roliferativediabeticretinopathy.
1092 Persistent Glycemic Effect on Retinopathy Diabetes Care Volume 39, July 2016

group. Intensive glycemia managementwas stopped in February 2008, after amedian of 3.7 years (IQR 2.7–4.3) of
follow-up due to an increase in all-causemortality (11). Eye study participantscontinued in the trial with the standard
therapy until the end of the study in June2009. The glycated hemoglobins were7.3% (56 mmol/mol) for the intensiveglycemia group and 7.7% (61 mmol/mol)for the standard glycemia group at thebeginning of the ACCORDION Study. Bythe end of ACCORDION, the A1C levelswere similar: 7.8% (62 mmol/mol) and7.9% (63 mmol/mol) for the intensiveand standard treatment groups, respec-tively (P = 0.1) (Fig. 2A).
Similarly, the serum triglyceride levelsin both groups of the study were almostidentical at baseline at 196 mg/dL and194 mg/dL, for the fenofibrate plus sim-vastatin and the placebo plus simvasta-tin groups, respectively. However, thedifference in the serum triglyceridelevels achieved during the course ofACCORD in the two treatment groupswas eliminated during the ACCORDIONStudy when fenofibrate was no longeradministered (Fig. 2B). The difference inthe HDL cholesterol achieved during thestudy also diminished when fenofibratewas stopped (Fig. 2C). Intensive BP man-agement also reduced the systolic and di-astolic BPs compared with the standardBP treatment during the ACCORD Study.Again, this difference was reduced whenthe clinical trial was stopped, althoughsome difference remained (Fig. 2D).
Progression of Diabetic RetinopathyTable 3 reports the results of the pre-viously published data on the effects ofthe medical therapy in ACCORD usingthe composite primary outcome, whichconsisted of three or more steps of pro-gression along the ETDRS scale or vit-rectomy or laser photocoagulation fordiabetic retinopathy. Similar analyseswere repeated for the ACCORD data us-ing the ACCORDION primary outcome ofprogression of three or more steps alongthe ETDRS scale only. The results for thisoutcome were not substantially differentfrom the analyses of the composite out-come, confirming the beneficial effects ofintensive glycemic control and the man-agement of dyslipidemia with fenofibrate(plus simvastatin) on the progression ofdiabetic retinopathy, with adjusted oddsratios (ORs) of 0.61 (P = 0.001) and 0.54(P = 0.002), respectively (Table 3).
Intensive Versus Standard GlycemicTherapy in ACCORDIONAmong the 1,310 participants in theglycemia study, 38 of 658 (5.8%) of theACCORDION participants randomized to
Figure 2—Mean levels for glycosylated hemoglobin A1c (A), triglyceride (B), HDL cholesterol (C),and systolic BP (D) through ACCORD and ACCORDION. Exit, end of ACCORD trial; M, month; Post,postend of ACCORD trial.
care.diabetesjournals.org ACCORDION Eye/ACCORDION Study Groups 1093

intensive glycemic control progressedby three or more steps on the ETDRSscale, and 83 of 652 (12.7%) in the stan-dard treatment group progressed atyear 8. The adjusted OR was 0.42 (95%CI 0.28–0.63, P , 0.0001) (Table 3). Byan interval-censored Cox proportionalhazards model with data for years 4and 8 but including only participantswho had data at year 8, the adjustedhazard ratio (HR) was 0.45 (95% CI0.32–0.64, P, 0.0001) (Table 4). Similaranalyses including all participants withdata at year 4 or year 8 resulted in theadjusted HR of 0.56 (95% CI 0.44–0.71,P , 0.0001), again indicating a benefi-cial effect of intensive glycemic controlcompared with standard care (Table 4).When adjusted for the competing risk ofdeath, the adjusted HR was 0.58 (95% CI0.46–0.73, P, 0.0001) (Table 4). Whenthe analysis was confined to the follow-up period in ACCORDION only, measuringthe change at 8 years from the 4-yearvisit, the adjusted odds ratio (OR) was0.67 (95% CI 0.39–1.14, P = 0.13).
Fenofibrate Plus Simvastatin VersusPlacebo Plus SimvastatinThe rates of diabetic retinopathy progres-sion at year 8 from the beginning ofACCORD were 11.8% (47 of 399) in thefenofibrate group and 10.2% (37 of 363)in the placebo group,with an adjustedORof 1.13 (95%CI 0.71–1.79, P = 0.60) (Table3). Using the Cox proportional hazardsmodel resulted in an adjusted HR of 0.76(95% CI 0.57–1.03, P = 0.08) (Table 4).When adjusted for the competing risk ofdeath, the adjusted HR was 0.83 (95% CI0.69–1.00, P = 0.04) (Table 4).
Intensive Versus Standard BP ControlThe rates of diabetic retinopathy pro-gression were 7.5% (21 of 280) and6.0% (16 of 268) in the intensive andstandard BP groups, respectively, withan adjusted OR of 1.21 (95% CI 0.61–2.40, P = 0.59) (Table 3). Using an inter-val censored Cox proportional hazardsmodel resulted in an adjusted HR of1.05 (95%CI 0.73–1.51, P = 0.79) (Table 4).
Visual Acuity Changes in theACCORDION Eye Study
Moderate Vision Loss
Visual acuity was measured every 2 yearsat the clinical site. Moderate vision losswas defined as three or more lines ofvision loss on a logarithmic visual acuity
Table
3—Theeffectsofmedicaltherapiesonthepro
gressionofdiabeticretinopathyin
theACCORD
andACCORDIO
NStudiesa
ACCORDb
ACCORD(photograp
hicgradingdataonly)c
ACCORDIONd
n/N(%
)Adjusted
OR(95%
CI)
Pvalue
n/N
(%)
Adjusted
OR(95%
CI)
Pvalue
n/N
(%)
Adjusted
OR(95%
CI)
Pvalue
Glycemiatherap
y0.67(0.51–0.87)
0.003
0.61(0.46–
0.82)
0.001
0.42
(0.28–
0.63
),0.0001
Intensive
104/1,429
(7.3)
81/1,418
(5.7)
38/658
(5.8)
Stan
dard
149/1,427(10.4)
126/1,418
(8.9)
83/652
(12.7)
Dyslipidem
iatherap
y0.60(0.42–0.87)
0.006
0.54(0.36–
0.80)
0.002
1.13
(0.71–
1.79
)0.60
Simvastatin/fen
ofibrate
52/806
(6.5)
41/802
(5.1)
47/399
(11.8)
Simvastatin/placebo
80/787
(10.2)
70/781
(9.0)
37/363
(10.2)
Antihypertensive
therap
y1.23(0.84–1.79)
0.29
0.97(0.64–
1.47)
0.88
1.21
(0.61–
2.40
)0.59
Intensive
67/647
(10.4)
48/640
(7.5)
21/280
(7.5)
Stan
dard
54/616
(8.8)
48/613
(7.8)
16/268
(6.0)
aResultsoflikelihood-ratio
testsfrom
logisticregressionmodels.
bPreviouslyreported
composite
outcome:
progressionof3ormore
step
sontheETDRSseverity
scaleofdiabeticretinopathy,vitrectomy,
orphotocoagulationforthetreatm
entofproliferativediabeticretinopathy.
c Outcomeconsistsonlyoftheprogressionof3ormore
step
sontheETDRSscalefortheclassificationofdiabeticretinopathy.
dAt8years,photograp
hicgrad
ingdataonly.
1094 Persistent Glycemic Effect on Retinopathy Diabetes Care Volume 39, July 2016
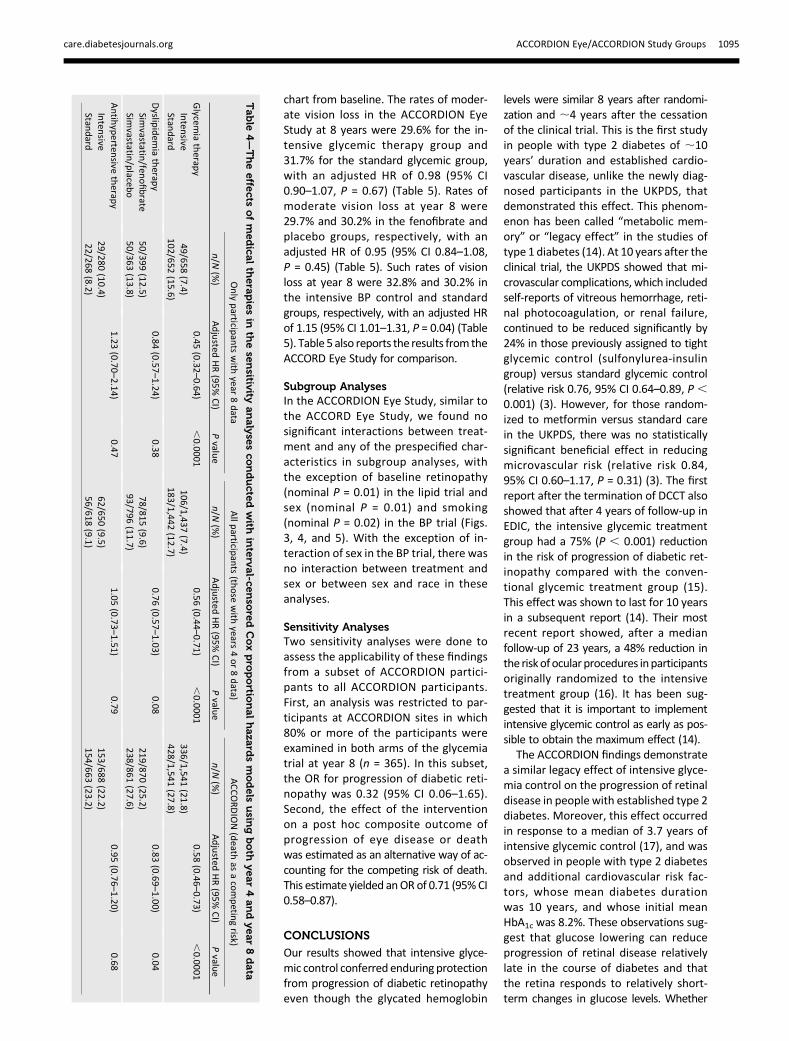
chart from baseline. The rates of moder-ate vision loss in the ACCORDION EyeStudy at 8 years were 29.6% for the in-tensive glycemic therapy group and31.7% for the standard glycemic group,with an adjusted HR of 0.98 (95% CI0.90–1.07, P = 0.67) (Table 5). Rates ofmoderate vision loss at year 8 were29.7% and 30.2% in the fenofibrate andplacebo groups, respectively, with anadjusted HR of 0.95 (95% CI 0.84–1.08,P = 0.45) (Table 5). Such rates of visionloss at year 8 were 32.8% and 30.2% inthe intensive BP control and standardgroups, respectively, with an adjusted HRof 1.15 (95% CI 1.01–1.31, P = 0.04) (Table5). Table 5 also reports the results from theACCORD Eye Study for comparison.
Subgroup AnalysesIn the ACCORDION Eye Study, similar tothe ACCORD Eye Study, we found nosignificant interactions between treat-ment and any of the prespecified char-acteristics in subgroup analyses, withthe exception of baseline retinopathy(nominal P = 0.01) in the lipid trial andsex (nominal P = 0.01) and smoking(nominal P = 0.02) in the BP trial (Figs.3, 4, and 5). With the exception of in-teraction of sex in the BP trial, there wasno interaction between treatment andsex or between sex and race in theseanalyses.
Sensitivity AnalysesTwo sensitivity analyses were done toassess the applicability of these findingsfrom a subset of ACCORDION partici-pants to all ACCORDION participants.First, an analysis was restricted to par-ticipants at ACCORDION sites in which80% or more of the participants wereexamined in both arms of the glycemiatrial at year 8 (n = 365). In this subset,the OR for progression of diabetic reti-nopathy was 0.32 (95% CI 0.06–1.65).Second, the effect of the interventionon a post hoc composite outcome ofprogression of eye disease or deathwas estimated as an alternative way of ac-counting for the competing risk of death.This estimate yielded anORof 0.71 (95%CI0.58–0.87).
CONCLUSIONS
Our results showed that intensive glyce-mic control conferred enduring protectionfrom progression of diabetic retinopathyeven though the glycated hemoglobin
levels were similar 8 years after randomi-zation and ;4 years after the cessationof the clinical trial. This is the first studyin people with type 2 diabetes of ;10years’ duration and established cardio-vascular disease, unlike the newly diag-nosed participants in the UKPDS, thatdemonstrated this effect. This phenom-enon has been called “metabolic mem-ory” or “legacy effect” in the studies oftype 1 diabetes (14). At 10 years after theclinical trial, the UKPDS showed that mi-crovascular complications, which includedself-reports of vitreous hemorrhage, reti-nal photocoagulation, or renal failure,continued to be reduced significantly by24% in those previously assigned to tightglycemic control (sulfonylurea-insulingroup) versus standard glycemic control(relative risk 0.76, 95% CI 0.64–0.89, P ,0.001) (3). However, for those random-ized to metformin versus standard carein the UKPDS, there was no statisticallysignificant beneficial effect in reducingmicrovascular risk (relative risk 0.84,95% CI 0.60–1.17, P = 0.31) (3). The firstreport after the termination of DCCT alsoshowed that after 4 years of follow-up inEDIC, the intensive glycemic treatmentgroup had a 75% (P , 0.001) reductionin the risk of progression of diabetic ret-inopathy compared with the conven-tional glycemic treatment group (15).This effect was shown to last for 10 yearsin a subsequent report (14). Their mostrecent report showed, after a medianfollow-up of 23 years, a 48% reduction inthe riskofocular procedures inparticipantsoriginally randomized to the intensivetreatment group (16). It has been sug-gested that it is important to implementintensive glycemic control as early as pos-sible to obtain the maximum effect (14).
The ACCORDION findings demonstratea similar legacy effect of intensive glyce-mia control on the progression of retinaldisease in people with established type 2diabetes. Moreover, this effect occurredin response to a median of 3.7 years ofintensive glycemic control (17), and wasobserved in people with type 2 diabetesand additional cardiovascular risk fac-tors, whose mean diabetes durationwas 10 years, and whose initial meanHbA1c was 8.2%. These observations sug-gest that glucose lowering can reduceprogression of retinal disease relativelylate in the course of diabetes and thatthe retina responds to relatively short-term changes in glucose levels. Whether
Table
4—Theeffe
ctsofmedica
lth
erapiesin
these
nsitivity
analyse
sco
nducte
dwith
interval-ce
nso
redCoxpro
portio
nalhaza
rdsmodels
usin
gboth
year4andyear8data
Onlyparticip
antswith
year8data
Allp
articipan
ts(th
ose
with
years4or8data)
ACCORDION(death
asacompetin
grisk)
n/N
(%)
Adjusted
HR(95%
CI)
Pvalu
en/N
(%)
Adjusted
HR(95%
CI)
Pvalu
en/N
(%)
Adjusted
HR(95%
CI)
Pvalu
e
Glycem
iatherap
y0.45
(0.32–0.64)
,0.0001
0.56(0.44
–0.71),0.0001
0.58(0.46
–0.73),0.0001
Inten
sive49/658
(7.4)106/1,437
(7.4)336/1,541
(21.8)Stan
dard
102/652(15.6)
183/1,442(12.7)
428/1,541(27.8)
Dyslip
idem
iatherap
y0.84
(0.57–1.24)
0.380.76
(0.57–1.03)
0.080.83
(0.69–1.00)
0.04Sim
vastatin/fen
ofibrate
50/399(12.5)
78/815(9.6)
219/870(25.2)
Simvastatin
/placeb
o50/363
(13.8)93/796
(11.7)238/861
(27.6)
Antih
yperten
sivetherap
y1.23
(0.70–2.14)
0.471.05
(0.73–1.51)
0.790.95
(0.76–1.20)
0.68Inten
sive29/280
(10.4)62/650
(9.5)153/688
(22.2)Stan
dard
22/268(8.2)
56/618(9.1)
154/663(23.2)
care.diabetesjournals.org ACCORDION Eye/ACCORDION Study Groups 1095

an even shorter period of glucose loweringcould achieve a similar long-term effect onthe eyes in either type 2 or type 1 diabetesremains unknown.
Combination therapy with fenofi-brate plus simvastatin versus placeboplus simvastatin in the ACCORDEye Studyresulted in beneficial effects. However,
when the fenofibrate therapy was dis-continued after the ACCORD trial wasstopped, the differences in the levels oftriglycerides and HDL cholesterol were
Figure 3—Subgroup effects in the ACCORDION participants previously randomized in the glycemia trial. The estimated ORs for progression ofdiabetic retinopathy are indicated as squares (with the area proportional to the sample size). The vertical line is the overall treatment effect. Datawere missing for some patients in some subgroups. The comparison between the subgroup enrolled in the ACCORDION lipid trial and the subgroupenrolled in the ACCORDION BP trial was not specified within the protocol. Race was self-reported. The BMI is the weight in kilograms divided by thesquare of the height in meters. A logarithmic scale is used on the x axis.
Table 5—The effects of medical therapies in ACCORD and ACCORDION on visual acuity: The results of the proportionalhazard modeling for moderate visual lossa
Treatment
Original ACCORD ACCORDIONb
n/N (%) Adjusted HR (95% CI) P value n/N (%) Adjusted HR (95% CI) P value
Glycemia therapy 0.88 (0.77–1.01) 0.06 0.98 (0.90–1.07) 0.67
Intensive 409/1,715 (23.8) 508/1,715 (29.6)
Standard 457/1,737 (26.3) 551/1,737 (31.7)
Dyslipidemia therapy 0.95 (0.79–1.14) 0.57 0.95 (0.84–1.08) 0.45
Simvastatin and fenofibrate 227/956 (23.7) 284/956 (29.7)
Simvastatin and placebo 233/950 (24.5) 287/950 (30.2)
Antihypertensive therapy 1.17 (0.96–1.42) 0.12 1.15 (1.01–1.31) 0.04
Intensive 221/798 (27.7) 262/798 (32.8)
Standard 185/748 (24.7) 226/748 (30.2)
aModerate vision loss: three or more lines of visual loss compared with baseline. bParticipants who were examined in ACCORDION and had visualacuity assessments at their study/medical center.
1096 Persistent Glycemic Effect on Retinopathy Diabetes Care Volume 39, July 2016
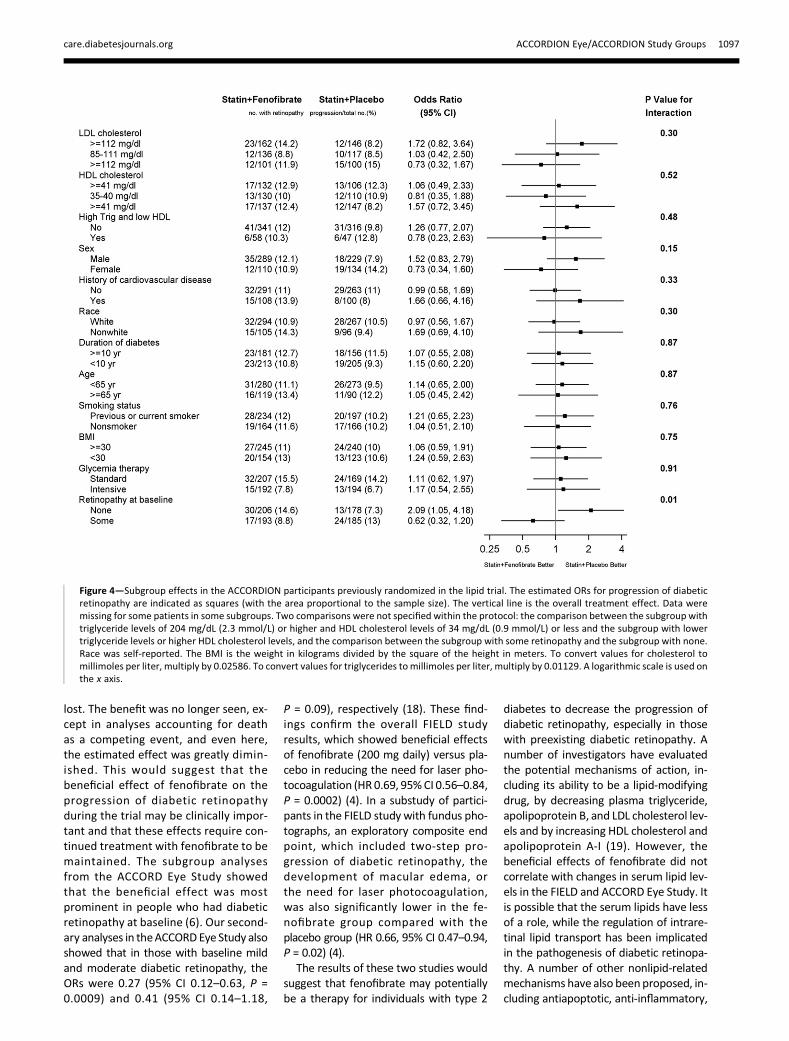
lost. The benefit was no longer seen, ex-cept in analyses accounting for deathas a competing event, and even here,the estimated effect was greatly dimin-ished. This would suggest that thebeneficial effect of fenofibrate on theprogression of diabetic retinopathyduring the trial may be clinically impor-tant and that these effects require con-tinued treatment with fenofibrate to bemaintained. The subgroup analysesfrom the ACCORD Eye Study showedthat the beneficial effect was mostprominent in people who had diabeticretinopathy at baseline (6). Our second-ary analyses in theACCORDEye Study alsoshowed that in those with baseline mildand moderate diabetic retinopathy, theORs were 0.27 (95% CI 0.12–0.63, P =0.0009) and 0.41 (95% CI 0.14–1.18,
P = 0.09), respectively (18). These find-ings confirm the overall FIELD studyresults, which showed beneficial effectsof fenofibrate (200 mg daily) versus pla-cebo in reducing the need for laser pho-tocoagulation (HR0.69, 95%CI 0.56–0.84,P = 0.0002) (4). In a substudy of partici-pants in the FIELD study with fundus pho-tographs, an exploratory composite endpoint, which included two-step pro-gression of diabetic retinopathy, thedevelopment of macular edema, orthe need for laser photocoagulation,was also significantly lower in the fe-nofibrate group compared with theplacebo group (HR 0.66, 95% CI 0.47–0.94,P = 0.02) (4).
The results of these two studies wouldsuggest that fenofibrate may potentiallybe a therapy for individuals with type 2
diabetes to decrease the progression ofdiabetic retinopathy, especially in thosewith preexisting diabetic retinopathy. Anumber of investigators have evaluatedthe potential mechanisms of action, in-cluding its ability to be a lipid-modifyingdrug, by decreasing plasma triglyceride,apolipoprotein B, and LDL cholesterol lev-els and by increasing HDL cholesterol andapolipoprotein A-I (19). However, thebeneficial effects of fenofibrate did notcorrelate with changes in serum lipid lev-els in the FIELD and ACCORD Eye Study. Itis possible that the serum lipids have lessof a role, while the regulation of intrare-tinal lipid transport has been implicatedin the pathogenesis of diabetic retinopa-thy. A number of other nonlipid-relatedmechanisms have also beenproposed, in-cluding antiapoptotic, anti-inflammatory,
Figure 4—Subgroup effects in the ACCORDION participants previously randomized in the lipid trial. The estimated ORs for progression of diabeticretinopathy are indicated as squares (with the area proportional to the sample size). The vertical line is the overall treatment effect. Data weremissing for some patients in some subgroups. Two comparisons were not specified within the protocol: the comparison between the subgroup withtriglyceride levels of 204 mg/dL (2.3 mmol/L) or higher and HDL cholesterol levels of 34 mg/dL (0.9 mmol/L) or less and the subgroup with lowertriglyceride levels or higher HDL cholesterol levels, and the comparison between the subgroup with some retinopathy and the subgroup with none.Race was self-reported. The BMI is the weight in kilograms divided by the square of the height in meters. To convert values for cholesterol tomillimoles per liter, multiply by 0.02586. To convert values for triglycerides tomillimoles per liter, multiply by 0.01129. A logarithmic scale is used onthe x axis.
care.diabetesjournals.org ACCORDION Eye/ACCORDION Study Groups 1097

antioxidant, and antiangiogenic actions.There are also thoughts that fenofibrate,a peroxisome proliferator–activated re-ceptor a agonist, may also impart neuro-protective effects and provide protectionfrom the breakdown of the blood-retinalbarrier (20).Because fenofibrate failed to have an
effect on cardiovascular events in ACCORDandFIELD, it is not routinely prescribed forthe management of dyslipidemia bymedical physicians. Ophthalmologistsrarely prescribe medical therapies di-rected at other organ systems, but inthis instance, it is important for bothophthalmologists and medical physi-cians to collaborate and to reconsiderthe role of fenofibrate for the treatmentof diabetic retinopathy, especially inthose who already exhibit some degreeof diabetic retinopathy (21).We did not demonstrate an effect of
intensive BP control on the progression
of diabetic retinopathy at 4 or 8 years. Incontrast, the UKPDS showed that inten-sive BP control (,150 vs. ,180 mmHg)resulted in a significant reduction in theprogression of diabetic retinopathy(34.0% vs. 51.3%, P = 0.004) and moder-ate vision loss (10.2% vs. 19.4%, P = 0.004)after 7.5 years (2).
That the reduction in the progres-sion of diabetic retinopathy did not af-fect the rates of moderate visual lossis not surprising. This was also seen inthe ACCORD Eye Study. To show a dif-ference in visual acuity, a much largersample size would be required becausethe treatments for diabetic retino-pathy are highly effective in reducingsevere vision loss by as much as 95%(22).
Limitations in the ACCORDION EyeStudy include the low recruitment rateof ACCORD Eye participants (nearly 60%of those eligible from the ACCORD Eye
cohort) and that the participants inACCORDION Eye tended to be healthierand younger, with lower baseline gly-cated hemoglobin, fewer previous car-diovascular events, and less severediabetic retinopathy. However, oursensitivity analyses showed that thepoint estimate of 0.32 from the ad-justed OR of the participants whowere enrolled in clinics, in which 80%of the participants returned for thefollow-up study at year 8, was similarto the overall adjusted OR of 0.42. Theeffect of the intervention on a post hoccomposite outcome of progression ofeye disease or death was estimated asan alternative way of accounting forthe competing risk of death. This esti-mate yielded an OR of 0.71 (95% CI0.58–0.87). The point estimates ofthe clinics with a high yield of returnparticipants in ACCORDION were verysimilar to the overall results from
Figure 5—Subgroup effects in the ACCORDION participants previously randomized in the BP trial. The estimated ORs for progression of diabeticretinopathy are indicated as squares (with the area proportional to the sample size). The vertical line is the overall treatment effect. Data weremissing for some patients in some subgroups. The last four comparisons shown in the figure were not specified in the protocol. Race was self-reported. The BMI is the weight in kilograms divided by the square of the height in meters. A logarithmic scale is used on the x axis.
1098 Persistent Glycemic Effect on Retinopathy Diabetes Care Volume 39, July 2016

ACCORDION Eye, suggesting that theseresults from the subset of ACCORDIONEye Study participants may indeed beapplicable to the ACCORDION Studypopulation.Another limitation of our study was
that data on retinopathy outcomeswere collected only once during this fol-low-up study. Although some studiessuch as the DCCT collected annual pro-gression rates, it is important to notethat progression in diabetic retinopathywas evaluated during 3-year intervals inthe UKPDS, a study of individuals withtype 2 diabetes. We also found no evi-dence of significant differences in miss-ing data rates, and the results of thesensitivity analyses supported the re-sults of the primary analyses.In summary, our study results pro-
vide evidence that intensive glycemiccontrol is beneficial for reducing theprogression of diabetic retinopathyand that the legacy effect is evident inpeople with type 2 diabetes. ACCORDpreviously reported that 3.7 years ofintensive glycemic control reducedprogression of albuminuria as well asneuropathy during the treatment pe-riod and at 1.3 years after cessation oftreatment (23). The addition of theACCORDION retinal results to theseprior findings demonstrates a posttreat-ment benefit of intensive glycemia con-trol on the progression of eye, kidney,and nerve disease. There is also evidencethat the beneficial effect of fenofibrateon diabetic retinopathy in the ACCORDEye Study may be real but requires con-tinued use of this treatment to maintainbenefit. Therefore, it may be importantto reconsider the use of fenofibrate forthe treatment of diabetic retinopathy.Finally, systolic BP control to the levelsof 140 mmHg or 120 mmHg had noharmful or beneficial effect in both theACCORD Eye Study and the ACCORDIONEye Study.
Acknowledgments. Members of the ACCORDData and SafetyMonitoring Board were AntonioM. Gotto, Jr. (Chair), Kent Bailey, DorothyGohdes, Steven Haffner, Roland Hiss, KennethJamerson, Kerry Lee, David Nathan, JamesSowers, and LeRoy Walters. Members of theACCORDION Observational Study MonitoringBoard were Barbara V. Howard (Chair), Kent R.Bailey, Richard Hamman,William Herman, KennethA. Jamerson, David M. Nathan, and Alan Shuldiner.Funding. ACCORD was supported by NationalHeart, Lung, and Blood Institute contracts
N01-HC-95178, N01-HC-95179, N01-HC-95180,N01-HC-95181, N01-HC-95182, N01-HC-95183,N01-HC-95184, IAA #Y1-HC-9035, and IAA#Y1-HC-1010. Other components of the NationalInstitutes of Health, including the National In-stitute of Diabetes and Digestive and KidneyDiseases, the National Institute on Aging, andthe National Eye Institute, contributed funding.The Centers for Disease Control and Preventionfunded substudies within ACCORD on cost-effectiveness and health-related quality of life.General Clinical Research Centers provide sup-port at many sites. ACCORDION activities weresupported by National Heart, Lung, and BloodInstitute contract HHSN268201100027C.
During ACCORD, the following companiesprovided study medications, equipment, orsupplies: Abbott Laboratories (Abbott Park,IL), Amylin Pharmaceutical (San Diego, CA),AstraZeneca Pharmaceuticals LP (Wilmington,DE), Bayer HealthCare LLC (Tarrytown, NY), CloserHealthcare Inc. (Tequesta, FL), GlaxoSmithKlinePharmaceuticals (Philadelphia, PA), King Phar-maceuticals, Inc. (Bristol, TN),Merck & Co., Inc.(Whitehouse Station, NJ), Novartis Pharma-ceuticals, Inc. (East Hanover, NJ), Novo Nordisk,Inc. (Princeton, NJ), Omron Healthcare, Inc.(Schaumburg, IL), Sanofi U.S. (Bridgewater, NJ),Schering-Plough Corporation (Kenilworth, NJ),and Takeda Pharmaceuticals (Deerfield, IL).Duality of Interest. H.C.G. reports grants andpersonal fees from Sanofi, Lilly, AstraZeneca,Boehringer Ingelheim, Novo Nordisk, andMerck, grants from Janssen, and personal feesfrom Abbott, Berlin Chemie, Amgen, KaneqBioscience, and Roche, and from GSK outsidethe submittedwork. R.P.D. reports personal feesfrom Allergan Inc. and ThromboGenics NV, andnonfinancial support from ThromboGenics,Chengdu Kanghong Biotechnology, and EyeKorLLC. W.C.C. reports personal fees from Takedaand Janssen and grants from Merck and Lillyoutside the submitted work. M.B.E. reportsgrants from Amgen, and personal fees and non-financial support from Kowa. H.N.G. reportsgrants and personal fees from Merck outsidethe submitted work. No other potential conflictsof interest relevant to this article were reported.Author Contributions. E.Y.C., M.D.D., R.P.D.,C.M.G., L.H.P., and W.T.A. designed the study,researched the data, wrote the manuscript,contributed to the discussion, and reviewedand edited the manuscript. J.F.L. and W.T.A.conducted the statistical analyses and criticallyreviewed the manuscript. H.C.G. wrote themanuscript and contributed to the discussion.H.C.G., F.I.-B., C.M.G., W.C.C., M.B.E., J.T.B., andH.N.G. collected the clinical data. F.I.-B., S.G.,W.C.C., M.B.E., J.T.B., H.N.G., and D.C.G. reviewedand edited the manuscript. E.Y.C. and W.T.A. arethe guarantors of this work and, as such, had fullaccess to all the data in the study and takeresponsibility for the integrity of the data andthe accuracy of the data analysis.Prior Presentation. Parts of this article werepresented at the 76th Scientific Sessions of theAmerican Diabetes Association, New Orleans,LA, 10–14 June 2016.
AppendixWriting Committee: Emily Y. Chew (Chair) (NationalEye Institute, National Institutes of Health,
Bethesda, MD), James F. Lovato (Wake ForestUniversity School of Medicine, Winston-Salem,NC), Matthew D. Davis (University of Wisconsin,Madison, WI), Hertzel C. Gerstein (McMasterUniversity and Hamilton Health Sciences, Pop-ulation Health Research Institute, Hamilton, ON,Canada), Ronald P. Danis (University of Wiscon-sin, Madison, WI), Faramarz Ismail-Beigi andSaul Genuth (Case Western Reserve University,Cleveland, OH), Craig M. Greven and Letitia H.Perdue (Wake Forest University School of Med-icine, Winston-Salem, NC), William C. CushmanandMarshall B. Elam (Memphis Veterans AffairsMedical Center, Memphis, TN), J. Thomas Biggerand Henry N. Ginsberg (Columbia UniversityCollege of Physicians and Surgeons, New York,NY), David C. Goff, Jr. (Colorado School of PublicHealth, Aurora, CO), and Walter T. Ambrosius(Wake Forest University School of Medicine,Winston-Salem, NC).
References1. UK Prospective Diabetes Study (UKPDS)Group. Intensive blood-glucose control with sul-phonylureas or insulin compared with conven-tional treatment and risk of complications inpatients with type 2 diabetes (UKPDS 33). Lan-cet 1998;352:837–8532. UK Prospective Diabetes Study Group. Tightblood pressure control and risk of macrovascu-lar and microvascular complications in type 2diabetes: UKPDS 38. BMJ 1998;317:703–7133. Holman RR, Paul SK, Bethel MA, MatthewsDR, Neil HA. 10-year follow-up of intensive glu-cose control in type 2 diabetes. N Engl J Med2008;359:1577–15894. The Diabetes Control and Complications TrialResearch Group. The effect of intensive treatmentof diabetes on the development and progressionof long-term complications in insulin-dependentdiabetes mellitus. N Engl J Med 1993;329:977–986
5. Keech AC, Mitchell P, Summanen PA, et al.;FIELD study investigators. Effect of fenofibrateon the need for laser treatment for diabeticretinopathy (FIELD study): a randomised con-trolled trial. Lancet 2007;370:1687–1697
6. Chew EY, Ambrosius WT, Davis MD, et al.;ACCORD Study Group; ACCORD Eye Study Group.Effects of medical therapies on retinopathy pro-gression in type 2 diabetes. N Engl J Med 2010;363:233–244
7. Buse JB, Bigger JT, Byington RP, et al.; ACCORDStudy Group. Action to Control CardiovascularRisk in Diabetes (ACCORD) trial: design andmeth-ods. Am J Cardiol 2007;99:21i–33i
8. Chew EY, Ambrosius WT, Howard LT, et al.;ACCORD Study Group. Rationale, design, andmethods of the Action to Control CardiovascularRisk in Diabetes Eye Study (ACCORD-EYE). Am JCardiol 2007;99:103i–111i
9. Early Treatment Diabetic Retinopathy StudyResearch Group. Fundus photographic risk fac-tors for progression of diabetic retinopathy.ETDRS report number 12. Ophthalmology 1991;98(Suppl.):823–83310. Fine JP, Gray RJ. A proportional hazardsmodel for the subdistribution of a competingrisk. J Am Stat Assoc 1999;94:496–50911. Action to Control Cardiovascular Risk in Diabe-tes Study Group; Gerstein HC, Miller ME, Byington
care.diabetesjournals.org ACCORDION Eye/ACCORDION Study Groups 1099

RP, et al.; Effects of intensive glucose loweringin type 2 diabetes. N Engl J Med 2008;358:2545–255912. Ginsberg HN, Elam MB, Lovato LC, et al.;ACCORD Study Group. Effects of combinationlipid therapy in type 2 diabetes mellitus. N EnglJ Med 2010;362:1563–157413. Cushman WC, Evans GW, Byington RP, et al.;ACCORD Study Group. Effects of intensive blood-pressure control in type 2 diabetesmellitus. N EnglJ Med 2010;362:1575–158514. Lachin JM, White NH, Hainsworth DP,Sun W, Cleary PA, Nathan DM; Diabetes Controland Complications Trial (DCCT)/Epidemiology ofDiabetes Interventions and Complications (EDIC)Research Group. Effect of intensive diabetes ther-apy on the progression of diabetic retinopathy inpatients with type 1 diabetes: 18 years of follow-up in the DCCT/EDIC. Diabetes 2015;64:631–642
15. The Diabetes Control and ComplicationsTrial/Epidemiology of Diabetes Interventionsand Complications Research Group. Retinopathyand nephropathy in patients with type 1 diabetesfour years after a trial of intensive therapy. N EnglJ Med 2000;342:381–38916. Aiello LP, Sun W, Das A, et al.; DCCT/EDICResearch Group. Intensive diabetes therapy andocular surgery in type 1 diabetes. N Engl J Med2015;372:1722–173317. ACCORD Study Group. 9-year effects of3.7 years of intensive glycemic control on car-diovascular outcomes. Diabetes Care 2016;39:701–70818. Chew EY, Davis MD, Danis RP, et al.; Action toControl Cardiovascular Risk in Diabetes Eye StudyResearch Group. The effects of medical manage-ment on the progression of diabetic retinopathy inpersons with type 2 diabetes: the Action to ControlCardiovascular Risk in Diabetes (ACCORD) EyeStudy. Ophthalmology 2014;121:2443–2451
19. Simo R, Roy S, Behar-Cohen F, Keech A,Mitchell P, Wong TY. Fenofibrate: a new treatmentfor diabetic retinopathy. Molecular mechanismsand future perspectives. Curr Med Chem 2013;20:3258–326620. Wong TY, Simo R, Mitchell P. Fenofibrate -a potential systemic treatment for diabeticretinopathy? Am J Ophthalmol 2012;154:6–1221. Frank RN. Systemic therapies for diabeticretinopathy: the accord eye study. Ophthalmol-ogy 2014;121:2295–229622. Ferris FL 3rd. How effective are treatmentsfor diabetic retinopathy? JAMA 1993;269:1290–129123. Ismail-Beigi F, Craven T, Banerji MA, et al.;ACCORD trial group. Effect of intensive treat-ment of hyperglycaemia on microvascular out-comes in type 2 diabetes: an analysis of theACCORD randomised trial. Lancet 2010;376:419–430
1100 Persistent Glycemic Effect on Retinopathy Diabetes Care Volume 39, July 2016