Embed Size (px)
Citation preview
Journal of Abnonnal Psycholngy2002,Vollll,No.I,124-133
Copyright 2002 by the American Psychological Association, Inc.0021-843X/O2/$5.00 DOl: 10. 1037//OO21-843X.1 I 1.1 124
Personality and the Genetic Risk for Alcohol Dependence
Andrew C. Heath, Pamela A. F. Madden,and Kathleen K. Bucholz
Washington University School of Medicine
Wendy S. SlutskeUniversity of Missouri-Columbia
Dixie J. Statham and Nicholas G. MartinQueensland Institute of Medical Research
The extent to which the genetic risk for alcohol dependence (AD) and conduct disorder (CD) and theircommon genetic risk overlap with genetic factors contributing to variation in dimensions of personalitywas examined in a study of 6,453 individuals from 3,383 adult male and female same-sex and unlike-sextwin pairs from the Australian Twin Registry. The associations between the personality dimensions of
positive emotionality, negative emotionality, and AD and CD risk were modest, whereas the associationsbetween behavioral undercontrol and AD and CD risk were substantially higher. Genetic influencescontributing to variation in behavioral undercontrol accounted for about 40% of the genetic variation inAD and CD risk and about 90% of the common genetic risk for AD and CD. These results suggest that
genetic factors contributing to variation in dimensions of personality, particularly behavioral undercon-trol, account for a substantial proportion of the genetic diathesis for AD and most of the common geneticdiathesis for AD and CD among both men and women.
Several theories of the etiology of alcoholism posit that thegenetic diathesis for alcoholism is partially mediated by tempera-ment or personality (Cloninger, 1987a; Tarter, 1988; Tarter, Al-terman, & Edwards, 1985; Zuckerman, 1987). There are severallines of evidence that indirectly support this proposition. First,genetic factors have been consistently implicated in contributing to
individual differences in personality traits, with about one third toone half of the variation in personality typically being attributed tosuch factors (Eaves, Eysenck, & Martin, 1989; Loehlin, 1992).Second, cross-sectional studies consistently show associations ofseveral personality traits with a history of alcoholism (McGue,Slutske, Taylor, & Iacono, 1997; Sher & Trull, 1994; Sher, Trull,Bartholow, & Vieth, 1999), and longitudinal studies provide evi-dence that at least some of these personality correlates are devel-opmental antecedents of alcoholism (Caspi et al., 1997; Cloninger,Sigvardsson, & Bohman, 1988; Loper, Kammeier, & Hoffman,1973; Zucker & Lisansky Gomberg, 1986). Specifically, the traitsof impulsivity, thrill seeking, rebelliousness, nonconformity, andaggressiveness (i.e., "behavioral undercontrol"; Sher, 1991) arerobust predictors of alcoholism. Third, studies of the offspring ofalcoholics suggest that the personality traits of behavioral under-control may be related to the familial diathesis underlying alco-holism risk (e.g., Finn, Sharkansky, Brandt, & Turcotte, 2000;Sher, Walitzer, Wood, & Brent, 1991). However, family studiescannot disentangle the extent to which personality traits are relatedto the genetic versus environmental risk for alcoholism.
In this study, we examined the extent to which genetic factorscontributing to variation in dimensions of personality are associ-ated with genetic susceptibility for alcohol dependence (AD).Previously, we showed that most of the overlap between AD andconduct disorder (CD) could be accounted for by common geneticrisk factors (Slutske et al., 1998). Because AD and CD share manyof the same personality correlates and predictors (Krueger, Caspi,& Moffitt, 2000; Sher & Trull, 1994), we also examined andquantified in the present study the extent to which the risk for CDand the common genetic risk for AD and CD overlap with geneticfactors contributing to variation in dimensions of personality.
Wendy S. Slutske, Department of Psychological Sciences and MissouriAlcoholism Research Center, University of Missouri-Columbia; AndrewC. Heath, Pamela A. F. Madden, and Kathleen K. Bucholz, Department ofPsychiatry and Missouri Alcoholism Research Center, Washington Uni-versity School of Medicine; Dixie J. Statham and Nicholas G. Martin,Epidemiology Unit, Queensland Institute of Medical Research, Brisbane,Queensland, Australia.
This work was supported by the National Institutes of Health (GrantsAAOO264, AA07535, AA07728, and AAI0249 and Postdoctoral TrainingGrants MH17104 and DAO7261), by a grant from the Australian NationalHealth and Medical Research Council, and by the Missouri AlcoholismResearch Center, University of Missouri-Colilmbia and Washington Uni-versity School of Medicine (Grant AAII998). Portions of this researchwere presented at the 28th Annual Meeting of the Behavior GeneticsAssociation, Stockholm, Sweden, June 1998, and at the 107th AnnualConvention of the American Psychological Association, Boston, Massa-chusetts, August 1999.
We acknowledge the assistance of Randy Cates, Michael Hodge, SueMason, Hui Pan, Theresa Pangan, John Pearson, Pamela Saunders, OliviaZheng, and the interviewers. We thank the twins from the AustralianNational Health and Medical Research Council Twin Registry for theircontinuing cooperation.
Correspondence,concerning this article should be addressed to WendyS. Slutske, Department of Psychological Sciences, University of Missouri,210 McAlester Hall, Columbia, Missouri 65211. E-mail: [email protected]
124
GENES, PERSONALrrY, AND ALCOHOL DEPENDENCE 125
Method
ParticipantsThe participants were members of the Australian National Health and
Medical Research Council Twin Registry (A TR), a national volunteer twinpanel recruited through the media, schools, and a variety of other sources(Jardine & Martin, 1984). We analyzed data obtained from a 1988 ques-tionnaire survey (N = 6,327; 83% overall individual response rate; see
Heath, Cloninger, & Martin, 1994, for details) and a 1992 telephoneinterview survey (N = 5,889; 86% overall individual response rate; see
Heath, Bucholz, et al., 1997, for details). Mean ages at interview were 42.7years for men (range = 28-89 years) and 44.8 years for women (range =27-90 years; see Heath, Bucholz, et aI., 1997; Slutske et al., 1997; orSlutske et al., 1998, for further details about response rates, attrition, andthe representativeness of the ATR sample).
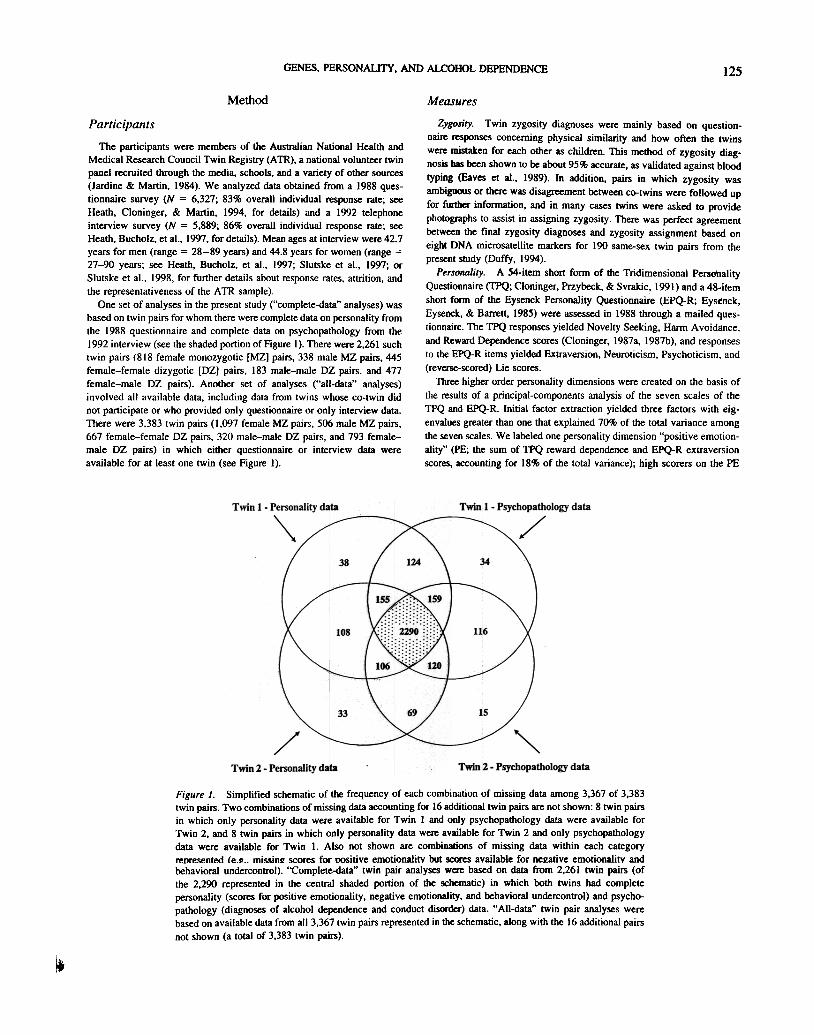
One set of analyses in the present study ("complete-data" analyses) wasbased on twin pairs for whom there were complete data on personality fromthe 1988 questionnaire and complete data on psychopathology from the1992 interview (see the shaded portion of Figure 1). There were 2,261 suchtwin pairs (818 female monozygotic [MZ] pairs, 338 male MZ pairs, 445female-female dizygotic [DZ] pairs, 183 male-male DZ pairs, and 477female-male DZ pairs). Another set of analyses ("all-data" analyses)involved all available data, including data from twins whose co-twin didnot participate or who provided only questionnaire or only interview data.There were 3,383 twin pairs (1,097 female MZ pairs, 506 male MZ pairs,667 female-female DZ pairs, 320 male-male DZ pairs, and 793 female-male DZ pairs) in which either questionnaire or interview data wereavailable for at least one twin (see Figure I).
Measures
Zygosity. Twin zygosity diagnoses were mainly based on question-naire responses concerning physical similarity and how often the twinswere mistaken for each other as children. This method of zygosity diag-nosis bas been shown to be about 95% accurate, as validated against bltJodtyping (Eaves et aI., 1989). In addition, pairs in which zygosity wasambiguoos or there was disagreement between c()-twins were followed upfor funber information, and in many cases twins were asked to providephotographs to assist in assigning zygosity. There was perfect agreementbetween the final zygosity diagnoses and zygosity assignment based oneight DNA microsatellite markers for 190 same-sex twin pairs from thepresent study (Duffy, 1994).
Personality. A 54-item short form of the Tridimensional PersOnalityQuestionnaire (TPQ; Cloninger, Przybeck, & Svrakic, 1991) and a 48-itemshort form of the Eysenck Personality Questionnaire (EPQ-R; Eysenck,Eysenck, & Barrett, 1985) were assessed in 1988 through a mailed ques-tionnaire. The TPQ responses yielded Novelty Seeking, Harm Avoidance.and Reward Dependence scores (Cloninger, 1987a, 1987b), and responsesto the EPQ-R items yielded Extraversion, Neuroticism, Psychoticism, and(reverse-scored) Lie scores.
Three higher order personality dimensions were created on the basis ofthe results of a principal-components analysis of the seven scales of theTPQ and EPQ-R. Initial factor extraction yielded three factors with eig-envalues greater than one that explained 70% of the total variance amongthe seven scales. We labeled one personality dimension "positive emotion-ality" (PE; the sum of TPQ reward dependence and EPQ-R extraversionscores, accounting for 18% of the total variance); high scorers on the PE
Figure 1. Simplified schematic of the frequency of each combination of missing data among 3,367 of 3,383twin pairs. Two combinations of missing data accounting for 16 additional twin pairs are not shown: 8 twin pairsin which only personality data were available for Twin I and only psychopathology data were available forTwin 2, and 8 twin pairs in which only personality data were available for Twin 2 and only psychopathologydata were available for Twin I. Also not shown are combinations of missing data within each categoryrenre~entM (e.g.- missing scores for nositive emotionalitY but SC(XeS available for ne2ative emotionalitY andbehavioral undercontrol). "Complete-data" twin pair analyses were based on data from 2,261 twin pairs (ofthe 2,290 representM in the central shaded portion of the schematic) in which both twins had completepersonality (scores for positive emotionality, negative emotionality, and behavioral undercontrol) and psycho-pathology (diagnoses of alcohol dependence and conduct disorder) data. "All-data" twin pair analyses werebased on available data from all 3,367 twin pairs represented in the schematic, along with the 16 additional pairs
not shown (a total of 3,383 twin pairs).
IJ
126 SLUTSKE ET AL.
dimension are outgoing, lively, persistent, and warm. We labeled anotherpersonality dimension "negative emotionality" (NE; the sum of TPQ HarmAvoidance and EPQ-R Neuroticism, accounting for 31% of the totalvariance); high scorers on the NE dimension are anxious, inhibited, moody,and unhappy. We labeled the third personality dimension behavioral un-dercontrol (BU; the sum of TPQ Novelty Seeking, EPQ-R Psychoticism,and EPQ-R reverse-scored Lie, accounting for 21 % of the total variance);high scorers on the BU dimension are impulsive, thrill seeking, irrespon-sible, and rebellious. These three personality dimensions are similar to thesociability, emotionality, and impulsive-unsocialized sensation-seekingdimensions that Zuckerman, Kuhlman, and Camac (1988) obtained in afactor analysis of 46 personality scales and to other "Big Three" concep-tualizations of personality structure (Zuckerman, Kuhlman, Joireman, Teta,& Kraft, 1993). Alpha coefficients were .82 for FE, .90 for NE, and .67 forBU. The 2-year stabilities among 869 individuals from the present studywere .83 for FE, .84 for NE, and .81 for BU. Scores on the threedimensions were polychotomized into six ordinal categories for all of theanalyses.
CD. The Semi-Structured Assessment for the Genetics of Alcoholism(SSAGA) interview (Bucholz et al.. 1994), originally developed for theCollaborative Study on the Genetics of Alcoholism, was abridged to coveronly the Diagnostic and Statistical Manual of Mental Disorders (revisedthird edition; DSM-III-R; American Psychiatric Association, 1987) andwas modified for use as a telephone interview in Australia (SSAGA-OZ).Interviews were administered by trained lay interviewers who were un-aware of the psychiatric status of the co-twin. Interviewers were supervisedby " projcct coordin"tor, " qu"lifiw "lll,i",,1 po]~l.vlv5io' wi,l. -4 ]"01' vfexperience. All interview protocols were reviewed either by the projectcoordinator or by the most skilled interviewers (those who maintainedconsistently low error rates in coding); the reviews were always done bysomeone other than the person who conducted the interview. In addition,all interviews were tape-recorded, and a random 5% of interview tapeswere reviewed for quality control and coding inconsistencies.
Individual CD symptoms were assessed by telephone interview with theSSAGA-OZ. The individual CD symptoms were aggregated into lifetimeCD diagnoses by computer algorithm according to DSM-//J-R criteria(endorsement of three or more CD symptoms occurring before the ageof 18 years). Lifetime prevalence rates of CD in this sample were 18% inmen and 3% in women. The long-term interrater test-retest reliability ofthese retrospective lifetime diagnoses of childhood CD over a l5-monthinterval was good (K = .39, Yules Y = .68, tetrachoric r = .78; Slutske et
al., 1997).AD. Individual symptoms of AD were assessed by telephone interview
and aggregated into lifetime DSM-//J-R diagnoses by computer algorithm.The DSM-I//-R definition yielded lifetime AD prevalence rates in thissample of 23% among men and 5% among women. The long-term inter-rater test-retest reliability of these retrospective lifetime diagnoses over a1-3-year interval was also good (K = .52, Yules Y = .65, tetrachoric r =
.79; Heath, Bucholz, et al., 1997).Although the measures of personality were obtained roughly 4 years
before the assessment of AD and CD, this study is best viewed as cross-sectional rather than longitudinal. Both AD and CD were based on retro-spective reports, and many of the problems reported (most of the AD andall of the CD) would have occurred before the personality assessment.
polychoric correlations for each of the five groups (i.e., female MZ, maleMZ, female-female DZ, male-male DZ, and female-male DZ) were gen-erated by the method of maximum likelihood using PRELIS (Joreskog &
Sorbom, 1996). Models were fitted to the five twin correlation matrices andcorresponding asymptotic covariance weight matrices by the method ofweighted least squares with the Mx program (Neale et al., 1999). All-dataanalyses involved all of the available data from 3,383 twin pairs. In theseanalyses, models were fitted directly to the raw ordinal data by the methodof maximum likelihood with the Mx program (Neale et al., 1999).
Each of the two model-fitting methods has advantages and disadvan-tages. The advantage of the complete'-data method is that it is computa-
tionally very efficient. Models can be fitted in a matter of minutes, and soit is feasible, for example, to refit models using different starting values tocheck the correctness of obtained solutions and to test various hypothesesabout the significance of or the equivalence of parameters in a model. Thedisadvantage of the complete-data method is that many of the availabledata are wasted (in this study, data from 1,122 twin pairs with incompleteinformation were discarded). If there are biases due to attrition or nonpar-
ticipation because the data are not missing completely at random (Little &
Rubin, 1987), complete-data analyses may lead to incorrect conclusions.The advantage of the all-data model-fitting method is that it can correct
for biases due to attrition and nonparticipation when data are missing atrandom (Little & Rubin, 1987). Because more of the data are used,parameter estimates are more precise and confidence intervals (CIs) areusually narrower. The only disadvantage of the all'-data method is that it is
extremely computationally intensive, and models with more than two orthree categorical variables are beyond the limits of available computingpower. We chose to take advantage of the complementary strengths of thetwo model-fitting methods. In the process, we were able to indirectly assess
potential biases in the sample by comparing the results obtained with thetwo methods. The results were quite similar for most analyses.
All of the parameters of interest were estimated within reduced biomet-ric structural equation models that partitioned the variation in liability andthe sources of covariation in liability into that due to additive genetic and
nonshared environmental influences. Because the aims of this study wereto quantify the extent to which genetic factors contributing to variation inpersonality dimensions are associated with genetic variation in the risk forAD and CD and to quantify the extent to which genetic factors contributingto variation in personality dimensions overlap with the genetic sources of
covariation between AD and CD, we focused on the results of reducedmodels to simplify the presentation. For none of the five variables studied
(AD, CD, PE, NE, and BU) did estimates of shared family environmentalfactors differ significantly from zero, whereas genetic influences weresignificant for all (see Heath, Bucholz, et al., 1997; Heath et al., 1994;Slutske et al., 1997). For example, when shared family environmentalfactors were included in models, they accounted for only 1.8% of the totalvariation, on average, in the personality dimensions (range = 00/0-12%).
Thus, the results for the genetic associations between personality dimen-sions and AD and CD were not altered substantially when shared familyenvironmental factors were omitted from models relative to when theywere included.
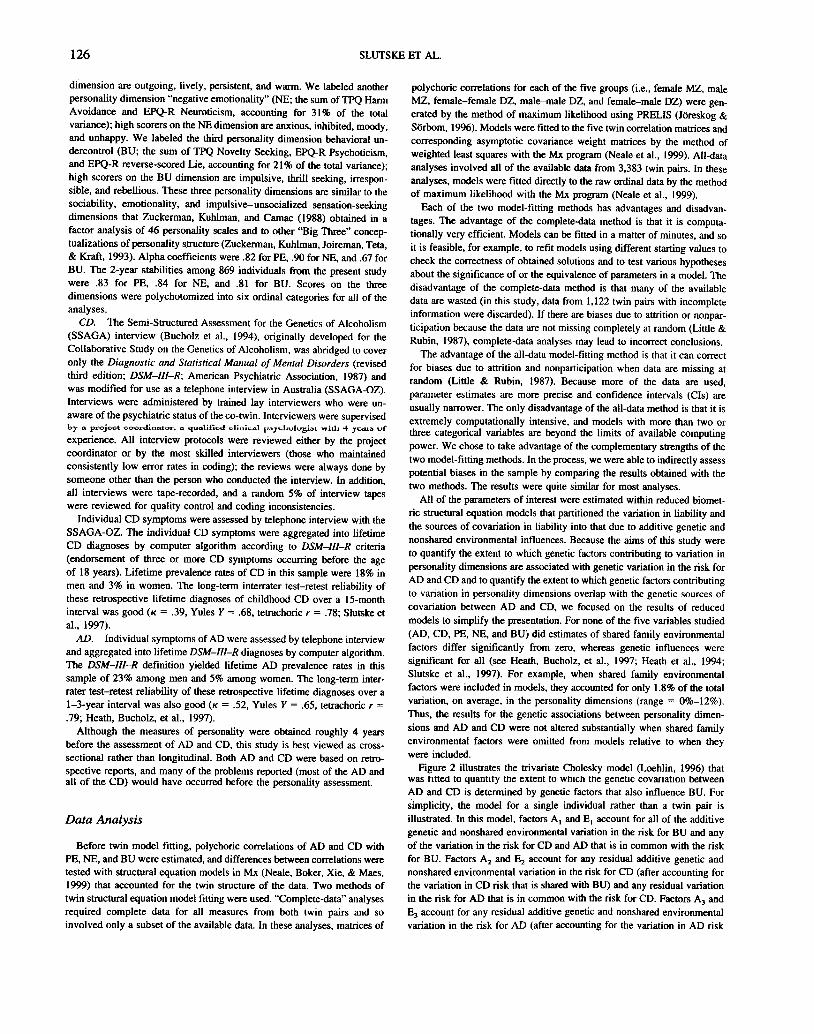
Figure 2 illustrates the trivariate Cholesky model (Loehlin, 1996) thatwas tlttea to quantity the extent to which the genetic COVariation betweenAD and CD is determined by genetic factors that also influence BU. Forsimplicity, the model for a single individual rather than a twin pair is
illustrated. In this model, factors AI and EI account for all of the additivegenetic and nonshared environmental variation in the risk for BU and anyof the variation in the risk for CD and AD that is in common with the riskfor BU. Factors A2 and ~ account for any residual additive genetic andnonshared environmental variation in the risk for CD (after accounting forthe variation in CD risk that is shared with BU) and any residual variationin the risk for AD that is in common with the risk for CD. Factors AJ andEJ account for any residual additive genetic and nonshared environmentalvariation in the risk for AD (after accounting for the variation in AD risk
Data Analysis
Before twin model fitting, polychoric correlations of AD and CD withPE, NE, and BO were estimated, and differences between correlations weretested with structural equation models in Mx (Neale, Boker, Xie, & Maes,1999) that accounted for the twin structure of the data. Two methods oftwin structural equation mode! fitting were used. "Complete-data" analysesrequired complete data for all measures from both twin pairs and soinvolved only a subset of the available data. In these analyses, matrices of
GENES, PERSONALITY, AND ALCOHOL DEPENDENCE 127
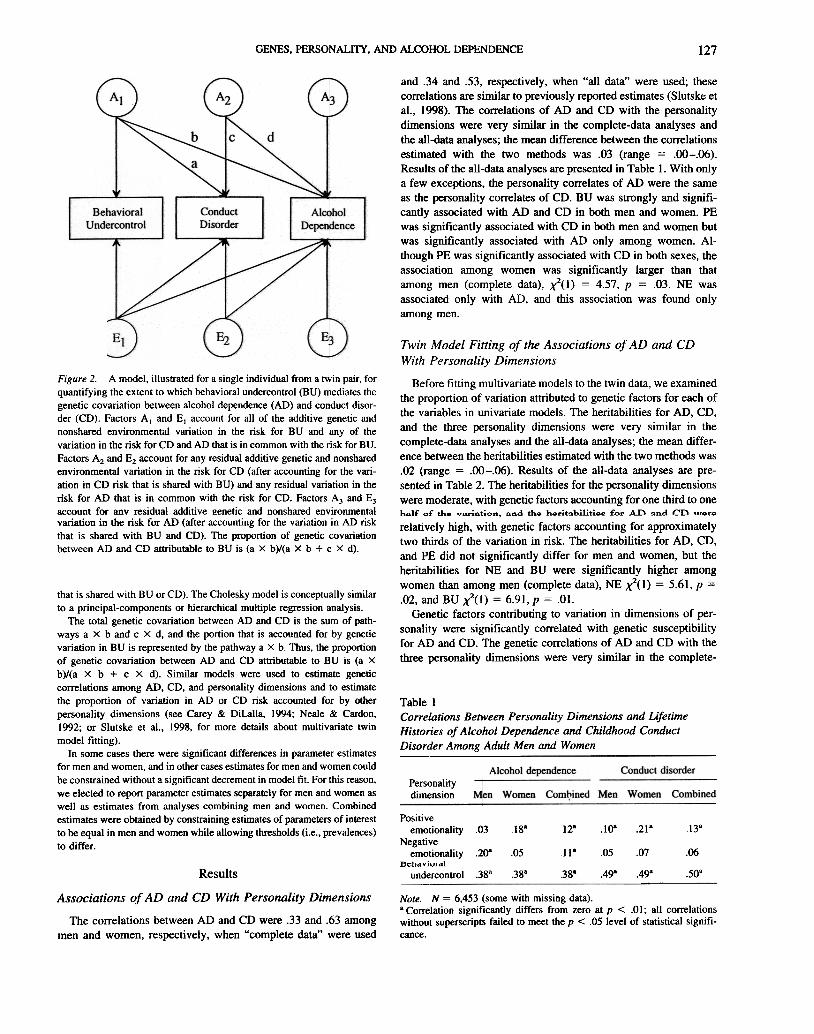
and .34 and .53, respectively, when "all data" were used; thesecorrelations are similar to previously reported estimates (Slutskt: etaI., 1998). The correlations of AD and CD with the personalitydimensions were very similar in the complete-data analyses andthe all-data analyses; the mean difference between the correlationsestimated with the two methods was .03 (range = .00-.06).Results of the all-data analyses are presented in Table I. With onlya few exceptions, the personality correlates of AD were the sameas the personality correlates of CD. BU was strongly and signifi-cantly associated with AD and CD in both men and women. PEwas significantly associated with CD in both men and women butwas significantly associated with AD only among women. Al-though PE was significantly associated with CD in both sexes, theassociation among women was significantly larger than thatamong men (complete data), ~(l) = 4.57, P = .03. NE was
associated only with AD, and this association was found onlyamong men.
Figure 2. A model, illustrated for a single individual from a twin pair, forquantifying the extent to which behavioral undercontrol (BU) mediates thegenetic covariation between alcohol dependence (AD) and conduct disor-der (CD). Factors AI and EI account for all of the additive genetic andnonshared environmental variation in the risk for BU and any of thevariation in the risk for CD and AD that is in common with the risk for BU.Factors A2 and E2 account for any residual additive genetic and nonsharedenvironmental variation in the risk for CD (after accounting for the vari-ation in CD risk that is shared with BU) and any residual variation in therisk for AD that is in common with the risk for CD. Factors AJ and EJaccount for anv residual additive !!enetic and nonshared environmentalvariation in the risk for AD (after accounting for the variation in AD riskthat is shared with BU and CD). The proportion of genetic covariationbetween AD and CD attributable to BU is (a X b)/(a X b + c X d).
Twin Model Fitting of the Associations of AD and CDWith Personality Dimensions
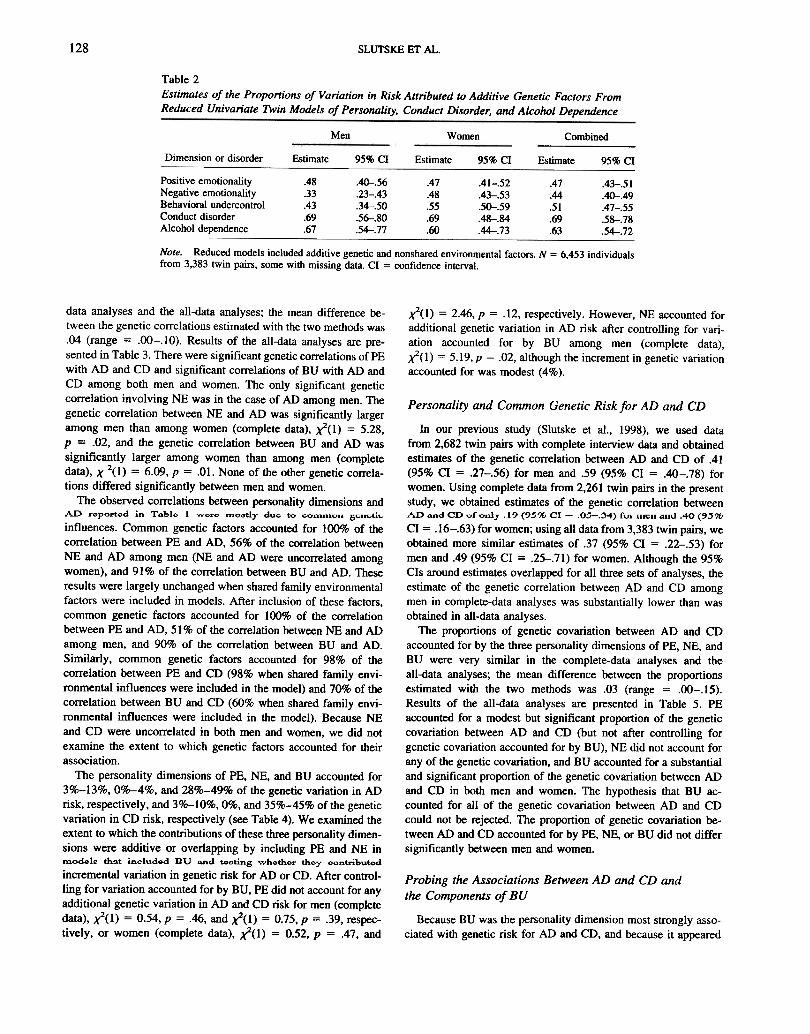
Before fitting multivariate models to the twin data, we examinedthe proportion of variation attributed to genetic factors for each ofthe variables in univariate models. The heritabilities for AD, CD,and the three personality dimensions were very similar in thecomplete-data analyses and the all-data analyses; the mean differ-ence between the heritabilities estimated with the two methods was.02 (range = .00-.06). Results of the all-data analyses are pre-
sented in Table 2. The heritabilities for the personality dimensionswere moderate, with genetic factors accounting for one third to onehalf of the variation, and the heri...bilitiec for AD =d CD "'ererelatively high, with genetic factors accounting for approximatelytwo thirds of the variation in risk. The heritabilities for AD, CD,and PE did not significantly differ for men and women, but theheritabilities for NE and BU were significantly higher amongwomen than among men (complete data), NE ¥(l) = 5.61, p =.02, and BU ¥(l) = 6.91, p = .01.
Genetic factors contributing to variation in dimensions of per-sonality were significantly correlated with genetic susceptibilityfor AD and CD. The genetic correlations of AD and CD with thethree personality dimensions were very similar in the complete-
Table ICorrelations Between Personality Dimensions and LifetimeHistories of Alcohol Dependence and Childhood ConductDisorder Among Adult Men and Women
that is shared with BU or CD). The Cholesky model is conceptually similarto a principal-components or hierarchical multiple regression analysis.
The total genetic covariation between AD and CD is the sum of path-ways a X b and c X d, and the portion that is accounted for by geneticvariation in BU is represented by the pathway a X b. Thus, the proportionof genetic covariation between AD and CD attributable to BU is (a X
b)/(a X b + c X d). Similar models were used to estimate geneticcorrelations among AD, CD, and personality dimensions and to estimatethe proportion of variation in AD or CD risk accounted for by otherpersonality dimensions (see Carey & DiLalla, 1994; Neale & Cardon,1992; or Slutske et aI., 1998, for more details about multivariate twin
model fitting).In some cases there were significant differences in parameter estimates
for men and women, and in other cases estimates for men and women couldbe constrained without a significant decrement in model fit. For this reason,we elected to report parameter estimates separately for men and women aswell as estimates from analyses combining men and women. Combinedestimates were obtained by constraining estimates of parameters of interestto be equal in men and women while allowing thresholds (i.e., prevalences)
to differ.
Personalitydimension
IS" 128 ,loa .21" 138
.06
.50'
Positiveemotionality .03
Negativeemotionality .20"
nt;\laviv.a\undercontrol .38"
.05 .118 .05
.498
.07
.49"38" .38"
Note. N = 6,453 (some with missing data).a Correlation significantly differs from zero at p < .01; all correlations
without superscripts failed to meet the p < .05 level of statistical signifi-
cance.
Results
Associations of AD and CD With Personality Dimensions
The correlations between AD and CD were .33 and .63 amongmen and women, respectively, when "complete data" were used
128 SLUTSKE ET AL.
Table 2Estimates of the Proportions of Variation in Risk Anributed to Additive Genetic Factors FromReduced Univariate Twin Models of Personality, Conduct Disorder, and Alcohol Dependence
Men Women Combined
Dimension or disorder &timate 95% CI Estimate 95% CI Estimate 95% CI
Positive emotionalityNegative emotionalityBehavioral undercontrolConduct disorderAlcohol dependence
.48
.33
.43
.69
.67
.40-.56
.23-.43
.34--.50
.56-.80.54-.77
.47
.48
.55
.69
.60
.41-.52
.43-.53
.50-.59
.48-.84
.44-.73
.47
.44
.51
.69
.63
.43-.51
.40-.49
.47-.55
.58-.78
.54-.72
Note. Reduced models included additive genetic and nonshared environmental factors. N = 6,453 individualsfrom 3,383 twin pairs, some with missing data. CI = confidence interval.
K(l) = 2.46, p = .12, respectively. However, NE accounted foradditional genetic variation in AD risk after controlling for vari-ation accounted for by BU among men (complete data),K(l) = 5.19,p = .02, although the increment in genetic variationaccounted for was modest (4%).
Personality and Common Genetic Risk for AD and CD
In our previous study (Slutske et al., 1998), we used datafrom 2,682 twin pairs with complete interview data and obtainedestimates of the genetic correlation between AD and CD of .41(95% CI = .27-.56) for men and .59 (95% CI = .40-.78) forwomen. Using complete data from 2,261 twin pairs in the presentstudy, we obtained estimates of the genetic correlation betweenAD alId CD vCv"ly .19 (95% CI -.05-.:34) CVl ll1tOll cul\1.40 (9-"lb
CI = .16-.63) for women; using all data from 3,383 twin pairs, weobtained more similar estimates of .37 (95% CI = .22-.53) formen and .49 (95% CI = .25-.71) for women. Although the 95%CIs around estimates overlapped for all three sets of analyses, theestimate of the genetic correlation between AD and CD amongmen in complete-data analyses was substantially lower than wasobtained in all-data analyses.
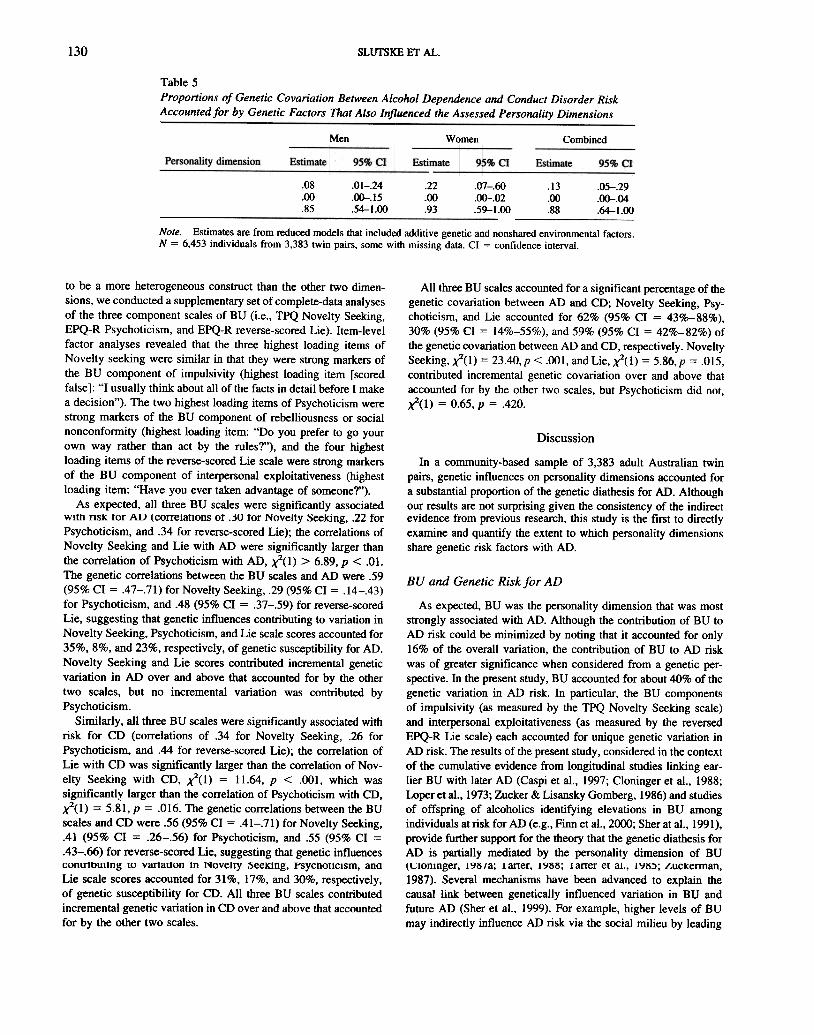
The proponions of genetic covariation between AD and CDaccounted for by the three personality dimensions of PE, NE, andBU were very similar in the complete-data analyses and theall-data analyses; the mean difference between the proponionsestimated with the two methods was .03 (range = .00-.15).Results of the all-data analyses are presented in Table 5. PEaccounted for a modest but significant proponion of the geneticcovariation between AD and CD (but not after controlling forgenetic covariation accounted for by BU), NE did not account forany of the genetic covariation, and BU accounted for a substantialand significant proponion of the genetic covariation between ADand CD in both men and women. The hypothesis that BU ac-counted for all of the genetic covariation between AD and CDcould not be rejected. The proponion of genetic covariation be-tween AD and CD accounted for by PE, NE, or BU did not differsignificantly between men and women.
data analyses and the all-data analyses; the mean difference be-tween the genetic correlations estimated with the two methods was.04 (range = .00-.10). Results of the all-data analyses are pre-sented in Table 3. There were significant genetic correlations ofPEwith AD and CD and significant correlations of BU with AD andCD among both men and women. The only significant geneticcorrelation involving NE was in the case of AD among men. Thegenetic correlation between NE and AD was significantly largeramong men than among women (complete data), ~(l) = 5.28,P = .02, and the genetic correlation between BU and AD was
significantly larger among women than among men (completedata), X 2(1) = 6.09, p = .01. None of the other genetic correla-tions differed significantly between men and women.
The observed correlations between personality dimensions andAD roportod in Tablo I "VYoro mo"tl;y du" tu "",'uuv" 5"u"u,-influences. Common genetic factors accounted for 100% of thecorrelation between PE and AD, 56% of the correlation betweenNE and AD among men (NE and AD were uncorrelated amongwomen), and 91 % of the correlation between BU and AD. Theseresults were largely unchanged when shared family environmentalfactors were included in models. After inclusion of these factors,common genetic factors accounted for 100% of the correlationbetween PE and AD, 51 % of the correlation between NE and ADamong men, and 90% of the correlation between BU and AD.Similarly, common genetic factors accounted for 98% of thecorrelation between PE and CD (98% when shared family envi-ronmental influences were included in the model) and 70% of thecorrelation between BU and CD (60% when shared family envi-ronmental influences were included in the model). Because NEand CD were uncorrelated in both men and women, we did notexamine the extent to which genetic factors accounted for theirassociation.
The personality dimensions of PE, NE, and BU accounted for30/0-13%,0%-4%, and 280/0-49% of the genetic variation in ADrisk, respectively, and 3%-10%, 0%, and 35%-45% of the geneticvariation in CD risk, respectively (see Table 4). We examined theextent to which the contributions of these three personality dimen-sions were additive or overlapping by including PE and NE inmodel~ th"t included DU =d tocting whether they oontributodincremental variation in genetic risk for AD or CD. After control-ling for variation accounted for by BU, PE did not account for anyadditional genetic variation in AD and CD risk for men (completedata), ~(l) = 0.54, P = .46, and ~(l) = 0.75, P = .39, respec-tively, or women (complete data), ~(l) = 0.52, p = .47, and
Probing the Associations Between AD and CD andthe Components of BU
Because BU was the personality dimension most strongly asso-ciated with genetic risk for AD and CD, and because it appeared

;:~I:~~;:~~~~~~~0I:~..~
0;;0.'"c5t~;:c3
"g0
:§6~§~...;:~;:~~Q~-0~~~'".~~~'"~~.1:-=~$~;:~'"§.~;:~.1:c5
.£~§~~;:~~~~'";:.0-=~'"..c3
M
...U
.-=
-~.0 ;:
ou ~
~~
=0.~5=:0~~0~~
"0"l;-t3
"l;-.- c
.--°"a"
I.)-c
'"°
.:: "0
.=
'0 c
° e 0e.,-.,
..., ., 6>
>
.-._'~
>
.~
bO"
"'.,.co
Z"
~
~
~-'"
";t'!"'!
VO
\t--"",,,",\0I"
I" I"
NN
~00,,",
\0\0-"'!C
!r-:I
"'°\0on-(X
)I'
I' I"
0\"'\0'";"!"!I
-0-0-,,!~
-q
OO
OO
N""-r-.J.J: i~
O:V
JI
\0-0--0""
NO
~..,N
t-I
I I
-0\",~
'""":
-r--r--"1~
'O:
N.-.,.,
""N~
~..fr~
'"":'"":""!I
N",-
NO
lO
onr--",,-r-
ic;!;J0:-:"1I
Ig-8
i I.:=0uIIU~."~=°in'"O
soSo~.,e0'"",...";I"-=
I!00""'".;e0~'"'a"."o~
:'§""''"~-0II~~.9u..sS=.,t:=eo~=.,."~.c'"=0=."='"o~Q
)=.,~.,o~'6."'"~.""U05~'"~e."8"."2!e0~~~~eo~'"~
0'a
\i to
-.,~
05
GE
NE
S, P
ER
SO
NA
LrrY, A
ND
ALC
OH
OL D
EP
EN
DE
NC
E
~'S~~~~:3
~~~~~~~.9;~~.~~~~.6-...~~~~:3~~~~~.,~...~
~~.,
ist~~a~~13~~~]~~~"0~~~~.5~
.,~
~
.-~13 .,.-~...~~
E
O.~
is~
c.~
.-~
-~
~
~~
. ~.,
~~
Q,.
~'- ~
~
t: ~
u ~
~
:c~~
~
~
.,E
--Q,.~
"uc"-g8-"'tI'0.c0u< ..u"E£'6t)~'"=0u
I:.,~ 0=.,E0~ "0"c:B=U
cu
~ c:.,e0~ ~c~0u
=0";n=.,~:a?;-:a=§.,~ .,~,5~t1J
0~or)0\ ~8'O
J'"~ u~on0\ ~..e"='"t1J
u~~ u~II)0\ ~eO;::'"~ u~In'"~8.~IIJ Q
)'.u,5~~ -u~or)0\
?;-g?;-.- c.--0-;(U
u-c
..0.=
-5.p
'0 c
0 E
:I
E,,-
" e
" "
0;..
; .-.p;..~
(U
(U
.~
0II.c0
Z" "
~
~
""'V~
OO
N
NInIn
--~iiJ88-:
""8
0\~
.00:1:
~or\~
NO
r--
i~~
t-8t-
~
."'1
..r N
-o",~
,(-bqq"!
""8V
)0;
.r')
~~
~i.~
~8~
"!
Og
lr\~
.~
I-I-NN
Ol-
I 8"
I-V
I~
"~
"'8
1-
q "1
NM
O-0""iJ:~C
1~C
'!
.,uc.,"0'-=c0uII
U~.g01)c"U
;
"§-5"~.,e0'".;";Q.
C"~CO
")00C
O")
Me0.t:~""0">'6.SCO
")onv..ISII~.,;
Bu~'3c:.,toc:8.>c.,]~'"c:0c:"0c:.u"~Vc.,01)
.,"~-:g.u"0.g"]~-5'""OJ
"00e"0.,u""0~e.g~~e.~'"~
.~oj ~~
.,~
"S
129
130 SLUTSKE ET AL.
Table 5Proportions of Genetic Covariation Between Alcohol Dependence and Conduct Disorder RiskAccounted for by Genetic Factors That Also Influenced the Assessed Personality Dimensions
Men Women Combined
.08
.00
.85
.01-.24
.00-.15.54-1.00
.22
.00
.93
.07-.60
.00-.02
.59-1.00
.13
.00
.88
.05-.29
.00-.04
.64-1 .00
Note. Estimates are from reduced models that included additive genetic and nonshared environmental factors.N = 6,453 individuals from 3,383 twin pairs, some with missing data. CI = confidence interval.
All three BU scales accounted for a significant ~rcentage of thegenetic covariation between AD and CD; Novelty Seeking, Psy-choticism, and Lie accounted for 62% (95% CI = 43%-88%),30% (95% CI = 14%-55%), and 59% (95% CI = 42%-82%) ofthe genetic covariation between AD and CD, res~ctively. NoveltySeeking, ¥(1) = 23.40, P < .001, and Lie, ¥(1) = 5.86, p = .015,
contributed incremental genetic covariation over and above thataccounted for by the other two scales, but Psychoticism did not,¥(1) = 0.65, p = .420.
Discussion
In a community-based sample of 3,383 adult Australian twinpairs, genetic influences on personality dimensions accounted fora substantial proportion of the genetic diathesis for AD. Althoughour results are not surprising given the consistency of the indirectevidence from previous research, this study is the first to directlyexamine and quantify the extent to which personality dimensionsshare genetic risk factors with AD.
BU and Genetic Risk for AD
As expected, BU was the personality dimension that was moststrongly associated with AD. Although the contribution of BU toAD risk could be minimized by noting that it accounted for only16% of the overall variation, the contribution of BU to AD riskwas of greater significance when considered from a genetic per-spective. In the present study, BU accounted for about 40% of thegenetic variation in AD risk. In particular, the BU componentsof impulsivity (as measured by the TPQ Novelty Seeking scale)and interpersonal exploitativeness (as measured by the reversedEPQ-R Lie scale) each accounted for unique genetic variation inAD risk. The results of the present study, considered in the contextof the cumulative evidence from longitudinal studies linking ear-lier BU with later AD (Caspi et al., 1997; Cloninger et al., 1988;Loperet al., 1973; Zucker & Lisansky Gomberg, 1986) and studiesof offspring of alcoholics identifying elevations in BU amongindividuals at risk for AD (e.g., Finn et al., 2000; Sher at al., 1991),provide further support for the theory that the genetic diathesis forAD is partially mediated by the personality dimension of BUtLIomnger, I9lS/a; Ianer, I9lSlS; Ianer et al., I~!S:); £UClcerman,1987). Several mechanisms have been advanced to explain thecausal link between genetically influenced variation in BU andfuture AD (Sher et al., 1999). For example, higher levels of BUmay indirectly influence AD risk via the social milieu by leading
to be a more heterogeneous construct than the other two dimen-sions, we conducted a supplementary set of complete-data analysesof the three component scales of BU (i.e., TPQ Novelty Seeking,EPQ-R Psychoticism, and EPQ-R reverse-scored Lie). Item-levelfactor analyses revealed that the three highest loading items ofNovelty seeking were similar in that they were strong markers ofthe BU component of impulsivity (highest loading item [scoredfalse]: "I usually think about all of the facts in detail before I makea decision"). The two highest loading items of Psychoticism werestrong markers of the BU component of rebelliousness or socialnonconformity (highest loading item: "Do you prefer to go yourown way rather than act by the rules?"), and the four highestloading items of the reverse-scored Lie scale were strong markersof the BU component of interpersonal exploitativeness (highestloading item: "Have you ever taken advantage of someone?").
As expected, all three BU scales were significantly associatedwtth nSK ror AU t correlanons ot .50 tor Novelty ~eektng, .22 torPsychoticism, and .34 for reverse-scored Lie); the correlations ofNovelty Seeking and Lie with AD were significantly larger thanthe correlation of Psychoticism with AD, y(l) > 6.89, p < .01.The genetic correlations between the BU scales and AD were .59(95% CI = .47-.71) for Novelty Seeking, .29 (95% CI = .14-.43)for Psychoticism, and .48 (95% CI = .37-.59) for reverse-scoredLie, suggesting that genetic influences contributing to variation inNovelty Seeking, Psychoticism, and Lie scale scores accounted for35%,8%, and 23%, respectively, of genetic susceptibility for AD.Novelty Seeking and Lie scores contributed incremental geneticvariation in AD over and above that accounted for by the othertwo scales, but no incremental variation was contributed byPsychoticism.
Similarly, all three BU scales were significantly associated withrisk for CD (correlations of .34 for Novelty Seeking, .26 forPsychoticism, and .44 for reverse-scored Lie); the correlation ofLie with CD was significantly larger than the correlation of Nov-elty Seeking with CD, y(l) = 11.64, P < .001, which wassignificantly larger than the correlation of Psychoticism with CD,y(l) = 5.81, p = .016. The genetic correlations between the BUscales and CD were .56 (95% CI = .41-.71) for Novelty Seeking,.41 (95% CI = .26-.56) for Psychoticism, and .55 (95% CI =.43-.66) for reverse-scored Lie, suggesting that genetic influencesconmbUtlng to variaUon In Novelty seeKing, f'sycnouclsm, anaLie scale scores accounted for 31%, 17%, and 30%, respectively,of genetic susceptibility for CD. All three BU scales contributedincremental genetic variation in CD over and above that accountedfor by the other two scales.

GENES. PERSONALITY. AND ALCOHOL DEPENDENCE 131
sideration the particular measure of NE that has been used; it islikely that measures that include hostility, anger, aggression, orimpulsivity will yield a stronger association than studies that usenarrower measures of NE. In the present study, items tappinghostility, anger, aggression, and impulsivity were subsumed underthe higher order dimension of BU (although our measure of BUcontained few hostility, anger, or physical aggression items) andnot under the higher order dimension of NE.
to association with deviant heavy-drinking peers (Martin, Lynch,Pollock, & Clark, 2000; Sher et al., 1999), and higher levels of BUmay also influence AD risk more directly by leading to impaireddecisions about drinking (Martin et al., 2000; Sher et al., 1999) andan inability to inhibit alcohol seeking even in the presence ofnegative consequences (Martin et al., 2<XX».
There are also several noncausal explanations consistent withthe results of the present study. Traits that are associated withgenetic variation in AD risk might merely represent alternatemanifestations or different developmental stages of the same un-derlying disorder. Although this is a reasonable explanation for thegenetic association of AD with CD, and even of AD with thereversed EPQ-R Lie scale (which might be considered an indicatorof mild antisocial tendencies), it cannot easily explain the geneticassociation of AD with TPQ Novelty Seeking, which is a purermeasure of personality distinct from "the behavior of the addict"(Nathan, 1988). Another explanation is that there are one or moregenes that have pleiotropic effects on a range of traits, includingAD, CD, and the personality dimension of BU, possibly throughtheir effect on common underlying psychobiological processes.Regardless of whether the genetic association between BU and ADis causal or noncausal, the results of the present study clearlysuggest that a potentially fruitful strategy for discovering suscep-tibility genes for AD will be to identify genes that are associ-ated with individual differences in BU-related traits such as
impulsivity.
PE and Genetic Risk for AD
Previous research has been even more inconsistent concerningthe role of PE in the etiology of AD, in that studies have failed todetect an association between PE and AD (McGue et al., 1997),have shown a positive association between PE and AD (Sher,Bartholow, & Wood, 2000; Prescott, Neale, Corey, & Kendler,1997, obtained a positive association between extraversion andproblem drinking), and have shown a negative association betweenPE and AD (Caspi et al., 1997). Sher et al. (1999) suggested threeexplanations for these disparate results. First, extraversion/socia-bility may be positively related to problem drinking but inverselyrelated to more severe levels of AD. Second, PE may be morestrongly associated with AD among women than among men.Third, traits subsumed under the category of PE may be moreaccurately conceptualized as reflecting aspects of BU. The presentstudy did not address the first explanation, but our results areconsistent with the latter two. The correlation between PE and ADwas significantly larger among women than among men, and thegenetic association between PE and AD was no longer significantafLl:r a\:Cuunllng fur genl:Uc vanauon annOulaOle 10 tlU. 1 nus, meassociation between PE and AD may be dependent on the measureof PE used, with studies using measures that emphasize liveliness(such as the EPQ-R [Eysenck et al., 1985] and the NEO Person-ality Inventory [Costa & McCrae, 1992)) and excitement seeking(such as the NEO Personality Inventory [Costa & McCrae, 1992])being more likely to find positive associations than those usingmeasures that do not emphasize these components (such as the
Multidimensional Personality Questionnaire; Tellegen. 1982).
NE and Genetic Risk for AD
Sex Differences and Genetic Risk for AD
The results of this study suggest that there are more similaritiesthan differences in the inheritance of AD among men versuswomen. We confirmed our previous finding from this sample thatAD is equally heritable among men and women (Heath, Bucholz,et aI., 1997), which is consistent with the results of our reanalysesof earlier studies examining sex differences in the heritability ofAD (Heath, Slutske, & Madden, 1997). AD risk was equallycorrelated with BU in men and women, and the personality di-mension accounting for the largest proportion of genetic variationin AD risk for both men and women was BU. Clearly, these resultsare contradictory to the widespread notions (e.g., Cloninger,1987a) that AD is less heritable amon~ women than amon~ menand that AD is primarily associated with NE among women andBU among men. In fact, NE accounted for a portion of the geneticrisk for AD among men but not among women, and BU accountedfor significantly more of the genetic risk for AD among womenthan among men.
Previous research has been inconsistent concerning the role ofNE in the etiology of AD. One research design issue that mayaffect the magnitude of the association of NE with AD is whetherNE is measured contemporaneously with an active episode of AD.It has long been argued that elevated levels of NE among individ-uals with AD relative to controls are more likely to be a conse-quence of AD than a cause (Schuckit, 1986). If AD is a cause ofelevated levels of NE, then remission of AD may be followed byreductions in levels of NE (Pettinati, Sugarman, & Maurer, 1982).In other words, NE may be a correlate of "statelike" aspects of ADrather than the underlying "traitlike" risk for AD. In the presentstudy., we minimized the possibility of discovering personalitycorrelates of "statelike" aspects of AD by focusing on lifetimeassessments of AD and by assessing personality dimensions andAD at different measurement occasions 4 years apart. The associ-ation between NE and AD that we obtained was much weaker thanthe association between BU and AD. Nonetheless, NE accountedfor a significant albeit modest 4% of the genetic variation in ADrisk among men.
Another possible explanation for the inconsistent findings on theassociation between NE and AD is the extent to 'Nhich the measureof NE used assesses the traits of hostility, anger, aggression, orimpulsivity. For example, in the three-factor model of Tellegen(1982), aggression is included under the higher order dimension ofNE, and aggression is more strongly associated with AD than arethe other components of NE (Caspi et al., 1997; McGue et al.,1997). Similarly, hostility and impulsivity are included under thehigher order dimension of neuroticism in the NEO PersonalityInventory (Costa & McCrae, 1992). When interpreting studies ofthe association of NE with AD, it is important to take into con-

132 SLUTSKE ET AL.
Personality and Common Genetic Risk for AD and CD variation in earlier- versus later-onset AD. These developmentalquestions remain to be addressed in future prospective twinstudies.Risk factors for psychopathology can be classified according to
whether they increase the risk for psychopathology in general("common risk factors"), increase the risk for a class of similardisorders ("broadband-specific risk factors"), or increase the riskfor a single disorder ("narrowband-specific risk factors"; Garber &Hollon, 1991; Weiss, Susser, & Catron, 1998). The extent ofco-occurrence between psychiatric disorders can be explained bythe extent to which they share common or broadband-specific riskfactors. Recent twin research suggests that genetic risk factors are,in many cases, the predominant cause of co-occurrence of psychi-atric disorders (e.g., Kendler et al., 1995; Slutske et al., 2000).Therefore, genetic research will be especially important in identi-fying the common and broadband-specific risk factors for psycho-pathology and for understanding the mechanisms underlying thecomorbidity between psychiatric disorders. The present study rep-resents a first step by demonstrating that genetically influenceddimensions of personality such as BU may explain much of thegenetic basis of the greater-than-chance co-occurrence of AD andCD. Although personality may contribute only modestly to anysingle psychiatric disorder, it may be the predominant contributorto the comorbidity between psychiatric disorders.
References
Specific Genetic Risk for AD
The analyses presented here have demonstrated a strong geneticcorrelation between BU and AD risk, but they also indicate that asubstantial proportion of the total genetic variation in AD risk isnot accounted for by such personality factors (Heath, Slutske, &Madden, 1997); we estimated that 60% (95% CI = 460/0-72%) ofthe genetic variation in AD risk for men and women could not beaccounted for by genetic variation in the personality dimensionsincluded in the present study. Genetically determined differencesin level of response to alcohol (e.g., subjective intoxication orstatic ataxia after a standardized dose of alcohol; Schuckit &Smith, 1996) appear to account for additional genetic variation(Heath et al., 1999, 2001). In the future, better characterization ofthe interactive effects of personality differences and differentialreactions to alcohol may further enhance our understanding of therole of personality differences and other genetic risk factors in thedevelopment of AD.
Limitations
The present study should be interpreted in light of two mainlimitations that may have affected the results. First, the sampleinvolved members of a volunteer twin registry, probably under-representing those with a history of severe or persisting AD orantisocial behavior. Second, the data were cross-sectional, andboth lifetime AD and CD diagnoses were based on retrospectivereports. The advantage of the retrospective method used in thepresent cross-sectional study is that the associations among AD,CD, and dimensions of personality could be examined in a samplenearly through the age of risk for both disorders. A major disad-vantage is that it precluded our ability to examine potentiallyimportant developmental changes in mediation of the relationshipsamong AD, CD, and dimensions of personality or to assesswhether different dimensions of personality might explain genetic
American Psychiatric Association. (1987). Diagnostic and statistical man-ual of mental disorders (3rd ed., rev.). Washington, DC: Author.
Bucholz, K. K., Cadoret, R., Cloninger, C. R., Dinwiddie, S. H., Hessel-brock, V. M., Nurnberger, J. I., Jr., Reich, T., Schmidt, I., & Schuckit,M. A. (1994). A new semi-structured psychiatric interview for use in
genetic linkage studies: A repon on the reliability of the SSAGA.Journal of Studies on Alcohol, 55, 149-158.
Carey, G., & DiLalla, D. L. (1994). Personality and psychopathology:Genetic perspectives. Journal of Abnonnal Psychology, 103, 32-43.
Caspi, A., Begg, D., Dickson, N., Harrington, H. -L., Langley, J., Moffitt,T. E., & Silva, P. A. (1997). Personality differences predict health-riskbehaviors in adulthood: Evidence from a longitudinal study. Journal C!fPersonality and Social Psychology, 73, 1052-1063.
Cloninger, C. R. (I 987a). Neurogenetic adaptive mechanisms in alcohol-ism. Science, 236,410-416.
Cloninger, C. R. (1987b). A systematic method for clinical description andclassification of personality variants: A proposal. Archives of GeneralPsychiatry, 44, 573-588.
Cloninger, C. R., Przybeck, T. R., & Svrakic, D. M. (1991). The Tridi-mensional Personality Questionnaire: U.S. normative data. Psychologi-cal Reports, 69, 1047-1057.
Cloninger, C. R., Sigvardsson, S., & Bohman, M. (1988). Childhoodpersonality predicts alcohol abuse in young adults. Alcoholism: Clinicaland Experimental Research. 12, 494-505.
Costa, P. T., Jr., & McCrae, R. R. (1992). Revised NED PersonalityInventory (NED-PI-R) and NED Five Factor Inventory (NED-FFl)professional manual. Odessa, FL.: Psychological Assessment Resources.
Duffy, D. L. (1994). Asthma and allergic diseases in Australian twins andtheir families. Unpublished doctoral dissenation, Queensland Univer-
sity, Brisbane, Queensland, Australia.Eaves, L. J., Eysenck, H. J., & Manin, N. G. (1989). Genes, culture and
personality: An empirical approach. New York: Academic Press.Eysenck, H. J., Eysenck, S. B. G., & Barrett, P. (1985). A revised version
of the Psychoticism scale. Personality and Individual Differences, 6,21-29.
Finn, P. R., Sharkansky, E. J., Brandt, K. M., & Turcotte, N. (2000). Theeffects of familial risk, personality, and expectancies on alcohol use andabuse. Journal of Abnonnal Psychology, 109, 122-133.
Garber, J., & Hollon, S. D. (1991). What can specificity designs say aboutcausality in psychopathology research? Psychological Bulletin, lID,129-136.
Heath, A. C., Bucholz, K. K., Madden, P. A. F., Dinwiddie, S. H., Slutske,W. S., Bierut, L. J., Statham, D. J., Dunne, M. P., Whitfield, J., &Martin, N. G. (1997). Genetic and environmental contributions to alco-hol dependence risk in a national twin sample: Consistency of findingsin women and men. Psychological Medicine, 27, 1381-1396.
Heath, A. C., Cloninger, C. R., & Manin, N. G. (1994). Testing a model forthe ~enetic structure of personality: A comparison of the personalitysystems of Cloninger and Eysenck. Journal of Personality and SocialPsychology, 66, 762-775.
Heath, A. C., Madden, P. A. F, Bucholz, K. K., Bierut, L. J., Whitfield,J. B., Dinwiddie, S. H., Slutske, W. S., Statham, D. J., & Manin, N. G.(2001). To~_do " .noloo..l- op;do.n;oloSY oE ..Ioohol dopondonoo,Analyzing the interplay of genetic and environmental risk-factors. Brit-ish Journal of Psychiatry, 178(Suppl. 40), S33-S40.
Heath, A. C., Madden, P. A. F., Bucholz, K. K., Dinwiddie, S. H., Slutske,W. S., Bierut, L. J., Rohrbaugh, J. W., Statham, D. J., Dunne, M. P.,Whitfield, J. B., & Manin, N. G. (1999). Genetic differences in alcohol
GENES, PERSONALffY, AND ALCOHOL DEPENDENCE 133
Sher, K. J., Bartholow, B. D., & Wood, M. D. (2000). Personality andsubstance use disorders: A prospective study. Journal of Consulting andClinical Psychology, 68, 818-829.
Sher, K. J., & Trull, T. J. (1994). Personality and disinhibitory psychopa-thology: Alcoholism and antisocial personality disorder. Journal ofAbno17na1 Psychology, 103,92-102.
Sher, K. J., Trull, T. J., Bartholow, B. D., & Vieth, A. (1999). Personalityand alcoholism: Issues, methods, and etiological processes. In K. E.Leonard & H. T. Blane (Eds.), Psychological theories of drinking andalcoholism (pp. 54-105). New York: Guilford Press.
Sher, K. J., Walitzer, K. S., Wood, P. K., & Brent, E. E. (1991). Charac-teristics of children of alcoholics: Putative risk factors, substance use andabuse, and psychopathology. Journal of Abno17na1 Psychology, 100,427-448.
Slutske, W. S., Eisen, S. A., True, W. R., Lyons, M. J., Goldberg, J., &Tsuang, M. T. (2000). Common genetic vulnerability for pathologicalgambling and alcohol dependence in men. Archives of General Psychi-atry, 57, 666-673.
Slutske, W. S., Heath, A. C., Dinwiddie, S. H., Madden, P. A. F., Bucholz,K. K., Dunne, M. P., Statham, D. J., & Martin, N. G. (1997). Modelinggenetic and environmental influences in the etiology of conduct disor-der: A study of 2,682 adult twin pairs. Journal of Abnormal Psychology,/06, 266-279.
Slutske, W. S., Heath, A. C., Dinwiddie, S. H., Madden, P. A. F., Bucholz,K. K., Dunne, M. P., Statham, D. J., & Martin, N. G. (1998). Commongenetic risk factors for conduct disorder and alcohol dependence. Jour-nal of Abno17na1 Psychology, 107, 363-374.
Tarter, R. E. (1988). Are there inherited behavioral traits that predispose tosubstance abuse? Journal of Consulting and Clinical Psychology, 56,189-196.
Tarter, R. E., Alterman, A. I., & Edwards, K. L. (1985). Vulnerability toalcoholism in men: A behavior-genetic perspective. Journal of Studieson Alcohol. 46. 329-356.
Tellegen, A. (1982). Brief manual of the Multidimensional PersonalityQuestionnaire. Unpublished manuscript.
Weiss, B., Susser, K., & Catron, T. (1998). Common and specific featuresof childhood psychopathology. Journal of Abno17na1 Psychology, 107,118-127.
Zucker, R. A., & Lisansky Gomberg, E. (1986). Etiology of alcoholismreconsidered: The case for a biopsychosocial process. American Psy-chologist, 41, 783-793.
Zuckerman, M. (1987). Is sensation seeking a predisposing trait for alco-holism? In E. Gottheil, K. A. Druley, S. Pashko, & S. P. Weinstein(Eds.), Stress and addiction (pp. 283-301). New York: Brunner/Mazel.
Zuckerman, M., Kuhlman, D. M., & Camac, C. (1988). What lies beyondE and N? Factor analyses of scales believed to measure basic dimensionsof personality. Journal of Personality and Social Psychology, 54, 96-107.
Zuckerman, M., Kuhlman, D. M., Joireman, J., Teta, P., & Kraft, M.(1993). A comparison of three structural models for personality: The BigThree, the Big Five, and the Alternative Five. Journal of Personality andSocial Psychology, 65, 757-768.
Received August 22, 2000Revision'received June 21, 2001
Accepted June 27, 2001 .
sensitivity and the inheritance of alcoholism risk. Psychological Medi-cine, 29, 1069-1081.
Heath, A. C., Slutske, W. S., & Madden, P. A. F. (1997). Gender differ-ences in the genetic contribution to alcoholism risk and to alcohol
consumption patterns. In R. W. Wilsnack & S. C. Wilsnack (Eds.),Gender and alcohol (pp. 114-149). New Brunswick, NJ: Rutgers Uni-versity Press.
Jardine, R., & Martin, N. G. (1984). Causes of variation in drinking habitsin a large twin sample. Acta Geneticae Medicae et Gemellologicae, 33,435-450.
Joreskog, K. G., & Sorbom, D. (1996). PREUS 2: User's reference guide.Chicago: Scientific Software International.
Kendler, K. S., Walters, E. E., Neale, M. C., Kessler, R. C., Heath, A. C.,& Eaves, L. J. (1995). The structure of the genetic and environmentalrisk factors for six major psychiatric disorders in women: Phobia,
generalized anxiety disorder, panic disorder, bulimia, major depression,and alcoholism. Archives of General Psychiatry, 52, 374-383.
Krueger, R. F., Caspi, A., & Moffitt, T. E. (2000). Epidemiologicalpersonology: The unifying role of personality in population-based re-search on problem behaviors. Journal of Personality, 68, 967-998.
Little, R. J.. A., & Rubin, D. B. (1987). Statistical analysis with missingdata. New York: Wiley.
Loehlin, J. C. (1992). Genes and environment in personality development.Newbury Park, CA: Sage.
Loehlin, J. C. (1996). The Cholesky approach: A cautionary note. BehaviorGenetics, 26, 65-69.
Loper, R. G., Karnmeier, M. I., & Hoffman, H. (1973). MMPI character-istics of college freshman males who later became alcoholics. Journal ofAbnormal Psychology, 82, 159-162.
Martin, C. S., Lynch, K. G., Pollock, N. K., & Clark, D. B. (2000). Genderdifferences and similarities in the personality correlates of adolescentalcohol problems. Psychology of Addictive Behaviors, 14, 121-133.
M,,(';"p M ""'t.~" W T"ylnr 1 T NT T,,"nnn W n (1007) P,-ronnol;tyand substance use disorders: I. Effects of gender and alcoholism subtype.Alcoholism: Clinical and Experimental Research, 21,513-520.
Nathan, P. E. (1988). The addictive personality is the behavior of theaddict. Journal of Consulting and Clinical Psychology, 56, 183-188.
Neale, M. C., Boker, S. M., Xie, G., & Maes, H. H. (1999). Mx: Statisticalmodeling (5th ed.). Richmond: Department of Psychiatry, Medical Col-lege of Virginia.
Neale, M. C., & Cardon, L. R. (1992). Methodology for genetic studies oftwins and families. Dordrecht, the Netherlands: Kluwer Academic.
Pettinati, H. M., Sugarman, A., & Maurer, H. S. (1982). Four-year MMPIchanges in abstinent and drinking alcoholics. Alcoholism: Clinical and
Experimental Research, 6, 487-494.Prescott, C. A., Neale, M. C., Corey, L. A., & Kendler, K. S. (1997).
Predictors of problem drinking and alcohol dependence in a population-based sample of female twins. Journal of Studies on Alcohol, 58,
167-181.Schuckit, M. A. (1986). Genetic and clinical implications of alcoholism
and affective disorder. American Journal of Psychiatry, 143, 140-147.Schuckit, M. A., & Smith, T. L. (1996). An 8-year follow-up of 450 sons
of alcoholic and control subjects. Archives of General Psychiatry, 53,
202-210.Sher, K. J. (1991). Children of alcoholics: A critical appraisal of theory
and research. Chicago: University of Chicago Press.