Embed Size (px)
Citation preview
Predicting Student PerformanceClassification
Recommendation SystemConclusion
Personalized Recommendation System for Students by GradePrediction
Pavan Kotha
113050010
Master Thesis
Under the guidance ofProf. D.B PHATAK
Computer Science Department,IIT Bombay
1 / 66

Predicting Student PerformanceClassification
Recommendation SystemConclusion
Outline
Motivation
Problem Statement
Prediction of Endsem Marks and Grades
Theoretical Model for personalized recommendation system
Conclusion and Future Work
2 / 66
Predicting Student PerformanceClassification
Recommendation SystemConclusion
Motivation
Different learners - diff modes of learning,educationalbackgrounds,previous experience,intelligence
Different people process knowledge in different ways.So,different peoplewill relate to a particular learning resource in different ways.
Human instructors can learn which style of presentation suits which learnerand adjust their mode of presentation.
Different learners need to focus on different material to achieve the samelearning objective.
Need to classify into different Learner types(Achiever,Struggler etc)
3 / 66
Predicting Student PerformanceClassification
Recommendation SystemConclusion
Problem Statement
Proposed learning system:Gives learning support based on predicted gradeof student.
Different learning proposals provided to students in feedback according tostudent target class.
4 / 66
Predicting Student PerformanceClassification
Recommendation SystemConclusion
Need for PredictionRegression
Need for Prediction
ML in education- to study the data available in the educational field, bringout the hidden knowledge from it
Instructors can identify weak students, help them to score better marks inendsem by giving additional practise questions.
Appropriate measures - taken to improve their performance in endsem i.eprovide customized references so that he can read those materials andimprove his grade.
Eg:Additional customized practise questions, different text books fordifferent learners etc
5 / 66
Predicting Student PerformanceClassification
Recommendation SystemConclusion
Need for PredictionRegression
Learning from Data
ML branch of AI - deals with study of systems that can learn from data.
ML focuses on prediction based on known properties learned from thetraining data.Eg:Email (spam,non spam)
So learn from one offering of CS101 course and predict marks and gradesof another offering
6 / 66
Predicting Student PerformanceClassification
Recommendation SystemConclusion
Need for PredictionRegression
Training Data
Statistical data is represented in terms of tuples
Data consists of many attributes
Training data D = {(x1, y1), .., (xN , yN)}
Target Attribute to be predicted for test data
Training goal: To learn function f (x) → y s.t prediction error on unseeninstances is small
Learner extracts about the distribution.
7 / 66
Predicting Student PerformanceClassification
Recommendation SystemConclusion
Need for PredictionRegression
Proposed System
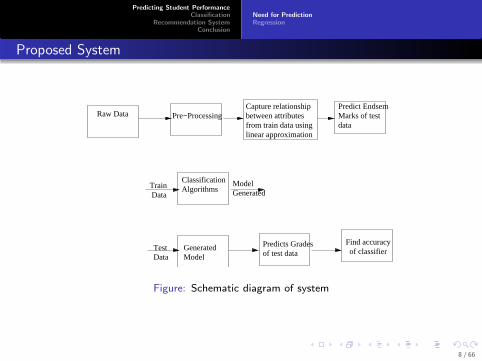
Raw Data Pre−Processing between attributesfrom train data usinglinear approximation
Predict EndsemMarks of testdata
Train Data
ClassificationAlgorithms
TestData
GeneratedModel
ModelGenerated
Predicts Gradesof test data of classifier
Find accuracy
Capture relationship
Figure: Schematic diagram of system
8 / 66
Predicting Student PerformanceClassification
Recommendation SystemConclusion
Need for PredictionRegression
Predicting Endsem Marks
Attributes taken: assignment, quiz, midsem. Exclude project.
Don’t have any information about the distribution of data
We can find mean,variance and correlation between attributes from thegiven training data
Relationship between the attributes.eg: Midsem good marks, mostlyendsem also good marks.
Need to capture such a relationship from training data
9 / 66
Predicting Student PerformanceClassification
Recommendation SystemConclusion
Need for PredictionRegression
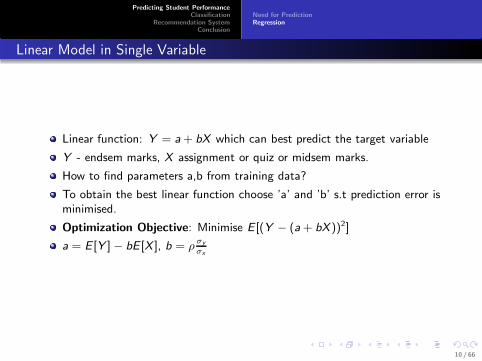
Linear Model in Single Variable
Linear function: Y = a+ bX which can best predict the target variable
Y - endsem marks, X assignment or quiz or midsem marks.
How to find parameters a,b from training data?
To obtain the best linear function choose ’a’ and ’b’ s.t prediction error isminimised.
Optimization Objective: Minimise E [(Y − (a+ bX ))2]
a = E [Y ]− bE [X ], b = ρσy
σx
10 / 66
Predicting Student PerformanceClassification
Recommendation SystemConclusion
Need for PredictionRegression
Linear Model in Single Variable(Example)
4
5
6
7
8
9
10
1 2 3 4 5 0x
y
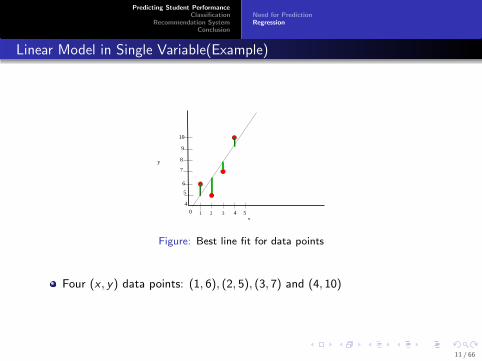
Figure: Best line fit for data points
Four (x , y) data points: (1, 6), (2, 5), (3, 7) and (4, 10)
11 / 66
Predicting Student PerformanceClassification
Recommendation SystemConclusion
Need for PredictionRegression
Linear Model in Single Variable(Example) contd.
We need to find a line y = a+ bx that best fits these four points(trainingdata).
Best approximation: minimize the sum of squared differences(i.e error)between the predicted data values and their corresponding actual values.
Error functionS(a,b) = [6− (a+b)]2 +[5− (a+2b)]2 +[7− (a+3b)]2 +[10− (a+4b)]2
Equate partial derivatives of S(a,b) with respect to a, b to zero. We geta = 3.5, b = 1.4
Best fit line is y = 3.5 + 1.4x
12 / 66
Predicting Student PerformanceClassification
Recommendation SystemConclusion
Need for PredictionRegression
Linear Model in Single Variable(Example) contd.
endsem=f (midsem)
endsem=f (assignment)
endsem=f (quiz)
Taken average of three endsem marks
13 / 66
Predicting Student PerformanceClassification
Recommendation SystemConclusion
Need for PredictionRegression
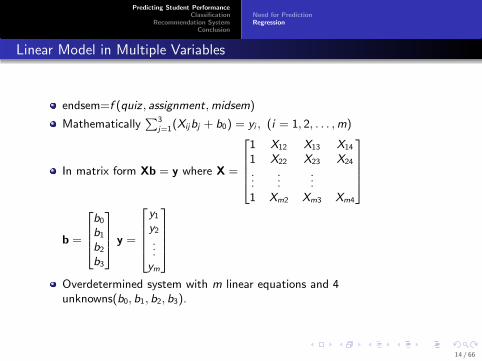
Linear Model in Multiple Variables
endsem=f (quiz , assignment,midsem)
Mathematically∑3
j=1(Xijbj + b0) = yi , (i = 1, 2, . . . ,m)
In matrix form Xb = y where X =
1 X12 X13 X14
1 X22 X23 X24
......
...1 Xm2 Xm3 Xm4
b =
b0b1b2b3
y =
y1y2...ym
Overdetermined system with m linear equations and 4unknowns(b0, b1, b2, b3).
14 / 66
Predicting Student PerformanceClassification
Recommendation SystemConclusion
Need for PredictionRegression
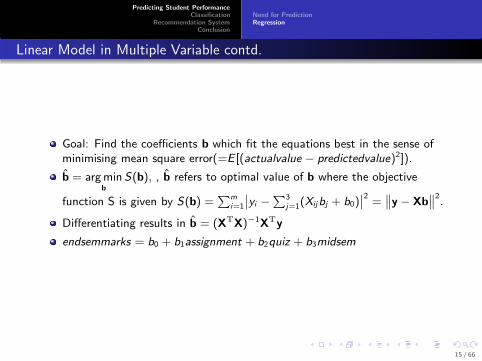
Linear Model in Multiple Variable contd.
Goal: Find the coefficients b which fit the equations best in the sense ofminimising mean square error(=E [(actualvalue − predictedvalue)2]).
b̂ = argminb
S(b), , b̂ refers to optimal value of b where the objective
function S is given by S(b) =∑m
i=1
∣
∣yi −∑3
j=1(Xijbj + b0)∣
∣
2=
∥
∥y − Xb∥
∥
2.
Differentiating results in b̂ = (XTX)−1XTy
endsemmarks = b0 + b1assignment + b2quiz + b3midsem
15 / 66
Predicting Student PerformanceClassification
Recommendation SystemConclusion
Need for PredictionRegression
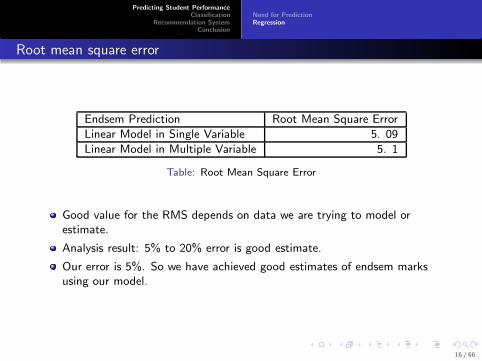
Root mean square error
Endsem Prediction Root Mean Square Error
Linear Model in Single Variable 5. 09
Linear Model in Multiple Variable 5. 1
Table: Root Mean Square Error
Good value for the RMS depends on data we are trying to model orestimate.
Analysis result: 5% to 20% error is good estimate.
Our error is 5%. So we have achieved good estimates of endsem marksusing our model.
16 / 66
Predicting Student PerformanceClassification
Recommendation SystemConclusion
Decision TreesNearest NeighbourLDASVMClassifiers combination
Classification
Classification -type of prediction where predicted variable is binary orcategorical.
Classification methods-decision trees,nearest neighbour,LDA,SVM -applied on educational data for predicting grade in examination
Classifier- mathematical function implemented by classification algorithmthat maps input data to a category.
No single classifier works best on all given problems
Determining a suitable classifier for a given problem is more an art than ascience
Type of classifer to be chosen depends on problem we are trying to solve.
17 / 66
Predicting Student PerformanceClassification
Recommendation SystemConclusion
Decision TreesNearest NeighbourLDASVMClassifiers combination
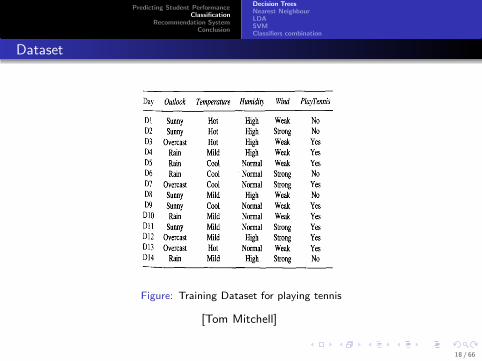
Dataset
Figure: Training Dataset for playing tennis
[Tom Mitchell]
18 / 66
Predicting Student PerformanceClassification
Recommendation SystemConclusion
Decision TreesNearest NeighbourLDASVMClassifiers combination
Play Tennis Dataset
Target attribute to be predicted is Play Tennis
Classification Problem bcz Play Tennis={yes,no}
Learned function is represented by a decision tree
Learned trees can also be represented by if-then rules
19 / 66
Predicting Student PerformanceClassification
Recommendation SystemConclusion
Decision TreesNearest NeighbourLDASVMClassifiers combination
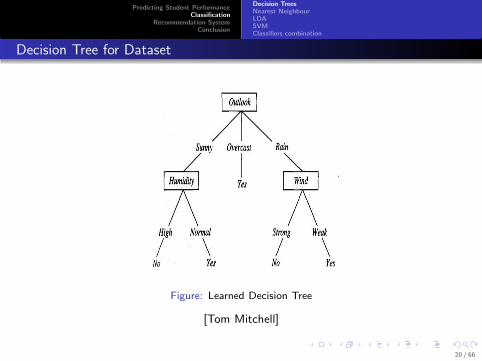
Decision Tree for Dataset
Figure: Learned Decision Tree
[Tom Mitchell]
20 / 66
Predicting Student PerformanceClassification
Recommendation SystemConclusion
Decision TreesNearest NeighbourLDASVMClassifiers combination
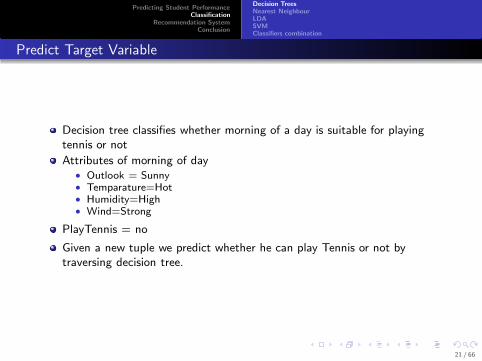
Predict Target Variable
Decision tree classifies whether morning of a day is suitable for playingtennis or not
Attributes of morning of day• Outlook = Sunny• Temparature=Hot• Humidity=High• Wind=Strong
PlayTennis = no
Given a new tuple we predict whether he can play Tennis or not bytraversing decision tree.
21 / 66
Predicting Student PerformanceClassification
Recommendation SystemConclusion
Decision TreesNearest NeighbourLDASVMClassifiers combination
Statistical Test
Statistical test determines how well each attribute alone classifies thetraining examples.
Best attribute is selected to test at the root node of the tree
Training examples are splitted to the branch corresponding to theexample’s value for this attribute.
22 / 66
Predicting Student PerformanceClassification
Recommendation SystemConclusion
Decision TreesNearest NeighbourLDASVMClassifiers combination
Information Gain
Attribute to be tested at a node for classifying examples depends oninformation gain(statistical property) of attribute.
Information gain measures how well a given attribute separates thetraining examples according to their target classification.
23 / 66
Predicting Student PerformanceClassification
Recommendation SystemConclusion
Decision TreesNearest NeighbourLDASVMClassifiers combination
Decision Tree Learning Algorithm
S:Training Examples, Target attribute:c different values.
Entropy of S relative to this c-wise classification:• Entropy(S)=
∑ci=1 −pi log2pi where pi is proportion of S belonging to class i.
• Information gain of attribute A
• Gain(S,A)=Entropy(S)-∑
v∈Values(A)|Sv ||S|
Entropy(Sv ) where Values(A) is
the set of all possible values for attribute A• Sv is the subset of S for which attribute A has value v.
24 / 66
Predicting Student PerformanceClassification
Recommendation SystemConclusion
Decision TreesNearest NeighbourLDASVMClassifiers combination
Learning Algorithm
In given dataset, S is a collection of 14 examples.
Attribute Wind has the values Weak or Strong.
9 positive(i.e play tennis=yes) and 5 negative examples denoted as [9+,5-].
Of these 14 examples, 6 of the positive and 2 of the negative exampleshave Wind = Weak.
25 / 66
Predicting Student PerformanceClassification
Recommendation SystemConclusion
Decision TreesNearest NeighbourLDASVMClassifiers combination
Learning Algorithm
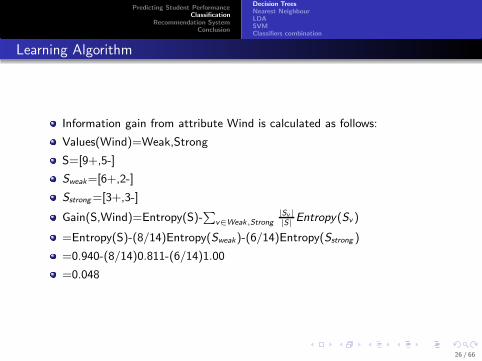
Information gain from attribute Wind is calculated as follows:
Values(Wind)=Weak,Strong
S=[9+,5-]
Sweak=[6+,2-]
Sstrong=[3+,3-]
Gain(S,Wind)=Entropy(S)-∑
v∈Weak,Strong
|Sv ||S|
Entropy(Sv )
=Entropy(S)-(8/14)Entropy(Sweak)-(6/14)Entropy(Sstrong )
=0.940-(8/14)0.811-(6/14)1.00
=0.048
26 / 66
Predicting Student PerformanceClassification
Recommendation SystemConclusion
Decision TreesNearest NeighbourLDASVMClassifiers combination
Information Gains of attributes
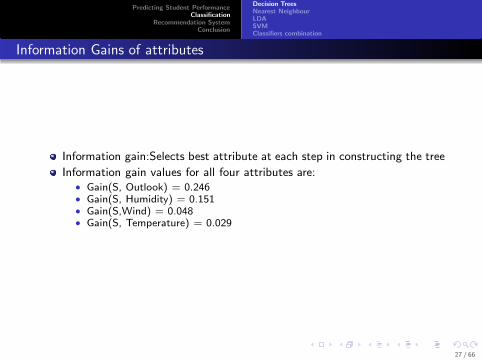
Information gain:Selects best attribute at each step in constructing the tree
Information gain values for all four attributes are:• Gain(S, Outlook) = 0.246• Gain(S, Humidity) = 0.151• Gain(S,Wind) = 0.048• Gain(S, Temperature) = 0.029
27 / 66
Predicting Student PerformanceClassification
Recommendation SystemConclusion
Decision TreesNearest NeighbourLDASVMClassifiers combination
Constructing Tree
Outlook attribute provides the best prediction of the target attribute.
Outlook is selected as the decision attribute for the root node
Training examples - splitted to the branch corresponding to the example’svalue.
Every example Outlook = Overcast is a positive example.
Outlook = Sunny and Outlook = Rain do not have all positive
Repeat procedure using only the training examples associated with thatnode.
28 / 66
Predicting Student PerformanceClassification
Recommendation SystemConclusion
Decision TreesNearest NeighbourLDASVMClassifiers combination
Partial Decision Tree
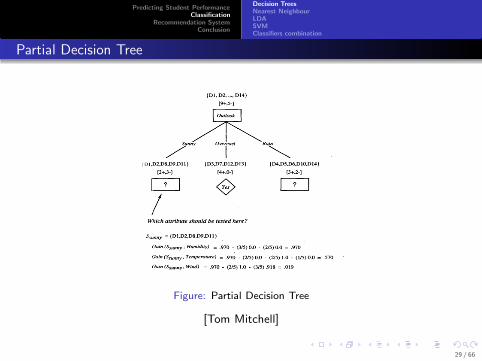
Figure: Partial Decision Tree
[Tom Mitchell]
29 / 66
Predicting Student PerformanceClassification
Recommendation SystemConclusion
Decision TreesNearest NeighbourLDASVMClassifiers combination
Grades prediction using Decision Trees
Showing marks of other students not good-not done in US
Build decision tree using historical information(model works per prof)
Attributes are assignment,quiz, midsem, project, predicted endsem marks.
Student yet to write endsem-know his grade approx
Improve performance in endsem and improve their grade
30 / 66
Predicting Student PerformanceClassification
Recommendation SystemConclusion
Decision TreesNearest NeighbourLDASVMClassifiers combination
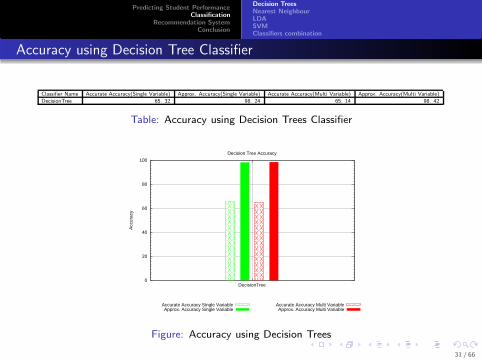
Accuracy using Decision Tree Classifier
Classifier Name Accurate Accuracy(Single Variable) Approx. Accuracy(Single Variable) Accurate Accuracy(Multi Variable) Approx. Accuracy(Multi Variable)
DecisionTree 65. 32 98. 24 65. 14 98. 42
Table: Accuracy using Decision Trees Classifier
0
20
40
60
80
100
DecisionTree
Acc
urac
y
Decision Tree Accuracy
Accurate Accuracy Single VariableApprox. Accuracy Single Variable
Accurate Accuracy Multi VariableApprox. Accuracy Multi Variable
Figure: Accuracy using Decision Trees
31 / 66
Predicting Student PerformanceClassification
Recommendation SystemConclusion
Decision TreesNearest NeighbourLDASVMClassifiers combination
Nearest Neighbour Algorithm
Non-parametric method for classifying objects based on closest trainingexamples.
An object is assigned to the class of its nearest neighbor
Neighbors taken from a set of objects for which the correct classification isknown
Training examples:Vectors in multidimensional feature space each with aclass label.
Test point is classified by assigning the label which is closest to that pointin the training examples.(euclidean distance as distance metric.)
32 / 66
Predicting Student PerformanceClassification
Recommendation SystemConclusion
Decision TreesNearest NeighbourLDASVMClassifiers combination
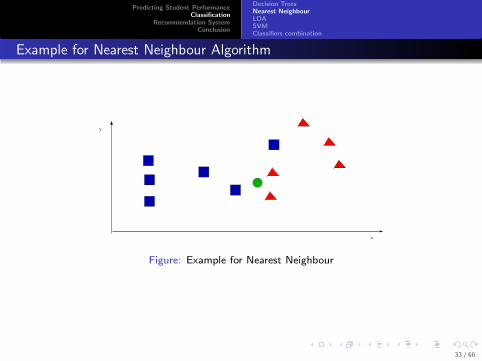
Example for Nearest Neighbour Algorithm
x
y
Figure: Example for Nearest Neighbour
33 / 66
Predicting Student PerformanceClassification
Recommendation SystemConclusion
Decision TreesNearest NeighbourLDASVMClassifiers combination
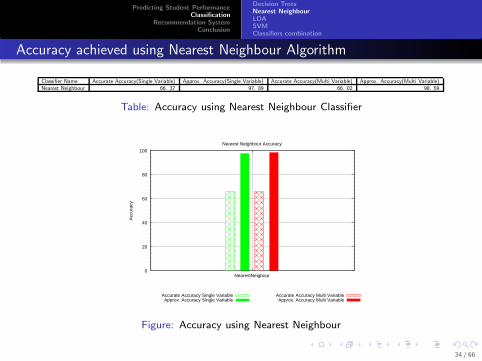
Accuracy achieved using Nearest Neighbour Algorithm
Classifier Name Accurate Accuracy(Single Variable) Approx. Accuracy(Single Variable) Accurate Accuracy(Multi Variable) Approx. Accuracy(Multi Variable)
Nearest Neighbour 66. 37 97. 89 66. 02 98. 59
Table: Accuracy using Nearest Neighbour Classifier
0
20
40
60
80
100
NearestNeigbour
Acc
urac
y
Nearest Neighbour Accuracy
Accurate Accuracy Single VariableApprox. Accuracy Single Variable
Accurate Accuracy Multi VariableApprox. Accuracy Multi Variable
Figure: Accuracy using Nearest Neighbour
34 / 66
Predicting Student PerformanceClassification
Recommendation SystemConclusion
Decision TreesNearest NeighbourLDASVMClassifiers combination
Nearest Neighbour Algorithm with Clustering
Drawback: mis-classification occurs when class distribution is skewed
Distribution of grades is not uniform. Grades like BB and BC dominates
Examples of a more frequent class tend to dominate the prediction of thenew example
Reduced the data set by replacing a cluster of similar grades, regardless oftheir density in the original training data with single point which is itscluster center.
Nearest Neighbour is then applied to the reduced data set.
35 / 66
Predicting Student PerformanceClassification
Recommendation SystemConclusion
Decision TreesNearest NeighbourLDASVMClassifiers combination
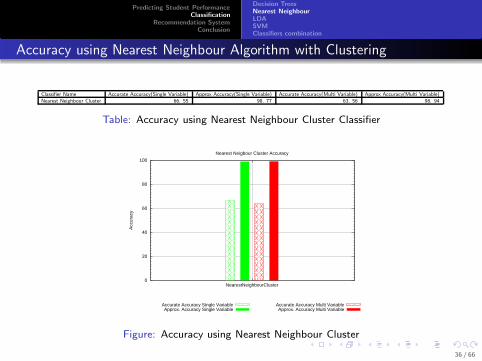
Accuracy using Nearest Neighbour Algorithm with Clustering
Classifier Name Accurate Accuracy(Single Variable) Approx Accuracy(Single Variable) Accurate Accuracy(Multi Variable) Approx Accuracy(Multi Variable)
Nearest Neighbour Cluster 66. 55 98. 77 63. 56 98. 94
Table: Accuracy using Nearest Neighbour Cluster Classifier
0
20
40
60
80
100
NearestNeighbourCluster
Acc
urac
y
Nearest Neigbour Cluster Accuracy
Accurate Accuracy Single VariableApprox. Accuracy Single Variable
Accurate Accuracy Multi VariableApprox. Accuracy Multi Variable
Figure: Accuracy using Nearest Neighbour Cluster
36 / 66
Predicting Student PerformanceClassification
Recommendation SystemConclusion
Decision TreesNearest NeighbourLDASVMClassifiers combination
Linear Discriminant Analysis
LDA - find a linear combination of features which separates two or moreclasses of objects
Training set: Attributes : ~x . Known class label “y”
Classification problem :Find a good predictor for the class “y” given onlyan observation ~x
LDA assumes cpd P(~x |y = 0) ∼ N(~x , ~µ0,Σ) where µ0 is a vectorcontaining means of d-attributes, taking samples whose target label is 0.
P(~x |y = 1) ∼ N(~x , ~µ1,Σ) where µ1 is a vector containing means ofd-attributes, taking samples whose target label is 1.
37 / 66
Predicting Student PerformanceClassification
Recommendation SystemConclusion
Decision TreesNearest NeighbourLDASVMClassifiers combination
Linear Discriminant Analysis(contd)
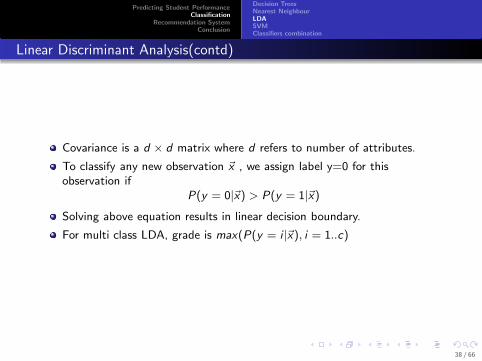
Covariance is a d × d matrix where d refers to number of attributes.
To classify any new observation ~x , we assign label y=0 for thisobservation if
P(y = 0|~x) > P(y = 1|~x)
Solving above equation results in linear decision boundary.
For multi class LDA, grade is max(P(y = i |~x), i = 1..c)
38 / 66
Predicting Student PerformanceClassification
Recommendation SystemConclusion
Decision TreesNearest NeighbourLDASVMClassifiers combination
Accuracy using LDA(contd)
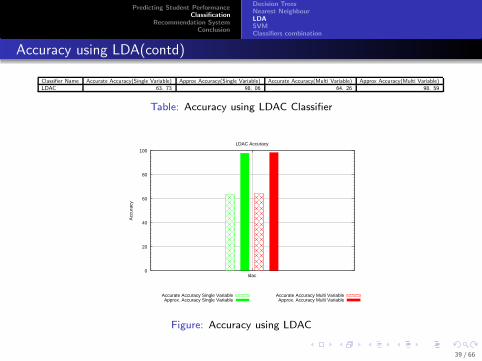
Classifier Name Accurate Accuracy(Single Variable) Approx Accuracy(Single Variable) Accurate Accuracy(Multi Variable) Approx Accuracy(Multi Variable)
LDAC 63. 73 98. 06 64. 26 98. 59
Table: Accuracy using LDAC Classifier
0
20
40
60
80
100
ldac
Acc
urac
y
LDAC Accuracy
Accurate Accuracy Single VariableApprox. Accuracy Single Variable
Accurate Accuracy Multi VariableApprox. Accuracy Multi Variable
Figure: Accuracy using LDAC
39 / 66
Predicting Student PerformanceClassification
Recommendation SystemConclusion
Decision TreesNearest NeighbourLDASVMClassifiers combination
Support Vector Machines
SVM based on the concept of decision planes that define decisionboundaries.
A decision plane separates objects which are having different classmemberships.
Many hyperplanes exist that classify the data
SVM tries to find a hyperplane with maximum margin
Most classification tasks - complex decision boundaries
40 / 66
Predicting Student PerformanceClassification
Recommendation SystemConclusion
Decision TreesNearest NeighbourLDASVMClassifiers combination
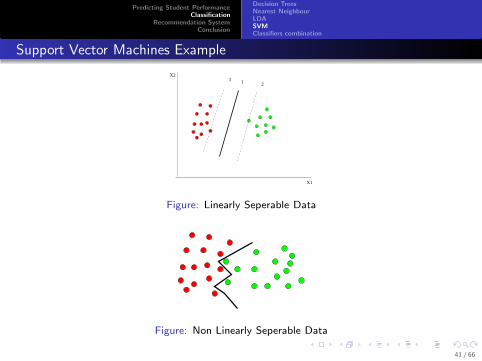
Support Vector Machines Example
1 23
X1
X2
Figure: Linearly Seperable Data
Figure: Non Linearly Seperable Data
41 / 66
Predicting Student PerformanceClassification
Recommendation SystemConclusion
Decision TreesNearest NeighbourLDASVMClassifiers combination
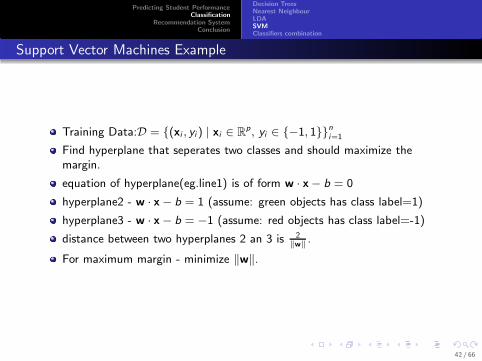
Support Vector Machines Example
Training Data:D = {(xi , yi ) | xi ∈ Rp, yi ∈ {−1, 1}}ni=1
Find hyperplane that seperates two classes and should maximize themargin.
equation of hyperplane(eg.line1) is of form w · x− b = 0
hyperplane2 - w · x− b = 1 (assume: green objects has class label=1)
hyperplane3 - w · x− b = −1 (assume: red objects has class label=-1)
distance between two hyperplanes 2 an 3 is 2‖w‖
.
For maximum margin - minimize ‖w‖.
42 / 66
Predicting Student PerformanceClassification
Recommendation SystemConclusion
Decision TreesNearest NeighbourLDASVMClassifiers combination
Support Vector Machines Example
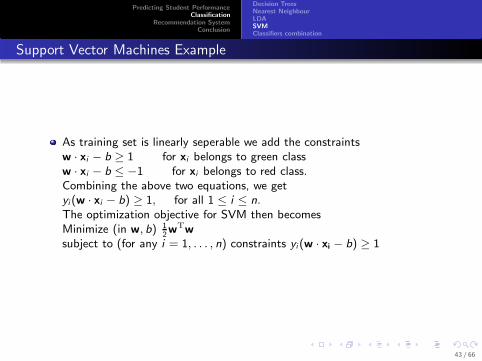
As training set is linearly seperable we add the constraintsw · xi − b ≥ 1 for xi belongs to green classw · xi − b ≤ −1 for xi belongs to red class.Combining the above two equations, we getyi (w · xi − b) ≥ 1, for all 1 ≤ i ≤ n.
The optimization objective for SVM then becomesMinimize (in w, b) 1
2wTw
subject to (for any i = 1, . . . , n) constraints yi (w · xi − b) ≥ 1
43 / 66
Predicting Student PerformanceClassification
Recommendation SystemConclusion
Decision TreesNearest NeighbourLDASVMClassifiers combination
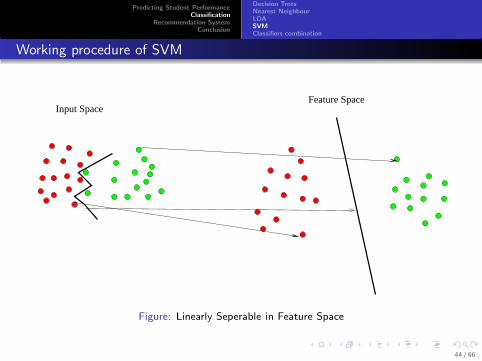
Working procedure of SVM
Input SpaceFeature Space
Figure: Linearly Seperable in Feature Space
44 / 66
Predicting Student PerformanceClassification
Recommendation SystemConclusion
Decision TreesNearest NeighbourLDASVMClassifiers combination
Support Vector Machines for Linearly non seperable data
Introduce non-negative slack variables, ξi ≥ 0, one slack variable for eachtraining point.
It measures the degree of misclassification of the data point xi .
Slack variable is 0 for data points that are on or inside the margin
ξi = |yi − (w · xi − b)| for other points.
Data point on decision boundary - w · xi − b = 0, hence ξi = 1
Points which have ξi ≥ 1 are misclassified
45 / 66
Predicting Student PerformanceClassification
Recommendation SystemConclusion
Decision TreesNearest NeighbourLDASVMClassifiers combination
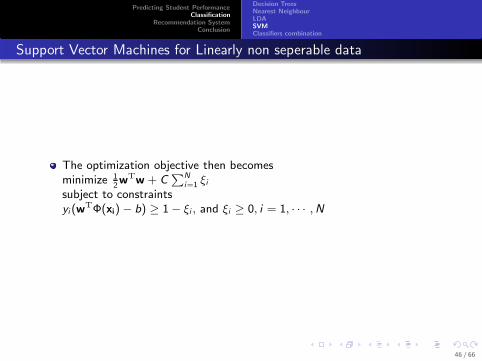
Support Vector Machines for Linearly non seperable data
The optimization objective then becomesminimize 1
2wTw + C
∑N
i=1 ξisubject to constraintsyi (w
TΦ(xi)− b) ≥ 1− ξi , and ξi ≥ 0, i = 1, · · · ,N
46 / 66
Predicting Student PerformanceClassification
Recommendation SystemConclusion
Decision TreesNearest NeighbourLDASVMClassifiers combination
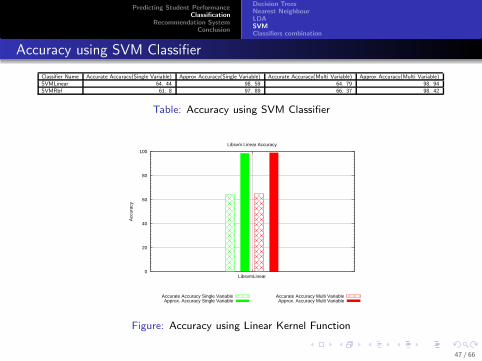
Accuracy using SVM Classifier
Classifier Name Accurate Accuracy(Single Variable) Approx Accuracy(Single Variable) Accurate Accuracy(Multi Variable) Approx Accuracy(Multi Variable)
SVMLinear 64. 44 98. 59 64. 79 98. 94
SVMRbf 61. 8 97. 89 66. 37 98. 42
Table: Accuracy using SVM Classifier
0
20
40
60
80
100
LibsvmLinear
Acc
urac
y
Libsvm Linear Accuracy
Accurate Accuracy Single VariableApprox. Accuracy Single Variable
Accurate Accuracy Multi VariableApprox. Accuracy Multi Variable
Figure: Accuracy using Linear Kernel Function
47 / 66
Predicting Student PerformanceClassification
Recommendation SystemConclusion
Decision TreesNearest NeighbourLDASVMClassifiers combination
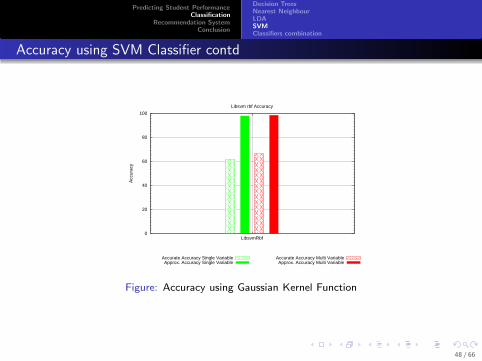
Accuracy using SVM Classifier contd
0
20
40
60
80
100
LibsvmRbf
Acc
urac
y
Libsvm rbf Accuracy
Accurate Accuracy Single VariableApprox. Accuracy Single Variable
Accurate Accuracy Multi VariableApprox. Accuracy Multi Variable
Figure: Accuracy using Gaussian Kernel Function
48 / 66
Predicting Student PerformanceClassification
Recommendation SystemConclusion
Decision TreesNearest NeighbourLDASVMClassifiers combination
Combination of Classifiers
Previous models:Single classifiers like decision trees,LDA,NN,SVM
To improve the accuracy-used combination of classifiers
Used many classifiers - not possible to come up with a single classifier thatcan give good results.
Optimal classifier is dependent on problem domain
49 / 66
Predicting Student PerformanceClassification
Recommendation SystemConclusion
Decision TreesNearest NeighbourLDASVMClassifiers combination
Combining multiple classifiers(CMC)
Method1:Choose classifier which has least error rate on given dataset• Nearest Neighbour algorithm with Clustering similar classes has least error
rate
Method2: Class getting the maximum votes.
If many classifiers predict student fails, then we assign “fail” label tostudent.
50 / 66
Predicting Student PerformanceClassification
Recommendation SystemConclusion
Decision TreesNearest NeighbourLDASVMClassifiers combination
Combination of Classifiers
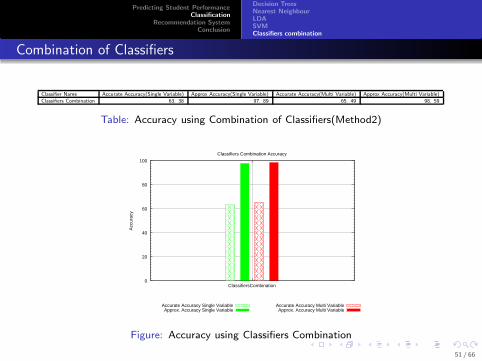
Classifier Name Accurate Accuracy(Single Variable) Approx Accuracy(Single Variable) Accurate Accuracy(Multi Variable) Approx Accuracy(Multi Variable)
Classifiers Combination 63. 38 97. 89 65. 49 98. 59
Table: Accuracy using Combination of Classifiers(Method2)
0
20
40
60
80
100
ClassifiersCombination
Acc
urac
y
Classifiers Combination Accuracy
Accurate Accuracy Single VariableApprox. Accuracy Single Variable
Accurate Accuracy Multi VariableApprox. Accuracy Multi Variable
Figure: Accuracy using Classifiers Combination
51 / 66
Predicting Student PerformanceClassification
Recommendation SystemConclusion
Decision TreesNearest NeighbourLDASVMClassifiers combination
Difficult Classification Problem
Tried various ways to improve accuracy, but we always got 63 to 67%
Analysis Result:p=11 — difficult classification problem
Even best methods achieve around 40% errors on test data.So we achievedgood accuracy. [18]
Only way to improve accuracy is to reduce the number of class labels.
52 / 66
Predicting Student PerformanceClassification
Recommendation SystemConclusion
Decision TreesNearest NeighbourLDASVMClassifiers combination
Target Classes Reduced
Grouped them into four classes
“high” grades - AB, AA, AP
“middle” grades - CC, BC, BB,
“low” grades - DD, CD
“fail” - FR and FF.
53 / 66
Predicting Student PerformanceClassification
Recommendation SystemConclusion
Decision TreesNearest NeighbourLDASVMClassifiers combination
Accuracy when target classes reduced
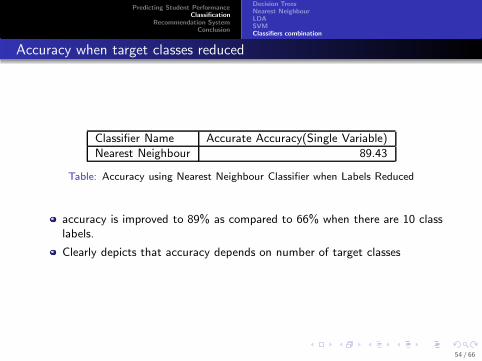
Classifier Name Accurate Accuracy(Single Variable)
Nearest Neighbour 89.43
Table: Accuracy using Nearest Neighbour Classifier when Labels Reduced
accuracy is improved to 89% as compared to 66% when there are 10 classlabels.
Clearly depicts that accuracy depends on number of target classes
54 / 66
Predicting Student PerformanceClassification
Recommendation SystemConclusion
Decision TreesNearest NeighbourLDASVMClassifiers combination
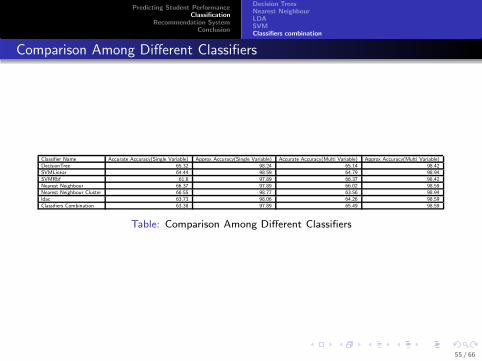
Comparison Among Different Classifiers
Classifier Name Accurate Accuracy(Single Variable) Approx Accuracy(Single Variable) Accurate Accuracy(Multi Variable) Approx Accuracy(Multi Variable)
DecisionTree 65.32 98.24 65.14 98.42
SVMLinear 64.44 98.59 64.79 98.94
SVMRbf 61.8 97.89 66.37 98.42
Nearest Neighbour 66.37 97.89 66.02 98.59
Nearest Neighbour Cluster 66.55 98.77 63.56 98.94
ldac 63.73 98.06 64.26 98.59
Classifiers Combination 63.38 97.89 65.49 98.59
Table: Comparison Among Different Classifiers
55 / 66
Predicting Student PerformanceClassification
Recommendation SystemConclusion
Motivation for Recommendation System
No two students are identical, they learn at different rates, differenteducational backgrounds, different intellectual capabilities, different modesof learning.
Need to design a real-time recommendation system which captures thecharacteristics of each student.
Need to ensure that every student progresses through the course materialso that he maximizes his learning.
It is an immensely complex task. No personal care on students
56 / 66
Predicting Student PerformanceClassification
Recommendation SystemConclusion
Theoretical Model for Recommendation System
Customized suggestions: Need to know student mastery level on topic
Consider question difficulty level eg.2 students got 5/10 marks
Test questions - no uniform characteristics.
Model question level performance instead of aggregate perf.
Give different internal score - says mastery level in the topic
57 / 66
Predicting Student PerformanceClassification
Recommendation SystemConclusion
Theoretical Model for Recommendation System contd
Extract info each question provides about a student.
prob of a correct response to a test question is a mathematical function ofparameters such as a person’s abilities and question characteristics (suchas difficulty, guessability, and specific to topic).
Model helps to better understand how a students performance on testsrelates to his ability
learn about the user, update its parameters about the user to suggest himproperly and make him to achieve his learning objectives.
58 / 66
Predicting Student PerformanceClassification
Recommendation SystemConclusion
Theoretical Model for Recommendation System contd
Student struggles with a particular set of questions - our system shouldknow where that particular students weaknesses lie in relation to theconcepts assessed by those questions.
System should then deliver content to increase the students proficiency onthose concepts.
Personalized learning cannot be done just based on total marks.
Attributes for each question: difficulty level, time taken to answer, numberof attempts to get correct answer, marks he secured, probability ofguessing the answer
59 / 66
Predicting Student PerformanceClassification
Recommendation SystemConclusion
Theoretical Example
C Declarations,Datatypes
For While
Arrays Strings Structures
PointersStructuresAndArrays
FunctionsandPointers
StructuresControlDecision
Case
StructuresControl
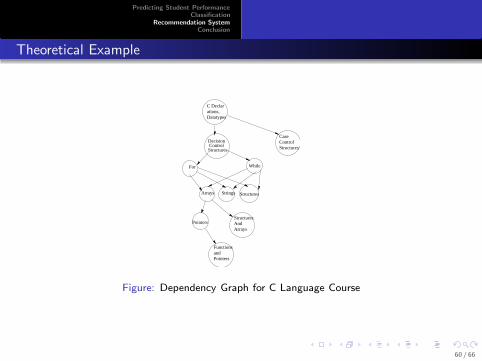
Figure: Dependency Graph for C Language Course
60 / 66
Predicting Student PerformanceClassification
Recommendation SystemConclusion
Theoretical Example contd
Difficulty
of topic
Intelligencelevel in
Internalscore on topic
MarksSecuredin Topic
GuessedAnswer
prior topics
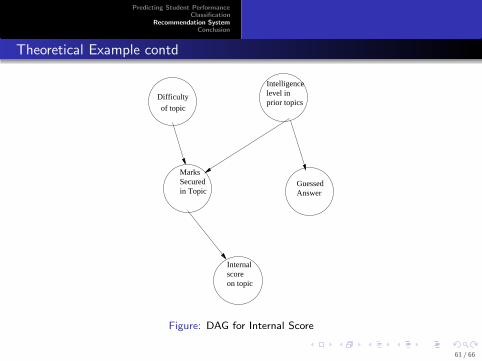
Figure: DAG for Internal Score
61 / 66
Predicting Student PerformanceClassification
Recommendation SystemConclusion
Theoretical Example contd
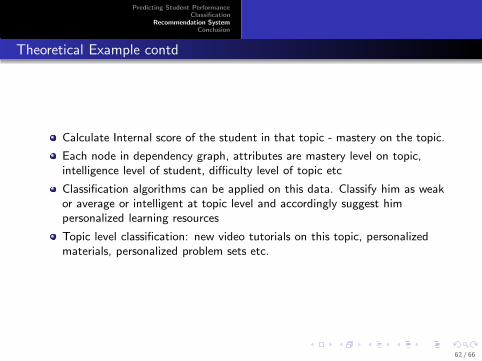
Calculate Internal score of the student in that topic - mastery on the topic.
Each node in dependency graph, attributes are mastery level on topic,intelligence level of student, difficulty level of topic etc
Classification algorithms can be applied on this data. Classify him as weakor average or intelligent at topic level and accordingly suggest himpersonalized learning resources
Topic level classification: new video tutorials on this topic, personalizedmaterials, personalized problem sets etc.
62 / 66
Predicting Student PerformanceClassification
Recommendation SystemConclusion
Conclusion
Predicting endsem marks, grade of student apriori, providing customizedlearning materials - improve performance in endsem,grade.
Learners -different backgrounds,previous experience, so different learnersneed to focus on different material to achieve the same learning objective.
Proposed learning system gives learning support based on individuallearning characteristic.
Different learning proposals provided to students in feedback - learnerslearning rate.
63 / 66
Predicting Student PerformanceClassification
Recommendation SystemConclusion
Future Work
Chapter Selection
Main menu interface
learningProblem based Exam
Feedback ( Customized References)
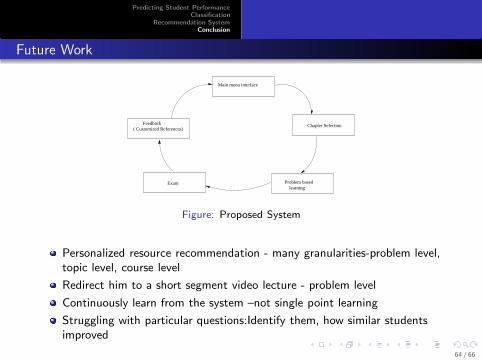
Figure: Proposed System
Personalized resource recommendation - many granularities-problem level,topic level, course level
Redirect him to a short segment video lecture - problem level
Continuously learn from the system –not single point learning
Struggling with particular questions:Identify them, how similar studentsimproved
64 / 66

Predicting Student PerformanceClassification
Recommendation SystemConclusion
References I
Anna Dollar et.al, Enhancing Traditional Classroom Instruction with Web-based Statics Course, 37th
ASEE/IEEE Frontiers in Education Conference,2007
Evgeniya Georgieva et.al, Design of an e-Learning Content Visualization Module, 3rd E-Learning
Conference,2006
Rodica Mihalca et.al, Overview of Tutorial Systems based on Information Technology, 3rd E-Learning
Conference,2006
Herbert A. Simon et.al, A Game Changer,The Open Learning Initiative, From www.cmu.edu,2012
Libing Jiang et.al, Development of electronic teaching material of modern P.E. educational technology upon
problem-based learning, International Conference on e-Education, Entertainment and e-Management,2011
Stephnaos Mavromoustakos et.al, Human And Technological Issues In The E-Learning Engineering Process,
Journal Article in ResearchGate
Jodi L. Davenport et.al, When do diagrams enhance learning? A framework for designing relevant
representations, Proceedings in ICLS’08
Tanja Arh et.al A Case Study of Usability Testing the SUMI Evaluation Approach of the EducaNext Portal,
Wseas Transactions on Information Science And Applications,February 2008
Mirjam Kock et.al Towards Intelligent Adaptative E-Learning Systems – Machine Learning for Learner
Activity Classification European Conference on Technology Enhanced Learning 2010
65 / 66
Predicting Student PerformanceClassification
Recommendation SystemConclusion
References II
Behrouz et.al Predicting Student Performance:An application of Datamining methods with an Educational
Web Based System IEEE Frontiers in Education, 2003.
Mingming Zhou et.al Data Mining and Student e-Learning Profiles International Conference on E-Business
and E-Government,2010
S. Anupama Kumar et.al Efficieny of Decision Trees in Predicting Students Academic Performance, CS And
IT-CSCP 2011
R.K Kabra et.al Performance Prediction of Engineering Students using Decision Trees, International Journal
of Computer Applications,December 2011
http://www.meritnation.com/(referred on 30th Aug 2012)
http://www.topperlearning.com/(referred on 30th Aug 2012)
http://www.learnzillion.com/(referred on 31st Aug 2012)
www.it.iitb.ac.in/ekshiksha/(referred on 31st Aug 2012)
The Elements of Statistical Learning by Friedman, Hastie, Tibshirani printed in 2001 , pg 85
66 / 66


![Ashab - E - Rasuler Jibon Kotha [Part 1]](https://img.pdfslide.net/doc/110x75/54f964604a7959ae368b4a7a/ashab-e-rasuler-jibon-kotha-part-1.jpg)