Embed Size (px)
Citation preview

Personalizing�energy�as�part�of�achievingpositive�energy�buildings
INTRODUCTION
By�definition,�a�positive�energy�building�generates�more�energy�than�it�consumes.
This�is�achieved�through�use�of�on-site�renewable�energy�sources,�such�as
photovoltaics,�wind�and�biofuels.�It�is,�therefore,�important�to�reduce�overall�energy
consumption�as�much�as�possible�by�advanced�building�design,�material�choices�and
innovative�approaches�to�building�management,�including�the�active�participation�of
those�who�work�in�the�building.��
According�to�estimates�from�the�Positive�Energy�Building�Consortium�(GIE�Enjeu
Energie�Positive),�building�operators�can�achieve�an�additional�20-30�percent�in
energy�savings�through�innovative�approaches�to�building�use�and�management.�
In�real�life,�two-thirds�of�energy�consumption�is�the�responsibility�of�the�building
operator,�while�occupants�have�responsibility�for�the�remaining�one-third.�Therefore,
the�impact�of�building�occupants�is�very�significant,�and�positive�energy�buildings
must�be�designed�and�managed�in�a�way�to�ensure�occupants�are�mindful�about�the
impact�of�their�personal�energy�consumption.�See�figure�one.�
Figure one: Key influences on building energy consumption
WHITE�PAPER
Energy�Efficiency
Intel®�Core™�processor�family
Yves�Aillerie,�Business�Development�Manager,�Intel�
Scott�Shull,�Eco-Technology�Program�Office,�Intel
Table�of�Contents
The�positive�energy�building ....................2
Employee�behavior�and�IT .........................3
Positive�impact�of�IT ...................................4
Monitoring�group�and�
personal�energy ...........................................5
Energy�efficient�
computing�technologies.............................6
Key�Influences�on�Building�Energy�Consumption
DevelopersPotential�Savings:�20%�-�60%
New�Buildings
Existing�Buildings
Design•�Policy
•�Budget
•�Resources
OperatorsControl:�2/3�Energy�Consumption
Potential�Savings:�10%�-�30%
EnergyManagement
OccupantsControl:�1/3�Energy�Consumption
Potential�Savings:�5%�-�25%
EnergyManagement
OwnersPotential�Savings:�15%�-�35%
Upgrade

2
Occupants’�impact�on�energy�consumption
Occupants’�impact�on�energy
consumption�depends�on�three�major
things:
1. Internal�design�aspects�of�the�building,
including�siting�of�structures,�aspect
ratios�of�building�height�to�depth,
construction�materials,�insulation,�natural
lighting�sources,�etc
2. Use�of�technical�equipment�(heating,
ventilation,�cooling,�windows,�lighting
systems,�escalators�and�elevators)�used
daily
3. Additional�equipment�such�as�PC�printers,
network�routers�and�switches,�and�office
lighting
In�a�commercial�office�building,�the�energy
consumption�of�personal�computing�and
printing�can�play�a�big�role�in�overall�“plug
loads”,�so�astute�building�managers�and
CIOs�pay�close�attention�to�providing
employees�with�information�about�their
computing�energy�footprint,�as�well�as
selecting�the�right�computing�model
matched�to�the�nature�and�strategy�of�the
business.�So,�what�is�the�right�configuration
and�type�of�personal�computer?�What�is�the
impact�on�employee�productivity?�What�is
the�impact�on�comfort?�What�is�the�impact
on�electricity�consumption?�What�is�the
right�security�level?�What�is�the�cost�to�the
company�in�both�capital�expenses�and
operating�expenses?�
Based�on�the�learnings�from�Green�Office*
quantitative�studies,�this�document
explores�some�of�these�questions�and
showcases�an�innovative�approach�to
personalizing�energy.
White�Paper�Energy�Efficiency
The�positive�energy�building
Let’s�take�as�an�example�Green�Office,
the�positive�energy�building�built�by
Bouygues�Immobilier�in�Meudon,�France.
The�objective�of�the�Green�Office
building�is�an�overall�reduction�of�energy
consumption�of�65�per�cent,�compared
to�a�typical�building�of�similar�age.
In�order�to�be�labeled�as�a�positive�energy
building,�the�building�needs�to�produce
more�energy�than�it�consumes.�Green
Office®�consumption�will�be�62
kWH/m2/year,�yet�it�will�produce�64
kWH/m2/year�of�renewable�energy.�
See�figure�two.
Experience�demonstrates�that�overall
building�consumption�can�be�significantly
impacted,�positively�or�negatively,�by�the
way�the�building�is�operated�and�managed,
and�also�by�the�way�building�users�behave
with�their�environment.
Figure two : Green Office* energy consumption

3
White�Paper�Energy�Efficiency
Employee�behavior�and�IT
The�impact�of�IT�on�reducing�energy�consumption�has�two�sources:�the�IT�itself�–�PCs,
data�centers,�networking�and�data�storage,�and�employees’�behaviors�so�they�take
full�advantage�of�these�tools.
Two�key�elements�will�impact�employees’�behaviors:
•�Enterprise�strategy�and�organization
•�Information�provided�so�that�they�can�adapt�their�behavior
In�addition,�real-time�information�about�the�impact�of�IT�on
energy�consumption�will�influence�choices�and�IT�strategies.
See�figure�three.�
How�to�define�an�organizational�strategy�to�reduce�energy
consumption�is�not�covered�within�this�document,�rather�this
document�covers�strategy�and�incentives�related�to�energy.
A�dashboard�allows�an�employee�to�get�synthetic�information
about�his�close�and�direct�environment.�This�information�can
then�be�used�to�act�accordingly.�The�dashboard�also�allows�IT
managers�to�understand�their�influence�based�on�their�choice
of�strategy�and�the�infrastructure�they�choose�to�deploy.�
Additionally,�it�is�necessary�to�feed�real-time�IT�consumption
data�in�with�global�building�information�systems,�in�order�to
measure�global�building�performance.
Figure three: Influences on employee behaviors
EmployeeBehaviors
CompanyStrategy
ITDashboard�andInformation

4
Positive�impact�of�IT
Whether�in�a�standard�building�or�a
positive�energy�building,�a�company
expects�the�highest�productivity�level
from�its�employees.�In�the�case�of�a
positive�energy�building,�objectives�to
reduce�energy�consumption�also�lead�to
cost�reduction�and�improved�employee
productivity.�It�is�therefore�a�good�idea
for�companies�to�optimize�employees’�IT
equipment�and�also�the�way�the
employee�interacts�with�it.�
Productivity
By�definition,�a�tool�is�aimed�at�increasing
productivity.�Similarly,�in�the�case�of�a
personal�computer,�considered�as�a�tool,
the�employee�should�be�given�access�to
information�and�applications,�which�enable
him�to�work�faster�and�more�intelligently.�
PCs,�these�days,�now�need�to�work�faster,
and�also�allow�the�integration�of�new
technologies�and�uses�emerging�in�the
enterprise,�such�as�smartphones,
enterprise�social�networks�and�video
conferencing.�
Employee�productivity�cannot�rely�on
network�quality,�speed�of�Internet�or
enterprise�server�access.�
A�positive�energy�building�doesn’t�mean
taking�away�the�tools�required�for
improving�employees’�productivity;�it
merely�requires�these�tools�are�as�energy
efficient�as�possible.�
Mobility
Because�they�are�so�light,�so�thin,�and
because�they�have�such�a�long�battery�life,
portable�computers�are�built�with�low
power�components�and�by�definition,
mobile�PCs�use�less�energy�than�standard
PCs.�Here�are�some�other�benefits�also
associated�with�mobility:
•�Employee�mobility,�inside�or�outside�of
the�office,�is�a�critical�ingredient�for�high
productivity.�In�1988,�Intel�started�a
massive�migration�from�traditional�PCs�to
mobile�PCs.�In�the�early�2000s,�more�than
80�per�cent�of�Intel’s�PC�fleet�was�already
mobile,�despite�the�extra�cost�of�a�mobile
PC�over�a�standard�PC�at�that�time.�Intel
measured�a�two-hour�increase�in�working
hours�per�employee,�per�week,�since
employees�could�now�use�PCs�in
meetings,�on�business�trips,�etc.�
•�If�considered�as�part�of�a�corporate
strategy,�mobility�can�play�a�key�role�in
employee�behavior.�Reducing�energy
consumption�and�carbon�emissions
requires�an�evaluation�of�IT�within�the
building�and�beyond.�For�example,�proper
use�of�video�conferencing,�emails,�instant
messaging�and�IP�telephony�provide
significant�measurable�benefits.�
•�As�long�as�it�does�not�affect�the�comfort
of�employees,�mobility�can�enable
companies�to�reduce�energy�consumption
by�giving�them�the�tools�to�re-think�and
optimize�the�way�in�which�they�utilize
office�space.�Ideally,�mobile�computing
should�be�used�together�with�presence-
detection�lighting�and�heating.�
Comfort�at�work
Employee�comfort�should�never�be
compromised.�This�is�true�in�any�building
where�employees�are�working,�but�is
especially�critical�in�a�positive�energy
building�since�comfort�leads�to�employee
satisfaction�and�better�relationship�with
the�working�environment.�Depending�on�his
relationship�with�the�working�environment,
an�employee�will�be�proactive�in�adopting
behavior�that�reduces�energy�consumption.
Studies�have�shown�that�considering�IT
tools�alone,�without�regard�to�the�way
employees’�use�these�IT�tools,�results�in
smaller�decreases�in�energy�consumption.�
“Centralized green technology and
systems take personal control
away from individuals, over
complicate office environments
and ultimately drives people to
adopt energy-inefficient
measures… personal fan heaters in
temperature-controlled offices.”
Green building doesn’t mean happy workers,
March15 2010
Mobility�is�a�major�contributor�to�improved
productivity�and�comfort.�Studies
conducted�by�Steelcase�demonstrate�that
the�best�chair�will�never�be�better�than
having�the�ability�to�move�around�[1].
Mobility�gives�the�employee�the�freedom�to
switch�desk,�sit�in�the�café�or�reception,�in�a
meeting�room�or,�in�fact,�anywhere�they
like.�
Also,�mobility�allows�employees�to�use�their
IT�tools�in�their�own�time�and�in�their�own
desired�location,�whether�that’s�in�a�group
workspace,�an�informal�shared�space�or�in
the�building�reception.�
White�Paper�Energy�Efficiency
1ADEME, Agence de l’environnement et de la Maîtrise de l’Energie, and Bouygues Immobilier

5
White�Paper�Energy�Efficiency
Monitoring�group�and�personal�energy
In�new�buildings,�several�thousand
sensors�control�temperature,�lighting,�air
quality,�presence�and�motion�and�other
states.�Each�of�these�provides
information�for�the�Building
Management�System.�
In�positive�energy�buildings,�this
information�also�needs�to�reach�individual
occupants�and�small�groups�so�that�they
can�behave�accordingly.�In�fact,�in�positive
energy�buildings,�information�on�energy
performance�should�be�displayed�at
different�strategic�locations�within�the
building:
Global�building�performance
The�information�shows�the�performance�of
the�building�compared�to�corporate�goal.�It
can�be�real�time�or�historical.�It�should�be
displayed�in�places�where�the�movement�is
high�–�for�example,�the�reception�area.
Some�buildings�even�expose�this
information�outside�the�building.
Group�information�display
This�information�shows�the�performance�of
individual�groups�or�departments.��It�should
be�displayed�at�floor�level�outside�elevators
on�group�or�departmental�floors.�
IT�information�level
The�IT�department�has�to�have�global
visibility�of�the�performance�of�IT
equipment�through�a�dashboard.�This
information�should�be�real�time,�but�should
also�offer�a�historical�view.�Important
decisions�may�be�taken�based�on�this
information�–�for�example,�decisions
regarding�IT�refresh�strategy,�architectural
choices,�technical�options,�service�levels
and�others,�impacting�IT�global
performance,�IT�energy�performance�and�IT
budget.
Screenshot one: POEM presents PC users with adashboard of their energy consumption. Userscan track their total energy footprint, as well asnavigate the details of its component parts: PC,printer, plug loads, and monitor indoor andoutdoor ambient conditions.
Screenshot two: With regard to plug loads, officeworkers can visualize their daily energyconsumption of task lights and other localcubical plug loads. Comparisons of individualresults with those of the worker’s department,floor, and building are also displayed along withan explanation of whether the worker is a netreducer or consumer of energy compared to theoffice community.
Personal�information
As�discussed,�employees�play�a�key�role�in�global�energy�reduction,�so�it�is�important�that
each�employee�has�easy�access�to�easy-to-understand�information�to�help�them�make�the
right�choices�to�reduce�energy�consumption�and�lower�their�carbon�footprint.�This
information�should�divide�according�to�these�categories:
•�General�information,�no�action�on�immediate�environment.�This�can�be�a�weather�forecast,
traffic�information,�a�management�or�IT�message�or�historical�data
•�Information�with�possible�action�related�to�the�immediate�environment.�This�can�be�about
temperature,�lighting,�etc�
•�Information�related�to�personal�performance.�This�can�be�about�
personal�objectives,�company�policy,�etc.
The�Personal�Energy�monitor�should�reside�on�the�employee’s�PC�and�give�him�or�her
access�to�real-time�information�and�historical�data.�In�positive�energy�buildings,�next-
generation�mobile�PCs�will�be�able�to�provide�information�regarding�the�PC�and�printer.�
This�information�is�then�captured�by�the�IT�department,�who�may�use�it�to�improve�energy
management.
Personal�Office�Energy�Manager
POEM�is�an�experimental�prototype�of�a�Personal�Office�Energy�Manager�developed�by
Intel�Corporation�in�collaboration�with�the�Bouygues�Immoblier�Positive�Energy�Building
GIE*.��It�reads�sensors�in�a�modern�office�worker’s�PC�network�and�displays�the�energy
‘footprint’�of�an�individual,�as�well�as�the�aggregate�energy�of�the�office�floor�and�entire
building.��POEM�uses�the�visual�metaphor�of�a�garden�of�flowers�to�convey�a�sense�of
electricity�consumed�by�the�PCs,�printers,�and�other�plug�loads�in�an�office�worker’s�cubicle.
POEM�helps�reduce�the�overall�energy�consumption�of�IT�equipment�and�office�energy
loads�by�informing�the�individual�Office�Worker�of�their�electricity�consumption,�and
providing�tips�about�how�to�further�reduce�resource�usage.

6
Energy-efficient�computingtechnologies
As�mentioned�previously,�IT�equipment
can�have�a�positive�impact�on�employee
behavior�–�improving�productivity�and
employee�comfort�at�work,�as�well�as
reducing�energy�consumption�and
lowering�carbon�emissions.��
This�section�looks�at�the�different�types�of
computing�models�available�to
organizations�–�from�traditional�desktop
clients�to�server�deployments�vs.�thin
clients,�laptops�and�mobile�Internet�devices,
analyzing�the�impact�of�each�of
productivity�and�energy�efficiency.�It
examines�both�market�trends�and
innovations�and�their�impact�on�data�center
and�compute�node�energy�consumption�in�a
holistic�manner.�Trade-offs�and�appropriate
usage�scenarios�for�each�usage�model�will
be�discussed.�This�information�is�invaluable
to�companies�wanting�to�run�a�positive
energy�building.�
Background�and�caveats
This�is�a�time�of�change�in�the�client
computing�world.�In�many�markets,�laptops
now�outsell�desktops�and�we�are�well�along
the�path�of�transitioning�to�LCD�displays.
Latest-generation�systems�based�on�the
Intel®�Core™�processor�family�are�also
significantly�more�energy�efficient�(78�per
cent�less�energy�consumed�and�more�than
50�percent�faster�than�the�previous-
generation�Intel®�Core™�2�Duo�processors.
And�what’s�more,�for�the�nth�time,�thin-
clients�are�being�considered.�Mostly�driven
by�security�and�manageability�concerns,
many�companies�are�considering�or
deploying�compute�scenarios�reminiscent�of
mainframes�and�terminals�where�the�bulk
of�the�compute�tasks�are�completed�on�a
centralized�server�or�group�of�servers.
But�one�of�the�reasons�sometimes�cited�as
motivating�a�transition�to�thin-clients�and
virtual�hosted�desktops�is�the�desire�to
save�energy.�Here,�we�focus�in�on�the
question�of�optimizing�the�complete�ICT
system�for�energy�use.
A�handful�of�studies�have�been�done�to
measure�energy�consumption,�but�it’s
important�to�remember�that�the�answers
will�vary�with�the�assumptions�that�are
made�regarding�server�loading,�data�center
implications,�client�efficiency�and�usage
profiles.�We�focus�on�the�energy�issue�and
explore�the�sensitivity�of�these�other
factors;�particularly�data�center�efficiency
and�the�number�of�clients�assigned�per
server.
One�related�area�that�we�will�not�explore
here�is�the�explosion�of�mobile�Internet
connected�devices�and�how�they�are
driving�infrastructure�build-out.�End-to�end
energy�consumption�of�this�usage�model�is
outside�our�scope.
Definitions
There�are�several�different�computing
models�that�are�being�considered�[2]:
•�Terminal/�presentation�server
computing�model�
This�is�the�traditional�thin-client,�server
compute�model�where�the�client�device
does�little�more�than�accept�keystrokes
and�mouse�clicks�for�input�and�render�the
response�from�the�server�into�the�display.
•�Virtual�hosted�desktop�
computing�model
In�this�case,�user�processing�occurs�on�the
server,�but�each�user’s�work�runs�as�a
virtual�partition�allowing�for�disparate
versions�of�operating�systems�and
applications.
•�Typically�managed�rich�desktop
computing�model
This�is�the�most�common�usage�model
today.�Each�user�has�a�full-function�PC
with�maximum�flexibility.�Typically�power
management�will�not�be�set�up�as�part�of
the�standard�build�on�these�PCs.
•�Well-managed�rich�desktop�
computing�model
This�is�the�model�of�above�but�with�a�high
level�of�management�and�implementation
of�power�management�features.�Each
user�has�a�full-function�PC�with�maximum
flexibility,�except�in�the�energy
management�settings�of�the�client.
•�Well-managed�OS�streaming�desktop
OS�streaming�is�a�variation�on�the�rich-
client�model�where�the�client�boots�from�a
virtual�disk�on�the�server.�Storage�on�OS
are�on�the�server.�The�client�is�assumed
to�be�diskless.
•�Well-managed�application�
streaming�desktop�
This�is�another�rich-client�model�where
the�client�has�local�storage�for�the�OS,�but
applications�are�streamed�from�the�server.
Data�may�be�stored�locally.
•�Rich�mobile�computing�model�
Very�similar�to�the�typical�rich�desktop
computing�model,�but�assumes�mobility
and�lack�of�persistent�network
connection.�Optimized�for�battery�life�–
and�hence�energy�efficiency.
White�Paper�Energy�Efficiency
2 Total Cost of Ownership for various Compute Models. Principled Technologies, 2007.
7
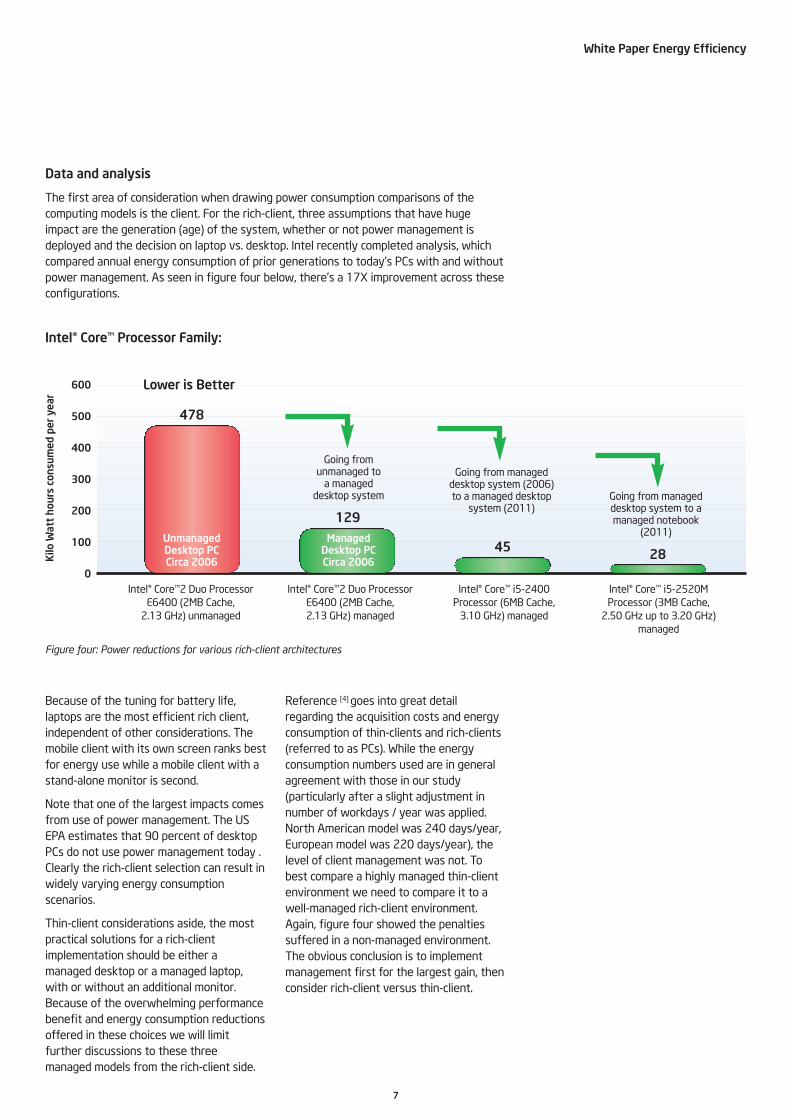
Data�and�analysis
The�first�area�of�consideration�when�drawing�power�consumption�comparisons�of�the
computing�models�is�the�client.�For�the�rich-client,�three�assumptions�that�have�huge
impact�are�the�generation�(age)�of�the�system,�whether�or�not�power�management�is
deployed�and�the�decision�on�laptop�vs.�desktop.�Intel�recently�completed�analysis,�which
compared�annual�energy�consumption�of�prior�generations�to�today’s�PCs�with�and�without
power�management.�As�seen�in�figure�four�below,�there’s�a�17X�improvement�across�these
configurations.
Intel®�Core™�Processor�Family:
White�Paper�Energy�Efficiency
478
Lower�is�Better600
500
400
300
200
100
0
Unmanaged�Desktop�PC�Circa�2006
Managed�Desktop�PC�Circa�2006
Going�fromunmanaged�to�
a�managed�desktop�system
Going�from�manageddesktop�system�(2006)to�a�managed�desktop
system�(2011)Going�from�manageddesktop�system�to�amanaged�notebook
(2011)
129
Kilo�Watt�hours�consumed�per�year
4528
Intel®�Core™2�Duo�ProcessorE6400�(2MB�Cache,�
2.13�GHz)�unmanaged
Intel®�Core™2�Duo�ProcessorE6400�(2MB�Cache,�2.13�GHz)�managed
Intel®�Core™�i5-2400Processor�(6MB�Cache,
3.10�GHz)�managed
Intel®�Core™�i5-2520MProcessor�(3MB�Cache,
2.50�GHz�up�to�3.20�GHz)managed
Figure four: Power reductions for various rich-client architectures
Because�of�the�tuning�for�battery�life,
laptops�are�the�most�efficient�rich�client,
independent�of�other�considerations.�The
mobile�client�with�its�own�screen�ranks�best
for�energy�use�while�a�mobile�client�with�a
stand-alone�monitor�is�second.
Note�that�one�of�the�largest�impacts�comes
from�use�of�power�management.�The�US
EPA�estimates�that�90�percent�of�desktop
PCs�do�not�use�power�management�today�.
Clearly�the�rich-client�selection�can�result�in
widely�varying�energy�consumption
scenarios.�
Thin-client�considerations�aside,�the�most
practical�solutions�for�a�rich-client
implementation�should�be�either�a
managed�desktop�or�a�managed�laptop,
with�or�without�an�additional�monitor.
Because�of�the�overwhelming�performance
benefit�and�energy�consumption�reductions
offered�in�these�choices�we�will�limit
further�discussions�to�these�three
managed�models�from�the�rich-client�side.
Reference�[4]�goes�into�great�detail
regarding�the�acquisition�costs�and�energy
consumption�of�thin-clients�and�rich-clients
(referred�to�as�PCs).�While�the�energy
consumption�numbers�used�are�in�general
agreement�with�those�in�our�study
(particularly�after�a�slight�adjustment�in
number�of�workdays�/�year�was�applied.
North�American�model�was�240�days/year,
European�model�was�220�days/year),�the
level�of�client�management�was�not.�To
best�compare�a�highly�managed�thin-client
environment�we�need�to�compare�it�to�a
well-managed�rich-client�environment.
Again,�figure�four�showed�the�penalties
suffered�in�a�non-managed�environment.
The�obvious�conclusion�is�to�implement
management�first�for�the�largest�gain,�then
consider�rich-client�versus�thin-client.

8
To�proceed�in�our�sensitivity�analysis�we�will�summarize�the�annual�energy�use
of�each�of�the�machine�types.�The�value�for�the�thin-client�power�consumption
was�taken�from�[3],�and�the�LCD�power�from�our�initial�internal�study.
White�Paper�Energy�Efficiency
Machine�annual�energy Use�(kWh) Comments
Unmanaged�desktop 478 Fig�4
Managed�desktop�(2006) 129�� Fig�4
Managed�desktop�(2011) 45 Fig�4
Managed�notebook�(2011) 28 Fig�4
Thin�client�-�LCD� 137� At�240�work�days
Server 1577�� From�[3]
Figure five: Annual power use for review of various client models
The�laptop�without�an�additional�monitor�is
the�clear�choice�when�low�energy�use�and�a
performance-oriented�capability�is�the
premium�concern.�It�is�so�far�ahead�of�any
other�configuration�that�we�will�leave�it�out
of�the�next�round�of�analysis.
One�of�the�key�factors�in�determining�the
end-to-end�energy�use�of�the�various
compute�models�is�to�appropriately�allocate
the�energy�use�of�the�server�and
associated�data�center�infrastructure.�As
the�computation�occurs�in�the�data�center
on�the�server,�the�energy�consumed�there
needs�to�be�included.�The�ratio�of�clients
per�server�is�used�to�determine�the
additional�energy�burden�on�each�client.
That�ratio�is�critical�because�it�also
determines�the�capability�of�the�thin�client
model.
Reference [3] defines�three�types�of�users:
Light�User�–�single�non�compute�intensive
application,�such�as�email�or�data�entry;
Medium�User�–�may�use�simultaneous
applications,�generally�Microsoft�Office*-
type�users;�and�Heavy�User�–�someone
doing�intensive�work�in�Microsoft�Outlook*
or�Microsoft�Excel*,�invariably�running
simultaneous�applications�with�large�file
sizes.�For�these�types�of�users�a�ratio�of
clients�to�servers�of�35�/�1�is�used�in�that
reference.
The�other�end�of�the�spectrum�is�covered�
in [1] where�typical�office�tasks�were
developed�in�scripts�and�run�on�the�various
models.�These�tasks�were�very�common
and�included�working�with�an�Adobe
Acrobat*�file,�recalculating�an�Excel
spreadsheet,�and�simultaneously
compressing�a�folder�while�working�with�a
Microsoft�PowerPoint*�presentation.�A
combined-time�performance�versus�number
of�clients�result�was�compiled.
The�results�of�these�comparisons�are
informative�in�determining�the�right�ratio�of
clients�to�servers.
In�the�extreme�case�of�one�or�two�clients
per�server�the�thin-client�server�based
computation�was�better�than�the�rich-
client.�And�at�five�clients�per�server�the
performance�was�roughly�equivalent�to�the
rich-client�architecture.
These�results�are�of�particular�interest�in
that�the�servers�used�were�dual-processor,
dual-core�servers.
While�the�individual�simultaneous�client
numbers�were�less�than�or�equal�to�the
number�of�cores�available�in�the�server�(in
this�case,�four)�the�thin–client�architecture
outperformed�the�rich-client.�When�the
number�of�clients�increased�to�ten�(well
beyond�the�four�cores�available)�the�thin-
client�performance�was�about�48�per�cent
slower�than�the�rich-client�model.�Note�that
these�values�of�two,�five,�and�10�clients
per�server�may�seem�very�low�as�higher
numbers�of�clients�are�invariably�used�in
comparisons.�But�in�this�test�the�scripts
were�run�simultaneously,�causing�a�greater
server�workload�than�a�temporally�diverse
workload�in�a�common�office.�The�ability�to
have�good�performance�at�higher�client-to-
server�ratios�relies�heavily�on�non-
simultaneous�peak�demands,�a�reasonable
but�not�perfect�assumption.�The�potential
(risk?)�for�simultaneous�use�should�be
considered�in�sizing�the�overall�system�in
the�thin-client�model.
The�disparity�between�the�two�papers’
ratios�<10�/�1�and�35�/�1�suggests�that
another�user�class�needs�to�be�defined.�We
suggest�“Advanced�User”�as�an�option,
where�the�user�is�involved�with�media�or
graphics�manipulation�(even�including�high-
end�manipulations�in�PowerPoint),�analysis
using�tools�such�as�Mathematica*,�or�on-
line�collaboration�tools�like�Live�Meeting*.
The�scripts�described�above�(Acrobat,�Excel,
PowerPoint)�would�also�need�to�be
classified�as�an�advanced�user�based�on�the
compute�performance�loss�at�10�clients�per
server�and�above.�The�term�Advanced�User
aligns�with�the�increased�requirement�for
computing�capability�as�these�type
applications�become�even�more
mainstream.�For�this�type�user�it�becomes
more�and�more�important�to�provide�a
client�/�core�ratio�closer�to�one.�Based�on
that�and�the�prevalence�of�dual�processor
quad-core�servers�a�client�to�server�ratio�of
8�/1�(or�16�/�1�in�a�four-way�quad-core
server)�should�be�the�performance-based-
end�in�an�analysis�of�server/client�ratios.�In
the�case�of�the�Advanced�User,�it�may�be
that�risks�to�productivity�loss�thru
simultaneous�use�and�highly�demanding
performance�may�make�these�low�client�/
core�numbers�a�requirement�for
satisfactory�performance.
In�addition�to�the�energy�used�by�the
servers�in�the�thin-client�model,�we�must
also�consider�the�energy�used�by�the�data
center.�Reference [3] simply�doubled�the
server�load�and�claimed�that�value�for
cooling.
This�is�not�an�unreasonable�starting�point
for�consideration�of�the�data�center�energy
use.�To�go�beyond�this�first�pass
assumption�we�refer�to�the�frequently�used
metric�of�Power�Usage�Effectiveness�(PUE).
This�metric�is�discussed�in [5] and�is
currently�carried�in�the�EU�CoC�draft�for
Data�Centre�Best�Practices [6].�Actually�the
EU�CoC�has�adopted�the�inverse�of�PUE,�or
DCiE.�DCiE�=�1/PUE.�The�use�of�one�or�the
other�is�primarily�one�of�style�or�personal
preference.)
3 Roberson, Judy A, et. al.: After-hours Power Status of Office Equipment and Energy Use of Miscellaneous Plug-Load Equipment: Lawrence Berkeley National Laboratories, 20044 Environmental Comparison of the Relevance of PC and Thin Client Desktop Equipment for the Client, 2008. Fraunhofer Institute for Environmental, Safety and Energy Technology, 20085 The Green Grid Data Center Power Efficiency Metrics: PUE and DCiE. The Green Grid, 20076 Draft Best Practices for the EU Data Centre Code of Conduct, EU Code of Conduct, 2008.

9
White�Paper�Energy�Efficiency
PUE�is�defined�by�the�total�energy�use
(including�IT�equipment)�divided�by�the�IT
energy�use.�The�total�energy�use�is
comprised�of�IT,�cooling,�power�distribution
losses,�lighting,�and�other�loads.�Thus�if�a
data�center�used�1�MW�in�the�IT�equipment
but�brought�2�MW�to�the�site�to�cover�all
loads,�the�PUE�would�be�2.0.�Generally�a
value�of�2.0�is�considered�average.
A�poorly�designed�and�operated�data
center�PUE�could�be�3.0�or�higher�(the
authors�recently�heard�of�a�moderately
sized�data�center�in�North�America�with�a
PUE�of�3.74).�Best�practices�can�lead�to
data�centers�with�a�PUE�of�1.5�or�less.
In�consideration�of�a�thin-client
architecture,�the�PUE�of�the�data�center
that�will�house�the�supporting�servers
needs�to�be�known.�The�total�energy�in�the
end-to-end�model�will�then�be�the�energy
used�by�the�thin�client,�its�monitor,�plus�the
energy�used�in�the�data�center.�That�value
is�the�server�energy�use,�multiplied�by�the
data�center�PUE,�divided�by�the�number�of
clients�per�server.�The�data�from�figure�five
can�be�used�to�explore�the�sensitivities�of
the�PUE�and�the�client�/�server�ratio.
As�stated�earlier�we�will�not�consider�the
purely�mobile�model�as�the�lack�of�an
additional�monitor,�coupled�with�the
extreme�power�optimization�in�these
platforms�will�be�the�lowest�energy�use�of
any�model�and�will�not�be�a�useful�or
informative�comparison.
The�three�models�(managed�desktop,
managed�laptop�w/�monitor,�and�thin-client)
were�compared�parametrically�with
clients/server�ranging�from�8�clients�/
server�to�128�clients�/�server�and�data
center�PUEs�taken�at�1.5,�2.0,�and�3.0.�This
data�is�plotted�in�figure�six.�In�addition�the
thin-client�“alone”�(but�including�the
monitor)�is�also�plotted�as�this�is�the
baseline�to�which�we�need�to�add�the
additional�data�center�and�server�power
use.�We�see�the�thin-client�alone�and�the
laptop�are�very�close�with�the�managed
desktop�somewhat�higher.�There�are�also
three�curves�representing�functional�thin-
client�models�where�the�curve�shows�the
end-to-end�energy�use.
Figure six: Annual power use as a function of clients per server and PUE

10
White�Paper�Energy�Efficiency
Several�interesting�results�can�be�seen�in
figure�six.�First,�when�the�thin-client
appropriately�carries�the�data�center
energy,�the�managed�laptop�with�a�monitor
is,�in�all�cases,�a�lower�energy�use�than�the
thin-client.�This�makes�it�the�clear�leader�in
the�end-to-end�energy�use�comparison�of
these�three�architectures.
The�comparison�of�the�managed�desktop
and�the�thin�client�is�more�interesting�in
that�the�right�choice�depends�both�on�data
center�efficiency�(through�the�PUE�metric)
and�clients�/�server.�In�the�very�efficient
data�center�with�a�PUE�of�1.5�the�thin-
client�model�does�not�become�more�energy
efficient�until�roughly�32�clients�/�server.
The�Fraunhofer�report3�suggests�that�an
appropriately�configured�server�could
support�up�to�35�clients�in�a�situation�with
diverse�use�patterns�and�a�mix�of�Light�to
Heavy�Users.�It�should�not�be�expected
that�the�Advanced�User�or�simultaneous
Heavy�Users�could�have�a�successful
experience�in�this�arrangement.
In�the�average�data�center�(PUE�=�2.0)�the
thin-client�model�does�not�have�a�lower
energy�use�until�roughly�42�or�more�clients
are�attached�per�server.�At�these�use�levels
it�is�expected�that�only�Light�and�Medium
Users�could�be�properly�supported.�Finally
in�the�poor�efficiency�data�center�(PUE�=
3.0)�the�rich-client�managed�desktop�is�the
more�energy�efficient�of�the�two�until�the
thin-client�model�exceeds�65�clients�for
each�server.�At�this�level�of�service�only�the
Light�Users�would�be�expected�to�have
successful�compute�experiences.�In�this
case,�the�first�and�best�opportunity�for
greater�energy�efficiency�is�to�ignore�the
question�of�a�thin-client�implementation
and�understand�where�the�inefficiencies�in
the�data�center�are�and�work�to�reduce
those.�Getting�the�PUE�of�3.0�closer�to�2.0
can�be�reasonably�straightforward�and
requires�no�changes�to�any�compute
models.
The�question�often�comes�up�of�the
additional�cooling�required�to�handle�the
power�dissipated�by�the�desktop�unit.
Should�we�not�consider�the�cost�to�cool�this
additional�load�if�we�(rightfully)�opt�to
consider�it�in�the�data�center�for�the�thin-
client�model?�In�the�most�detailed�level
analysis�one�could�possibly�choose�to
include�Office�PUE,�however�its�inclusion
will�not�vary�the�result�significantly.
Obviously�the�location�of�the�office
environment�affects�this�result�but�in�most
temperate�climates�there�is�both�a�heating
and�a�cooling�season.�The�IT�loads�in�the
office�space�in�the�winter�can�actually
reduce�the�heating�load�due�to�their
consumption�and�dissipation�of�electrical
energy.�This�would�result�in�a�PUE�of�less
than�1.0�(taking�credit�for�reduced�heating
energy�consumption�in�other�systems�in
the�building).�
On�the�other�hand,�the�IT�load�can�increase
the�air-conditioning�load�in�the�summer
with�a�resultant�summer�PUE�greater�than
1.0.�These�effects�will�in�some�part�cancel
out.�Again,�in�the�most�detailed�of�analysis
one�could�consider�this�but�the�analysis
would�take�considerable�modeling�and
effort�for�an�unclear�gain�in�visibility�to�the
energy�consumption�of�the�various�models.
Unlike�the�office�space,�data�centers
generally�require�year�round�cooling�and
don’t�benefit�from�the�seasonal�canceling
out�of�heating�and�cooling�load�of�the
desktop�or�thin�client�in�the�office
environment.
Computer�model�use�and�otherconsiderations
Here�we�will�look�at�several�more
considerations�associated�with�the�end-to-
end�energy�use�of�the�models�and�other
factors,�which�could�impact�their
desirability.�
Travel�–�The�energy�impact�of�travel�is
high,�keeping�workers�from�needing�to
travel�to�off-site�meetings�will�help�reduce
this�impact.�
Online�collaboration�-�tools�continue�to
develop�in�their�capabilities.�Today�with�a
combination�of�video,�voice,�and�real-time
file�sharing�and�manipulation,�these�tools
have�made�the�advantage�of�a�face-to-face
meeting�almost�disappear.
The�computational�requirements�of�these
features�put�this�model�into�the�Advanced
User�category.�Unfortunately�for�the
worker�with�a�thin-client,�the�ability�to�use
these�advanced�collaboration�tools�doesn’t
exist�except�in�very�low�client�to�server
ratios�(approaching�one�client�per�core)�or�is
limited�to�the�point�that�the�online�meeting
will�generate�more�frustration�than�results.
The�thin-client�user�may�actually�carry�an
extra�energy�burden�from�additional�travel.
Beyond�just�the�joules�expended�to�travel
to�the�meeting,�there�is�also�the�lost
productivity�in�the�time�away.
Manageability�– End-users�often�cite
concerns�about�intrusions�in�their
productivity�with�a�well-managed�client,
but�the�intrusions�and�“system�overhead”
or�burden�will�certainly�be�greater�on�the
thin-client�side.
In�either�case,�or�whether�the�concern�is
real�or�imaginary,�the�prospect�for�managed
rich-clients�or�thin-clients�to�reduce�the
non-managed�energy�use�shown�in�figure
four�is�significant�and�should�not�be
overlooked.�From�an�energy�perspective,
non-managed�enterprise�clients�should
become�a�thing�of�the�past.
TCO�– In�most�cases�the�energy�portion�of
the�TCO�model�is�a�smaller�portion�than
other�parts�of�the�cost�model.�Our�analysis
focuses�on�the�energy�used�in�the�different
models�and�does�not�claim�that�any�one�of
them�has�the�best�TCO.�In�many�TCO
models�the�primary�cost�focus�is�on�the
deployment�and�management�of�a�rich-
client�versus�the�thin-client�model.
Reference3�even�estimates�time�needed
for�the�purchasing�department�evaluation
of�alternate�machines.
This�level�of�detail�is�helpful�in�determining
the�real�cost�to�deploy�the�various�models.
However,�the�highest�impact�portion�of�TCO
is�also�the�most�difficult�to�measure,�that
of�any�impact�to�productivity.
Losses�associated�with�lack�of�productivity
are�permanent�and�are�ongoing�for�the�life
of�the�ICT�equipment.
Models�to�predict�productivity�losses�are�a
good�place�to�start,�however�the
importance�of�this�part�of�the�equation�is
such�that�actual�piloting�and�testing�of�the
thin-client�environment�for�all�four�user
types�in�both�simultaneous�and�diverse
workloads�is�likely�warranted.
A�loss�of�productivity�of�only�five�minutes�a
day�is�the�same�as�that�employee�missing
2.5�full�days�each�year.�These�losses
quickly�become�the�predominant�factor�in
any�TCO�analysis.�This�makes�the�client�/
server�ratio�the�critical�aspect�of�making
the�right�choice.

11
White�Paper�Energy�Efficiency
Mobility�– This�aspect�of�the�managed
mobile�client�has�been�a�significant�boost�to
the�productivity�of�many�employees,
particularly�those�in�the�Medium�up�to�the
Advanced�Users�group.�The�ability�to�take
the�work�with�you,�either�home,�in�the
conference�room,�or�on�travel�provides�an
overall�boost�to�worker�productivity�that
also�typically�does�not�appear�in�the�TCO
analysis�comparing�the�different�compute
models.
Data�Center�Impacts�–�The�data�center�has
become�one�of�the�most�expensive�and
complicated�pieces�of�real�estate�in�the
enterprise.�The�capabilities�the�server
manufactures�have�been�able�to�pack�into
smaller�and�smaller�form�factors�challenges
the�data�center�designers�and�facilities
operators�to�keep�pace�in�the�data�center.
Scientific�computing,�web�servicing�of�ultra-
mobile�devices,�search�engines,�enterprise
operations�are�all�increasing�and�putting
pressure�on�the�limited�space.�Through�the
PUE�metric,�we�have�previously�looked�at
how�the�energy�efficiency�of�the�data
center�affects�the�end-to-end�energy�use
of�the�different�models.�Adding�the�cost�of
data�center�space�into�the�economic
evaluation�can�be�more�difficult.�
The�results�of�the�latest�Data�Center�User’s
Group�survey [7],�published�in�May�2008,
indicated�that�the�majority�of�data�centers
are�at�or�near�their�limits.
When�asked�if�the�data�centers�had,�in�the
past�12�months,�capacity�or�other�issues
(e.g.�run�out�of�power,�cooling,�or�space)
only�18�percent�responded�that�they�had
had�no�issues.�For�the�lucky�few�the
marginal�cost�impact�of�an�increased�data
center�load�can�be�calculated.�For�the�rest,
the�cost�and�operations�impact�of�the�need
to�expand�the�data�center�or�its
infrastructure�must�be�fully�analyzed
before�adding�new�thin-client�architecture
to�this�critical�and�stressed�enterprise
asset.
Those�who�fully�understand�data�centers
no�longer�discuss�them�in�terms�of�Euros�/
square�meter�but�rather�in�terms�of�Euros�/
kW�of�connected�IT�load.
Current�estimates [8] are�that�new�data
centers�can�cost�up�to�EUR�8900�/�kW�of�IT
load.�(Assuming�USD�1.57�/�EUR�1.00).�For
typical�servers�used�in�thin-client
applications�this�will�require�the�cost�model
to�account�for�an�additional�EUR�3000�to
EUR�4500�capital�costs�per�server�to�cover
the�cost�of�the�data�center.
Conclusion
There�are�uses�for�all�types�of�compute
models.�A�bank�teller�(where�creativity�may
be�considered�more�of�a�detriment�than�an
asset)�may�find�a�thin-client�perfectly
adequate.�For�knowledge�workers,�those
developing�value-added�content�and
information,�notebooks�are�clearly�best
when�we�balance�capability�and�energy
efficiency.�And�it�is�NOT�appropriate�to
assume�that�thin-client�models�are
necessarily�optimized�for�or�are�the�best
answer�for�energy�efficiency.
Their�strengths�in�the�security�and�control
of�applications�are�where�they�excel�and
where�optimization�will�continue�to�occur.
We�have�shown�above�that�the�main�impact
of�the�end-to-end�energy�efficiency�in�the
thin-client�vs�managed�client�discussion�is
how�the�thin-client�leverages�or�burdens
the�data�center.�When�the�number�of
clients�per�server�goes�up,�the�watts�per
user�can�drop.�But�this�may�be�at�the
expense�of�the�range�and�performance�of
compute�capabilities.�The�PUE�of�the�data
center�needs�to�be�understood,�with�lower
PUEs�allowing�a�greater�chance�for�success
that�the�thin�client,�with�the�appropriate
clients�per�server,�can�be�more�energy
efficient�than�the�managed�desktop.
However,�our�model�showed�that�under�the
full�range�of�parameters�mobile�(with�or
with-out�a�monitor)�uses�less�energy�than
the�thin-client�model.�The�need�for
reducing�the�carbon�footprint�of�all�of�our
ICT�loads�is�obvious;�the�question�is�more
about�what�is�the�best�way�to�do�this?�A
rush�to�a�purported�energy�efficient�thin-
client�model�has�the�risk�of�constraining
productivity,�increasing�complexity�and
negatively�impacting�the�data�center�when
the�majority�of�the�energy�saving�gains�can
be�obtained�through�a�wise�selection�of
client�type�and�a�concerted�effort�to�apply
existing�power�management�capabilities.
7 Spring 2008 Data Center Users Group® Survey Results, Liebert Corporation, 2008.8 Patterson, Michael K, et. al.: Data Center TCO; a comparison of high-density and low-density spaces. THERMES 2007, Santa Fe, 2007.

©�2011,�Intel�Corporation.�All�rights�reserved.�Intel,�the�Intel�logo�and�Intel�Core�are�trademarks�of�Intel�Corporation�in�the�U.S.�and�other�countries.
*Other�names�and�brands�may�be�claimed�as�the�property�of�others.
Performance�tests�and�ratings�are�measured�using�specific�computer�systems�and/or�components�and�reflect�the�approximate�performance�of�Intel®
products�as�measured�by�those�tests.�Any�difference�in�system�hardware�or�software�design�or�configuration�may�affect�actual�performance.�Buyers
should�consult�other�sources�of�information�to�evaluate�the�performance�of�systems�or�components�they�are�considering�purchasing.�For�more
information�on�performance�tests�and�on�the�performance�of�Intel�products,�visit�http://www.intel.com/performance/resources/limits.htm�or�call�(U.S.)
1-800-628-8686�or�1-916-356-3104.
Printed�in�USA�����0111/JMW/MDC/XX/PDF����� Please�Recycle
This�document�and�the�information�given�are�for�the�convenience�of�Intel’s�customer�base�and�are�provided�“AS�IS”�WITH�NOWARRANTIES�WHATSOEVER,�EXPRESS�OR�IMPLIED,�INCLUDING�ANY�IMPLIED�WARRANTY�OF�MERCHANTABILITY,�FITNESS�FOR�APARTICULAR�PURPOSE,�AND�NONINFRINGEMENT�OF�INTELLECTUAL�PROPERTY�RIGHTS.�Receipt�or�possession�of�this�documentdoes�not�grant�any�license�to�any�of�the�intellectual�property�described,�displayed,�or�contained�herein.�Intel®�products�are�notintended�for�use�in�medical,�lifesaving,�life-sustaining,�critical�control,�or�safety�systems,�or�in�nuclear�facility�applications.