Embed Size (px)
Citation preview
Personnel Appeals Board
Mary E. Leary, Chair
Steven Svartz, Vice-Chair
Paul M. Coran, Member
Personnel Appeals Board Staff Beth L. Don, Executive Director
M. Gail Gerebenics, Director of EEO Oversight
Susan P. Inzeo, Solicitor
Sue Sung Farley, Senior Attorney
Patricia Reardon-King, Clerk of the Board
Table of Contents
Chapter I Background 1 Methodology 2 The SES at a Glance 3 Congressional Interest and Initiatives 7 Legislation 8
Chapter II
Types of SES Appointments at GAO 10 The Role of the Executive Resources Board 12 Executive Candidate Assessment and Development Program 14
Chapter III The Selection Process by Age 16 The Selection Process by Race and National Origin 20 The Selection Process by Gender 25 The Selection Process by Disability 25 CG Career Appointments 26 Limited Term Appointments 27
Chapter IV Conclusion 29 Recommendations 30
Appendix Tables 32 Comments from GAO
Chapter I
Background
The Civil Service Reform Act of 1978 created a Senior Executive Service (SES) for the
Executive branch to ensure that the executive management of the Federal Government would be
“responsive to the needs, policies, and goals of the Nation and otherwise is of the highest
quality.”1 Two years later, Congress passed the Government Accountability Office Personnel
Act of 1980 (GAOPA) which established a personnel system for GAO designed to operate
independent of the Executive branch. That same Act created the Personnel Appeals Board (PAB
or the Board) and gave the Comptroller General (CG) the authority to establish a Senior
Executive Service that met the statutory requirements of the Executive branch’s SES corps.2
The SES at GAO came into being in October 1980.3
This study is not the first time that the Board has taken an in-depth look at the SES. In
1998, the Board published an EEO Oversight report entitled Selection into the Senior Executive
Service at GAO (1992-1997) based on a study of the selection process for the SES at GAO over a
1 5 U.S.C. §3131. 2 31 U.S.C. §733. “The Comptroller General is free to establish a Senior Executive Service and a system of merit pay, if the Comptroller wants to do so. If GAO does establish a Senior Executive Service or a system of merit pay, it must follow certain basic guidelines, parallel to those existing in executive branch agencies.” 125 Cong. Rec. H9182 (daily ed. Oct. 10, 1979) (statement of Rep. Schroeder). 3 GAO Order 0768.1, GAO’s Senior Executive Service (June 1980). Although the Order was promulgated in June, its effective date was October 5, 1980.
1
five year period.4 In that report, the Board found that, with respect to race, national origin and
gender, the SES corps resembled the composition of the pool of employees eligible for selection.
The Board did note an inconsistency between the available pool of those eligible to apply for
SES positions and selectees by age in that employees below age 50 were disproportionately
successful in being selected and those 50 and over were disproportionately unsuccessful. In
addition, the report concluded that the pool of black and Hispanic employees eligible to apply for
SES vacancies was well below their overall representation in the Agency.5
In 2004, the Board took another look at the SES as part of its overall study of the state of
Equal Employment Opportunity at GAO and found that no Hispanic employees had been
appointed to the SES between the years 1999 and 2004. In addition, black females and
Hispanics constituted a smaller percentage of the SES ranks in comparison to their representation
in the pool of those eligible to apply for SES vacancies. Women continued to make gains in the
executive ranks and older employees and persons with disabilities were appointed to the SES in
much higher numbers than was the case in the Board’s 1998 study.6
Methodology
In its most recent study, which focused on retention at GAO, among the issues the Board
looked at was diversity in the supervisory and management ranks. In its report, the Board
compared the SES at GAO in 1997 to the SES at GAO in 2009 and observed the following:
4 EEO Oversight studies are conducted pursuant to the Board’s mandate to review and evaluate the regulations, procedures and practices of GAO as they relate to equal employment opportunity and to assess the Agency’s efforts in a particular area. 31 U.S.C. §732(f)(2)(A); 4 C.F.R. §§28.91, 28.92(b). 5 Selection Into the Senior Executive Service at GAO (1992-1997) at 31 (1998) [hereinafter Selection into the SES]. The Board’s EEO Oversight reports are available at www.pab.gao.gov. 6 The State of Equal Employment Opportunity at GAO in the 21st Century at 37-38 (Oct. 2005).
2
With the exception of white females, over the span of 12 years, little progress has actually been made in the overall diversity in the SES corps at GAO, with black males and Asian females remaining static and with Asian males and black and Hispanic females making gains, the latter increasing in number from two to four.7
Those observations led the Board to conclude that further study of the SES at GAO was
both warranted and timely. Much like in its earlier report, the Board is focusing on the “feeder
pool” for the SES in this study that covers the years 2001 through 2009.8 The analysis of the
data relevant to that pool allows a comparison of the representation of employees, by race,
gender, national origin, age and disability, in the Agency, as a whole, in the pool of those eligible
to apply for SES positions, and in the pool of those internal candidates who applied for SES
vacancies.9
In addition, the report will compare the SES employees at GAO to those working in a
number of similarly sized Executive branch agencies.
The SES at a Glance
The following charts show the composition of the SES at GAO and within the Executive
branch by race, national origin, and gender during the time period of this study.
7 The Retention of New Hires at GAO (forthcoming 2010). 8 The feeder pool is a term meant to describe those employees at GAO who are eligible to apply for SES vacancies (also known as developmental or successor pools). At GAO, that means Band III analysts, specialists, and attorneys, and PT-IV and MS-II for some vacancies. The analyst and analyst-related population remains the predominant feeder pool for the Executive Candidate Assessment and Development Program (ECADP). 9 As of December 2009, GAO’s workforce was 69.4% white and 30.6% minority. African Americans made up 18% of GAO employees; Asian Americans, 7.4%; and Hispanics, 4.7%; the feeder pool was 80.2% white and 19.8% minority. African Americans were 11.7% of the pool; Asian Americans, 4.2%; Hispanics, 3.8%; and American Indian, .1%.
3
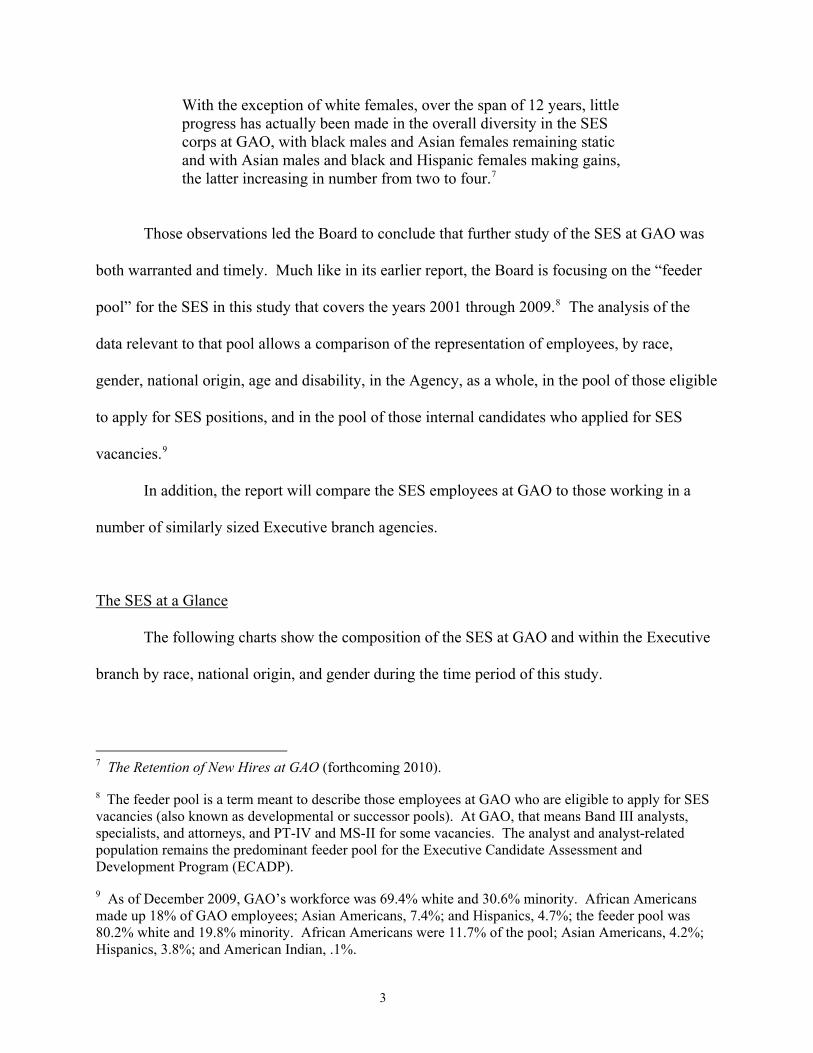
Charts 1 & 2: SES Corps at GAO and the Executive Branch by Race, National Origin and Gender (2001-2009)10
Source: Analysis of GAO and OPM data
10 The letters in the legend stand for: white female, white male, black female, black male, Hispanic female, Hispanic male, Asian American female, Asian American male. Some of the charts in this report also include AIF (American Indian or Alaskan Native female) and AIM (American Indian or Alaskan Native male) when someone has self-identified as such.
4
From 2001 to 2009, the comparison of demographic changes within the SES at GAO
showed that white females had the largest increase from 32 to 46 employees, resulting in an
increase from 30% to 35.7% of the total SES complement.11 While the number of white males
remained constant at 62, the decrease in the percentage of white males was the largest, declining
from 57.9% to 48.1% due to an increase in the total number of SES employees at GAO. The
number of black females tripled from 2 to 6, resulting in an increase from 1.9% to 4.6%. The
number of Hispanic females and Asian males both increased from 1 to 4 employees, resulting in
an increase from .9% to 3.1%. GAO lost 3 Hispanic males in the SES during the years on which
this study is focused. Overall, the SES in 2009 at GAO is 16.3% minority compared to 12.1% at
the inception of this study and 44.9% female, compared to 33.6% in 2001.
Similarly, the Executive branch experienced the largest percentage decrease of white
males from 2001 to 2009 and also experienced a loss of Hispanic males during this period. The
Executive branch SES, which has 7,712 members, is 16.9% minority, compared to 14% in 2001.
The Executive branch SES currently is 30.7% female, up from 24.4% in 2001.
To compare GAO to individual Executive branch agencies, the National Archives and
Records Administration (NARA), the Nuclear Regulatory Commission (NRC), the Office of
Personnel Management (OPM), and the Small Business Administration (SBA) were chosen
because of their similarity in size to GAO.12 The following chart shows the breakdown of each
agency’s SES by race, national origin and gender in 2009.
11 See Tables 14 and 15 in the Appendix at 31. 12 NARA has 20 SES members; NRC has 162; OPM has 54 members of the SES on its rolls; SBA has 55 members; and, GAO has 129.
5
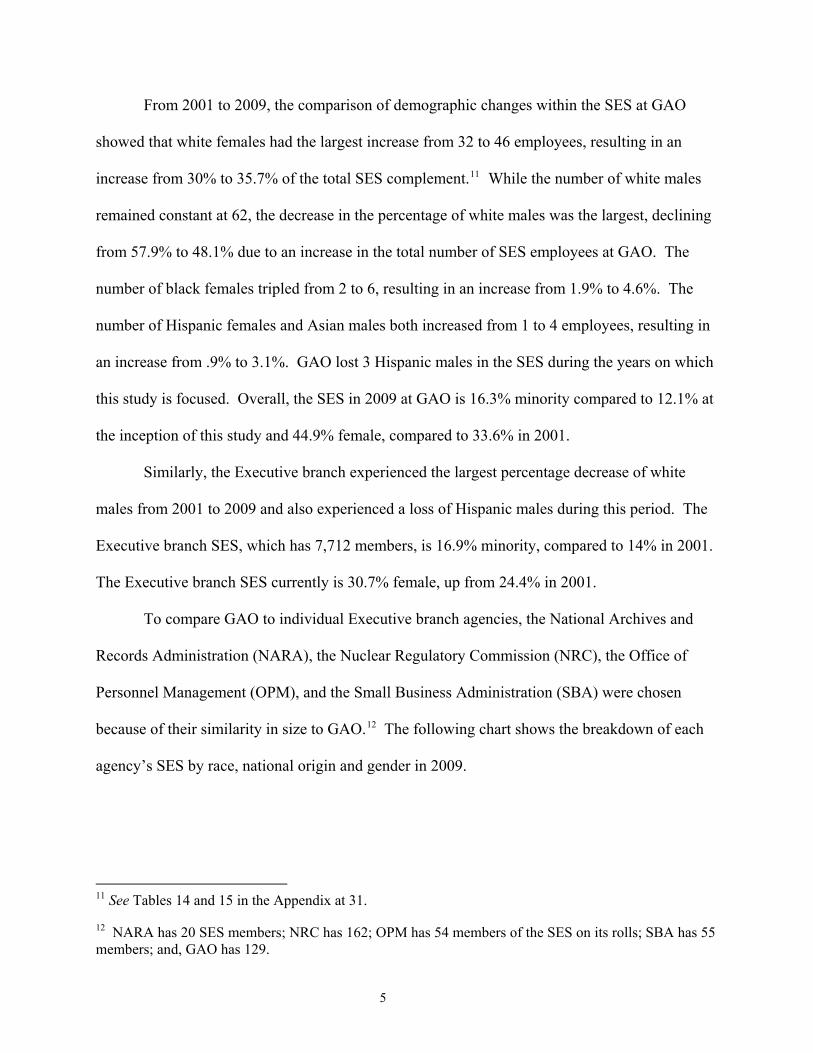
Chart 3: SES Corps at 5 agencies by race, national origin and gender in 2009
Source: OPM data.
As the chart shows, the SES at NARA has no minority members; OPM has no Asian
American females; and GAO has no Hispanic males. White males are over 50% of the SES at
NARA and NRC. Although the agencies are similar in size to GAO, only NRC has
comparability to GAO with respect to the size of its SES corps. In 2009, NARA had 20 SES
members; NRC, 162; OPM had 54 members of the SES on its rolls; SBA had 55 members; and,
GAO had 129.
6
Congressional Interest and Initiatives
The House of Representatives Subcommittee on Federal Workforce, Postal Service, and
the District of Columbia issued a report late in 2007 entitled Senior Executive Service: Women
and Minorities Are Underrepresented in Most Legislative Branch Agencies.13 The report
focused on GAO, the Library of Congress and Congressional Research Service (LOC/CR
Congressional Budget Office (CBO), the Government Printing Office (GPO), the Capitol Police,
and the Architect of the Capitol (AOC), noting that in FY 2007, the six legislative branch
agencies employed a total of 13,332 people, 346 of whom were in the SES (2.6% of the overall
workforces).
S), the
14
The report, the first ever to analyze diversity in the senior ranks of the legislative branch
agencies, contains five specific findings.15 Chief among those findings are that “[t]he SES at
each agency was less diverse in terms of minorities than its workforce as a whole in FY 2007. . .”
and that “[t]he representation of minorities in the legislative branch SES has stagnated and the
representation of women improved only slightly between FY2002 and FY 2007.”16
13 Majority Staff of Subcomm. on Fed. Workforce, Postal Service, and the District of Columbia of the H. Comm. on Oversight and Gov’t. Reform, 110th Cong. (Comm. Print 2007). 14 GAO and LOC/CRS accounted for 70.5% of the senior executives in the six agencies. Id. at 2. 15 Diversity in the SES in the Executive branch, however, has been of interest to Congress since the 1990s when GAO was first asked to undertake a study of that issue, resulting in a report entitled, Senior Executive Service: Diversity Increased in the Past Decade, GAO (Mar. 2001). Two years later, GAO was asked to “explore the implications for diversity, as defined by race, ethnicity, and gender, of the expected loss of SES members over the next several years.” Senior Executive Service: Enhanced Agency Efforts Needed to Improve Diversity as the Senior Corps Turns Over at 1 (Jan. 2003). GAO updated its 2003 report five years later. Diversity in the Federal SES and Processes for Selecting New Executives (Nov. 2008). The latter two reports focused particularly on the representation of women and minorities in the developmental or feeder pools for the SES. 16 Senior Executive Service: Women and Minorities Are Underrepresented in Most Legislative Branch Agencies at i.
7
That report was issued in conjunction with a November 2007 hearing before the same
subcommittee at which Ronald Stroman, then Managing Director of GAO’s Office of
Opportunity and Inclusiveness, testified. According to Mr. Stroman, minority representation
overall in the SES corps at GAO improved from 14% to 18% between 2000 and 2007; more
significantly, minority representation in the SES feeder pool (Band III) increased from 12% to
19% during the same time period.17 He acknowledged, however, that GAO’s percentages of
Hispanics at the SES level and Asian Americans at the Band III level were lower than
government wide percentages.18
In the two years after the Managing Director’s testimony, minority representation in the
feeder pool at GAO increased to 20%; minority representation in the SES, however, dropped
from 18% to 16.3%.
Legislation
In 2007 and, again, in 2009, legislation was introduced in both the House of
Representatives and the Senate that addressed the issue of diversity in the Executive branch SES.
The Act, known as the Senior Executive Service Diversity Assurance Act, would establish a
Senior Executive Resource Office (SERO) in OPM charged with oversight of the structure,
management and diversity of the SES.19 In addition to its oversight responsibilities, SERO
17 During the same time period, minority representation in the executive branch SES increased from 13.9% to 15.8%; minority representation in the feeder pool increased from 17% to 22.5%. 18 Senior Executive Service: Women and Minorities Are Underrepresented in Most Legislative Branch Agencies, Hearing Before the Subcomm. on Fed. Workforce, Postal Service, and the District of Columbia of the H. Comm. on Oversight and Gov’t. Reform, 110th Cong. (2007) (statement of Ronald A. Stroman, Managing Director, Office of Opportunity and Inclusiveness). [Hereinafter Stroman statement]. 19 H.R. 2721, S.1180, 111th Cong. (2009). In 2007, the House of Representatives passed H.R. 3774 (June 3, 2008); S. 2148 failed to pass the Senate prior to its adjournment.
8

would also establish mentoring programs for potential SES candidates, conduct a continuing
program for the recruitment of women, members of minority groups, and people with
disabilities. The Act also would create evaluation panels to review the qualifications of the
candidates. The panel, which must endeavor to include minorities and women among its three
members, will forward the names of the most qualified candidates to the Executive Resources
Board after its review. Both bills are currently pending in subcommittees in the House of
Representatives and the Senate.
9
Chapter II
Types of SES Appointments at GAO
There are three types of appointments to the SES at GAO: Career Appointments, CG
Career Appointments, and Limited Term Appointments. Career appointments are not time-
limited and are made competitively through a recruitment and selection process or by way of the
Executive Candidate Assessment and Development Program (ECADP);20 noncompetitively
through a transfer from an Executive branch SES position; or reinstatement after leaving the SES
for reasons other than misconduct, neglect of duty, malfeasance, or less than fully successful
performance, or resignation after receiving notice proposing removal under any of the
aforementioned conditions.21
CG Career Appointments22 are also not time-limited and are based on merit competition
but the appointee’s executive qualifications for the position are approved by the CG rather than
by GAO’s Executive Resources Board (ERB).23
The third type of appointment, Limited Term, allows the CG to make noncompetitive
appointments to the SES for up to three years; some of those appointments are renewable.
Appointees under this authority serve at the pleasure of the CG and do not serve a probationary
20 Since the Board’s study in the 1990s, the name of the program changed from the Executive Candidate Development Program to the Executive Candidate Assessment and Development Program. 21 GAO Order 2317.1, GAO’s Senior Executive Service and GAO Senior Level Positions, ch. 2, ¶5(a) (Dec. 2009). 22 Id. ¶5(b). An SESer in a CG career appointment position is not eligible to transfer noncompetitively to a career civil service SES appointment in the executive branch. Id., ¶10(a). 23 The Executive Resources Board is comprised of SES members appointed by the CG. See infra p. 13. The Board conducts the merit staffing process for the SES and Senior Level positions and oversees the ECADP. Id. ch. 1, ¶6(d).
10
period.24 The number of these appointments that the CG can make is restricted by statute to not
more than 15 experts and consultants.25
The primary source for SES appointments at GAO is the ECADP, which was established
in 1980 to provide GAO with a pool of candidates who, after an intensive training period, are
expected to have developed the requisite management, technical, and program skills to perform
successfully as executives at the Agency.26 Every year, the ERB considers the number of
projected vacancies in the SES for the upcoming year, and, depending on needs, may authorize
recruitment of candidates to the ECADP from inside GAO and the federal service and, on
occasion, outside the federal civil service. The application process for both internal and external
applicants is the same.27 The ERB rates and ranks the applicants on their professional and
technical qualifications and determines who among them are the best-qualified.28 In addition,
O&I reviews the list of applicants, considering both the diversity of the list as a whole and also
determining whether there are any issues regarding the diversity management practices of any
24 Id. ch. 2, ¶5(c). 25 31 U.S.C. §731(e)(1). 26 GAO Order 0768.1, Ch. 3 (June 1980). See also, Csicseri v. Bowsher, 862 F.Supp. 547, 554 (D.D.C. 1994), aff’d mem., 67 F.3d 972 (D.C. Cir. 1995). 27 Previously, GAO applicants who wished to be considered for ECADP vacancies were required to submit a memorandum to their unit heads who, in consultation with supervisors, would select the nominees for consideration for the vacancies. 28 The Executive Core Qualifications on which each applicant is evaluated are: Leading Change, Leading People, Results Driven, Business Acumen, and Building Coalitions/Communications. There are, in addition, five Professional and Technical Qualifications to which applicants must match their experience, education, and accomplishments.
11
candidate, and provides its comments to the CG.29 The ERB’s list of the best-qualified
candidates is forwarded to the CG, who makes the final selections.30
Following selection, each candidate undergoes a skills and ability assessment and then
receives specific training designed to develop executive competencies. In consultation with a
mentor, the candidate prepares an individual development plan. Once a candidate completes his
or her development program, which is usually about 18 months to two years, he or she is eligible
for an immediate, non-competitive appointment to the SES at GAO.31 The candidates retain
their eligibility for the two year period following successful completion of their development
programs.
The Role of the Executive Resources Board
The ERB is responsible for staffing the Agency’s SES and Senior Level (SL) positions
which includes reviewing the qualifications of career appointees to those positions.32 Upon
request, the ERB conducts reviews of SES or SL performance appraisals and also oversees the
ECADP.
The ERB, which meets monthly or biweekly, as needed, is composed of members of the
SES, with the Chief Administrative Officer (CAO), the Chief Human Capital Officer (CHCO),
and the General Counsel (GC) serving as permanent members. There are also 2-3 term members
29 Stroman statement at 8. 30 GAO Order 2317.1, Appendix 1. 31 Id. ch. 10, ¶2. 32 GAO’s Senior Level position system was established as part of the GAO Personnel Flexibility Act of 2000 and was designed to meet “critical scientific, technical or professional needs” of the Agency. 31 U.S.C. §732a.
12
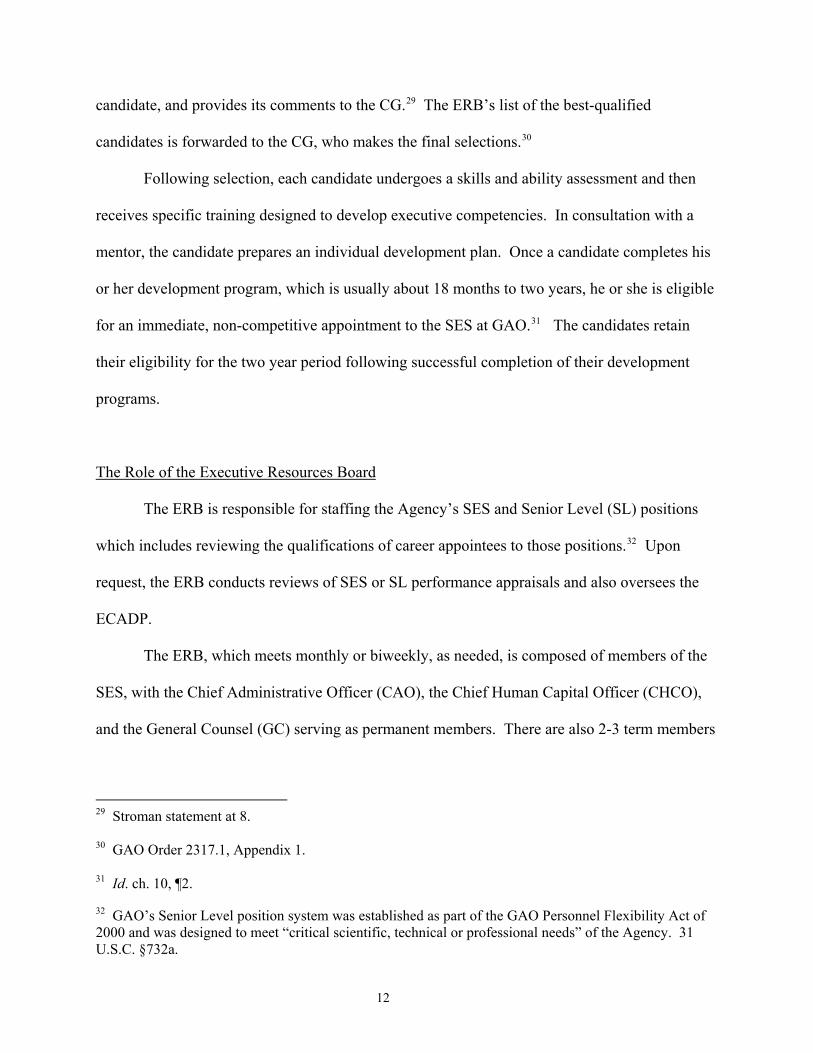
and an occasional ad hoc member. Between December 2000 and June 2009, the composition of
the ERB changed 10 times.
Table 1: Composition of the ERB (2001-2009)
ERB WF WM BF BM HF HM AF AM 12/00-3/01
2 1 1 1
3/01-6/03 2 1 1 1 6/03-3/06 2 1 1 1 3/06-6/06 2 1 1 1 1 1 7/06-4/07 2 2 1 1 1 4/07-10/07
2 2 1 1 1
10/07-2/08
2 2 1 1
2/08-4/08 2 2 1 4/08-5/09 2 2 1 1 5/09-6/09 2 2 1 1
Source: GAO data
The permanent members of the first four ERBs constituted during the time period of this
study were a white female, a black male, and a Hispanic male; between April 2007 and
December 2009, the permanent members were white: two females and one male. Efforts to
maintain diversity of the ERB have been made through the selection of the Term Members (i.e.,
non-permanent) who have included a black female, a black male, and an Asian female.33
The ERB may appoint a screening panel composed of members of GAO’s Senior
Executive Service to rate the applicants or to interview them. Each rater fills out a worksheet on
33 None of the permanent or temporary members was under 40; three of the permanent members were 60 or older. One of the permanent members who served on each of the 10 panels has a non-severe disability.
13
each applicant, grading them on the Professional and Technical Qualifications (PTQs) and
Executive Core Qualifications (ECQs) contained in the relevant vacancy announcement. After
completing the ratings, the raters’ worksheets are sent to the Human Capital Office which
compiles the scores and prepares a ranked list of the applicants. The panel also establishes a cut-
off score and only those applicants whose combined score exceeds the cut-off are considered by
the ERB for transmittal to the CG.
Executive Candidate Assessment and Development Program
Once the ERB determines the number of projected vacancies throughout the Agency, a
vacancy announcement for the ECADP program is posted on the Office of Personnel
Management’s USAJOBS web site. Recruitment of candidates includes, at a minimum, all
qualified persons within all three branches of the federal service, except the uniformed services.
Some of the vacancy announcements welcome candidates from outside the federal service who
have the requisite managerial experience and skills. The reality, however, is that very few
external applicants are accepted into the program. In testimony before a Congressional
subcommittee, GAO’s Inspector General related that Agency officials interviewed by her office
pointed to past experiences that demonstrated that external candidates may face too daunting a
task, trying to assimilate into GAO’s SES audit methodology and culture while leading staff that
is knowledgeable of and experienced in the Agency’s unique practices and procedures.34
The ERB rates and ranks the applicants for the EACPD on their professional, technical,
and executive core qualifications to determine who among them is best qualified and then
forwards the list to the CG who makes the final selections. 34 Legislative Branch Diversity Management Review, Hearing Before the Subcomm. on Fed. Workforce, Postal Service, and the District of Columbia of the H. Comm. on Oversight and Gov’t. Reform, 110th Cong. (2008) (statement of Frances Garcia, Inspector General, GAO). [Hereinafter Garcia statement].
14
The ECADP selection process has been streamlined since the Board’s last study of the
SES at GAO in the 1990s. Under the earlier process, GAO employees who wished to be
considered for an SES appointment through the ECADP had to request nomination to the
program, in writing, from their unit heads who would then consult with each requestor’s SES
supervisor to determine each employee’s potential to perform successfully at the SES level. The
unit heads would then select their nominees to the program.35 Now, all internal and external
applicants apply directly to the ERB.36
35 When the unit screening system was employed, the Board noted that during the five years of its study, one Asian employee of seven and no Hispanic employee who requested consideration for the ECADP survived the unit level screening. In addition, the Board found that employees between 50 and 59 constituted 24.3% of the requestors at the unit level but were only 9.8% of the units’ nominees to the ERB. See infra p. 18. 36 Selection into the SES at 30. Currently, there is no comparable screening process similar to the unit screening prior to application to the EACPD. The comparisons made in this study to the previous study are to those applicants who survived the unit screening process and made it to the ERB to be considered for selection (nominees).
15
Chapter III
The Agency recruited and selected seven ECADP classes between 2001 and 2009, taking
a total of 70 candidates into the program from the 217 who applied. Internal candidates from
GAO constituted 151 of the 217 applicants.37 The ERB determined that 79 of the applicants
were best qualified and sent their names to the CG for selection.
The Selection Process by Age
In 1994, a six day trial was held in the U.S. District Court for the District of Columbia
concerning allegations that employees over 50 years of age had been passed over for selection to
the Executive Candidate Development Program at GAO.38 At the time the lawsuit was filed, 10
ECDP classes had formed since GAO first established an SES at GAO in 1980 and 116
employees had been accepted into the program. The court disposed of the seven individual
plaintiff’s allegations of age discrimination by finding that age was not a factor in the non-
selection of each plaintiff for the ECPD. The plaintiffs, however, also alleged an “invidious
pattern of age discrimination at GAO,” pointing to the fact that no one over the age of 50 had
been selected for the ECDP since its inception.39 Although the court was troubled by that
“inexorable zero,” it noted that it was possible to have chosen no one over the age of 50 and
remain within the realm of statistical chance because there were so few candidates that age.40
Ultimately, the court concluded that the plaintiffs failed to identify specific GAO practices that 37 There is no EEO data available for the 66 external applicants. The applicant questionnaire that accompanies the application and asks for demographic information states: “Completing this questionnaire is voluntary,” which is standard practice throughout the Government. 38 Csicseri v. Bowsher, 862 F.Supp. 547, 554 (D.D.C. 1994), aff’d mem., 67 F.3d 972 (D.C. Cir. 1995). 39 Id. at 560. 40 Id. at 567.
16

caused discriminatory impact or manifested themselves as discriminatory.41 Although the
plaintiffs were unsuccessful in proving their age discrimination claims with respect to the ECPD
selection process, the decision, which issued during the Board’s earlier study, foreshadowed a
concern identified by the Board.
In its 1998 report on GAO’s selection process for the SES, the Board noted, in particular,
a “lack of congruence” among the available pool, the applicants, and the eventual selectees to the
ECADP based on age. The Board observed that employees under 50 were “disproportionately
successful” in being selected relative to their representation in the pool. Conversely, those 50
and over were “disproportionately unsuccessful.”42 The following Tables show that midway
through the study (1995), employees under 49 constituted 61.5% of the feeder pool; 90% of the
ERB nominees; and 93% of the selectees. Employees 50 and over made up 38.5% of the feeder
pool; 10% of the nominees; and, 7% of the selectees.
However, as the following charts and tables also illustrate, there have been dramatic
increases, numerically and percentage-wise, in both the applications and selections of persons 50
and older to the ECADP. For example, 73 GAO employees over the age of 50 applied for
ECADP vacancies between 2001 and 2009, nearly the same number as the 70 who were between
40 and 49. Comparable figures from the Board’s earlier study show that 10 GAO employees 50
and over applied during that time period as opposed to 76 who were between 40 and 49.
Moreover, the number of candidates selected for the ECADP who were between 40 and 49 was
the same as the number of those 50 or more, a 39% increase in that age category since the
Board’s last study.
41 Id. at 574. 42 Selection into the SES at 30.
17
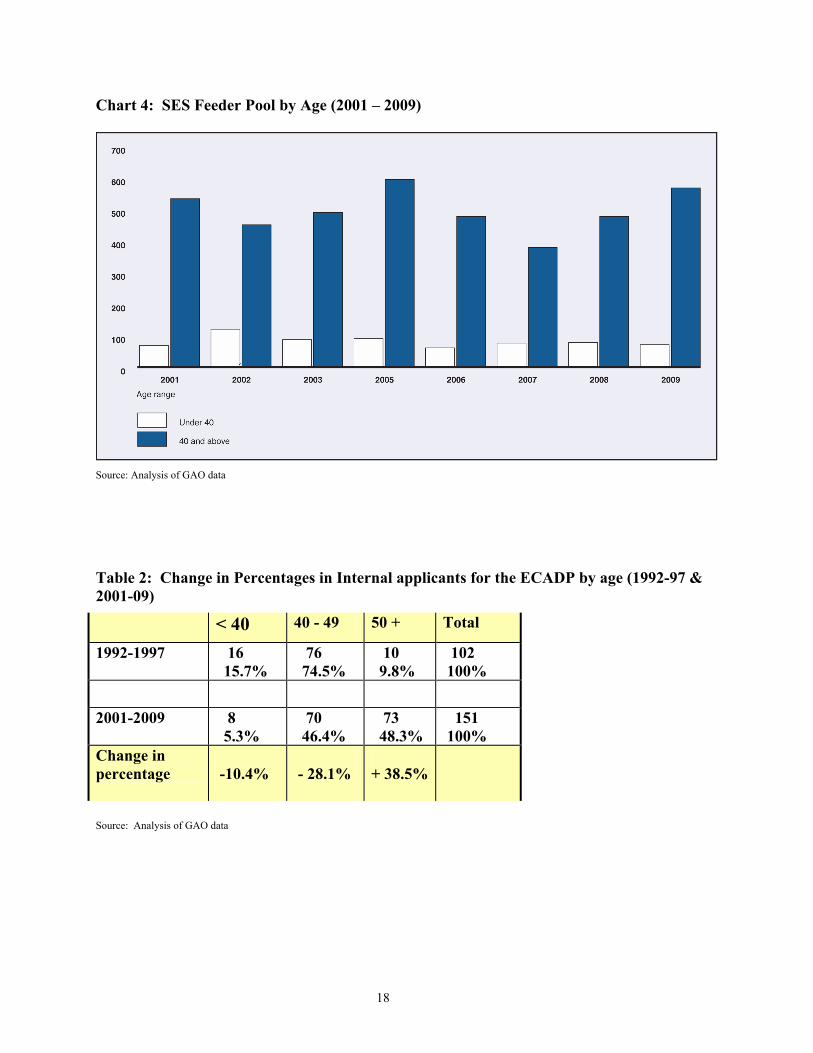
Chart 4: SES Feeder Pool by Age (2001 – 2009)
Source: Analysis of GAO data
Table 2: Change in Percentages in Internal applicants for the ECADP by age (1992-97 & 2001-09) < 40 40 - 49 50 + Total
1992-1997 16 15.7%
76 74.5%
10 9.8%
102 100%
2001-2009 8 5.3%
70 46.4%
73 48.3%
151 100%
Change in percentage
-10.4%
- 28.1%
+ 38.5%
Source: Analysis of GAO data
18
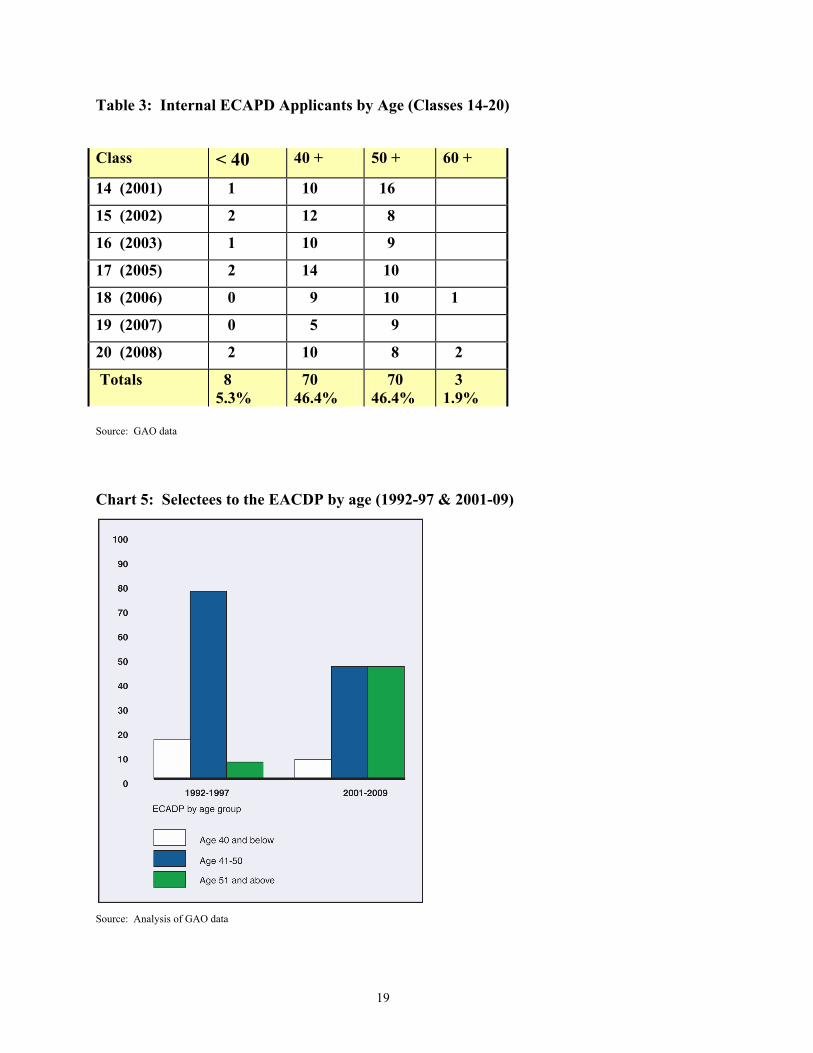
Table 3: Internal ECAPD Applicants by Age (Classes 14-20) Class < 40 40 + 50 + 60 +
14 (2001) 1 10 16
15 (2002) 2 12 8
16 (2003) 1 10 9
17 (2005) 2 14 10
18 (2006) 0 9 10 1
19 (2007) 0 5 9
20 (2008) 2 10 8 2
Totals 8 5.3%
70 46.4%
70 46.4%
3 1.9%
Source: GAO data
Chart 5: Selectees to the EACDP by age (1992-97 & 2001-09)
Source: Analysis of GAO data
19
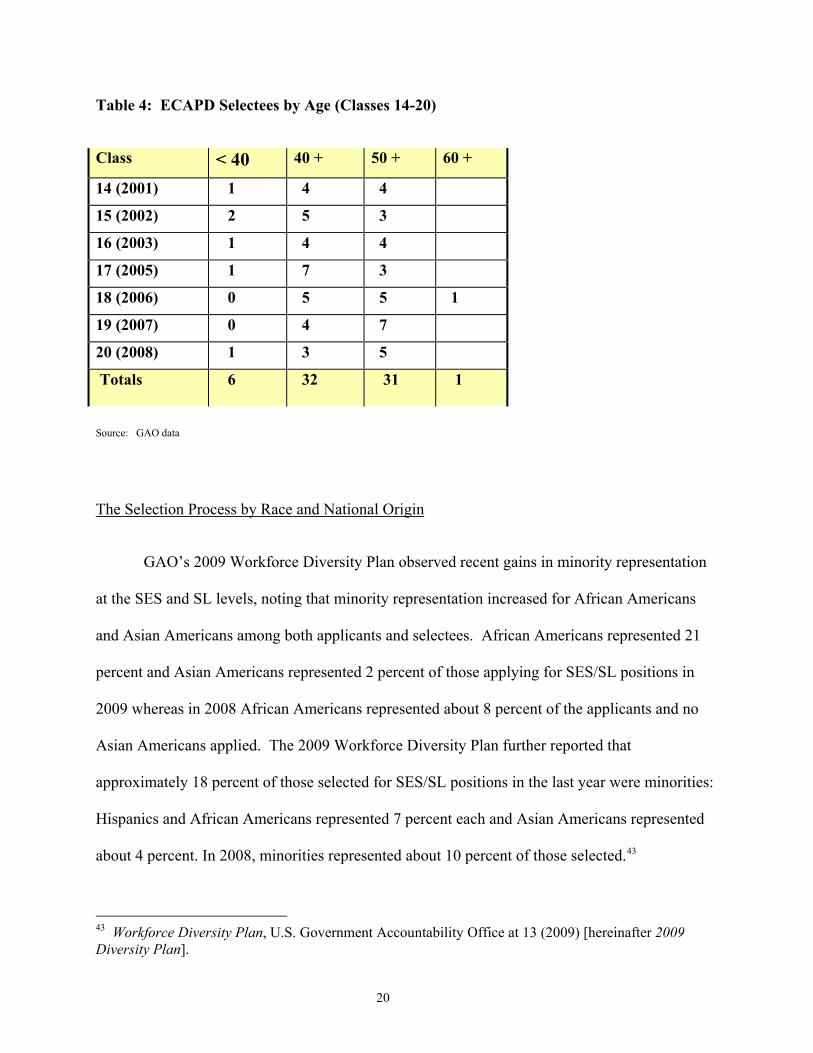
Table 4: ECAPD Selectees by Age (Classes 14-20) Class < 40 40 + 50 + 60 +
14 (2001) 1 4 4
15 (2002) 2 5 3
16 (2003) 1 4 4
17 (2005) 1 7 3
18 (2006) 0 5 5 1
19 (2007) 0 4 7
20 (2008) 1 3 5
Totals 6
32 31 1
Source: GAO data
The Selection Process by Race and National Origin
GAO’s 2009 Workforce Diversity Plan observed recent gains in minority representation
at the SES and SL levels, noting that minority representation increased for African Americans
and Asian Americans among both applicants and selectees. African Americans represented 21
percent and Asian Americans represented 2 percent of those applying for SES/SL positions in
2009 whereas in 2008 African Americans represented about 8 percent of the applicants and no
Asian Americans applied. The 2009 Workforce Diversity Plan further reported that
approximately 18 percent of those selected for SES/SL positions in the last year were minorities:
Hispanics and African Americans represented 7 percent each and Asian Americans represented
about 4 percent. In 2008, minorities represented about 10 percent of those selected.43
43 Workforce Diversity Plan, U.S. Government Accountability Office at 13 (2009) [hereinafter 2009 Diversity Plan].
20
However, the 2009 Diversity Plan also pointed out that the percentage of Hispanics
among the applicants and those selected declined. Hispanics represented about 6% of the
applicants and about 7% of those selected in 2009 compared to about 8% of the applicants and
those selected in 2008. Nonetheless, Hispanic representation within the SES/SL increased from
1.7% in 2008 to 3.1% in 2009.44
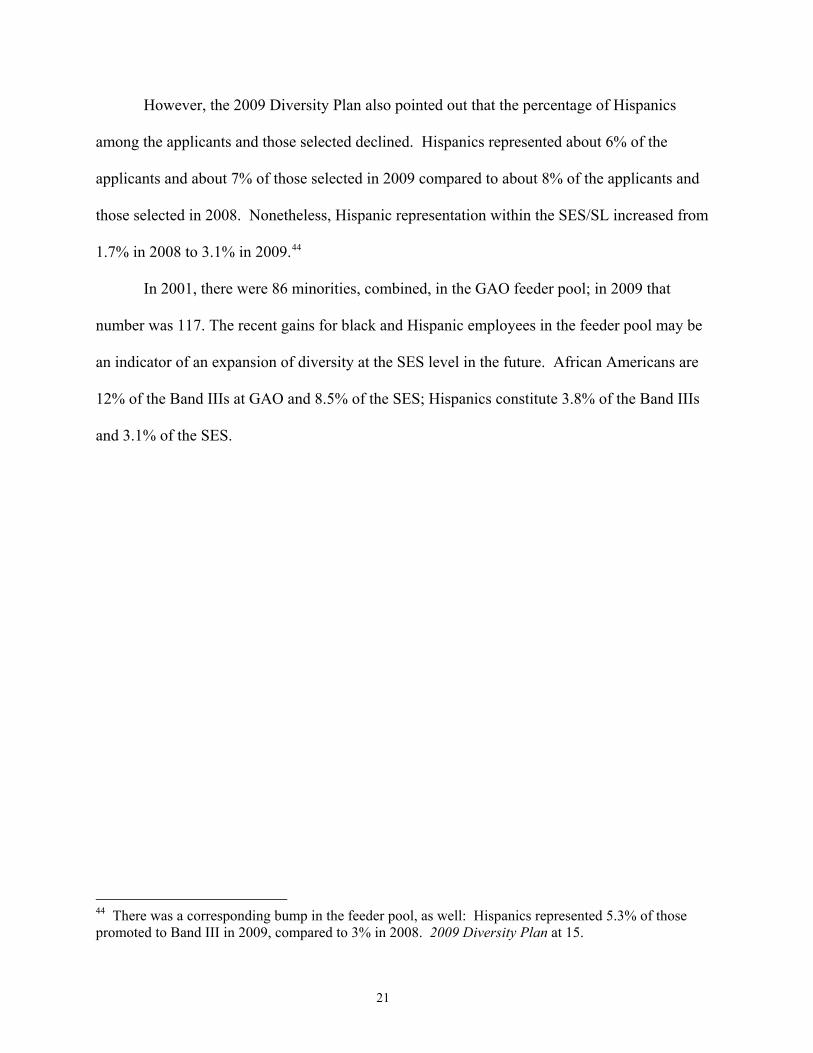
In 2001, there were 86 minorities, combined, in the GAO feeder pool; in 2009 that
number was 117. The recent gains for black and Hispanic employees in the feeder pool may be
an indicator of an expansion of diversity at the SES level in the future. African Americans are
12% of the Band IIIs at GAO and 8.5% of the SES; Hispanics constitute 3.8% of the Band IIIs
and 3.1% of the SES.
44 There was a corresponding bump in the feeder pool, as well: Hispanics represented 5.3% of those promoted to Band III in 2009, compared to 3% in 2008. 2009 Diversity Plan at 15.
21
Chart 6: SES Feeder Pool by race, national origin and gender (2001-2009)
Source: Analysis of GAO data
Table 5: Change in Percentage in the SES Feeder Pool by race, national origin & gender from 1995 to 2009
WF WM BF BM HF HM AF AM Total
1995 147 22.6%
428 65.8%
16 2.5%
29 4.5%
6 .9%
8 1.2%
5 .8%
11 1.7%
650 100%
2009 234 37%
278 44%
50 8%
25 4%
8 1.2%
16 2.6%
13 2.4%
5 .8%
63845 100%
Change in percentage
+14.4%
-21.8%
+5.5%
-.5%
+.3%
+1.4%
+1.6%
-.9%
Source: Analysis of GAO data
45 One employee identified herself as American Indian in 2009.
22
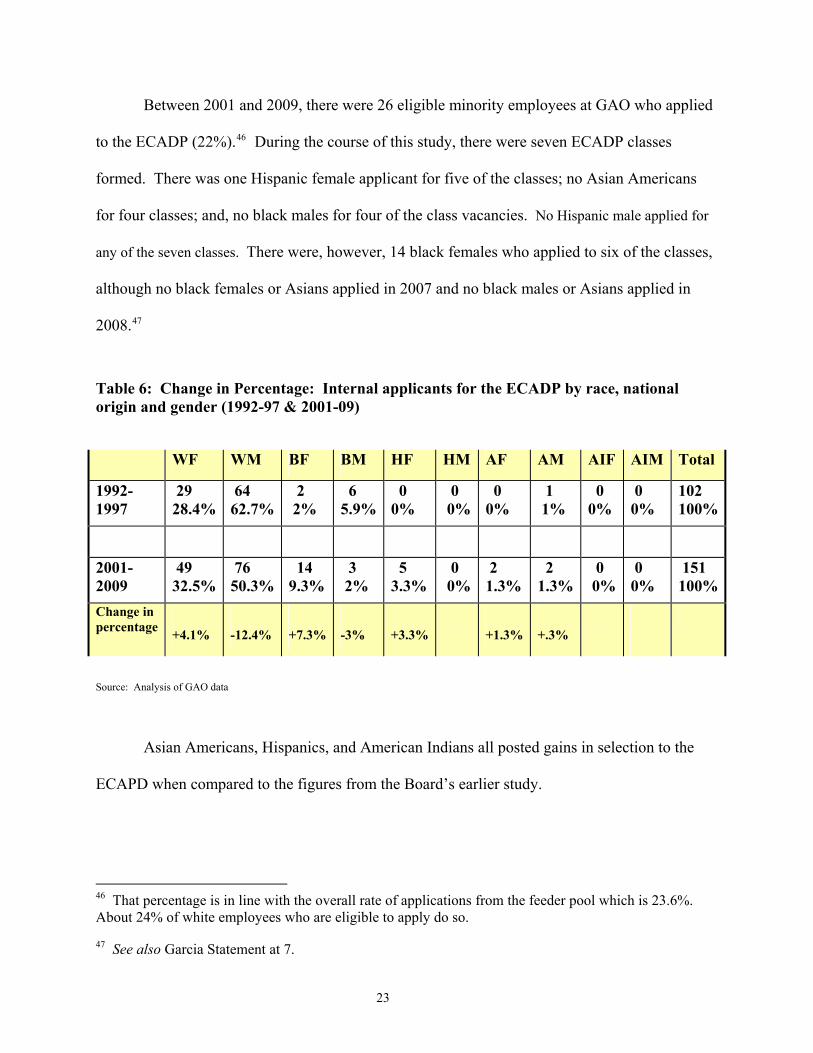
Between 2001 and 2009, there were 26 eligible minority employees at GAO who applied
to the ECADP (22%).46 During the course of this study, there were seven ECADP classes
formed. There was one Hispanic female applicant for five of the classes; no Asian Americans
for four classes; and, no black males for four of the class vacancies. No Hispanic male applied for
any of the seven classes. There were, however, 14 black females who applied to six of the classes,
although no black females or Asians applied in 2007 and no black males or Asians applied in
2008.47
Table 6: Change in Percentage: Internal applicants for the ECADP by race, national origin and gender (1992-97 & 2001-09) WF WM BF BM HF HM AF AM AIF AIM Total
1992-1997
29 28.4%
64 62.7%
2 2%
6 5.9%
0 0%
0 0%
0 0%
1 1%
0 0%
0 0%
102 100%
2001-2009
49 32.5%
76 50.3%
14 9.3%
3 2%
5 3.3%
0 0%
2 1.3%
2 1.3%
0 0%
0 0%
151 100%
Change in percentage
+4.1%
-12.4%
+7.3%
-3%
+3.3%
+1.3%
+.3%
Source: Analysis of GAO data
Asian Americans, Hispanics, and American Indians all posted gains in selection to the
ECAPD when compared to the figures from the Board’s earlier study.
46 That percentage is in line with the overall rate of applications from the feeder pool which is 23.6%. About 24% of white employees who are eligible to apply do so. 47 See also Garcia Statement at 7.
23
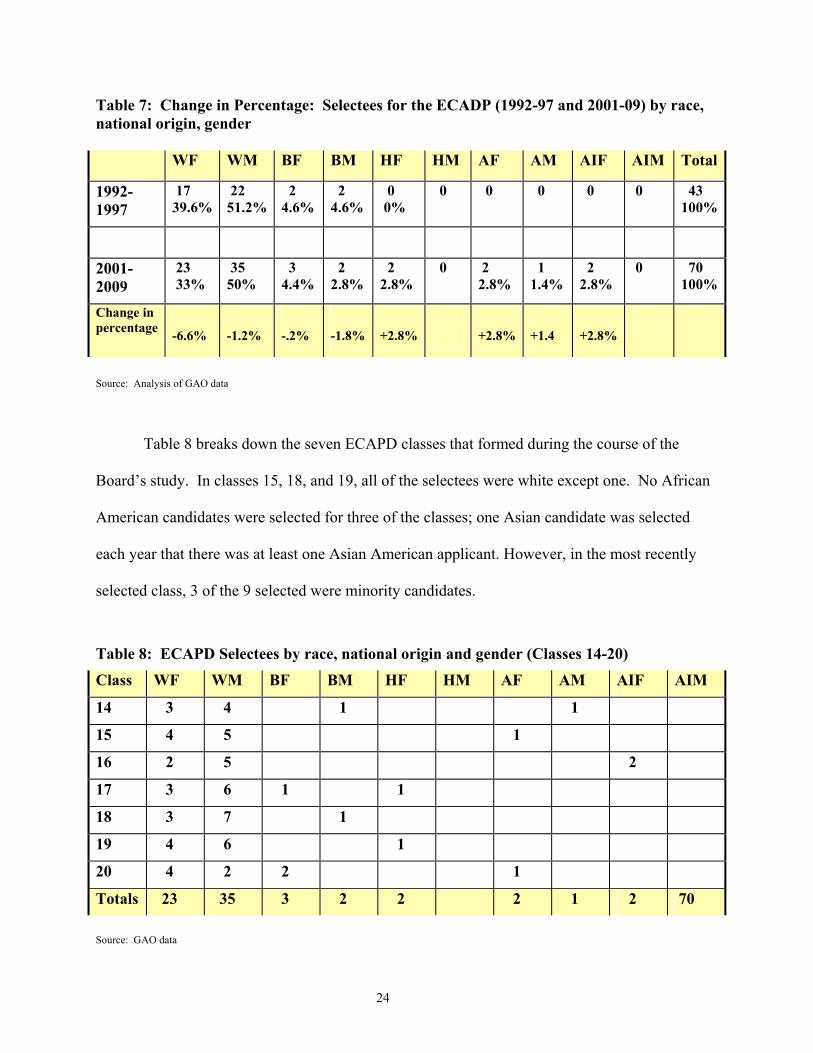
Table 7: Change in Percentage: Selectees for the ECADP (1992-97 and 2001-09) by race, national origin, gender WF WM BF BM HF HM AF AM AIF AIM Total
1992-1997
17 39.6%
22 51.2%
2 4.6%
2 4.6%
0 0%
0
0
0
0
0
43 100%
2001-2009
23 33%
35 50%
3 4.4%
2 2.8%
2 2.8%
0
2 2.8%
1 1.4%
2 2.8%
0
70 100%
Change in percentage
-6.6%
-1.2%
-.2%
-1.8%
+2.8%
+2.8%
+1.4
+2.8%
Source: Analysis of GAO data
Table 8 breaks down the seven ECAPD classes that formed during the course of the
Board’s study. In classes 15, 18, and 19, all of the selectees were white except one. No African
American candidates were selected for three of the classes; one Asian candidate was selected
each year that there was at least one Asian American applicant. However, in the most recently
selected class, 3 of the 9 selected were minority candidates.
Table 8: ECAPD Selectees by race, national origin and gender (Classes 14-20) Class WF WM BF BM HF HM AF AM AIF AIM
14 3 4 1 1
15 4 5 1
16 2 5 2
17 3 6 1 1
18 3 7 1
19 4 6 1
20 4 2 2 1
Totals 23 35 3 2 2 2 1 2 70 Source: GAO data
24
The Selection Process by Gender
Women, across the spectrum, made gains in representation in GAO’s feeder pool, with
white and black women gaining significantly in both numbers and percentages by 2009. Overall,
women constituted 36% of the feeder pool in 2001 and nearly half of the pool (48%) by 2009.
Over the course of this study, they were 46.4% of the applicants and 46% of the selectees for the
ECADP.48 Women make up 44.9% of the SES corps at GAO and lead 8 of the Agency’s 13
mission teams.49 In addition, two of the three members of the Agency’s Executive Committee,
the Chief Administrative Officer and the Acting General Counsel, are female. In the Executive
branch, women are 30.7% of the SES; they constituted 24.4% of the corps in 2001.
The Selection Process by Disability
GAO employees reporting targeted disabilities are less than 1% of the workforce; no
member of the SES reports having a targeted disability.50 According to GAO’s 2009 Workforce
Diversity Plan, new hires reporting targeted disabilities declined from .8% in 2008 to .3% in
2009. Further, the percentage of staff with targeted disabilities who left the Agency exceeded
48 In December 2009, the GAO workforce was 57.3% female and 42.7% male. 49 Women were 33.6% of the SES at the beginning of the time period of this study, compared to 31.5% of the SES at the conclusion of the Board’s last study in 1998.
50 Targeted disabilities are: deafness; blindness; missing extremities; partial paralysis; complete paralysis; convulsive disorders; mental retardation; mental illness; and distortion of limb and/or spine. The term “targeted disabilities” was first officially recognized by EEOC in 1979. Individuals with a targeted disability are a subset of people who have a reportable disability. Criteria used to select the nine disabilities that make up the group of targeted disabilities included the severity of the disability, the feasibility of recruitment, and the availability of work force data for individuals with targeted disabilities. According to the EEOC, the purpose of focusing on targeted disabilities is to encourage the hiring, placement, and advancement of selected individuals with disabilities in affirmative action planning. Improving the Participation Rate of People with Targeted Disabilities in the Federal Work Force at 4, EEOC (2008).
25
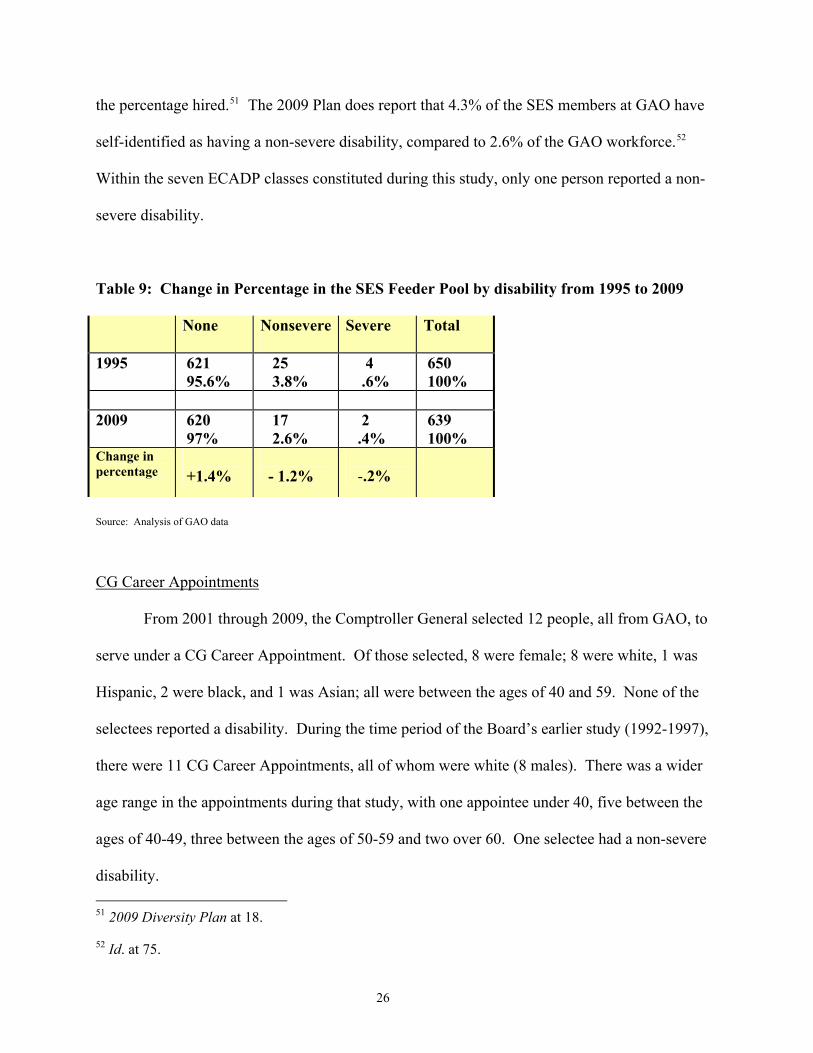
the percentage hired.51 The 2009 Plan does report that 4.3% of the SES members at GAO have
self-identified as having a non-severe disability, compared to 2.6% of the GAO workforce.52
Within the seven ECADP classes constituted during this study, only one person reported a non-
severe disability.
Table 9: Change in Percentage in the SES Feeder Pool by disability from 1995 to 2009 None Nonsevere
Severe Total
1995 621 95.6%
25 3.8%
4 .6%
650 100%
2009 620
97% 17 2.6%
2 .4%
639 100%
Change in percentage
+1.4%
- 1.2%
-.2%
Source: Analysis of GAO data
CG Career Appointments
From 2001 through 2009, the Comptroller General selected 12 people, all from GAO, to
serve under a CG Career Appointment. Of those selected, 8 were female; 8 were white, 1 was
Hispanic, 2 were black, and 1 was Asian; all were between the ages of 40 and 59. None of the
selectees reported a disability. During the time period of the Board’s earlier study (1992-1997),
there were 11 CG Career Appointments, all of whom were white (8 males). There was a wider
age range in the appointments during that study, with one appointee under 40, five between the
ages of 40-49, three between the ages of 50-59 and two over 60. One selectee had a non-severe
disability. 51 2009 Diversity Plan at 18. 52 Id. at 75.
26
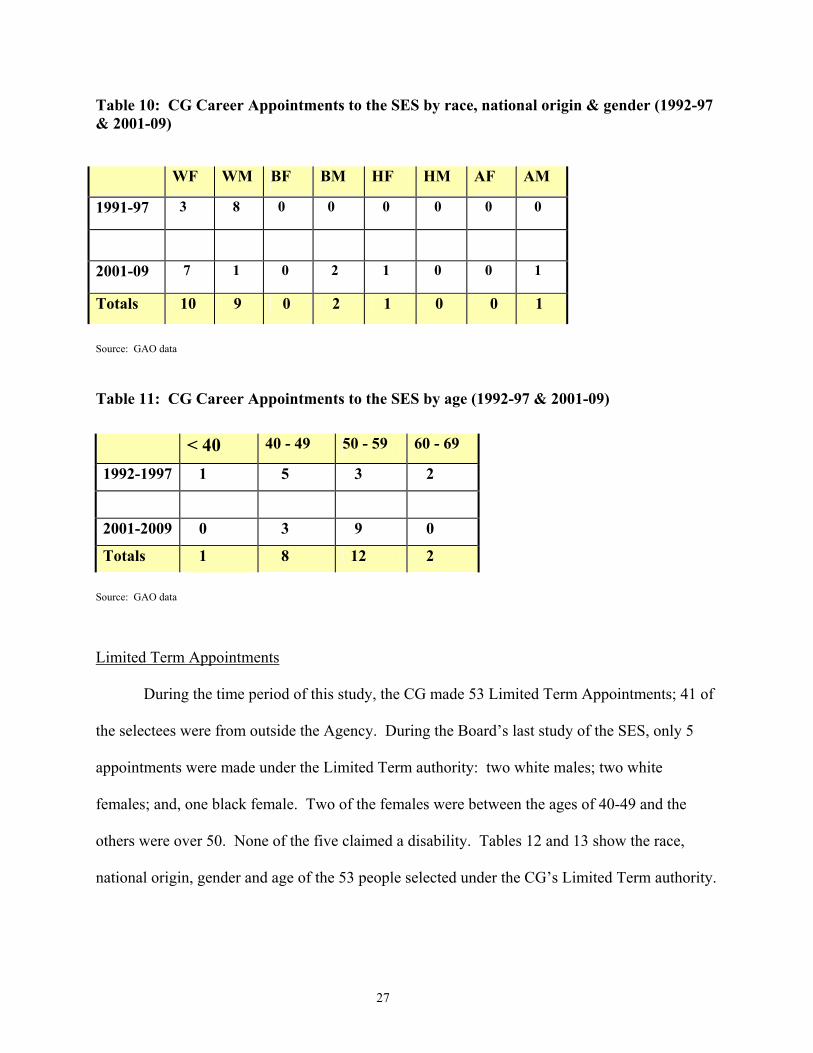
Table 10: CG Career Appointments to the SES by race, national origin & gender (1992-97 & 2001-09) WF WM BF BM HF HM AF AM
1991-97 3 8 0 0 0 0 0 0
2001-09 7 1 0 2 1 0 0 1
Totals 10 9 0 2 1 0 0 1
Source: GAO data
Table 11: CG Career Appointments to the SES by age (1992-97 & 2001-09) < 40 40 - 49 50 - 59 60 - 69
1992-1997 1 5 3 2
2001-2009 0 3 9 0
Totals 1 8 12 2 Source: GAO data
Limited Term Appointments
During the time period of this study, the CG made 53 Limited Term Appointments; 41 of
the selectees were from outside the Agency. During the Board’s last study of the SES, only 5
appointments were made under the Limited Term authority: two white males; two white
females; and, one black female. Two of the females were between the ages of 40-49 and the
others were over 50. None of the five claimed a disability. Tables 12 and 13 show the race,
national origin, gender and age of the 53 people selected under the CG’s Limited Term authority.
27
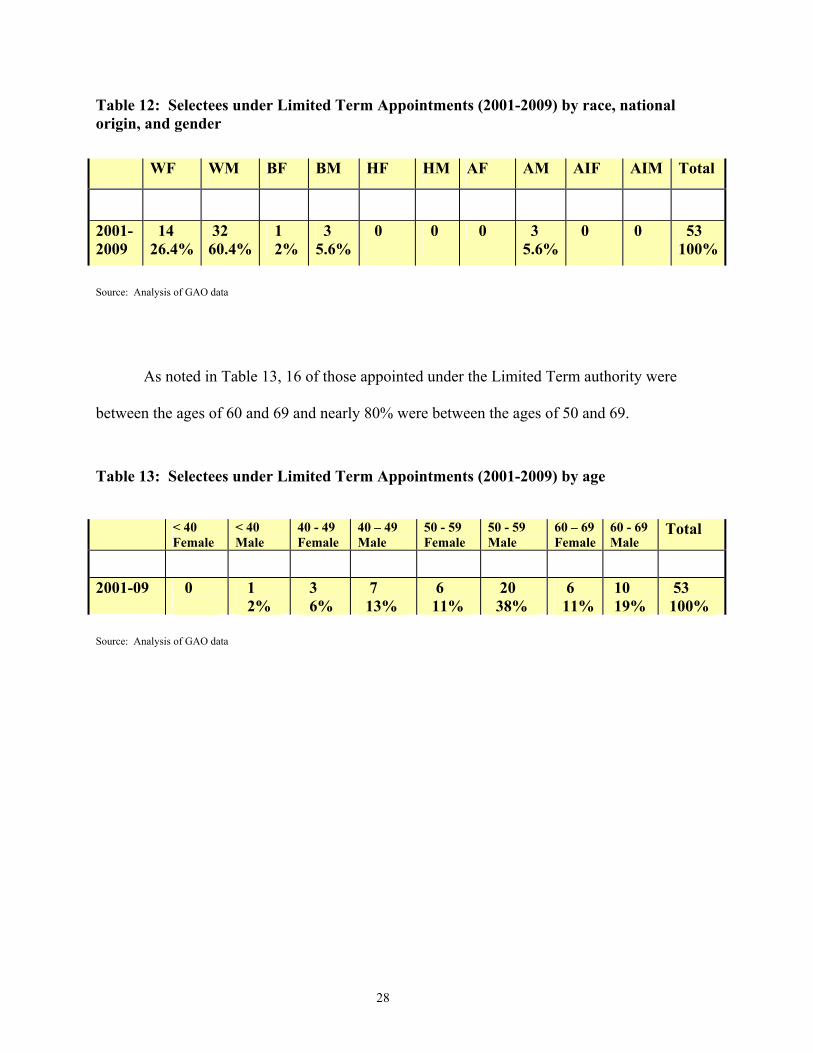
Table 12: Selectees under Limited Term Appointments (2001-2009) by race, national origin, and gender WF WM BF BM HF HM AF AM AIF AIM Total
2001-2009
14 26.4%
32 60.4%
1 2%
3 5.6%
0
0
0 3 5.6%
0 0
53 100%
Source: Analysis of GAO data
As noted in Table 13, 16 of those appointed under the Limited Term authority were
between the ages of 60 and 69 and nearly 80% were between the ages of 50 and 69.
Table 13: Selectees under Limited Term Appointments (2001-2009) by age < 40
Female < 40 Male
40 - 49 Female
40 – 49 Male
50 - 59 Female
50 - 59 Male
60 – 69 Female
60 - 69 Male
Total
2001-09 0
1 2%
3 6%
7 13%
6 11%
20 38%
6 11%
10 19%
53 100%
Source: Analysis of GAO data
28
Chapter IV
Conclusion
Much has changed in the Senior Executive Service at GAO in the eight years since the
Board last took an in-depth look at the corps. The SES is now 44.9% female; it was 31.5%
female at the end of the Board’s study in 1998. In addition, after years of very few, if any,
people 50 years old and over being selected for the ECADP, the disparity between the percentage
in the feeder pool and those selected is in single digits (7%) compared to the earlier study
(31.5%).53 There has been some stagnation of diversity on the basis of race and national origin
in the SES corps itself but recent gains in diversity in the feeder pool may prove fruitful over
time.
GAO compares favorably to the Executive branch in minority representation (16.3% v.
16.9%) in its SES and GAO has a significantly higher percentage of females (44.9%) in its corps
than the executive branch (30.7%). When looking at the four agencies close in size to GAO
(NARA, NRC, OPM and SBA), GAO has a higher percentage of minorities (16.3%) in its SES
corps than NARA (0%) and is about even with the NRC (16%). The SBA’s percentage of
minorities in its SES is the highest among the five agencies (41%); OPM registers 20%. When
gender is factored in, GAO at 44.9% and OPM at 44% are the highest, with the SBA at 38%;
NARA at 30%; and, the NRC at 20.4%.
In the time period of this study, -- eight years, seven classes -- 26 eligible minority
candidates applied to the ECADP for consideration for the program. No Asian Americans or
black females applied for the September 2007 ECADP vacancies; no black males or Asians
applied in 2008; no Hispanic males applied at any time during the study.
53 As previously noted, the first 10 classes constituted at GAO had no members 50 years old or older.
29
Perhaps the most important change over the years has been in the selection process for
the ECADP. Previously, GAO employees had to request nomination to the ECADP, in writing,
from the heads of their units who, in consultation with the requestor’s SES supervisor, would
determine each employee’s potential to perform successfully at the SES level. Currently, all
applicants, including those from GAO, apply directly to the ERB. The unit screening appeared
to be a system in which consistency in the selection process itself and in the criteria used could
not be assured. The Board commends the Agency for adopting a centralized application process
under the aegis of its Executive Resources Board.
In pre-publication comments, the Agency informed the Board that it had recently
requested that all GAO employees update their demographic information, including disability
status, to ensure that its workforce data is accurate. As this report points out, GAO is not
meeting its benchmarks in the employment of persons with targeted disabilities. The Board has
noted in other studies that the Agency generally has not provided employees with the opportunity
to update their disability status after their entry into the workforce and reiterates its
recommendation that such opportunity should be made available to employees on an annual
basis.
Finally, in crafting its recommendations, the Board took note of statements before
congressional committees from two of GAO’s senior managers. The first from the former
Managing Director of O&I indicated that his office reviews the applicant list for ECADP
vacancies to, among other things, determine whether there are concerns about diversity
management practices with respect to any of the candidates. The second statement was an
explanation from the Agency’s Inspector General about why so few external candidates are
30
accepted into the ECADP. Those statements formed the basis for the first two of the Board’s
recommendations.
Recommendations
● The Managing Director of the Office of Opportunity and Inclusiveness should undertake an annual review and assessment of current members of the SES to determine whether there are any issues regarding the diversity management practices of any member. ● The Agency should try to attract a greater diversity of external applicants for its SES vacancies by continuing to target relevant professional associations with diverse membership. Although the Board appreciates that acclimating to GAO’s unique methodology and culture is difficult, especially at the senior management level, there are disciplines from which top level recruits would be more able to “hit the ground running” substantively. ● The Agency or O&I should survey its Band III population to determine their level of interest in the SES; their reasons, if any, for opting out of consideration; and whether they perceive barriers in the application process. ● Since 1990, the Board has been recommending that GAO encourage its employees to update information about their disability status on an annual basis. The Board notes that the Self-Identification of Disability Form (SF 256) has recently been modified so that it can now be completed electronically and at any time. The Board recommends that GAO advise employees via a Notice on its Intranet that the information is confidential and will only be used to identify individuals for survey response or for agency-wide workforce data collection and reporting, thereby ensuring that its available programs and services are adequate for the population in need of them.
31
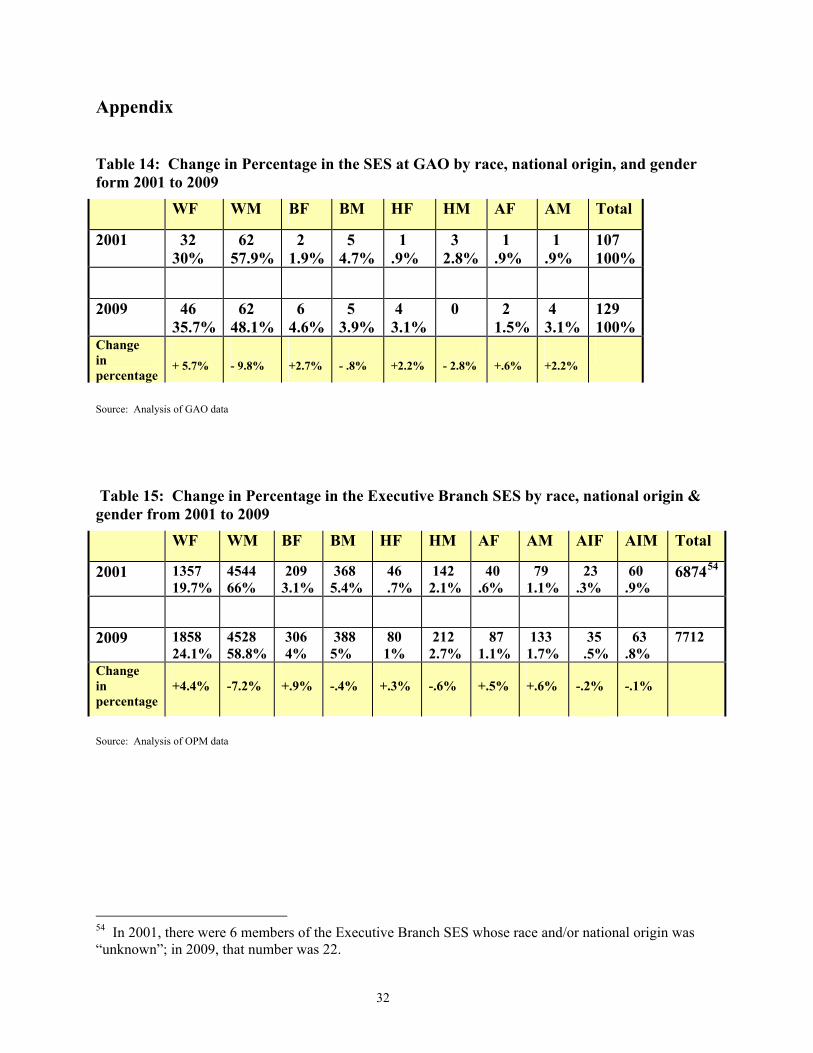
Appendix Table 14: Change in Percentage in the SES at GAO by race, national origin, and gender form 2001 to 2009 WF WM BF BM HF HM AF AM Total
2001 32 30%
62 57.9%
2 1.9%
5 4.7%
1 .9%
3 2.8%
1 .9%
1 .9%
107 100%
2009 46 35.7%
62 48.1%
6 4.6%
5 3.9%
4 3.1%
0 2 1.5%
4 3.1%
129 100%
Change in percentage
+ 5.7%
- 9.8%
+2.7%
- .8%
+2.2%
- 2.8%
+.6%
+2.2%
Source: Analysis of GAO data
Table 15: Change in Percentage in the Executive Branch SES by race, national origin & gender from 2001 to 2009 WF WM BF BM HF HM AF AM AIF AIM Total
2001 1357 19.7%
4544 66%
209 3.1%
368 5.4%
46 .7%
142 2.1%
40 .6%
79 1.1%
23 .3%
60 .9%
687454
2009 1858 24.1%
4528 58.8%
306 4%
388 5%
80 1%
212 2.7%
87 1.1%
133 1.7%
35 .5%
63 .8%
7712
Change in percentage
+4.4%
-7.2%
+.9%
-.4%
+.3%
-.6%
+.5%
+.6%
-.2%
-.1%
Source: Analysis of OPM data
54 In 2001, there were 6 members of the Executive Branch SES whose race and/or national origin was “unknown”; in 2009, that number was 22.
32
33
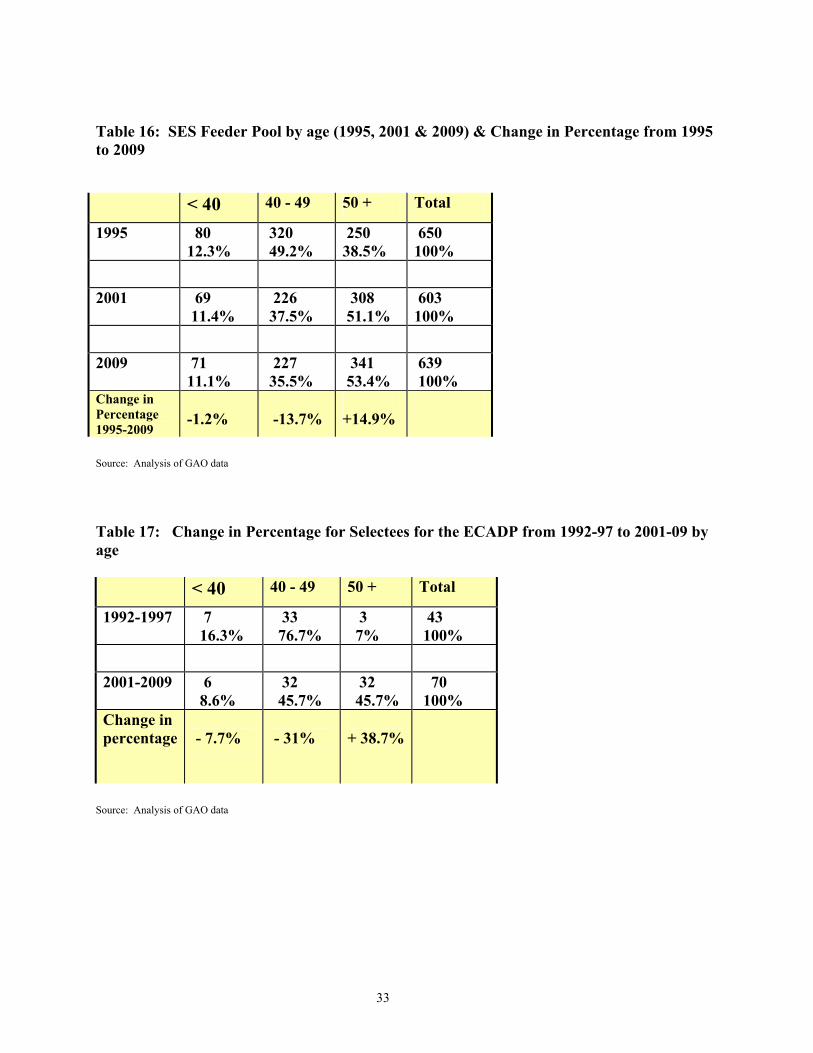
Table 16: SES Feeder Pool by age (1995, 2001 & 2009) & Change in Percentage from 1995 to 2009 < 40 40 - 49 50 + Total
1995 80 12.3%
320 49.2%
250 38.5%
650 100%
2001 69 11.4%
226 37.5%
308 51.1%
603 100%
2009 71 11.1%
227 35.5%
341 53.4%
639 100%
Change in Percentage 1995-2009
-1.2%
-13.7%
+14.9%
Source: Analysis of GAO data
Table 17: Change in Percentage for Selectees for the ECADP from 1992-97 to 2001-09 by age < 40 40 - 49 50 + Total
1992-1997 7 16.3%
33 76.7%
3 7%
43 100%
2001-2009 6 8.6%
32 45.7%
32 45.7%
70 100%
Change in percentage
- 7.7%
- 31%
+ 38.7%
Source: Analysis of GAO data

![WORKERS’ COMPENSATION APPEALS BOARD …...WORKERS’ COMPENSATION APPEALS BOARD DIRECTORY 1 Laughlin, Falbo, Levy, &MoresiLLP ANAHEIM WORKERS’ COMPENSATION APPEALS BOARD [AHM]](https://img.pdfslide.net/doc/110x75/5eaa700449f5fa538c64e567/workersa-compensation-appeals-board-workersa-compensation-appeals-board.jpg)