Embed Size (px)
DESCRIPTION
Preparing High-Quality Implementation Completion and Results Reports. Perspectives from the Independent Evaluation Group Martha Ainsworth and Soniya Carvalho. Part I: Tips for preparing a high-quality ICR Martha Ainsworth Part II: Project ratings: connects and disconnects - PowerPoint PPT Presentation
Citation preview

Perspectives from the Independent Evaluation GroupMartha Ainsworth and Soniya Carvalho
Preparing High-Quality Implementation Completion and Results Reports
Part I: Tips for preparing a high-quality ICR
Martha Ainsworth
Part II: Project ratings: connects and disconnects
Soniya Carvalho

Why is ICR quality important? ► The ICR is an opportunity to learn and to
improve effectiveness• It’s the official (public) report on the project,
its achievements and lessons► Low quality ICRs make it difficult for IEG
to rate the project accurately• Unsatisfactory ICR quality is a good
predictor of ratings “disconnects” and disputes
• From 7/1/2006 onward, “when insufficient information is provided by the Bank for IEG to arrive at a clear rating, IEG will downgrade the relevant rating”
What are the IEG criteria for ICR quality?
► Results-orientation (ICR should be outcome-oriented, not an implementation narrative)
► Quality of evidence and analysis
► Lessons based on evidence and analysis► Internal consistency ► Consistency with Bank guidelines ► Conciseness

1. Make the ICR results-driven
a. Organize evidence around achievement of objectives (not implementation of components)
b. Document the “results chain”: Show the link between inputs, outputs, outcomes, impacts
c. Explain the counterfactual (what would have happened without the project), other factors operating, plausible attribution
d. Don’t be constrained by the official project indicators
e. Show trends over the whole period, before and after the project, as many observations as possible
f. Footnote sources of evidence, triangulate data. Provide the evidence necessary for someone
disconnected from the project to be able to rate it!

Inputs Outputs Outcomes Impacts
To assess efficacy using the results chain, you need: • to be able to link these elements plausibly• to understand the “counterfactual”— what would have happened without these activities
The Results Chain
Establishing a “counterfactual”
► Timeline of events► Account for trends in other
determinants(For example, other donor support,
weather, changes in national policies, household income, changes in prices that could affect demand or incomes)
► Document trends before and after, in project and non-project areas

Distribution of Malaria in Eritrea
Gash barka
Anseba
Northern Red Sea
Southern Red Sea
Debub
Maekel
Highest ranking
Lowest ranking
Example #1: Eritrea HIV/AIDS, Malaria, STI, and TB Control Project
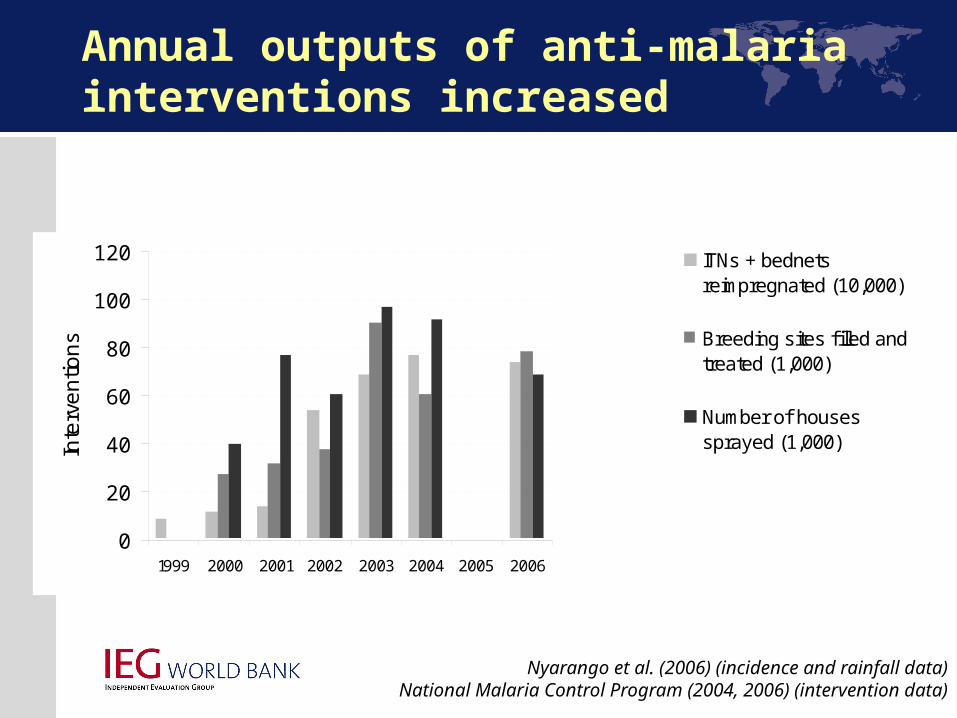
Annual outputs of anti-malaria interventions increased
0
20
40
60
80
100
120
1999 2000 2001 2002 2003 2004 2005 2006
Inte
rve
ntio
ns
0
5
10
15
20
25
30
35
40
45
Inci
de
nce
ra
te (
pe
r 1
00
,00
0);
R
ain
fall
('0m
m)
ITNs + bednetsreimpregnated (10,000)
Breeding sites f illed andtreated (1,000)
Number of housessprayed (1,000)
Incidence rate (per100,000)
Average annual rainfall(10mm)
Nyarango et al. (2006) (incidence and rainfall data)National Malaria Control Program (2004, 2006) (intervention data)
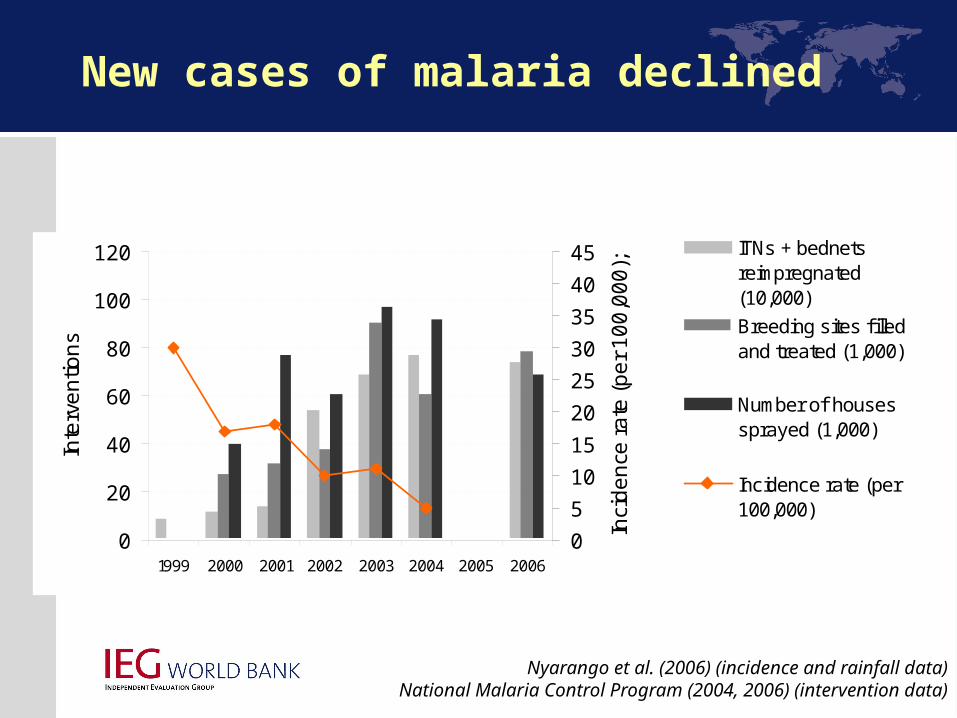
New cases of malaria declined
0
20
40
60
80
100
120
1999 2000 2001 2002 2003 2004 2005 2006
Inte
rve
ntio
ns
0
5
10
15
20
25
30
35
40
45
Inci
de
nce
ra
te (
pe
r 1
00
,00
0);
R
ain
fall
(10
mm
)
ITNs + bednetsreimpregnated(10,000)
Breeding sites f illedand treated (1,000)
Number of housessprayed (1,000)
Incidence rate (per100,000)
Average annualrainfall (10mm)
Nyarango et al. (2006) (incidence and rainfall data)National Malaria Control Program (2004, 2006) (intervention data)
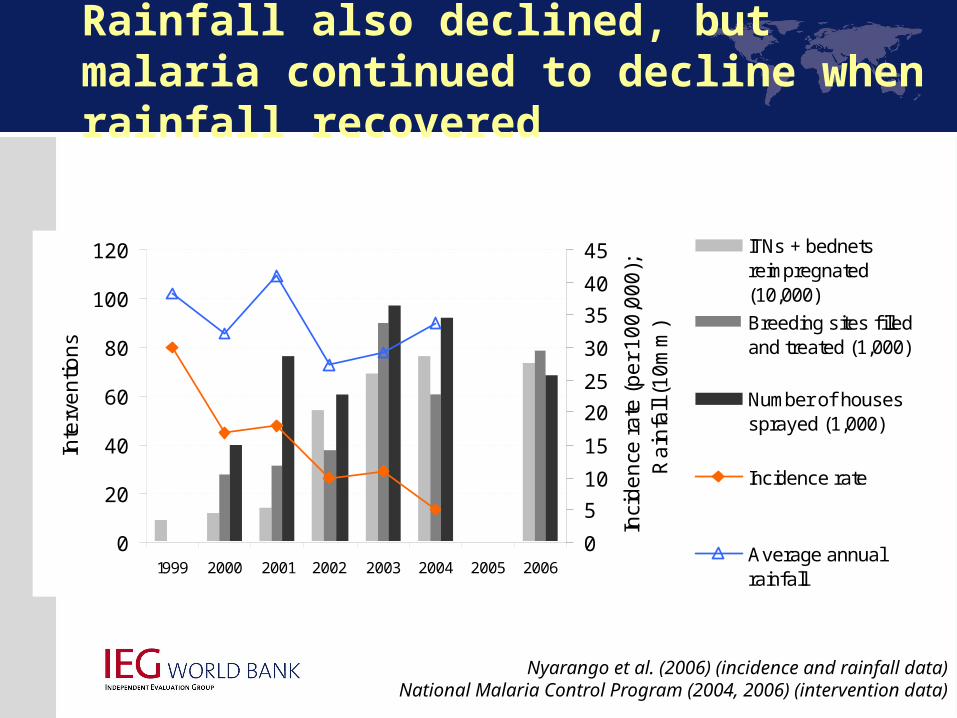
Rainfall also declined, but malaria continued to decline when rainfall recovered
0
20
40
60
80
100
120
1999 2000 2001 2002 2003 2004 2005 2006
Inte
rve
ntio
ns
0
5
10
15
20
25
30
35
40
45
Inci
de
nce
ra
te (
pe
r 1
00
,00
0);
R
ain
fall
(10
mm
)
ITNs + bednetsreimpregnated(10,000)
Breeding sites f illedand treated (1,000)
Number of housessprayed (1,000)
Incidence rate
Average annualrainfall
Nyarango et al. (2006) (incidence and rainfall data)National Malaria Control Program (2004, 2006) (intervention data)
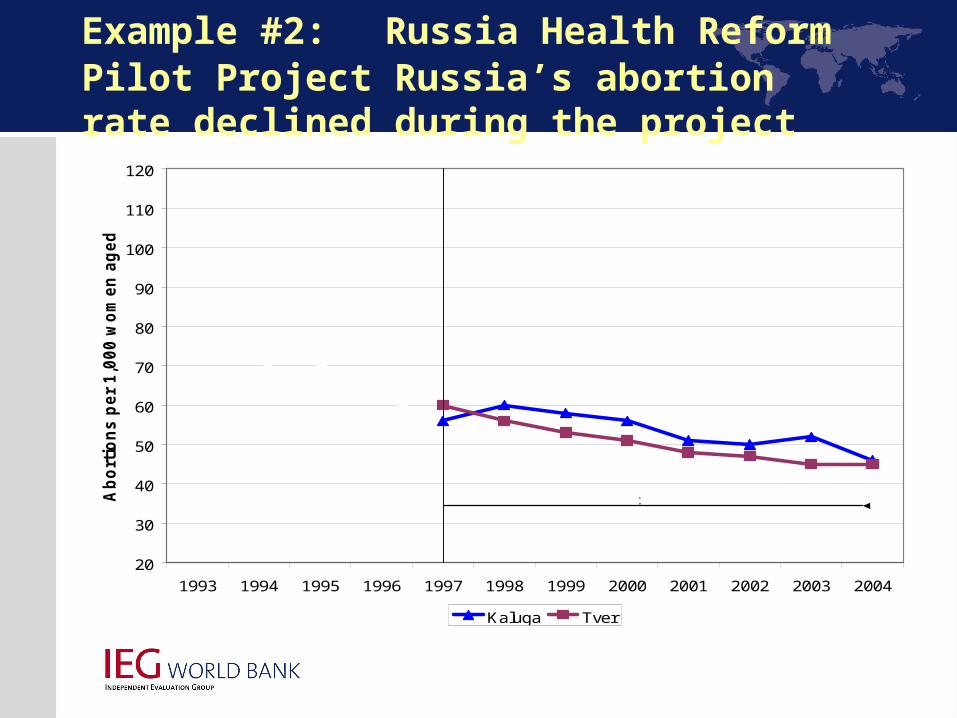
Example #2: Russia Health Reform Pilot Project Russia’s abortion rate declined during the project
20
30
40
50
60
70
80
90
100
110
120
1993 1994 1995 1996 1997 1998 1999 2000 2001 2002 2003 2004
Ab
ort
ion
s p
er
1,0
00 w
om
en
ag
ed
15-4
9
Kaluga Tver
Health Reform Pilot Project
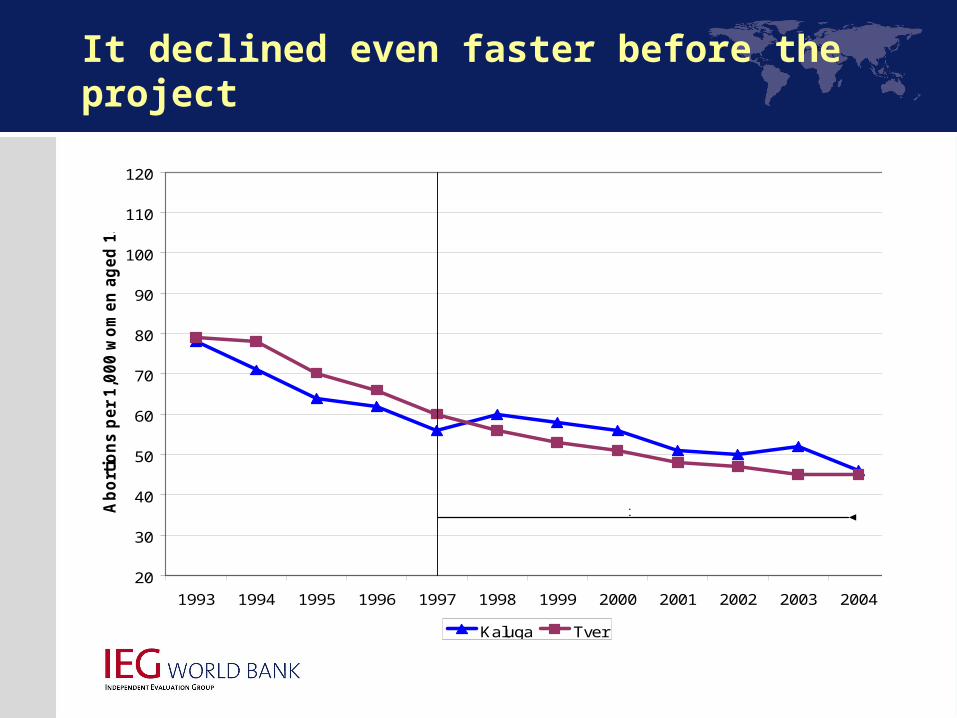
It declined even faster before the project
20
30
40
50
60
70
80
90
100
110
120
1993 1994 1995 1996 1997 1998 1999 2000 2001 2002 2003 2004
Ab
ort
ion
s p
er
1,0
00
wo
me
n a
ge
d 1
5-4
9
Kaluga Tver
Health Reform Pilot Project
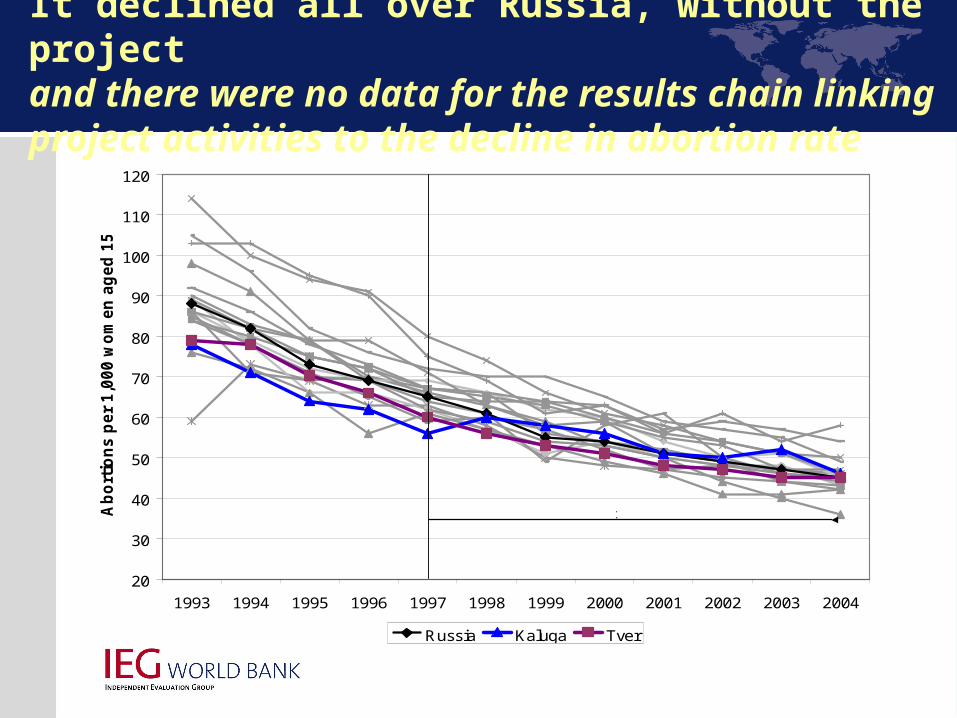
It declined all over Russia, without the projectand there were no data for the results chain linking project activities to the decline in abortion rate
20
30
40
50
60
70
80
90
100
110
120
1993 1994 1995 1996 1997 1998 1999 2000 2001 2002 2003 2004
Ab
ort
ion
s p
er
1,0
00 w
om
en
ag
ed
15-4
9
Russia Kaluga Tver
Health Reform Pilot Project
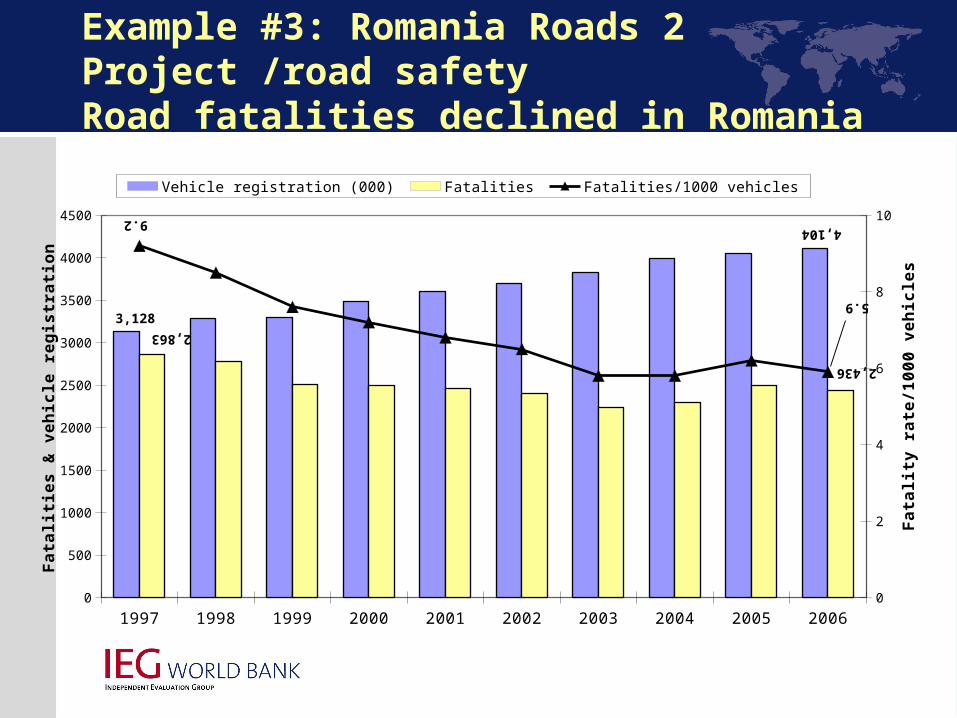
Example #3: Romania Roads 2 Project /road safetyRoad fatalities declined in Romania
1997 1998 1999 2000 2001 2002 2003 2004 2005 20060
500
1000
1500
2000
2500
3000
3500
4000
4500
0
2
4
6
8
10
Vehicle registration (000) Fatalities Fatalities/1000 vehicles
Fa
talit
ies
& v
eh
icle
re
gis
tra
tio
n
Fa
talit
y r
ate
/10
00
ve
hic
les
3,128
2,863
4,1049.2
2,436
5.9

They declined faster before the Traffic Safety Campaignand there were no intermediate outcome data on safety
1997 1998 1999 2000 2001 2002 2003 2004 2005 20060
500
1000
1500
2000
2500
3000
3500
4000
4500
0
2
4
6
8
10
Vehicle registration (000) Fatalities Fatalities/1000 vehicles
Fa
talit
ies
& v
eh
icle
re
gis
tra
tio
n
Fa
talit
y r
ate
/10
00
ve
hic
les
3,128
2,863
4,1049.2
2,436
5.9
Year of traffic safety 2002-3
2. Show all indicators of efficiency
► ICRs for all investment-type projects (including TA projects) must assess efficiency, not ICRs for DPLs
► Answers the question: Were costs in achieving the objectives reasonable in relation to the benefits and to recognized norms (“value for money”)
► Show evidence of:• Cost-benefit, cost-effectiveness, efficient use of project
resources, unit rate norms, service standards, least-cost analysis and comparisons, other efficiency indicators
• Aspects of design and implementation that contributed to or reduced efficiency
► Cost-benefit analysis is not sufficient to assess efficiency; other indicators must be shown• If presented, transparent discussion of assumptions
3. Document safeguards
► Safeguard policies not applicable to DPLs
► Applicable safeguard policy, project category (A, B, C, FI), assessment/mitigation plan
► Whether the mitigation plan was implemented
► Findings of third party safeguard reviews
► Updated assessment and revised mitigation plans implemented if physical components generating economic and social impacts were modified.
4. Other quick tips
► Consistency: Make sure the ratings match the text and the numbers are internally consistent
► Conciseness: More evidence is good, as long as it is relevant and concise; if extensive, add an annex.
► Completeness: Ensure that the sections and annexes are complete and accurate
► Candor: Be candid about shortcomings, data quality
► Lessons: Not too many; must be evidence-based and come from the project’s experience; seek to explain variability in outcomes
GOOD LUCK!