Embed Size (px)
Citation preview
Perspectives on thelong-term outlook for iron ore
Perspectives on thelong-term outlook for iron ore
John [email protected]
Iron Ore 2015Perth WA, 13 July 2015
DisclaimerMetalytics is a consultancy based in Sydney, Australia that provides specialist advisory services in resource sector economics. This presentation has been prepared to provide general information for the personal use of delegates to the Iron Ore 2015 conference in Perth, 13-15 July 2015, and may not be used or relied upon for any other purpose.
None of the contents and conclusions contained in this presentation may be republished or redistributed in whole or in part without the prior written permission of Metalytics.
Data contained, referenced or illustrated in this presentation are based on statistical and industry sources available to Metalytics that may be incomplete or inaccurate. Estimates, forecasts and analysis may incorporate assumptions that are subject to significant degrees of economic or other uncertainties, and opinions and conclusions are subject to change. Although we have exercised care in preparing this material, Metalytics makes no warranty in regard to its contents, and shall not be liable in respect of any matter arising from the use of this presentation, without limitation.
Nothing in this presentation constitutes a recommendation to buy or sell commodities, shares, derivative products or other financial instruments, nor is anything herein to be construed as investment advice or advice of any other kind.
Directors and employees of Metalytics may hold shares or have financial interests in companies and/or industries related to the subject matter of this presentation.
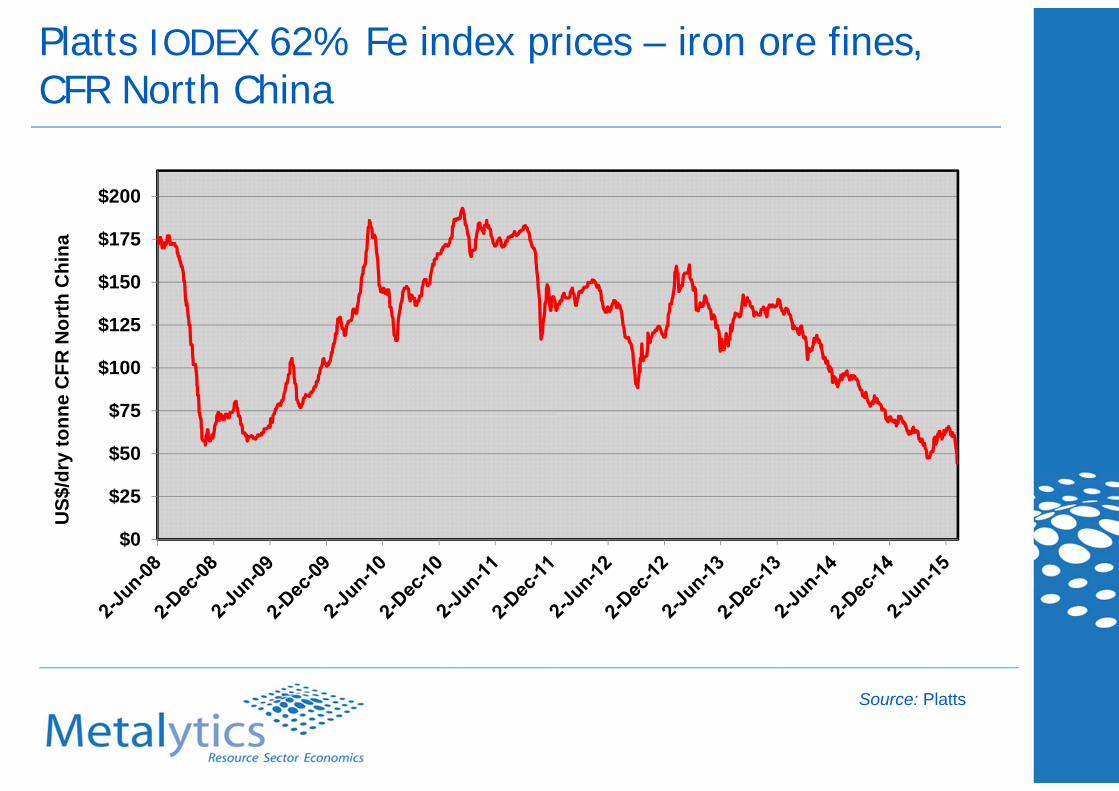
Platts IODEX 62% Fe index prices – iron ore fines, CFR North China
$0
$25
$50
$75
$100
$125
$150
$175
$200
US$
/dry
tonn
e C
FR N
orth
Chi
na
Source: Platts
0
200
400
600
800
1000
1200
1400
1600
1910 1920 1930 1940 1950 1960 1970 1980 1990 2000 2010
Mill
ion
Tonn
es
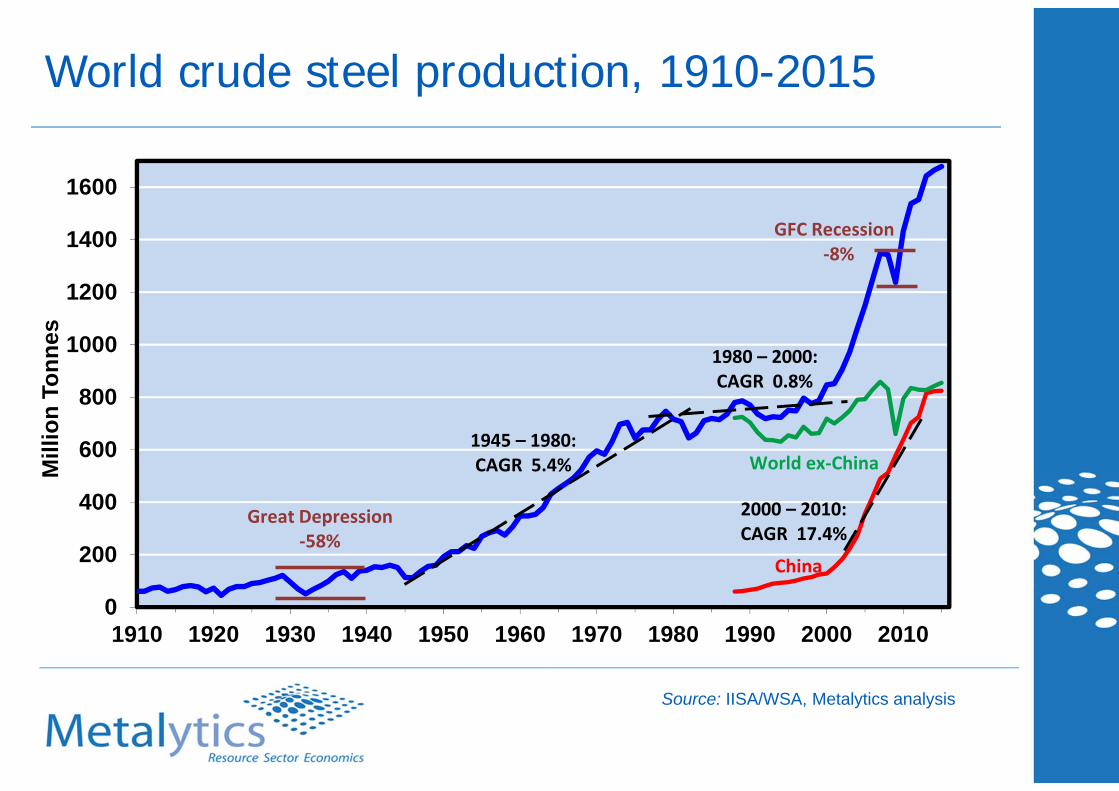
China
World ex‐China
Great Depression ‐58%
GFC Recession‐8%
1945 – 1980: CAGR 5.4%
1980 – 2000: CAGR 0.8%
2000 – 2010: CAGR 17.4%
World crude steel production, 1910-2015
Source: IISA/WSA, Metalytics analysis
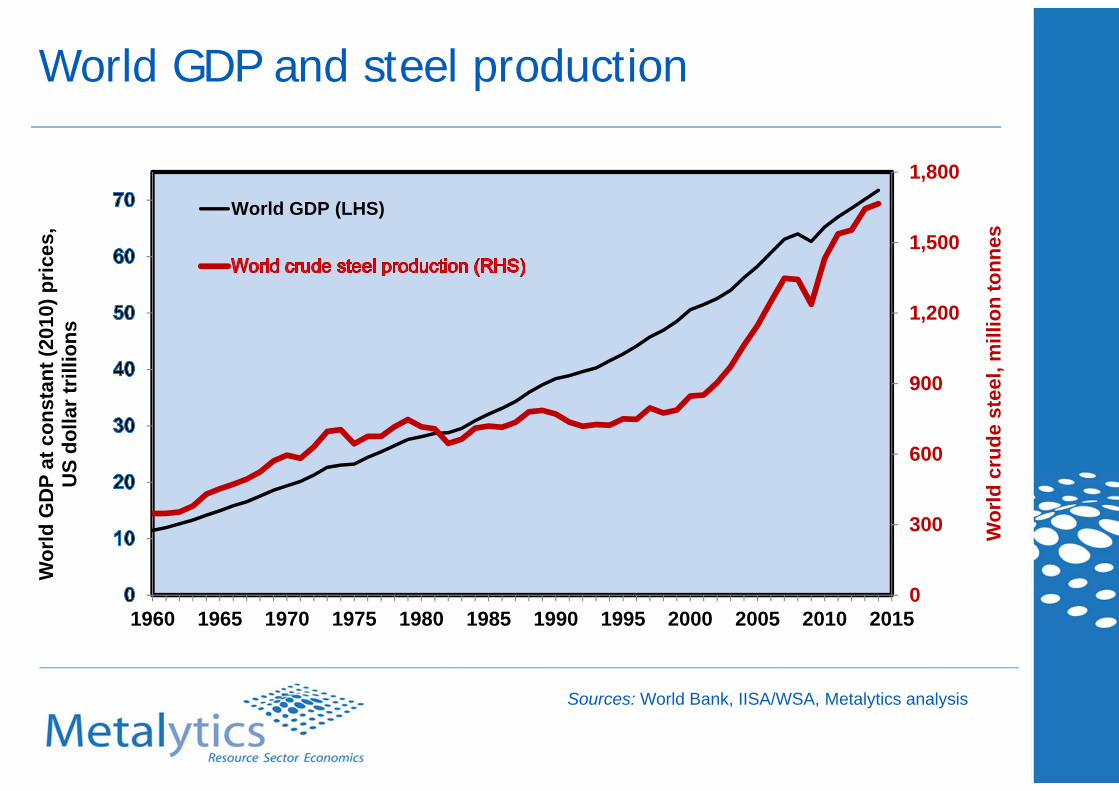
World GDP and steel production
0
300
600
900
1,200
1,500
1,800
1960 1965 1970 1975 1980 1985 1990 1995 2000 2005 2010 2015
Wor
ld c
rude
ste
el, m
illio
n to
nnes
Wor
ld G
DP
at c
onst
ant (
2010
) pric
es,
US
dolla
r tril
lions
World GDP (LHS)
Sources: World Bank, IISA/WSA, Metalytics analysis
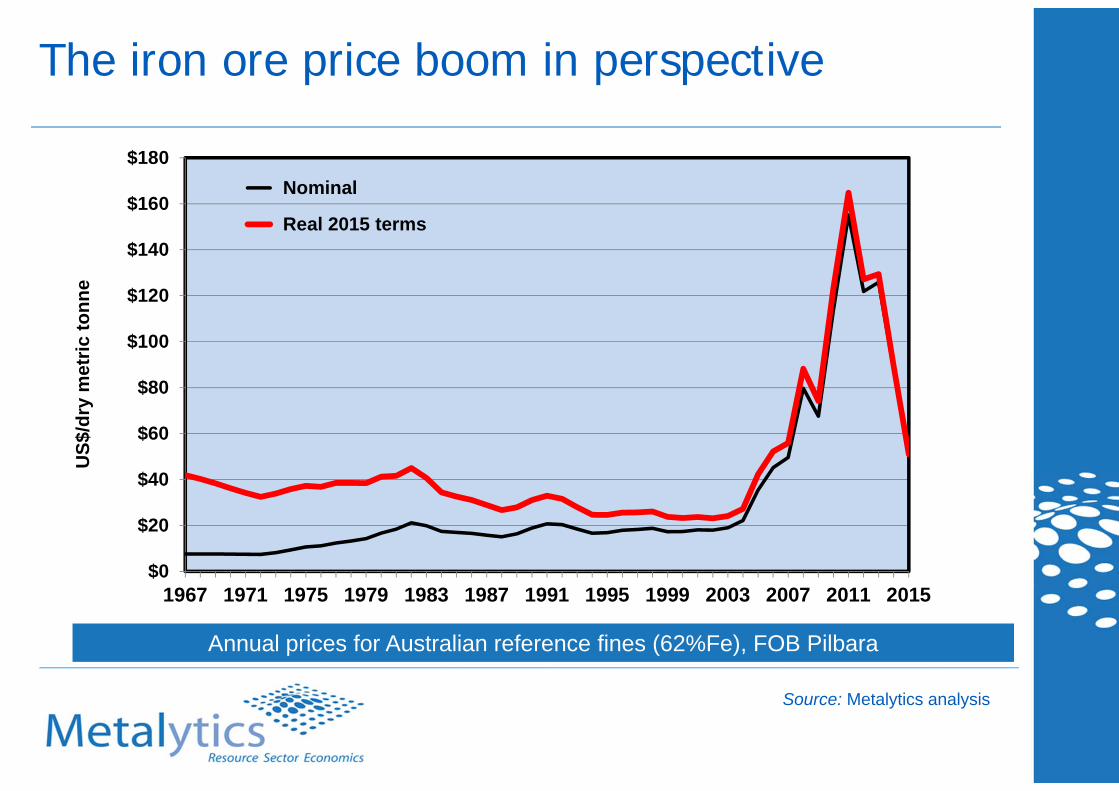
The iron ore price boom in perspective
$0
$20
$40
$60
$80
$100
$120
$140
$160
$180
1967 1971 1975 1979 1983 1987 1991 1995 1999 2003 2007 2011 2015
US$
/dry
met
ric to
nne
Nominal
Real 2015 terms
Annual prices for Australian reference fines (62%Fe), FOB Pilbara
Source: Metalytics analysis
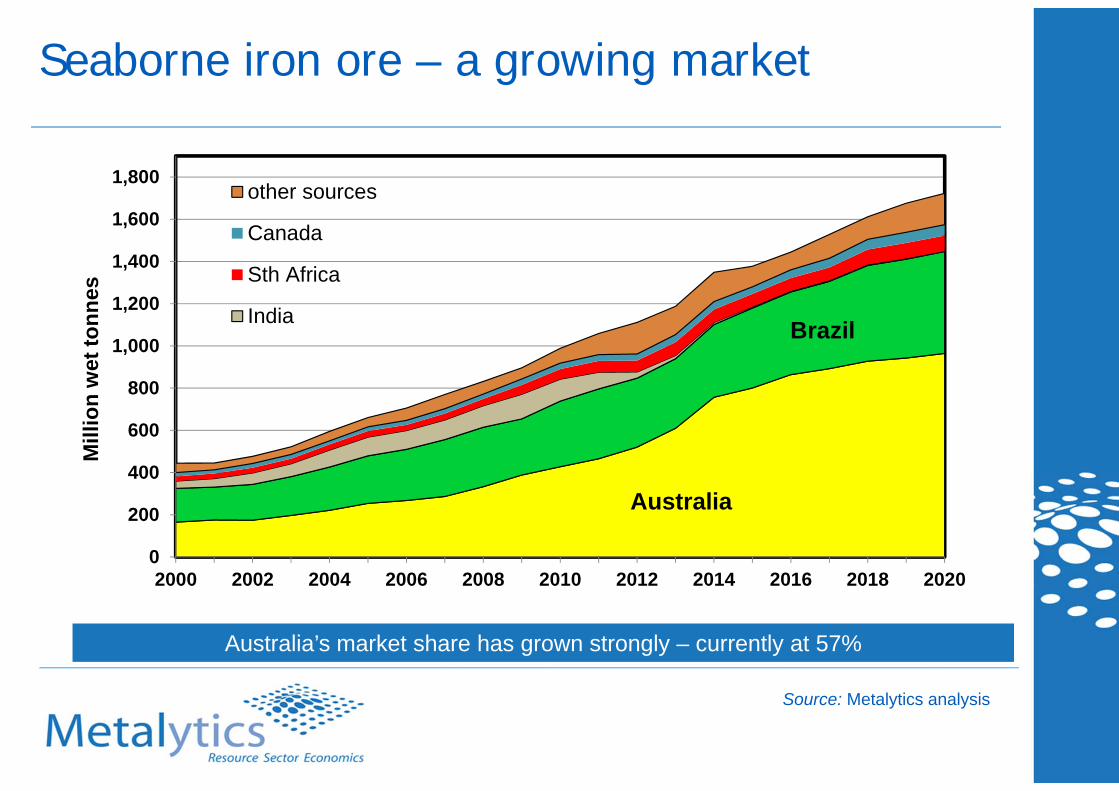
Seaborne iron ore – a growing market
Australia’s market share has grown strongly – currently at 57%
0
200
400
600
800
1,000
1,200
1,400
1,600
1,800
2000 2002 2004 2006 2008 2010 2012 2014 2016 2018 2020
Mill
ion
wet
tonn
es
other sources
Canada
Sth Africa
India
Australia
Brazil
Source: Metalytics analysis
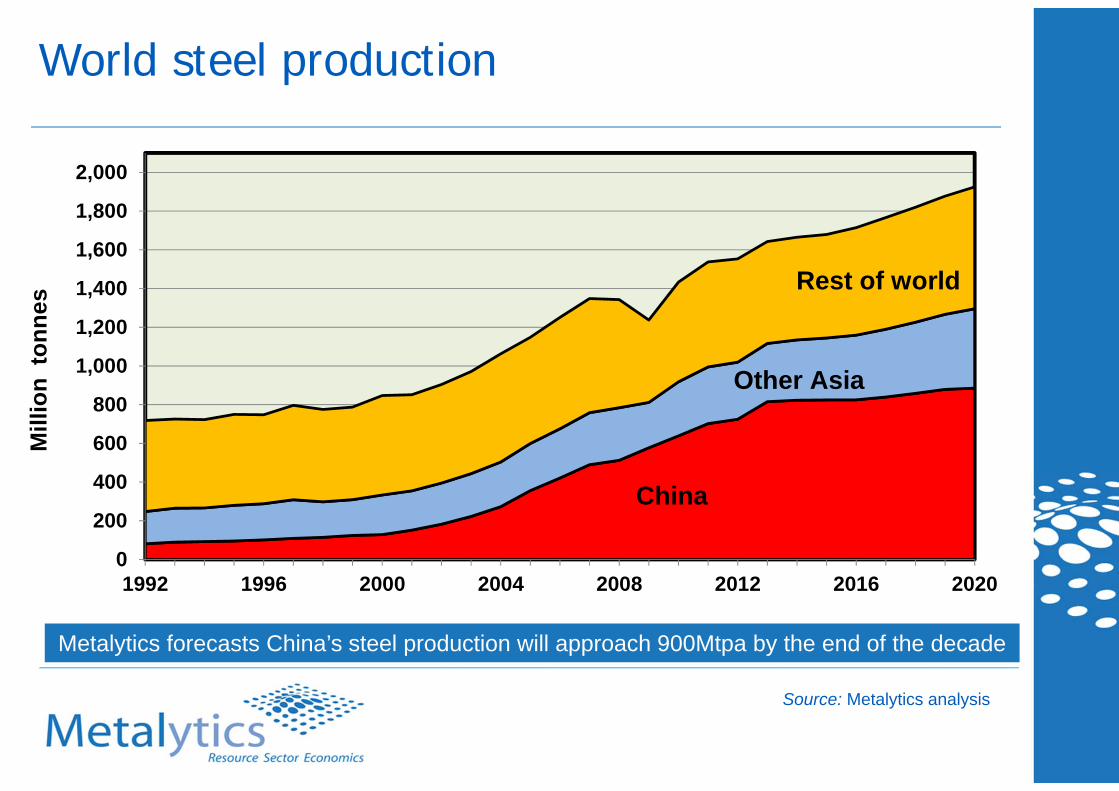
World steel production
Metalytics forecasts China’s steel production will approach 900Mtpa by the end of the decade
0
200
400
600
800
1,000
1,200
1,400
1,600
1,800
2,000
1992 1996 2000 2004 2008 2012 2016 2020
Mill
ion
tonn
es
China
Other Asia
Rest of world
Source: Metalytics analysis
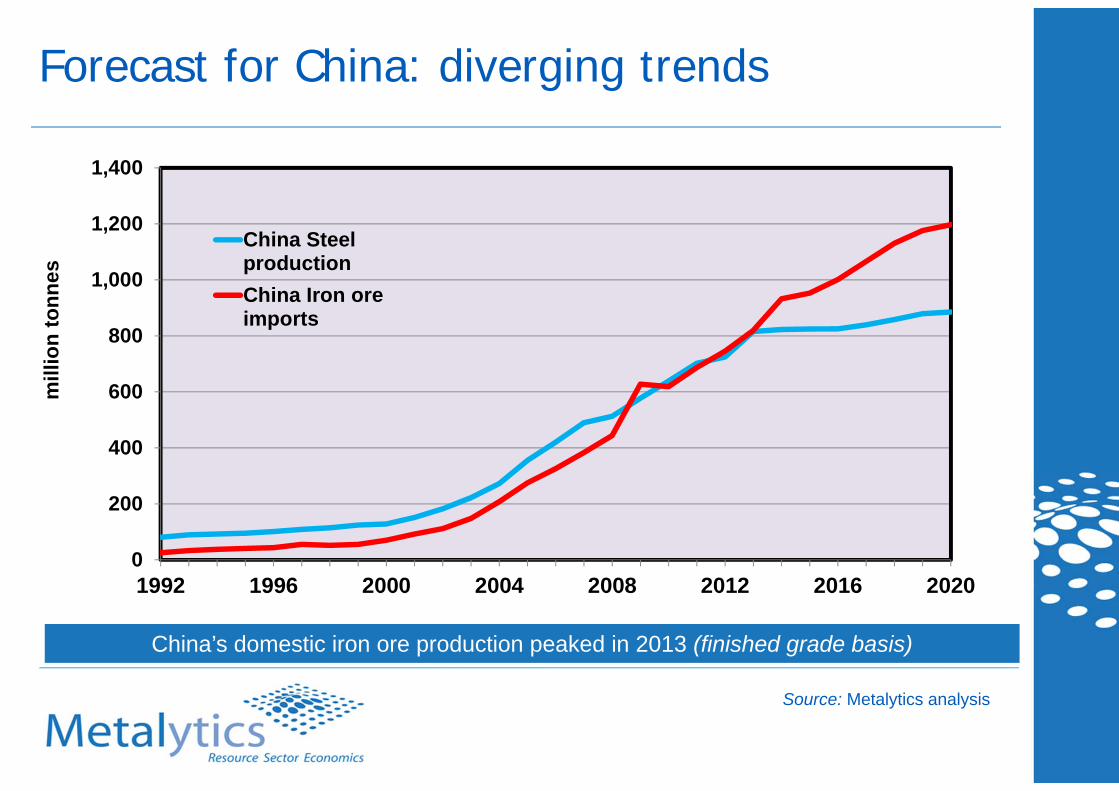
Forecast for China: diverging trends
0
200
400
600
800
1,000
1,200
1,400
1992 1996 2000 2004 2008 2012 2016 2020
mill
ion
tonn
es
China SteelproductionChina Iron oreimports
Source: Metalytics analysis
China’s domestic iron ore production peaked in 2013 (finished grade basis)
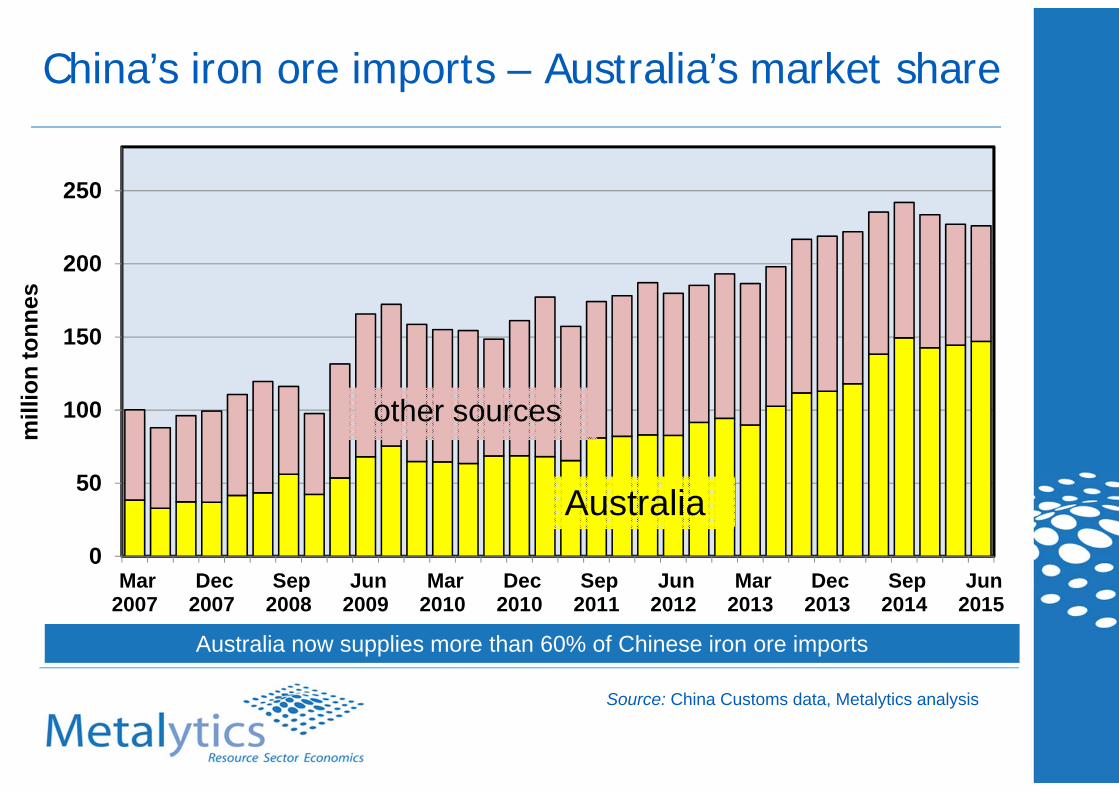
China’s iron ore imports – Australia’s market share
0
50
100
150
200
250
Mar2007
Dec2007
Sep2008
Jun2009
Mar2010
Dec2010
Sep2011
Jun2012
Mar2013
Dec2013
Sep2014
Jun2015
mill
ion
tonn
es
Australia
other sources
Source: China Customs data, Metalytics analysis
Australia now supplies more than 60% of Chinese iron ore imports
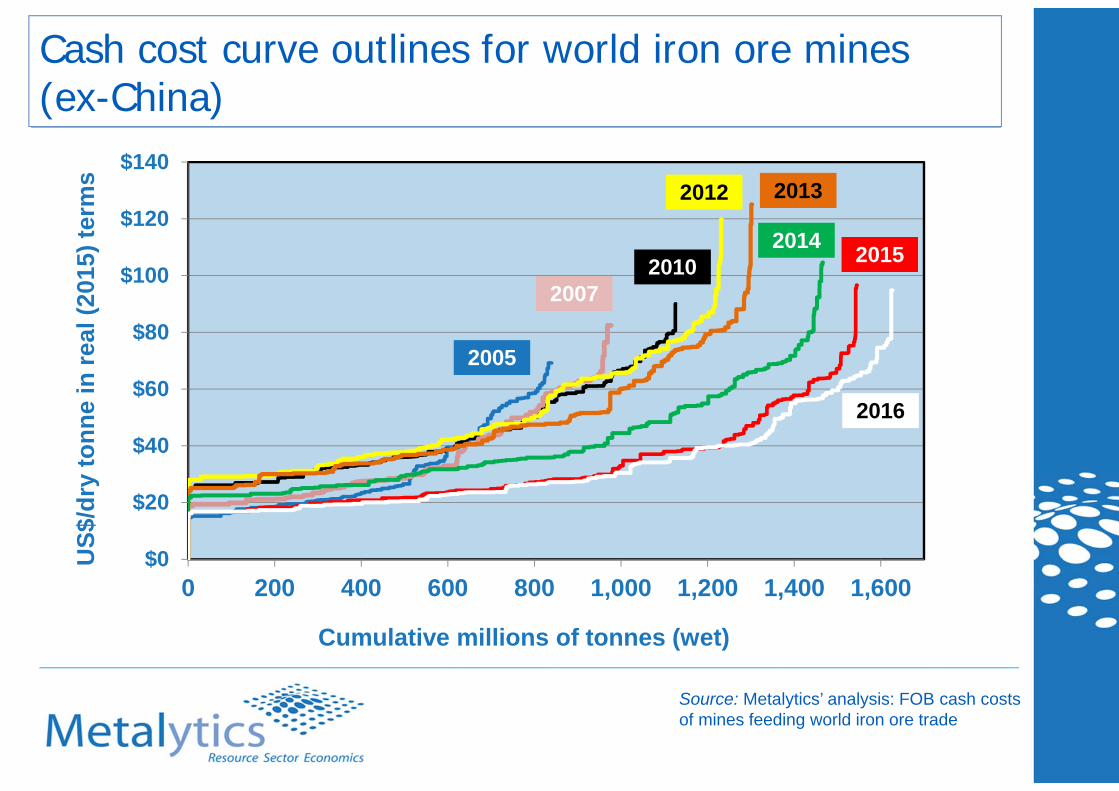
Cash cost curve outlines for world iron ore mines(ex-China)
$0
$20
$40
$60
$80
$100
$120
$140
0 200 400 600 800 1,000 1,200 1,400 1,600
US$
/dry
tonn
e in
real
(201
5) te
rms
Cumulative millions of tonnes (wet)
2005
2016
2013
2014
2007
2012
2010 2015
Source: Metalytics’ analysis: FOB cash costs of mines feeding world iron ore trade
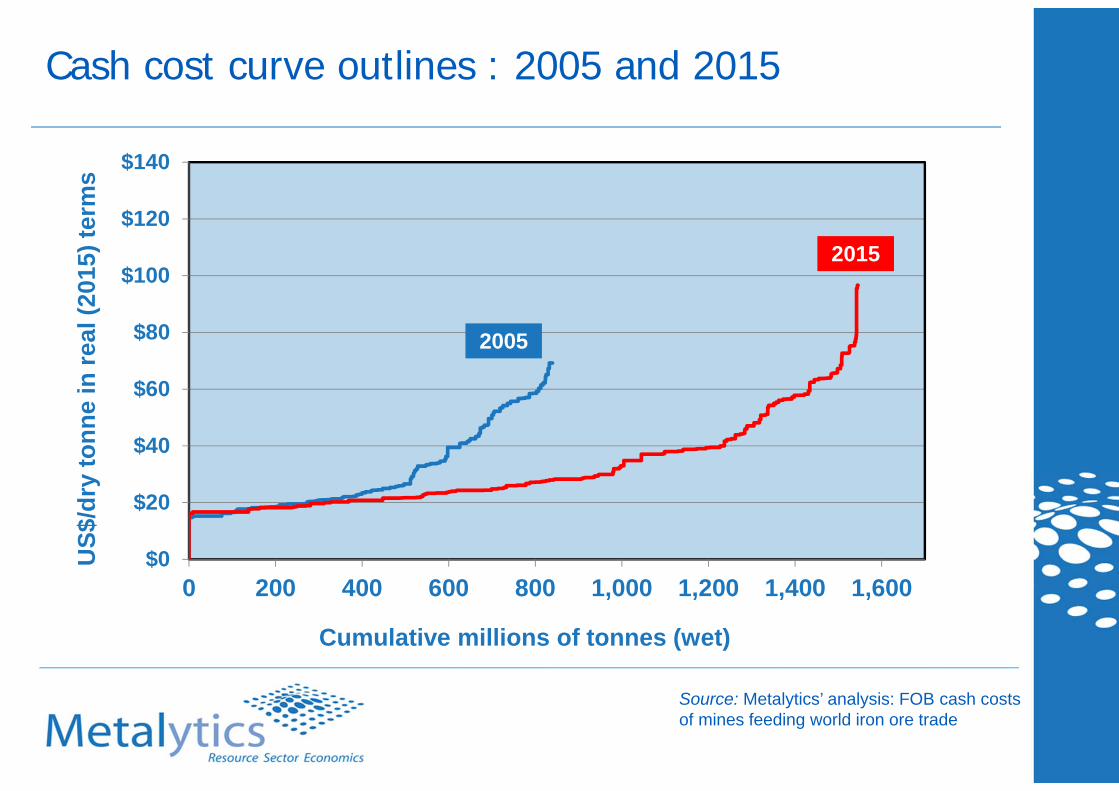
Cash cost curve outlines : 2005 and 2015
$0
$20
$40
$60
$80
$100
$120
$140
0 200 400 600 800 1,000 1,200 1,400 1,600
US$
/dry
tonn
e in
real
(201
5) te
rms
Cumulative millions of tonnes (wet)
2005
2015
Source: Metalytics’ analysis: FOB cash costs of mines feeding world iron ore trade
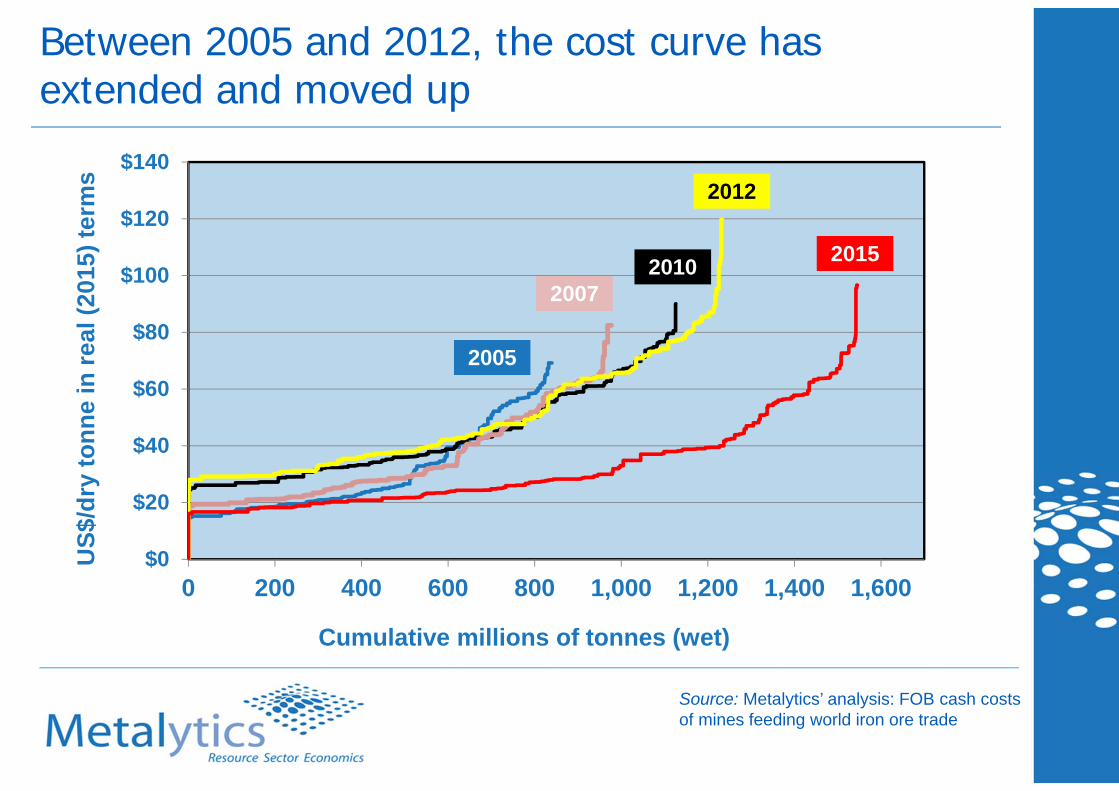
Between 2005 and 2012, the cost curve has extended and moved up
$0
$20
$40
$60
$80
$100
$120
$140
0 200 400 600 800 1,000 1,200 1,400 1,600
US$
/dry
tonn
e in
real
(201
5) te
rms
Cumulative millions of tonnes (wet)
2005
2007
2012
2010 2015
Source: Metalytics’ analysis: FOB cash costs of mines feeding world iron ore trade
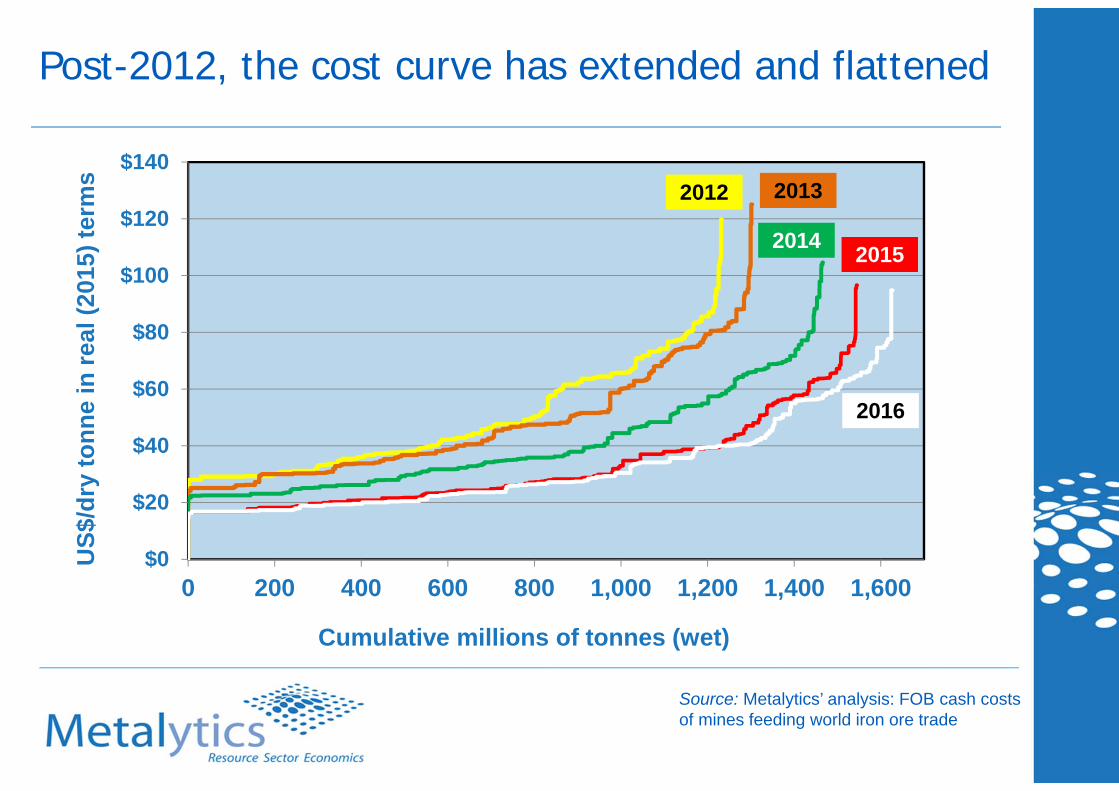
Post-2012, the cost curve has extended and flattened
$0
$20
$40
$60
$80
$100
$120
$140
0 200 400 600 800 1,000 1,200 1,400 1,600
US$
/dry
tonn
e in
real
(201
5) te
rms
Cumulative millions of tonnes (wet)
2016
2013
2014
2012
2015
Source: Metalytics’ analysis: FOB cash costs of mines feeding world iron ore trade
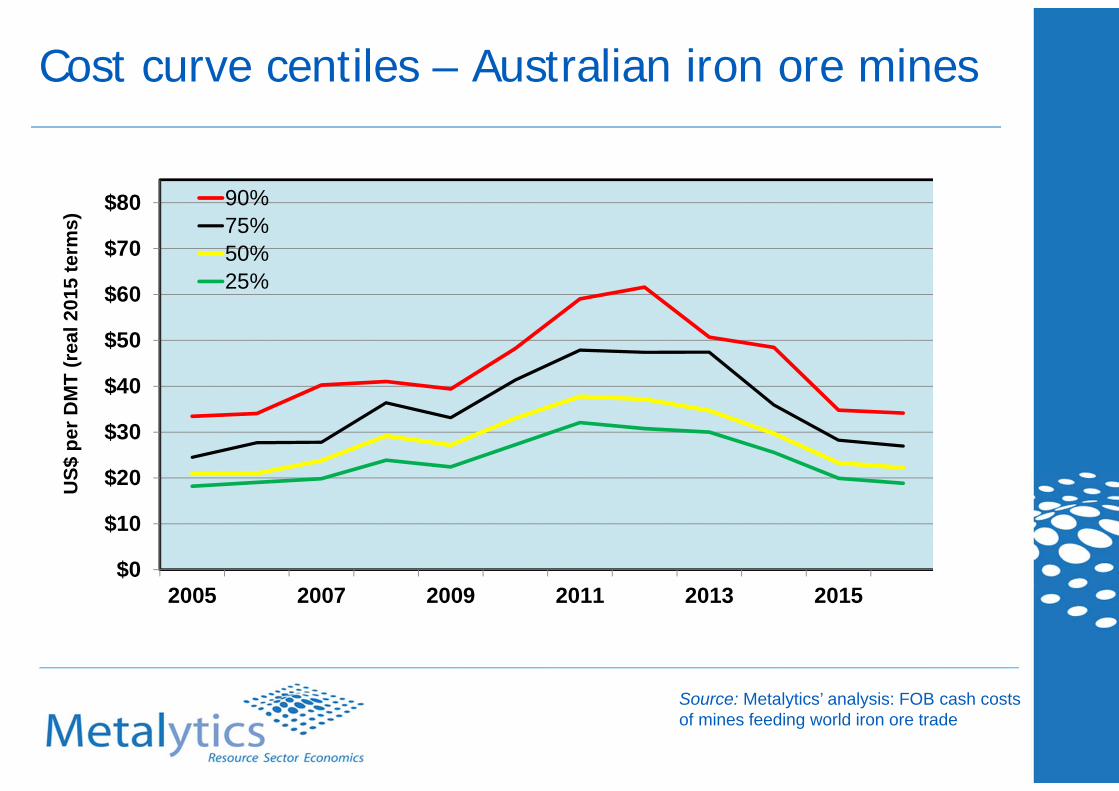
Cost curve centiles – Australian iron ore mines
$0
$10
$20
$30
$40
$50
$60
$70
$80
2005 2007 2009 2011 2013 2015
US$
per
DM
T (r
eal 2
015
term
s)
90%75%50%25%
Source: Metalytics’ analysis: FOB cash costs of mines feeding world iron ore trade
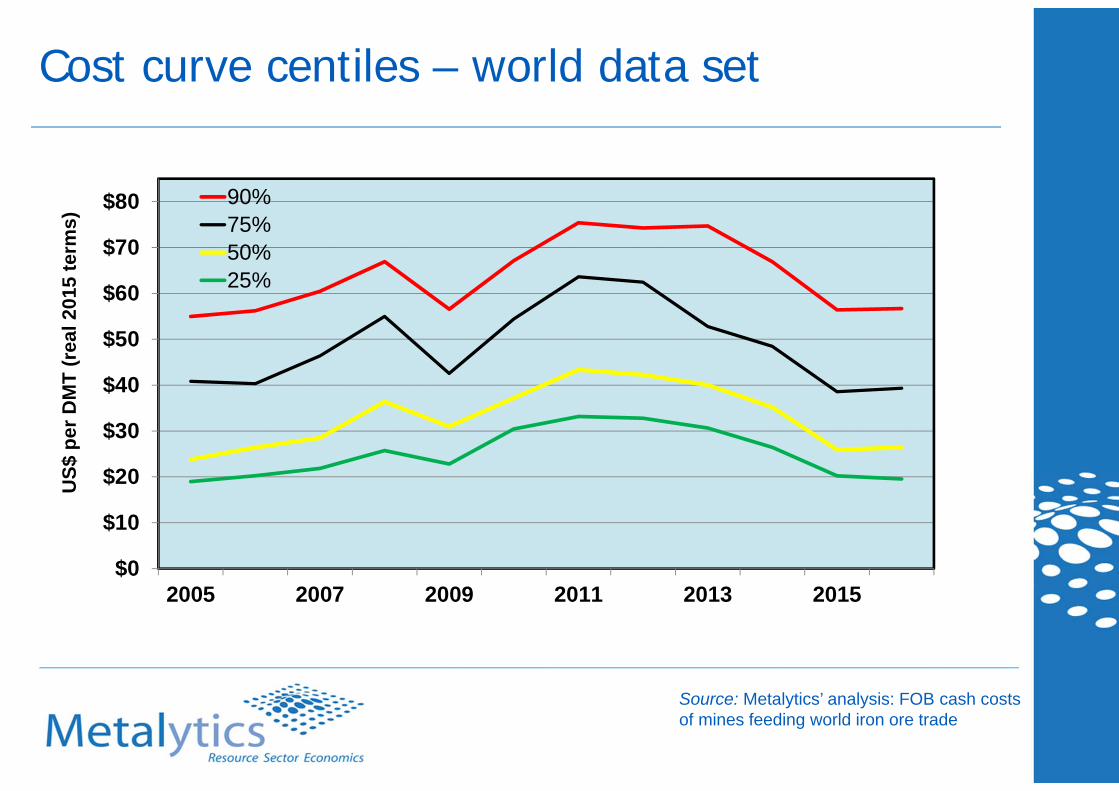
Cost curve centiles – world data set
$0
$10
$20
$30
$40
$50
$60
$70
$80
2005 2007 2009 2011 2013 2015
US$
per
DM
T (r
eal 2
015
term
s)
90%75%50%25%
Source: Metalytics’ analysis: FOB cash costs of mines feeding world iron ore trade
Industry projections must take account of:
Slower but inexorable world economic growth, but with escalating consumer demand for steel
China’s economic policy directed towards stable growth but without major stimulus
Structural changes in production cost drivers, including lower oil prices and USD exchange rates
Need to embrace growing environmental concerns in both the industrialised world and developing countries at all stages of the steel value chain
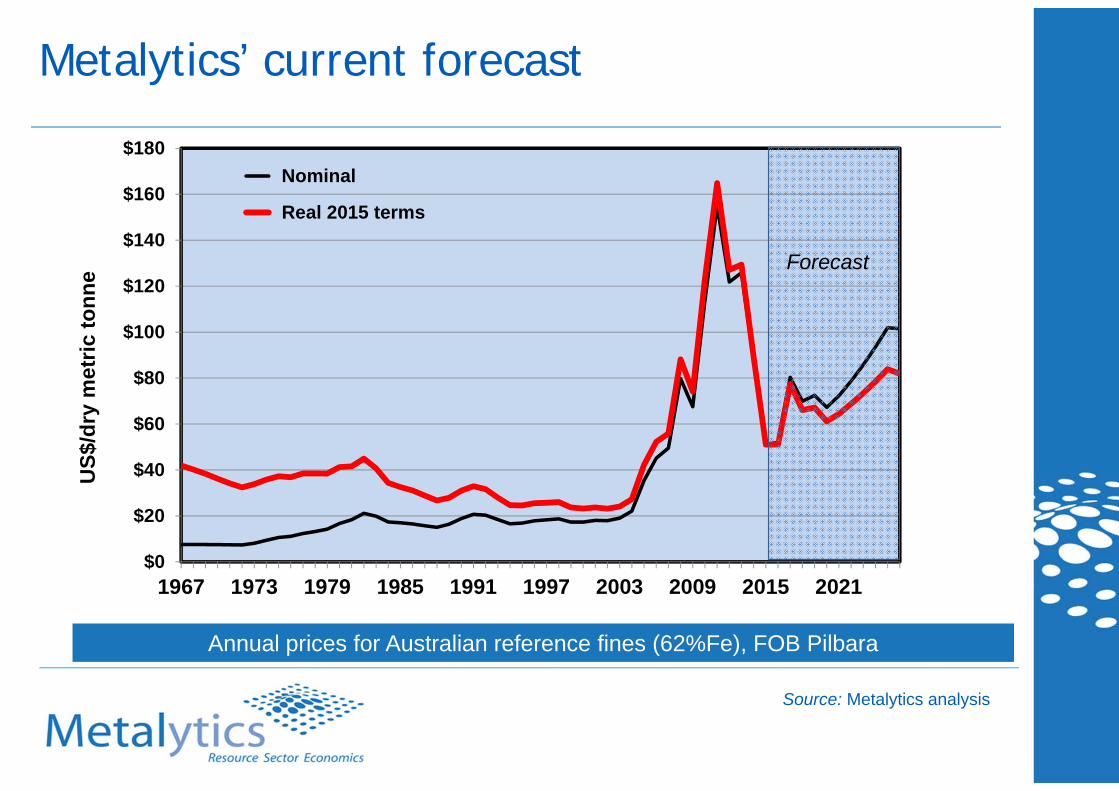
Metalytics’ current forecast
$0
$20
$40
$60
$80
$100
$120
$140
$160
$180
1967 1973 1979 1985 1991 1997 2003 2009 2015 2021
US$
/dry
met
ric to
nne
Nominal
Real 2015 terms
Forecast
Annual prices for Australian reference fines (62%Fe), FOB Pilbara
Source: Metalytics analysis
Thank YouMetalyticsLevel 12, 301 George StSydney NSW 2000Australia
[email protected] +61 2 9225 6402
Visit www.metalytics.info for information and downloads
MetalyticsMarket Analysis and Economics Advisory Services
in the Mining and Metals Industries