Embed Size (px)
Citation preview
Welcome to the 11th issue of Perten Science World.
In this issue we have an article comparing the noodle flour quality between the RVA and Viscograph using the prediction pack. The prediction pack allows the use of multivariate analysis on the data to predict desired parameters which can enhance the predicted accuracy of a functional quality compared to a single rheological measurement.
The second article looks into the texture of gluten-free tortillas and how it is affected by the addition of buckwheat, baking time and aging. This topic is becoming more and more important with the increasing number of people being diagnosed with Coeliac disease, an autoimmune disorder where intake of gluten damages a person’s intestines.
In the third article, the volumes of frozen and newly baked bake-off products (Danish pastry and cinnamon rolls) were measured using the new AACCI-standard method for volume measurements (AACCI 10-14.01). This method uses laser topography to measure the volume and can therefore be used on both brittle and sticky products, which is an improvement compared to the old recommendations for volume measurements using a seed displacement method.
The fourth and last article is a review of different RVA applications within the food industry. The RVA gives viscosity profiles of the samples while measured according to pre-set temperature and time cycles. From these profiles, various information are obtained such as pasting behavior of starch, interaction between starch and other compounds, and degree of cook in extruded and pre-cooked samples. It is also used as a quality indicator for hydrocolloids and fibers, enzymatic reactions and process simulations.
I hope you find this 11th issue of Perten Science World interesting, useful, and stimulating!
Dr. Jeanette PurhagenEditor in Chief
www.perten.com
Welcome
Perten Science World
Issue No. 11
IN THIS ISSUE
Articles
Prediction Pack Application – Comparison of Noodle Flour Quality Results Between RVA and Viscograph . . . . . . . . . . . . . . . . . 2 Texture of Gluten-Free Tortillas and the Effect of Buckwheat Addition, Baking Time and Aging. . . . . . . . . . . . . . . . . . . . . . . 6
Volume Measurements on Frozen Products . . . . . . . . . . . . . . . . . . . . . . . . . . . .10
Applications of the Rapid Visco Analyser (RVA) in the Food Industry: a broader view . . . . . . . . . . . . . . . . . . . . . . . . . . . . . . . .14
Perten in Publications
Interesting Papers and Links . . . . . . . .20
Calendar . . . . . . . . . . . . . . . . . . . . . . . . . . 22

- 2 -
A R T I C L E S
Prediction Pack Application – comparison of noodle flour quality results between RVA and ViscographJennifer M.C. Dang,1 Yejia Wei2 and Mark L. Bason3
1Perten Instruments of Australia, 13/2 Eden Park Drive, Macquarie Park NSW 2113, Australia2Perten Instruments (Beijing) Co. Ltd, Room 818, Huaheng Office Building, South Binhe Rd, Xicheng District, Beijing, China3Perten Instruments AB, P.O. Box 9006, SE-126 09 Hägersten, Sweden
IntroductionThe pasting properties of flour provide a useful indication of its suitability for making noodles, bread, cakes, batters and other products. Flour pasting quality is now commonly measured using the Rapid Visco Analyser (RVA), nonetheless many users still require the results to be converted to historical Viscograph units for trade. Most commonly this is done by simple correlations, however multivariate analysis (MVA) offers a potentially superior method.
MVA techniques use multiple variables to describe the variation in a sample attribute, such as the wavelength versus intensity spectrum from near-infrared spectroscopy (NIRS) used to predict sample moisture content in grain. For rheological instruments like the RVA, doughLAB or TVT, the corresponding viscosity/torque/force versus time ‘spectrum’ (curve) can likewise be employed. In this application MVA can potentially predict a desired functional quality more accurately than a single rheological measurement (Juhasz, et al., 2005, Meadows & Barton, 2002, Mijland, et al., 1999, Ohm, et al., 2006).
The Prediction Pack is an optional feature available to users of the Thermocline for Windows (TCW) software for the RVA, the doughLAB for Windows (DLW) software for the doughLAB and micro-doughLAB, and the TexCalc software for the TVT. The Prediction Pack allows the use of MVA techniques on the available data to predict a desired parameter. The Prediction Pack is used to load prediction models first created using The Unscrambler X software, which can then be used to create analysis results.
This paper summarises the comparison of wheat noodle flour quality results between the RVA and Viscograph using univariate and multivariate analyses.
Materials and MethodsForty-seven noodle wheat flours with varying proximate (ash, gluten) and rheological qualities (Viscograph, Farinograph, Extensograph and Falling Number values) were obtained from a commercial source in Tianjin, China. Viscosity analyses were performed on a Perten Instruments RVA 4500 using the noodle profile (Table 1), at the same sample concentration used in Viscograph tests (15.1%). Viscograph analyses of interest were peak, hold, final, breakdown and setback viscosities, peak time and pasting temperature.
Table 1: RVA noodle profile.
Time Type Value
00:00:00 Temp 60°C
00:00:00 Speed 960 rpm
00:00:10 Speed 160 rpm
00:02:00 Temp 60°C
00:08:00 Temp 95°C
00:12:00 Temp 95°C
00:16:00 Temp 50°C
00:20:00 End of test -Idle temperature: 60 ± 1°CTime between readings: 4 s
Univariate comparisons of the Viscograph and the corresponding RVA results were performed by regression analyses (Minitab ver. 13). Method
- 3 -
A R T I C L E S
precision was evaluated from one-way analysis of variance of data as the coefficient of determination (R2) and root mean square of residuals (RMS). RVA viscosity spectra at four-second intervals were exported from the TCW software (v. 3.16) in ASCII format into The Unscrambler software (v. 10.3, CAMO ASA, Oslo, Norway) for multivariate analysis. Partial least squares (PLS) regression models were created between the reference Viscograph values and RVA viscosity spectra, and validated using random cross-validation. The models were created for Viscograph analyses combined (all analyses were predicted with one model) or individually (a separate model was created to predict each individual parameter). The R2 and the root mean squared error (RMSE) were determined for all statistical analyses.
A suitable (optimum) model is one with large R2
and small RMSE of calibration (RMSEC) and cross-validation (RMSECV). RMSECV was used in preference to RMSE of prediction (RMSEP) in this study, since it indicates model robustness in the absence of a separate validation data set.
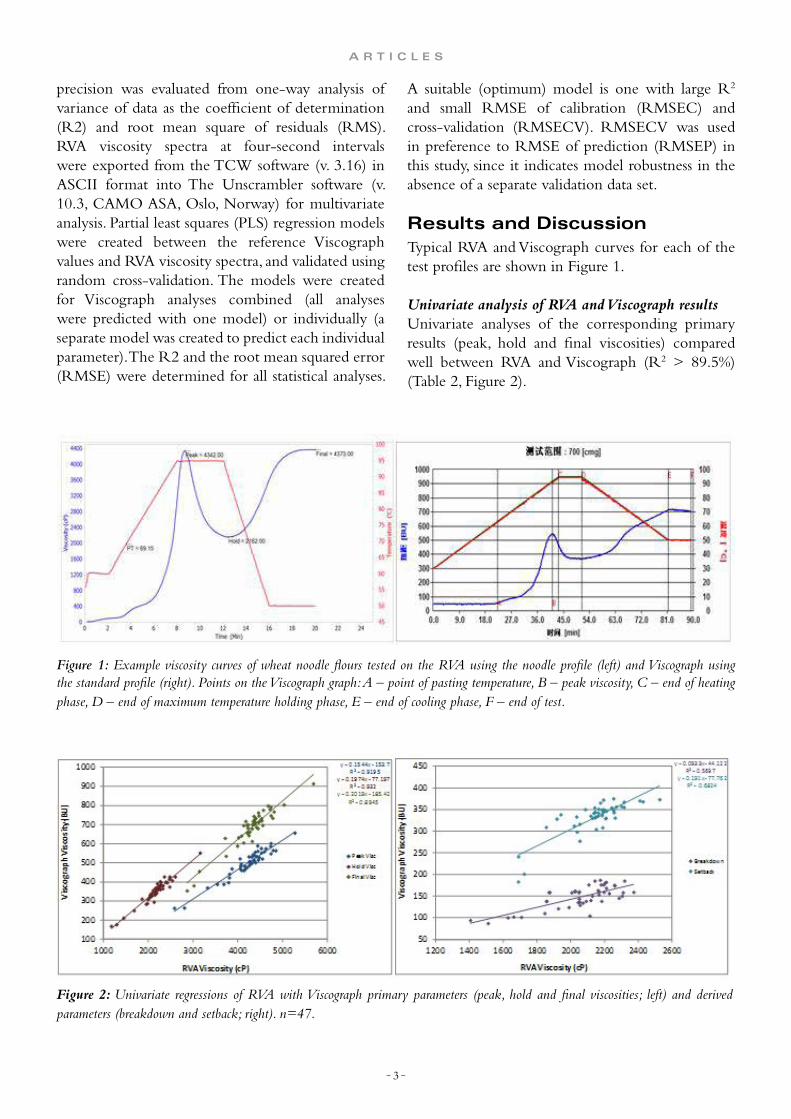
Results and DiscussionTypical RVA and Viscograph curves for each of the test profiles are shown in Figure 1.
Univariate analysis of RVA and Viscograph resultsUnivariate analyses of the corresponding primary results (peak, hold and final viscosities) compared well between RVA and Viscograph (R2 > 89.5%) (Table 2, Figure 2).
Figure 1: Example viscosity curves of wheat noodle flours tested on the RVA using the noodle profile (left) and Viscograph using the standard profile (right). Points on the Viscograph graph: A – point of pasting temperature, B – peak viscosity, C – end of heating phase, D – end of maximum temperature holding phase, E – end of cooling phase, F – end of test.
Figure 2: Univariate regressions of RVA with Viscograph primary parameters (peak, hold and final viscosities; left) and derived parameters (breakdown and setback; right). n=47.

- 4 -
A R T I C L E S
Derived viscosity parameters (breakdown and setback) had weaker correlations (R2 50 – 70%); this was expected since the derived values were dependent on variation between the multiple
parameters. Weak or no correlation (R2 < 50%) was observed between the instruments for peak time and pasting temperature using univariate analyses. This was probably due to the different heating rates used.
Table 2: Goodness of fit of univariate and PLS regression models between RVA and Viscograph data. n=47.a
aPLS = partial least squares, VG = Viscograph, RVA = Rapid Visco Analyser, R2 = coefficient of determination (%), n = number of samples, RMS = root mean square error fit of univariate regression, RMSEC = root mean squared error of calibration and RMSECV = root mean squared error of cross-validation. Error values for viscosity (peak, hold, breakdown, final, setback) are in BU, time in min. and temperature in °C.
ResponseUnivariate PLS calibration PLS validation
RMS R2 RMSEC R2 RMSECV R2
VG Peak 22.2 91.9 14.1 96.6 17.2 95.2
VG Hold 17.1 93.2 10.5 97.4 12.7 96.3
VG Breakdown 17.4 56.8 9.82 85.7 12.2 79.0
VG Final 32.8 89.5 17.2 97.0 23.8 94.5
VG Setback 22.2 68.3 9.90 93.4 15.5 84.6
VG Peak time 0.33 46.6 0.14 90.2 0.17 85.8
VG Pasting temperature 2.23 4.93 0.23 88.0 0.31 80.2
Figure 3: RVA Prediction Pack software analysis definitions (A) and corresponding models (B) using RVA viscosity spectra (C) to predict Viscograph results (D).

- 5 -
A R T I C L E S
Multivariate analysis of RVA and Viscograph resultsMultivariate analyses (PLS) of RVA viscosity spectra gave better predictions of Viscograph values than univariate analyses for every parameter (smaller residual errors and larger R2 values, Table 2). Generally, better predictions of Viscograph results were also achieved using the entire RVA curve compared to selected RVA analysis points, and with separate models rather than a combined model (results not shown).
The model using RVA noodle viscosity spectra gave good predictions of Viscograph peak (R2 = 95.2%, RMSECV = 17.2 BU), hold (R2 = 96.3%, RMSECV = 12.7 BU) and final (R2 = 94.5%, RMSECV = 23.8 BU) viscosities, and reasonable predictions of Viscograph breakdown (R2 = 79.0%, RMSECV = 12.2 BU), setback (R2 = 84.6%, RMSECV = 15.5 BU), peak time (R2 = 85.8%, RMSECV = 0.2 min.) and pasting temperature (R2 = 80.2%, RMSE = 0.3 °C).
Predictive models created in The Unscrambler can be exported to the RVA software using the Prediction Pack (Figure 3). With the Prediction Pack, a test configuration combining predictive models and other analysis functions (e.g. for peak, hold and final viscosities) can be created. Additional covariates (e.g. amylose content) could also be added to the model, in which case the value for these parameters will be requested by TCW each time a test is run and then used in the prediction. When the given test configuration is used to test future samples, the software will output the predicted Viscograph values using the RVA viscosity curve.
ConclusionsThe RVA 4500, using the noodle test profile and multivariate analysis (PLS) of the viscosity spectra, gave good predictions of Viscograph results. The Prediction Pack can be used to set up the RVA software to perform tests on future samples and output the predicted Viscograph results based on the models created.
References
Juhasz, R., Gergely, S., Gelencser, T., & Salgo, A. (2005) Relationship between NIR spectra and RVA parameters during wheat germination, Cereal Chemistry 82(5): 488–493.
Meadows, F., & Barton, F. E. (2002) Determination of Rapid Visco Analyser arameters in rice by near-infrared spectroscopy, Cereal Chemistry 79(4): 563–566.
Mijland, P. J. H. C., Janssen, A. M., & de Vres, P. A. M. (1999) Multivariate comparison of the Brabender Viscograph and the Rapid Visco Analyser using cross-linked starch, Starch/Stärke 51(1): 33–39.
Ohm, J.-B., Ross, A. S., Ong, Y.-L., & Peterson, C. J. (2006) Using multivariate techniques to predict wheat flour dough and noodle characteristics from size-exclusion HPLC and RVA data, Cereal Chemistry 83(1): 1–9.

- 6 -
A R T I C L E S
Texture of Gluten-Free Tortillas and the Effect of Buckwheat Addition, Baking Time and Aging
IntroductionCoeliac disease is an autoimmune disorder with a prevalence of 1 in 100 people in northern and western Europe and in northern America. Intake of gluten causes immune-mediated damage to the small bowel’s mucosa. The only known treatment to normalize the mucosa and to avoid future complications is a strict gluten-free diet. All food containing wheat, rye, barley and sometimes oats have to be excluded from the diet (Dubé et al., 2005). Products like bread, pasta and pizza are staple foods in many countries and are often based on products containing gluten. Therefore people with coeliac disease have to find alternatives. Products are especially manufactured to be gluten free and the market for gluten-free food is growing.
When this project started there were not many gluten-free tortilla breads on the Swedish market. Tortillas are traditionally made of corn, but the tortillas sold in Sweden are mainly based on wheat flour. The corn tortillas available in Swedish stores also contain wheat flour, which excludes them from a gluten-free diet. The purpose of this study was therefore to develop soft gluten-free tortillas for Finax AB, a company producing gluten-free products since 1983 (Finax, 2014).
MethodsTo find an optimal recipe, breads with different flours and proportions were baked. From those trials a standard tortilla was found. To improve the tortilla further, different amounts of buckwheat flour were added, and the amount of guar gum was altered as well as the baking time. To examine the storage capability, the tortillas were stored at room temperature and measured after 1–8 days. This article focuses on the texture analyses (for further reading see my thesis ’Produktutveckling av glutenfria tortillabröd – hur påverkas bröden av ingrediensval och gräddningstid’, Rolander, 2015).
Tortilla productionThe tortillas were produced using the following ingredients: water, wheat starch, rice flour, rape seed oil, sugar, psyllium husk, salt, yeast, baking powder. Guar gum and buckwheat were added according to Table 1. All ingredients were mixed in a mixer (Hobart N50), 2 min. at low speed and 4 min. at middle speed. The dough was allowed to rest at room temperature (20–23 °C) for 30 min., dough balls of 140 g were formed and sheeted. Using a mold, tortillas with diameter 230 mm were formed from the dough. The tortillas were baked at 225°C (Elektrolux co 5940) according to Table 1.
Rana Cheaib, Masters Thesis project at the Department of Food Technology, Faculty of Engineering, Lund University, Sweden AarhusKarlshamn AB (AAK) in Malmö, Sweden
AbstractTaco is a popular dish in Swedish homes, but for people who are intolerant to gluten the choice of tortilla bread is limited. The purpose of this study was to compare the texture of gluten-free tortillas baked with different amounts of guar gum, buckwheat flour and baking time. The tortillas were also compared to a wheat flour based tortilla and two gluten-free tortilla breads available in stores.The results showed that the tortilla bread with buckwheat flour was softer than the bread without buckwheat when they were stored for 1–8 days at room temperature. The baking time affected the hardness of the bread. A long baking time resulted in bread with higher hardness. However, the elasticity was not affected by the baking time. Compared to the tortillas based on wheat flour, the gluten-free tortillas baked and analysed in this study were less hard and less elastic. To make a gluten-free tortilla similar to the wheat flour tortillas further improvements need to be made.
Key words: gluten-free tortilla, buckwheat, guar gum, baking time

- 7 -
A R T I C L E S
The tortillas were cooled at room temperature and then placed in plastic bags and stored at room temperature (20–23°C) until they were analyzed.
Evaluation of tortilla propertiesAn objective way to measure the texture of tortillas is to undertake a texture analysis. In this study, a texture analyzer TVT-6700 (Perten Instruments, Sweden) was used to measure the stretchability by penetration of the tortilla and also to measure the extensibility by tension. To notice change in texture when aging, the tortillas were measured after 1, 3 or 6 and 8 days. For each batch 1–4 tortillas were measured.
Table 1. Levels of buckwheat, guar gum and the baking time.
Trial Buckwheat level Guar level Baking time(min.)
(min.) 0 Low 4
bg+ 0 Low 5
Bg- High Low 4
Bg+ High Low 5
bG- 0 High 4
bG+ 0 High 5
BG- High High 4
BG+ High High 5
The penetration test was done according to method 08-05.01 (Perten Instruments), see Table 2 for set values. A cylindrical probe (diameter 18 mm) punctured the tortilla that was placed on a platform with a 50 mm large hole. For this analysis tortillas with similar shape and size were used to get a representative value. In this test the force (g) and distance (mm) was recorded. The force was the maximal force required to rupture the tortilla, the hardness of the bread. The elasticity and stretchability of the tortillas were measured by distance to peak force, the longer distance the more elastic tortilla.
Single cycle compression
Sample height 3.0 mm
Headroom above object 8.0 mm
Compression distance 30.00 mm
Pre-test speed 6.0 mm/s
Test speed 1.7 mm/s
Post-test speed 10.0 mm/s
Trigger force 20 g
Data rate 200 pps
Load cell 7 kg
Table 2. Set values for puncture test.

- 8 -
Figure 1. Tortilla hardness during storage. Control tortillas are also shown as GF1, GF2 and wheat.
A R T I C L E S
The extensibility test was made according to method 08-06.01, see Table 3. A sample of the tortilla (30 x 100 mm) was attached to two clamps. One clamp was attached to the base and one to a moving arm. As the arm moved the tortilla was stretched. The measurements stopped when the tortilla bread was ruptured or after it had been stretched 15 mm. In the extensibility test, force (g) and distance (mm) were recorded. The force needed to stretch the sample, extension resistance force, corresponds to the peak force, while the distance it could be stretched corresponds to the extensibility and elasticity of the tortilla.
Single cycle tensile
Sample height 40,0 mm
Extension distance 15,0 mm
Pre-test speed 1,0 mm/s
Test speed 1,7 mm/s
Post-test speed 10,0 mm/s
Trigger force 5 g
Data rate 333 pps
Load cell 7 kg
Statistical analysisThe study design full factorial trial with three variables on three levels and replicates in the centrum was chosen
to see the effects of different ingredients. All trials were done in duplicate, except the middle level which was made in triplicate. The duplicates were baked on two different days. Three tortilla breads on the Swedish market, of which two were gluten free, were used as control tortilla. One of the tortilla breads was based on wheat. Analysis of variance (ANOVA – general linear model) was performed using Minitab® version 16. Samples with p<0.05 were counted as significantly different. Only the highest and lowest level of the parameters were analyzed with the general linear model. To see if the relationship was linear, ANOVA (mail effect plot) was used for all three levels.
ResultsTexture affects the consumer’s opinion of the tortilla’s freshness. In the puncture test the tortillas were significantly harder the longer the baking time and as they aged. On the other hand, the tortillas were significantly softer if a large amount of buckwheat was added to the recipe. There was a relationship between age and buckwheat, Figure 1. Breads with buckwheat, a large amount or middle amount, did not increase in hardness as they aged. Bread with no buckwheat almost reached a doubled hardness value.
In the extensibility test the distance the bread could be stretched corresponded to the elasticity of the tortilla.
Table 3. Set values for extensibility test.

- 9 -
A R T I C L E S
All tortillas were more elastic at first measurement (day 1) and loosened elasticity as they aged. Addition of buckwheat made the tortillas significantly less elastic. Tortillas without buckwheat could be stretched a longer distance. The elasticity was not affected by the baking time. The reference tortilla containing wheat flour was the most elastic.
DiscussionThe buckwheat made the bread become less hard; this is in line with a study made by Wronkowska et al. (2013) in which buckwheat was added to gluten-free bread mixes. In that study the bread with buckwheat was less hard than bread based on starch only. As the bread aged 1–8 days, the bread without buckwheat increased in hardness, while the bread with a high level of buckwheat only increased a little. In the study by Wranowska et al (2013) an addition of 10–40% of buckwheat increased the hardness of the bread significantly during the first 24 hours. After that the increase in hardness stopped. The more buckwheat added, the less the hardness increased. In this study, there was no difference between tortillas with a middle amount and a large amount of buckwheat.Mariotti et al. (2013) concluded that the addition of buckwheat to a gluten-free bread mix based on different starches, made the bread increase in hardness only 5.4 times compared to 20 times when no buckwheat was added. In another gluten-free bread mix containing psyllium husk and guar gum, an addition of buckwheat made the bread harder after only 3 hours. (Mariotti et al., 2013) It seems that the choice of ingredients in a gluten-free bread influences how the addition of buckwheat affects the bread.As this project was a baking project, there are sources of errors such as different days for baking the tortilla (for further reading see the author’s thesis Rolander, (2015)).
ConclusionsCompared to the tortillas based on wheat flour, the gluten-free tortillas in this study were less hard and less elastic. To make a gluten-free tortilla more like the wheat-flour tortillas, further improvements need to be made.
References
Dubé, C., Rostom A., Sy, R., Cranney, A., Saloojee, N., Garritty, C., Sampson, M., Zhang, L., Yazdi, F., Mamaladze, V., Pan, I., Macneil, J., Mack, D., Patel, D. & Moher, D. (2005) The prevalence of celiac disease in average-risk and at-risk western European populations: A systematic review, Gastroenterology 128: 57–67.
Finax (2014). Glutenfritt som smakar och gör gott. http://se.finax.com/product_category/glutenfritt-2/ [2014-05-06]
Mariotti, M., Ambrogina Pagani, M. & Lucisano, M. (2013) The role of buckwheat and HPMC on the breadmaking properties of some commercial gluten-free bread mixtures, Food Hydrocolloids 30: 393–400.
Rolander, L. (2015) Produktutveckling av glutenfria tortillabröd – hur påverkas bröden av ingrediensval och gräddningstid? Finax AB, Helsingborghttp://www.finax.se/en/contact/
Wronkowska, M., Haros, M. & Soral-Smietana M. (2013) Effect of starch substitution by buckwheat flour on gluten-free bread quality, Food Bioprocess Technology 6: 1820–1827.

- 1 0 -
A R T I C L E S
Volume Measurements on Frozen Products
Dr J. PurhagenPerten Instruments, Helsingborg, SwedenDepartment of Food Technology, Faculty of Engineering, Lund University, [email protected]
IntroductionAs the market for frozen bake-off products increases, more routine quality control measurements are required to ensure the consistency of the products. Quality control measurements can be performed on both the ingredients and at different production stages. Ingredients can be tested for instance by using a Falling Number instrument and Rapid Visco Analyzer (RVA) (AACC International, Crosbie & Ross, 2007), while semi-baked products and finished products can the tested for volume and texture (AACC International, 2014, Bourne, 2002).
Until recently, there were no standard methods for volume measurements, only guidelines (AACC International, 2001). The guidelines method derives from Archimedes principle (Heath, 1897) but instead of using water as a displacement medium it uses seed. Due to the physical contact between the seeds and the product, this seed displacement method is not suitable for sticky, crispy or soft products such as pasties. In October 2014, a new AACC standard method for volume measurements was approved (AACC International, 2014). This method uses laser topography to measure the volume of the products, which means that sticky, crispy and soft products can also be measured without anything touching the product besides the sample holder.
The aim of this study was to see how well the new AACC-standard method for volume measurements, method 10-14.01 (AACC International, 2014), would work on both frozen and ready baked bake-off products.
Material and MethodsTwo types of bake-off products were used in the test, cinnamon roll and Danish pastry. The products were measured in both frozen and ready-baked state.
Four samples of each product were measured in triplicate using a BVM-L100 (Perten Instruments, Sweden). This BVM-model corresponds to the BVM 6610 mentioned in the AACC-standard method. The test duration time was set to 60 sec. and the support attachments used were flat supports, rectangular shaped with the dimensions 15x40mm and 15x70mm for the frozen products and the baked products respectively, Figure 1. The samples were placed horizontally on the support, Figure 2. This position was chosen because of the character of the products. The baking was performed in an industrial oven (SelfCookingCenter 5 Senses, Whitefficiency, Rational AG, Germany). For the Danish pastries, the pastry program of the oven was chosen, while the cinnamon rolls were baked at 200°C for 13 min.
Results and DiscussionThe mean results for the volume measurements are displayed in Table 1. These mean values and standard deviations were calculated on four different samples, and each sample was run in triplicate, i.e. 12 measurements. The standard deviation within each sample for the three measurements was 0.0.
For the frozen products it can be seen that the Danish pastry samples gave smaller standard deviations and were therefore more homogenous in size compared to the cinnamon rolls. It can thus be
Figure 1. A – 15 x 40 mm, B – 15x 70 mm.

- 1 1 -
A R T I C L E S
said that the production of the Danish pastry bake off at the manufacturer has a better reproducibility. Furthermore, the cinnamon rolls only had a significant increase in volume. The height and diameterMAX
gave the same variations both before and after the baking. This could depend on the samples increasing differently during baking. Some samples might have increased in height and others in diameter (i.e. width
or depth). The 3-D graphs for the cinnamon rolls before and after baking can be seen in Figure 3.
As seen in Table 1, the Danish pastries displayed a large increase in both volume and size dimensions after baking. However, the variation between the samples became very large, giving large standard deviations. In order to see how the volume for each sample was affected by the baking, the individual increase in volume was calculated, Table 2. The values are mean values of the triplicates with standard deviation of 0.0. It can be seen that the increase in volume for the cinnamon rolls was relatively equal between the samples (24–27%), however, the increase for the Danish pastries differed significantly between the samples (163–335%). This difference was also seen visually and in the 3-D graphs, Figures 2 and 4.
Figure 2. A–C sample set-up of the frozen products, D–E sample set-up of baked Danish pastry.
Figure 3: 3-D graph of cinnamon rolls, A frozen and B baked.

- 1 2 -
Table 1. Volume result displayed by mean values and standard deviation.
Cinnamon Roll Danish Pastry
Frozen Baked Frozen Baked
Volume (ml) 104 ± 4.1 131 ± 4.3 84 ± 1.1 250 ± 24.4Height (mm) 32.8 ± 0.75 33.5 ± 1.73 25.5 ± 0.52 45.5 ± 5.32DiameterMAX (mm) 95.5 ± 4.08 96.8 ± 4.00 100.0 ± 1.95 117.3 ± 2.39
Table 2. Individual volume results..
Cinnamon Rolls Danish Pastry
Volume
[ml]
IncreasVol
[%]Volume
[ml]
IncreasVol
[%]
Frozen Baked Frozen Baked
Sample 1 109 135 24 84 248 195Sample 2 105 132 26 84 221 163Sample 3 98 124 27 82 255 311Sample 4 104 132 27 85 285 335
Figure 4: 3-D graphs of Danish pastry, A – frozen product, B – baked product sample 1, C – baked product sample 4.
The filling (seen in the frozen samples) of samples 1 and 2 were blown to the edge of the samples by the oven fan and were thereby preventing the dough from increasing in that side of the sample. For samples 3 and 4, the filling was maintained in the center of the product. It is therefore clear that the placement of the samples within the oven is important.
ConclusionsThe volume measurement worked for both frozen and baked products, giving very good repeatability for replicate samples (0.0 in standard deviation). Size measurements could differ slightly depending on the set orientation of the 3-D graph after each measurement. The 3-D graphs displayed the variations
seen visually. In addition, the measurements showed that the production of the bake-off products gave relatively equal products; however, the differences increased during the baking and were dependent on the position within the oven.
ReferencesAACC International. Determination of Falling Number. Method 56-81.03.
AACC International. (2001), Guidelines for Measurements of Volume by Rapeseed Displacement. Method 10-05.01.
A R T I C L E S

- 1 3 -
AACC International. (2014), Determination of Bread Volme by Laser Topography: BVM Method. Method 10-14.01.
Bourne, M. C. (2002). Food Texture and Viscosity (2nd ed.): Academic Press.
Crosbie, G. B., & Ross, A. S. (Eds.), (2007).The RVA Handbook: AACC International Press
Heath, T. L. (Ed.), (1897).The Works of Archimedes: Cambridge University Press
A R T I C L E S

- 1 4 -
Applications of the Rapid Visco Analyser (RVA) in the Food Industry: a broader view
Introduction
The vast majority of cereal-based food matrices are systems resulting from cooking starch in excess water. Therefore, the study of the rheology during heating-cooling cycles could be interesting with a view to elucidating many useful indicators for quality assessment of final products and raw materials. The Rapid Visco Analyser (RVA) has been widely used and is well known for assessing the pasting properties of flour or starch. However, it is important to highlight its versatility due to its capability of analyzing the viscosity in heating-cooling cycles. These features also make it suitable for simulating step processes on a small scale under controlled conditions, as well as monitoring changes in the viscosity as the manufacturing process progresses. Therefore, the RVA can serve as a useful tool for elucidating multiple quality indicators which could help to optimize many different food step processes.
Importance of the measurement of viscosity in heating-cooling cyclesRheology is the study of the flow and deformation of materials. Generally, to measure rheological behavior, a controlled, well-defined deformation or strain is applied to a material over a given time and the resulting force response is measured (or vice versa) to give an indication of material parameters such as stiffness, modulus, viscosity, hardness, strength or toughness of the material. The general aims of rheological measurements are:
• to obtain a quantitative description of the material’s mechanical properties
• to obtain information related to the molecular structure and composition of the material
• to characterize and simulate the material’s performance during processing
• to attempt to predict final product quality.
A R T I C L E S
Controlled tests on well-defined small samples of food in the laboratory can be related to the larger, more complex multi-component situations found in practical processing conditions.
The main techniques used for measuring cereal properties have traditionally been divided into descriptive empirical techniques and fundamental measurements. In fundamental rheological tests the sample geometry is constant and well defined, the stress and strain states are controlled and uniform, and it is therefore possible to define any rheological parameters such as stress, strain, strain rate, modulus or viscosity. However, such fundamental tests require complex instrumentation (which is expensive), which is time consuming, difficult to maintain in an industrial environment and requires high levels of technical skill. In addition, often inappropriate deformation conditions and slip and edge effects during testing might hinder the interpretation of results. Meanwhile, empirical tests are easy to perform and are often used in practical factory situations, providing data that is useful in evaluating performance during processing and for quality control. The instruments are often robust and capable of withstanding demanding factory environments, and do not require highly skilled or technically trained personnel.
The vast majority of cereal-based food matrices are systems resulting from cooking starch in excess water. Moreover, they could also be composed of hydrocolloids, fibers and proteins. Therefore, the study of the rheology during heating-cooling cycles could be interesting. In order to analyze the rheology in such conditions, the combination of a container capable of stirring the ingredients under controlled temperature, the possibility of controlling the temperature and the heating-cooling rate as well as
Mario M. MartínezFood Technology Area, College of Agricultural Engineering, University of Valladolid, 34004 Palencia, [email protected]

- 1 5 -
A R T I C L E S
the applied shear stress could turn a viscometer into a powerful and versatile tool to elucidate viscosity indicators. Several specific examples of elucidating and characterizing viscosity indicators in heating-cooling cycles will be described in this paper. However, it is important to highlight that there are infinite applications of these devices regarding industrial processes and the type of product.
Indicators in cereal-based products
Rice qualityRice is mainly consumed as cooked rice. However there are also a number of products to which rice is added as an ingredient to improve their organoleptic properties. Rice can be mainly classified according to:
• the growing area: Indica or Japonica varieties• the size of the grain: long grain (> 6.6 mm),
medium grain (5.5–6.6 mm) and short grain (<5.5 mm)
• amylose content: waxy rice (0–5% amylose), very low (5–12%), low (12–20%), intermediate (20–25%), and high (25–33%) (Juliano, 1992). Added to that, amylose extended mutants known as ‘amylotype starches’ contains from 50 to 70% amylose (Kahraman & Köksel, 2013).
•The different grains will show different functional properties specially related to their different amylose content, and therefore to their degree of retrogradation. Moreover, retrogradation is related to the degree of stickiness of cooked grains, a crucial parameter in the culinary quality of the different grains. Typically, long grains show high Pasting Temperature (PT) and low Peak Viscosity (PV) as a consequence of their high amylose content. Nevertheless, some short grains present long grain properties. Therefore the length of the grain itself cannot be used to represent the functional properties of rice. Several analytical methods, such as amylose/amylopectin (AM/AP) ratio, hydration properties, damaged starch, differential scanning calorimetry (DSC), and crystalline polymorphism among others, have been used with the aim of characterizing the functional properties of rice. However, they are time consuming (AM/AP ratio), expensive
(crystalline polymorphism, DSC), or do not provide enough information. Taking into account that the compounds of milled rice flour are the same as those of rice grains, the measurement of the pasting properties (PP) of rice flour could be a quick and easy method for elucidating rice grain properties. Thus, the determination of the PP of rice with the RVA has been made an official method (61-02.01) by the American Association of Cereal Chemists International (AACCI). de la Hera, et al. (2013) characterized the PP of rice flours of different particle sizes from long and short rice grain varieties appreciating important differences among them.
Apparent viscosity of cake batters and quality of flour for cake makingCake batters can be considered a complex food system in which air is mechanically dispersed in a continuous liquid phase containing dissolved or suspended dry ingredients, such as sugar and flour. The incorporation of air cells during mixing generates a wet foam that is converted by baking into a solid foam (cake). The quality of cakes depends on the balanced formulae, aeration of cake batters, stability of fluid batters in the early stage of baking and thermal-setting stage. Starch represents the main ingredient acting in two ways: during batter mixing, starch with the other components of flour hinders fat coalescence by increasing the viscosity of the aqueous phase, while during baking starch is responsible for the transformation of an aqueous, fluid batter into a solid, porous cake structure. Therefore, the measurement of the apparent viscosity of the batter after mixing all the ingredients by the RVA can be an interesting indicator related to the quality of the final product. Apparent viscosity has been correlated with some quality attributes of cakes, such as volume and texture (Edoura-Gaena, et al., 2007, Turabi, et al., 2008).
One of the most crucial parameters in flour for cake making is the temperature of starch gelatinization, which has a strong influence on the expansion of air bubbles during the baking stage before the cake sets. In many cases, starch gelatinization is related to the PT assessed by the standard RVA method (mixing 3 g of flour into 25 mL of water). Kweon, et al. (2010) observed a better correlation between the pasting properties of flour dispersed in 50% sucrose solution

- 1 6 -
A R T I C L E S
with the final product than dispersed only in water. Therefore, it is important to note that, depending on the ingredients, the process and especially the desired indicators for the quality of the final product, optimizing the conditions of the RVA analysis could be an easy and effective way to improve the relevance of the data.
Interactions between starch and other compounds
Starch and flour are among the most widely used ingredients in the food industry. Besides being the key ingredients in bread and other bakery products, they are used as thickening agents in numerous dishes. These thickening properties are based on the capacity of starch granules to absorb water and swell. These events constitute the basis for the use of starch and flour in the preparation of fillings, sauces, creams and dairy desserts, and other products. However, occasionally the properties of native flours/starches are not suitable for their use in certain products and they must be modified or supplemented with other ingredients or additives, such as hydrocolloids, sugars and polyols, proteins or lipids.
The assessment of the viscosity over heating-cooling cycles by the RVA provided valuable information on the interactions between starch and hydrocolloids (Martínez, Macias, et al., 2015), sugar and polyols (Martínez, Pico, et al., 2015a) and fatty acids (Blazek, et al., 2011). The knowledge of these interactions could be the basis for optimizing food industrial processes and achieving final products with desired properties.
Extruded products and the measurement of the degree of cook
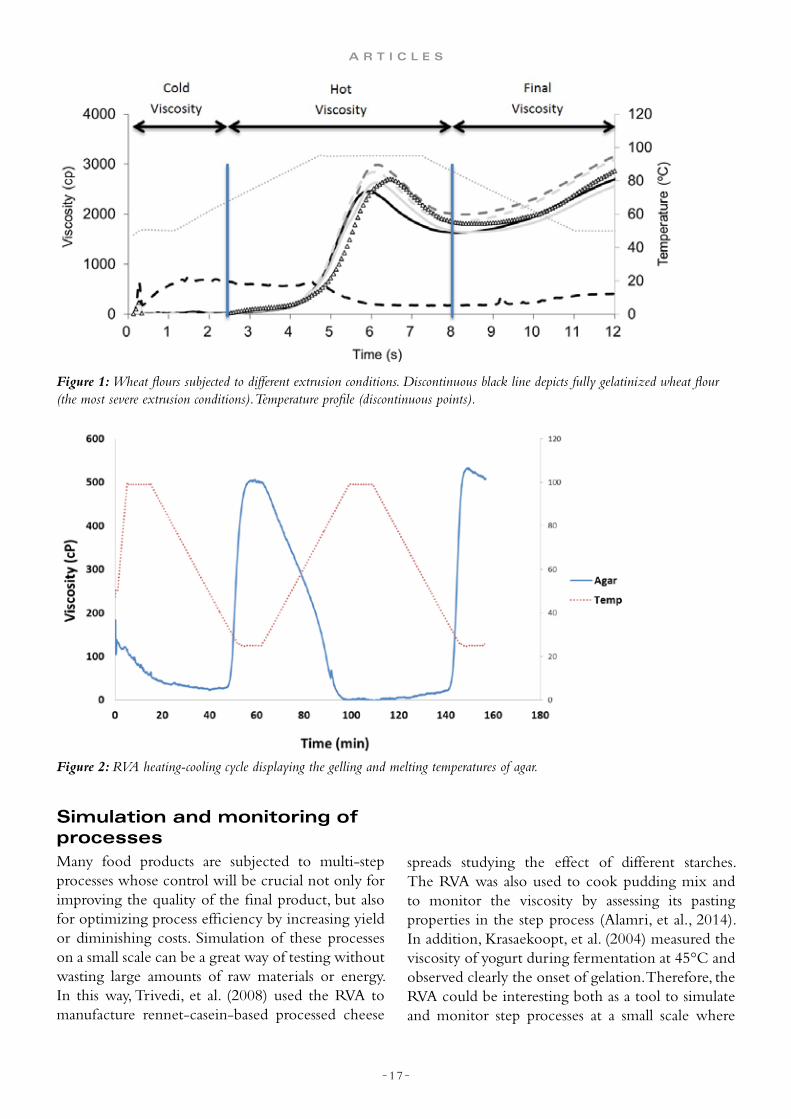
Extrusion is a high-temperature-short-time (HTST) physical treatment during which the ingredients are subjected to high temperatures and mechanical shear at relatively low levels of moisture. Extrusion allows starch gelatinization, denaturation of protein, microbial reduction, enzyme (in)activation and color changes, the extent of which are dependent on the conditions of the extrusion. Due to the fact that starch is fully or partially gelatinized, the curve
follows a different pattern and therefore should be interpreted according to the three sections displayed in Figure 1 (Whalen, 2007):1. Left section. This is the cold viscosity. Swelling
starch granules or products of high shear systems display elevated viscosities.
2. Middle section (transition products). The transition from the cold viscosity section to the middle section reflects raw features or less-cooked characteristics in a product.
3. Final viscosity (setback). This is the gel set of the cooked RVA sample and is the recombination of the starch in the sample.
These results could provide valuable viscosity indicators with a view to optimizing the extrusion process as well as the extrusion conditions as a function of the final utility of these flours. In fact, Martínez, Calviño, et al. (2014) and Martínez, Rosell, et al. (2014) characterized the cooking degree of wheat- and rice-extruded flours respectively. In addition, the quality or the cooking degree of final extruded products, such as textured vegetable proteins, ready-to-eat breakfast cereals and direct expanded and third generation snacks, could also be assessed by measuring the PP of their milled counterpart (Whalen, 2007). Therefore, the RVA could serve as a useful tool to characterize extruded products and their degree of cook.
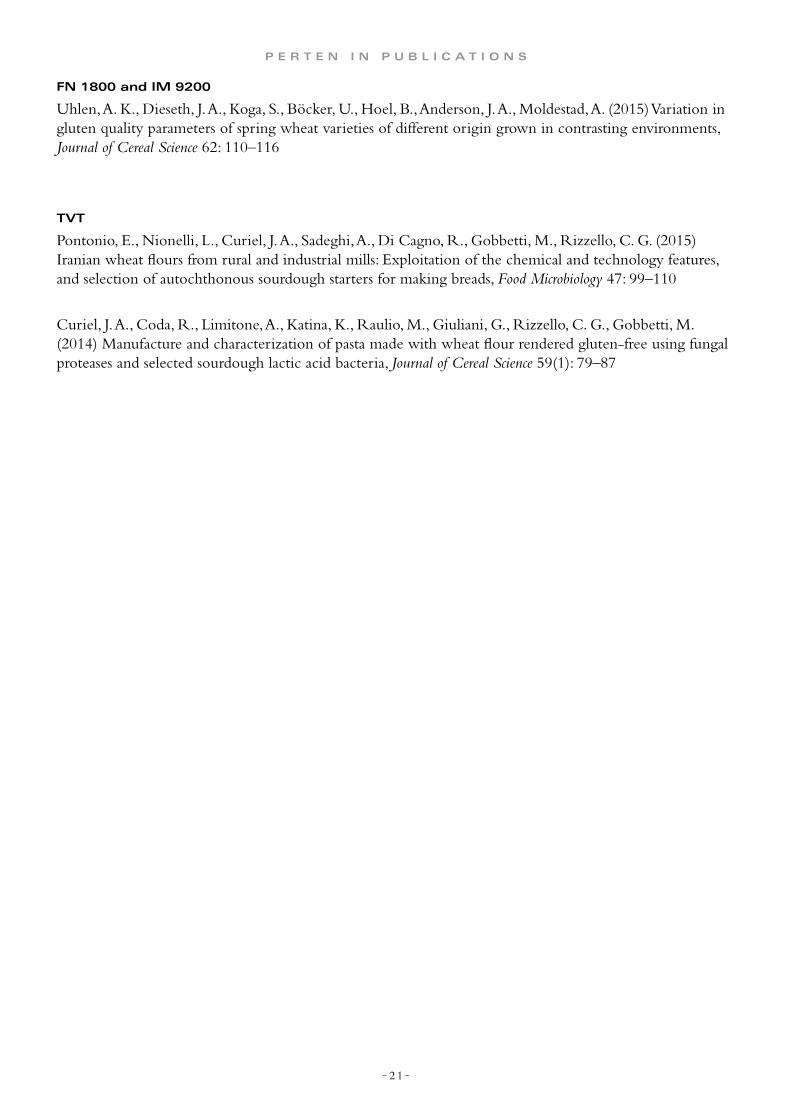
Quality indicators for hydrocolloids and fibers
Hydrocolloids are water soluble macromolecules of high molecular weight which, by binding a large quantity of water, modify the rheology of aqueous systems to which they are added. Their functionality depends on their molecular weight, monosaccharide distribution, degree of acetylation, substitution or esterification, and process conditions among others. Hydrocolloids such as agar have strong gelling properties, great water holding capacity and their gels are thermo-reversible. Two key quality parameters of agar are the gelling and melting temperatures, usually analyzed by traditional time-consuming methods (Freile-Pelegrín & Robledo, 1997). However, the proper selection of the RVA setting parameters, such as heating and cooling rate, could serve as a tool to analyze the gelling and melting temperature by assessing changes in the viscosity profile (Figure 2).
- 1 7 -
A R T I C L E S
spreads studying the effect of different starches. The RVA was also used to cook pudding mix and to monitor the viscosity by assessing its pasting properties in the step process (Alamri, et al., 2014). In addition, Krasaekoopt, et al. (2004) measured the viscosity of yogurt during fermentation at 45°C and observed clearly the onset of gelation. Therefore, the RVA could be interesting both as a tool to simulate and monitor step processes at a small scale where
Simulation and monitoring of processesMany food products are subjected to multi-step processes whose control will be crucial not only for improving the quality of the final product, but also for optimizing process efficiency by increasing yield or diminishing costs. Simulation of these processes on a small scale can be a great way of testing without wasting large amounts of raw materials or energy. In this way, Trivedi, et al. (2008) used the RVA to manufacture rennet-casein-based processed cheese
Figure 2: RVA heating-cooling cycle displaying the gelling and melting temperatures of agar.
Figure 1: Wheat flours subjected to different extrusion conditions. Discontinuous black line depicts fully gelatinized wheat flour (the most severe extrusion conditions). Temperature profile (discontinuous points).

- 1 8 -
variables such as mixing rate and the temperature profiles would be well controlled all through the step.
Enzymatic reactionsThe enzymatic hydrolysis of starch is one of the most important enzymatic reactions. Liquefaction is a key step in the starch hydrolysis process used to produce syrups, including those used in the industrial production of microbial fermentation products such as alcohol, organic acids, amino acids and antibiotics. Liquefaction is commonly achieved through the dispersion of insoluble starch granules in an aqueous solution, followed by partial hydrolysis at a relatively high temperature using thermostable α-amylases, which are endoglucanases that catalyze the hydrolysis of internal a-1,4-glycosidic linkages in starch. These reactions must be controlled and with that purpose several methods have been used. The degree of liquefaction is usually monitored by measuring the amount of reducing sugars of the starch hydrolysate and expressed as dextrose equivalent (DE), which is defined as the total reducing sugars expressed as dextrose and calculated as a percentage of the dry substance. However DE determination requires the use of chemical reagents and can be time consuming, thus alternative ways of process monitoring could be very useful.
Morphological and structural changes in starch granules during liquefaction give rise to variations in the viscosity of starch slurries as the reaction progresses. Changes in the viscosity as a function of time is an important indicator to monitor the enzymatic reactions (Li, et al., 2015). Besides assessing the viscosity, the RVA can also be used as a container in which enzymatic reactions can be carried out under controlled conditions of temperature and shear. In addition, the measurement of the pasting properties of flours modified by enzymatic amylolysis can provide useful indicators of not only flour functionality but also the degree of starch amylolysis (Martínez, Pico, et al., 2015b).
ConclusionsThe RVA has been widely used and is well known for assessing the pasting properties of flour or starch. It is important to highlight its versatility taking into
account that the measure of the viscosity in heating-cooling cycles can provide many useful indicators for quality assessment of final products and raw materials. In addition, its features make it suitable for simulating step processes at a small scale under controlled conditions, as well as monitoring changes in the viscosity as the manufacturing process progresses. Therefore, the RVA can serve as a versatile tool for elucidating multiple quality indicators which could help to optimize many different food processes.
ReferencesAlamri, M. S., Mohamed, A. A., & Hussain, S. (2014). High-fiber date pits pudding formulation, processing, and textural properties. European Foods Research and Technology, 239:(755-763).
Blazek, J., Gilbert, E. P., & Copeland, L. (2011). Effects of monoglycerides on pasting properties of wheat starch after repeated heating and cooling. Journal of Cereal Science, 54(1):(151-159).
de la Hera, E., Martinez, M., Oliete, B., & Gómez, M. (2013). Influence of flour particle size on quality of gluten-free rice cakes. Food and Bioprocess Technology, 6:(2280-2288).
Edoura-Gaena, R.-B., Allais, I., Trystram, G., & Gros, J.-B. (2007). Influence of aeration conditions on physical and sensory properties of aerated cake batter and biscuits. Journal of Food Engineering, 79(3):(1020-1032).
Freile-Pelegrín, Y., & Robledo, D. (1997). Influence of alkali treatment on agar from Gracilaria cornea from Yucatán, México. Journal of Applied Phycology, 9(6):(533-539).
Juliano, B. O. (1992). Structure chemistry and function of the rice grain and its fraction. Cereal Foods World, 37:(772-774).
Kahraman, K., & Köksel, H. (2013). Formation of resistant starch from amylotype corn starch and determination of the functional properties. Quality Assurance and Safety of Crops & Foods, 5(4):(295-302).
A R T I C L E S

- 1 9 -
Krasaekoopt, W., Bhandari, B., & Deeth, H. (2004). Comparison of Texture of Yogurt Made from Conventionally Treated Milk and UHT Milk Fortified with Low-heat Skim Milk Powder. Journal of Food Science, 69(6):(E276-E280).
Kweon, M., Slade, L., Levine, H., & Souza, E. (2010). Application of RVA and Time-Lapse Photography to Explore Effects of Extent of Chlorination, Milling Extraction Rate, and Particle-Size Reduction of Flour on Cake-Baking Functionality. Cereal Chemistry, 87(5):(409-414).
Li, Z., Liu, W., Gu, Z., Li, C., & Hong, Y. (2015). The effect of starch concentration on the gelatinization and liquefaction of corn starch. Food Hydrocolloids, 48:(189-196).
Martínez, M. M., Calviño, A., Rosell, C. M., & Gómez, M. (2014). Effect of Different Extrusion Treatments and Particle Size Distribution on the Physicochemical Properties of Rice Flour. Food Bioprocess technology, 7(9):(2657-2665).
Martínez, M. M., Macias, A. K., Belorio, M. L., & Gómez, M. (2015). Influence of marine hydrocolloids on extruded and native wheat flour pastes and gels. Food Hydrocolloids, 43:(172-179).
Martínez, M. M., Pico, J., & Gómez, M. (2015a). Effect of different polyols on wheat and maize starches paste and gel properties. Food Hydrocolloids, 44:(81-85).
Martínez, M. M., Pico, J., & Gómez, M. (2015b). Physicochemical modification of native and extruded wheat flours by enzymatic amylolysis. Food Chemistry, 167(1):(447-453).
Martínez, M. M., Rosell, C. M., & Gómez, M. (2014). Modification of wheat flour functionality and digestibility through different extrusion conditions. Journal of Food Engineering, 143(1):(74-79).
Trivedi, D., Bennett, R. J., Hemar, Y., Reid, D. C. W., Lee, S. K., & Illingworth, D. (2008). Effect of different starches on rheological and microstructural properties of (I) model processed cheese. International Journal of Food Science and Technology, 43:(2191-2196).
Turabi, E., Sumnu, G., & Sahin, S. (2008). Rheological properties and quality of rice cakes formulated with different gums and an emulsifier blend. Food Hydrocolloids, 22(2):(305-312).
Whalen, P. J. (2007). Extruded Products and Degree of Cook. In G. B. Crosbie and A. S. Ross (Eds.), The RVA Handbook: AACC International Press.

- 2 0 -
P E R T E N I N P U B L I C A T I O N S
BVM
Steffolani, E., Martinez, M. M., León, A. E., Gómez, M. (2015) Effect of pre-hydration of chia (Salvia hispanica L.), seeds and flour on the quality of wheat flour breads, LWT – Food Science and Technology 61(2): 401–406
Bae, W., Lee, B., Hou, G. G., Lee, S.(2014) Physicochemical characterization of whole-grain wheat flour in a frozen dough system for bake off technology, Journal of Cereal Science 60(3): 520–525
De la Hera, E., Rosell, C. M., Gomez, M. (2014) Effect of water content and flour particle size on gluten-free bread quality and digestibility, Food Chemistry 151: 526-531
Ronda, F., Quilez, J., Pando, V., Roos, Y. H. (2014) Fermentation time and fiber effects on recrystallization of starch components and staling of bread from frozen part-baked bread, Journal of Food Engineering 131: 116–123
Gómez, M., Talegón, M., De la Hera, E. (2013) Influence of mixing on quality of Gluten-free bread, Journal of Food Quality 36(2): 139–145
DA 7000 and 7200
Sánchez, M.-T., Torres, I., De la Haba, A.-J., Pérez-Marín, D. (2014) First steps to predicting pulp color in whole melons using near-infrared reflectance spectroscopy, Biosystems Engineering 123: 12–18
Zhao, H., Guo, B., Wei, Y., Zhang, B. (2014) Effects of grown origin, genotype, harvest year, and their interactions of wheat kernels on near infrared spectral fingerprints for geographical traceability, Food Chemistry 152: 316–322
RVA
da Silva, F.L., Ferreira, H. A. L., de Souza, A. B., de Freitas Almeida, D., Stephani, R., Pirozi, M. R., de Carvalho, A., F., Perrone, I. T. (2015) Production of Dulce de Leche: The effect of starch addition, LWT – Food Science and Technology 62(1): 417–423
Guelpa, A., Bevilacqua, M., Marini, F., O´Kennedy, K., Geladi, P., Manley, M. (2015) Application of Rapid Visco Analyser (RVA) viscograms and chemometrics for maize hardness characterisation, Food Chemistry 173: 1220–1227
Inglett, G. E., Chen, D., Liu, S. X. (2015) Physical properties of gluten-free sugar cookies made from amaranth-oat composites, LWT – Food Science and Technology (In Press)
Waterschoot, J., Gomand, S. V., Willebrords, J. K., Fierens, E., Delcour, J. A. (2014) Pasting properties of blends of potato, rice and maize starches, Food Hydrocolloids 41: 298–308
- 2 1 -
FN 1800 and IM 9200
Uhlen, A. K., Dieseth, J. A., Koga, S., Böcker, U., Hoel, B., Anderson, J. A., Moldestad, A. (2015) Variation in gluten quality parameters of spring wheat varieties of different origin grown in contrasting environments, Journal of Cereal Science 62: 110–116
TVT
Pontonio, E., Nionelli, L., Curiel, J. A., Sadeghi, A., Di Cagno, R., Gobbetti, M., Rizzello, C. G. (2015) Iranian wheat flours from rural and industrial mills: Exploitation of the chemical and technology features, and selection of autochthonous sourdough starters for making breads, Food Microbiology 47: 99–110
Curiel, J. A., Coda, R., Limitone, A., Katina, K., Raulio, M., Giuliani, G., Rizzello, C. G., Gobbetti, M. (2014) Manufacture and characterization of pasta made with wheat flour rendered gluten-free using fungal proteases and selected sourdough lactic acid bacteria, Journal of Cereal Science 59(1): 79–87
P E R T E N I N P U B L I C A T I O N S

C A L E N D A R
Come and see Perten Instruments products and meet Perten Instruments representatives.
Joint ICC/AISTEC Conference at the World Expo Milan 2015: Milan, Italy, July 1–3, www.expo2015.icc.or.at/home
Nordic Cereal Congress 2015: Helsingfors, Finland, September 7–9, www.svs.fi/nordic-cereal-congress-2015/
65th Australian Grain Science Conference: Sydney, Australia, September 16–18, www.ausgrainscience.org.au/conference/
9th NIZO Dairy Conference: Milk Protein Functionality:
Papendal, The Netherlands, September 30 – October 2, www.nizodairyconference.com
www.perten.com