Embed Size (px)
Citation preview

Pest risk analysis and environmental sustainability reportingFrank H. KochUSDA Forest Service, Southern Research Station, Research Triangle Park, NC USA
13th Meeting of the International Pest Risk Research Group3-6 September 2019, Poznań, Poland

Forest Sustainability Reporting in the United States

Montréal Process Criteria and Indicators (MP C& I) Seven criteria
1. Conservation of biological diversity2. Maintenance of productive capacity of forest ecosystems3. Maintenance of ecosystem health and vitality4. Conservation and maintenance of soil and water resources5. Maintenance of forest contribution to global carbon cycles6. Maintenance and enhancement of long-term multiple socioeconomic
benefits to meet the needs of societies7. Legal, institutional, and economic framework for forest conservation and
sustainable management
64 indicators distributed among these criteria

Criterion 3: Maintenance of Ecosystem Health and Vitality Two indicators
3.15: Area and percent of forest affected by biotic processes
3.16: Area and percent of forest affected by abiotic processes
Last year, I became the USDA Forest Service lead for Criterion 3 and its indicators

What Does This Entail?
Actually, involves many data sets I already use Statistical and geospatial
Or at least can be summarized regionally
Associations with forest pest risk Predisposing factors (e.g., drought) Interacting factors (e.g., fire) Areas of damage / mortality
Recently, emphasis on long-term trends

Drought Another responsibility:
drought reporting for Forest Health Monitoring (FHM) Program
MDZ = moisture difference z-score Drought index based on long-
term moisture history Useful for different time
windows 3-year or 5-year windows for
forest systems

Drought
National and regional trends in 5-year MDZ
100 years: 1918-2017
Wildland Fire: Long-Term National Trends
Data from National Interagency Fire Center (NIFC)

Wildland Fire
National and regional trends, 1984-2016
Monitoring Trends in Burn Severity (MTBS) data
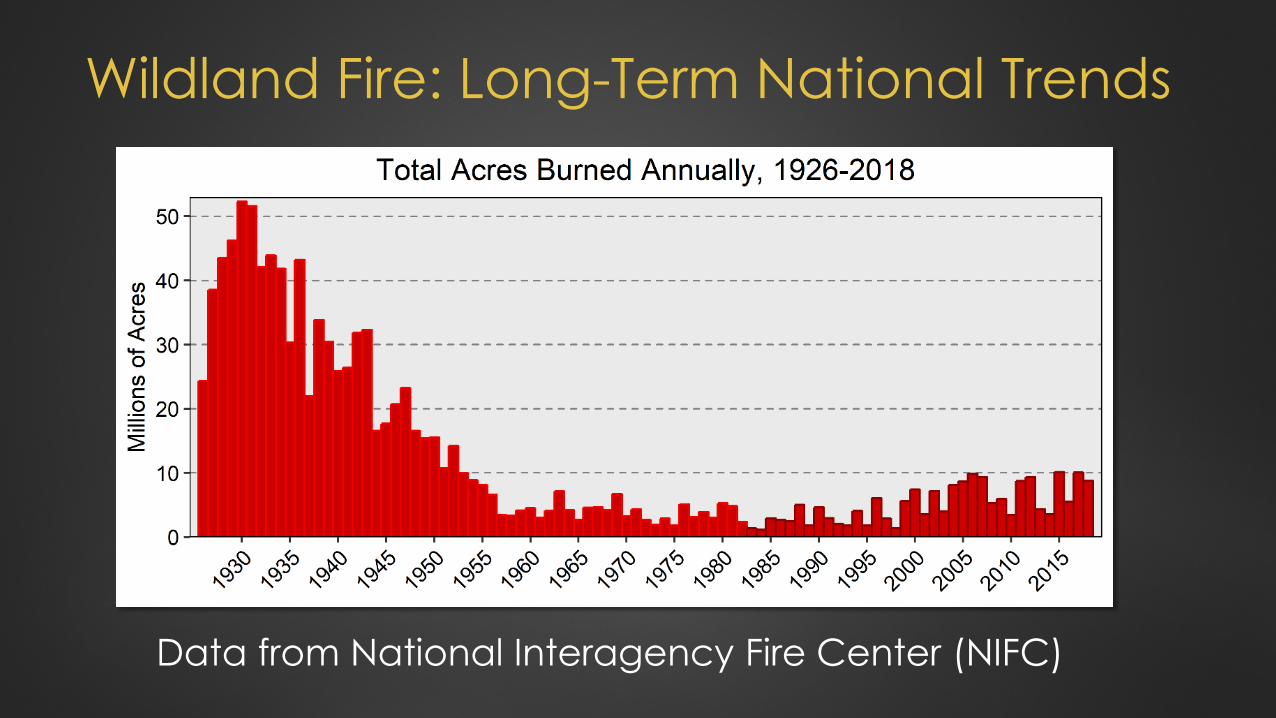
Areas of Forest Mortality Due to Abiotic Causes Documented in
aerial survey data Collected by
individual states Compiled by USDA-
FS Forest Health Protection

Counties with Forest Mortality Due to Abiotic Causes
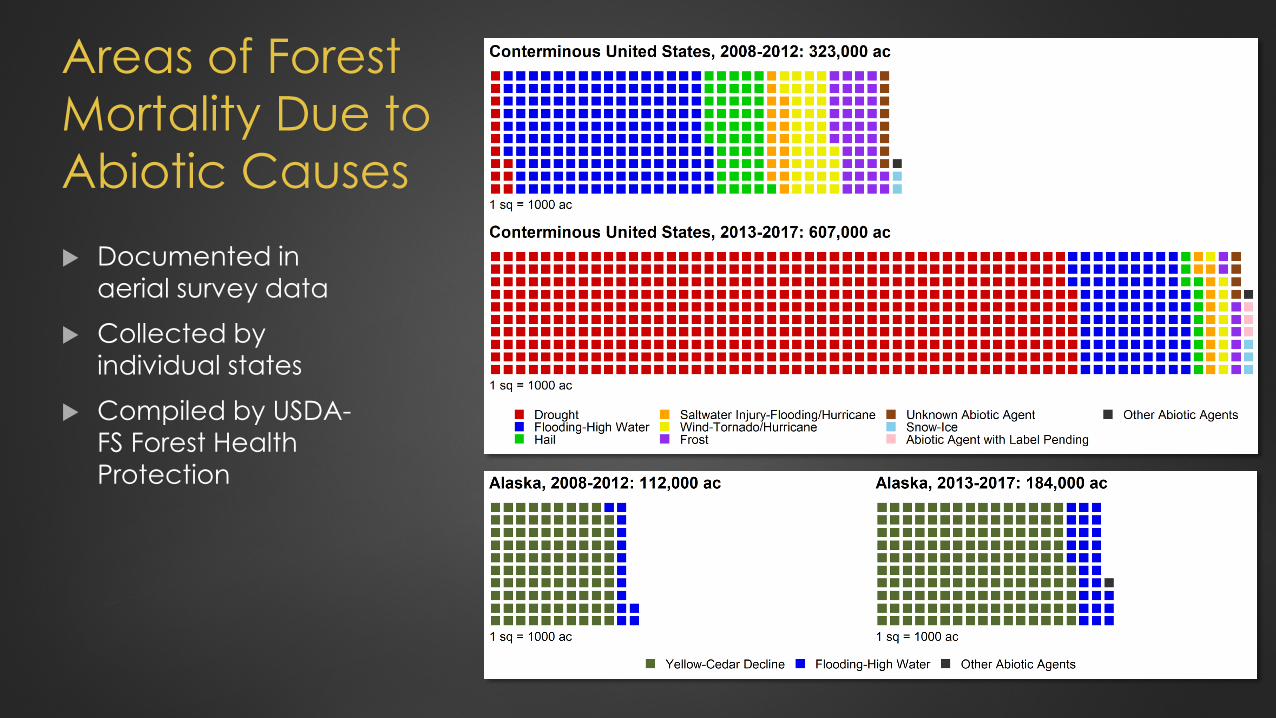
Mortality Due to Biotic Agents
As documented in aerial survey data
Totals for conterminous USA, 1997-2017

Mortality Due to Biotic Agents
As documented in aerial survey data
Totals for conterminous USA, 1997-2017

Plant Invasion Intensity
Proportion of invaded subplots
Forest Inventory and Analysis (FIA) dataNational forest
inventory for USA
From Oswalt et al. 2015. NeoBiota 24: 49-54

As We Move Into
Synergies between sustainability reporting and pest risk analysis/research
Although working on forest health aspect of forest sustainability…
…obvious parallels with crop health and sustainability of agricultural systems

Some Questions to Stimulate Discussion
Do you work on sustainability reporting? If not, do you know someone at your agency/
institution who does? How about someone at a different
agency/institution?

Some Questions to Stimulate Discussion
Do you use data that are, or could be, used for sustainability reporting? Pest distribution data? Host data? Data on related factors (e.g., drought)? How do you share your data?

Some Questions to Stimulate Discussion
Any ideas for partnerships/collaboration? Regionally? Nationally? Internationally?