Embed Size (px)
Citation preview

Louisiana State UniversityLSU Digital Commons
LSU Historical Dissertations and Theses Graduate School
1970
Pesticidal Residue Alterations in Potatoes DuringProcessing.James Michael SolarLouisiana State University and Agricultural & Mechanical College
Follow this and additional works at: https://digitalcommons.lsu.edu/gradschool_disstheses
This Dissertation is brought to you for free and open access by the Graduate School at LSU Digital Commons. It has been accepted for inclusion inLSU Historical Dissertations and Theses by an authorized administrator of LSU Digital Commons. For more information, please [email protected].
Recommended CitationSolar, James Michael, "Pesticidal Residue Alterations in Potatoes During Processing." (1970). LSU Historical Dissertations and Theses.1812.https://digitalcommons.lsu.edu/gradschool_disstheses/1812

71-3444
SOLAR, James Michael, 1943-PESTICIDAL RESIDUE ALTERATIONS IN POTATOES DURING PROCESSING.
The Louisiana State University and Agricultural and Mechanical College, Ph.D., 1970 Food Technology
University Microfilms, Inc., Ann Arbor, Michigan
THIS DISSERTATION HAS BEEN MICROFILMED EXACTLY AS RECEIVED

Pesticidal Residue Alterations
in Potatoes
During Processing
A Dissertation
Submitted to the Graduate Faculty of the Louisiana State University and
Agricultural and Mechanical College in partial fulfillment of the
requirements for the degree of Doctor of Philosophy
in
The Department of Food Science
byJames Michael Solar
•S., Southeastern Louisiana College, 1965 M.S., Louisiana State University, 1968
May, 1970

ACKNOWLEDGEMENT
The author wishes to express his gratitude to Dr. Joseph A. Liuzzo
for the advice and guidance during the course of this investigation.
He is grateful to Dr. A. F. Novak, Head of the Department of Food
Science, for the opportunity to perform this research in the Department.
He wishes to express his appreciation to Miss Frances Bonner of the
Harry D. Wilson Feed and Fertilizer Laboratories for technical
assistance.
Appreciation is expressed to Humble Oil and Refining Company
and especially to Mr. J. Trigg Wood and Mr. Louis L. Hines for
allowing the author to earn part of his expenses incurred during his
graduate tenure.
Above all, he wishes to acknowledge the constant encouragement
offered by his parents that made this study a success.

Page
ii
iv
v
vi13
3
1019
19
19
19
23
25
27
29
31
49
51
55
75
76
TABLE OF CONTENTS
ACKNOWLEDGMENT.....................
LIST OF TABLES.....................
LIST OF FIGURES ...................
ABSTRACT...........................
INTRODUCTION.......................
REVIEW OF LITERATURE...............♦
A. Detection Methods ............
B. Pesticidal Residues in Foods. .
MATERIALS AND METHODS ............
A. Samples .......................
B. Sample Preparation............
C. Dosimetry .....................
D. Extraction of Pesticide Residues
E. Florisil Column ...............
F. Gas-liquid Chromatography . . .
G. Thin-layer Chromatography . . .
RESULTS AND DISCUSSION ..........
SUMMARY ...........................BIBLIOGRAPHY.......................
APPENDIX .........................
V I T A .............................
APPROVAL SHEET ...................
iii

LIST OF TABLES
Tables Page
1 Average Quantity of Pesticidal Residues in TwoPotato Types in Nonprocessed Potatoes .................... 32
2 Average Quantity of Pesticidal Residues inIrradiated and Nonirradiated, Nonprocessed Potatoes . . . 34
3 Average Quantity of Pesticidal Residues ThroughoutThree Storage Periods ....................... . . . . . . 36
4 Average Quantity of Pesticidal Residues in ProcessedIrish and Sweet Potatoes.............................. 38
5 Average Quantity of Pesticidal Residues fromIrradiation of Processed Irish and Sweet Potatoes . . . . 41
6 Average Quantity of Pesticidal Residues as a Resultof Two Different Processing Applications. ................ 43
7 Average Quantities of Pesticidal Residues in HeatProcessed Potatoes, With and Without Water........... 45
8 Average Quantity of Pesticidal Residues in Frozen,Blanched and Unblanched Potatoes......................47
iv

LIST OF FIGURES
Figure Page
1 Experimental Design for Storage and Processing ofPotatoes................................................ 20
2 Relationship of Absorbance vs. Time for FiveDifferent Positions in the Irradiation Chamber........ 22
3 Flow Diagram for Extraction and Detection ofPesticide Residues...................................... 24
4 Gas Chromatograph Operating Conditions ................. 28
v

ABSTRACT
Irish and sweet potatoes were spiked with 100 ppm endrin. One-
half of the samples were irradiated and all were processed with one
of four processing methods (heat processing, with and without water
and frozen, blanched and unblanched). Samples were stored 0, 6 and
12 weeks. Analysis detected three pesticidal ,-esidues: aldrin,
heptachlor epoxide and endrin.
In the control, heptachlor epoxide was significantly greater in
Irish potatoes; aldrin was significantly greater in sweet potatoes.
There was no difference in the endrin content. There was a signifi
cant decrease of aldrin and heptachlor epoxide with irradiation of
the control; endrin was not affected.
Aldrin residues were the only ones of the three to be signifi
cantly decreased with storage. Irradiation of processed potatoes did
not significantly decrease the quantities of any of the pesticidal
residues in the samples.
Processing significantly decreased all of the pesticidal resi
dues. Endrin residues were significantly decreased with heat pro
cessing. Endrin was also decreased with a combination of blanching
and freezing. Aldrin was altered primarily with blanching and
freezing and to a lesser extent by heat processing without water.
Heptachlor epoxide was equally affected by each of the processing
methods.
vi

INTRODUCTION
Man is constantly protecting his food supply against weeds,
insects, plant diseases and rodents. Billions of dollars worth of
growing crops are lost to these enemies annually. Rodents, insects
and molds cause annual losses of 33 million tons of stored grain and
rice throughout the world, according to estimates of the United Nations
Food and Agriculture Organization. Th', is a year's supply of food
for 150 million people. Losses of stored grain in the United States
alone are estimated at 18 million tons.
To be effective as a control agent, a chemical pesticide must
first of all be toxic. Only after many years was it recognized that
the chemical itself must also be one that could be used without being
harmful to man. The first use of toxic chemicals was to kill insects;
thus the term "insecticide" has to a greater or lesser degree been
applied to all materials used as control agents. The Federal
Insecticide Act of 1910 includes both insecticides and fungicides.
The Federal Insecticide, Fungicide and Rodenticide Act (1947) uses
the term "economic poison" to apply to all three groups, and in
addition includes herbicides. The term "pesticide" is now officially
used to cover all toxic chemicals, whether used to combat insects,
fungi, weeds or rodents and other specified animals.
The trend toward the safer use of insecticides and concern for
public health began about 1925. It was started in 1919 by the embargo
of a shipment of western pears. Illness had been reported in England
as being caused by eating apples from the United States. To meet this

difficulty, the Federal Food and Drug Administration ruled in 1927 that
fruit in interstate shipments should not show more than 0.025 grain of
arsenic trioxide per pound of fruit (3.57 ppm). The Federal Insecticide,
Fungicide and Rodenticide Act of 1947 made state officials and manu
facturers aware of the residues and promoted greater care in the
handling and use of the dangerous compounds.
In 1954 the Federal Food, Drug and Cosmetic Act was ammended to
provide methods for controlling the amount of residues of pesticides
on raw agricultural products.
Many common food products contain some pesticidal residues. It
was the intent of this study to investigate the effects of various
processing methods and gamma irradiation on the quantity of the
residual pesticides in sweet and Irish potatoes.

REVIEW OF LITERATURE
Detection Methods
Coffin and McKinley (1963) developed a method for the separation
and identification of six common pesticide residues found in some fruit
and vegetable crops. The residues were: O-ethyl-O-p-nitrophenyl
benzene thiophosphonate (EPN), methyl parathion, parathion, EPN oxon,
methyl paraoxon and paraoxon. In their work, these investigators used
lettuce, strawberries and apples that had been spiked with the pesti
cides. They found that the pesticides could be effectively separated
and detected by means of two-paper chromatographic systems. Detection
was effected with an alkali spray and heat. The investigators were
able to detect residues in amounts as low as 1 ug.
Infrared spectroscopy as a rapid nondestructive analytical tool
has been found to have a great potential in residue analysis. Susi
and Rector (1958) were able to quantitate chlorinated residues with
infrared techniques. Blinn and Gunther (1962, 1962a, 1963) published
the infrared spectrum from 2 to 25 microns of 67 pesticides.
Using wave-lengths from 2 to 35 microns, Morris and Haenni (1963)
were able to characterize 24 common pesticides. They assigned
structures to many of the pesticides by using published spectra-
structure correlations.
Payne and Cox (1966) believe that infrared spectroscopy is the
best method for unequivocal identification of trace quantities of
organic compounds. They compared infrared spectroscopy to such
methods as nuclear magnetic resonance, mass spectroscopy, gas-liquid
chromatography and thin-layer chromatography. The investigators

found that some pesticides often have very similar retention times,
which would make resolution and identification with gas-liquid chroma
tography impossible. By developing a micro-infrared analytical pro
cedure, they were able to detect the presence and identify several
pesticide residues. This would have been impossible with any other
technique.
Blinn (1963) combined two methods for the isolation and identi
fication of Thimet residues in potatoes. He was able to separate and
purify the pesticides with thin-layer chromatography. After the resi
dues had separated on the plates, they were scraped and prepared for
micro-analysis with infrared spectrophotometry. His results of
detecting extremely small amounts of residues concurred with those of
Coffin and McKinley (1963), Payne and Cox (1966) and Morris and
Haenni (1963).
Determination of chlorinated pesticide residues by thin-layer
chromatography without prior cleanup was developed by Morley and
Chiba (1964). It was their aim, with thin-layer chromatography to use
it as a cleanup method prior to analysis by gas-liquid chromatography.
Secondly, they used it as a rapid screening method for the qualitative
and semi-quantitative analysis of pesticide residues. The investi
gators used the residues of o,p-DDT, p,p'-DDT, and p,p'-DDE. Their
conclusions were that the pesticides were clearly separated with no
loss observed. The lower limit of detectibility of the DDT isomers
was 0.2 ppm; for DDE, 0.1 ppm. When they spiked apples and lettuce
with heptachlor, the researchers were able to detect amounts as low
as 0.05 ppm with 90% recovery of the pesticide. The authors found

that gas chromatography with an electron capture detector was more
sensitive for detection of absolute amounts than thin-layer chroma
tography. However, in practice a similar order of sensitivity was
often achieved, since 1 ml. of extract, equivalent to 0.5 - 5.0 g. of
original material, could "be spotted. In gas-liquid chromatography
some sort of cleanup is generally required to obtain best results, this
can be effected with thin— layer chromatography.
Beasley and Ziegler (1970) developed a method for pesticide
residue analysis cleanup using silicic acid-glass fiber sheets. They
found this method to he more efficient than the florisil column of
thin— layer chromatography . Thin-layer plates had too low a capacity,
especially when the pesticide concentration was low, or when a large
amount of extraneous material was present. The experimental procedure
consisted of fortifying 100 g. portions of chopped spinach with 0.1
ppm of (a) aldrin (b) heptachlor epoxide, (c) dieldrin, (d) endrin,
Ce) lindane, and (f) p,p’—DDT. Comparisons between the florisil
column cleanup and silicic acid-glass fiber sheets were made. The
sheets were a commercial preparation trademarked ChromAR Sheet
(Mallinckxodt). These workers concluded that the ChromAR Sheet method
was more effective in. pesticide residue analysis cleanup than the
florisil column cleanup method. They have requested that the FDA
accept tbis simplified procedure.
The pesticide GC-9160 (1, 3,4-metheno-lH-cyelobuta(cd) pentalene-*2-levulinic acid, 1, la,3 ,3a,4,5,5 ,5a,5b,6 decachloro-actahydro-2-
bydroxy, ethyl) produced by Allied Chemical was one of the new Kepone
derivatives that showed promise in controlling flea beetles, mites,

and bud worms. Westlake et al. (1970) found the pesticide could not
be detected by electron capture gas chromatography. They found, how
ever, that it could be converted to Kepone which was easily detectable.
As a source of the pesticide the workers used lettuce, cabbage and
citrus fruits. Two different gas chromatographic detection systems
were used (electron capture and electron conductivity). The results
indicated the electron conductivity detector consistently gave slightly
higher recoveries. They felt this was due to lack of background inter
ference associated with the electron conductivity detector.
Burke and Holswade (1964) surveyed 87 chlorinated and 26 thio
pesticide chemicals. Their field of interest was the improvement of
detection of pesticidal residues. Their method of evaluation utilized
a microcoulometric detector (MCGC), which is a multiple detection
system. They found with the MCGC specificity of the detector for Cl-,
Br", and 1“ or sulfur was the instruments' greatest virtue. Maximum
sensitivity depended on two factors: 1) the smoothness with which the
particular MCGC operated, and 2) the extent of sample cleanup. The
investigators concluded that levels that could be measured depended on
the type of pesticide and food product in question, but that 0.01 ppm
is the general level for maximum sensitivity. At extremely lower
levels reductions in both quantitative and qualitative accuracy were
noted.
Guiffrida and Ives (1964) simultaneously used different detection
systems to detect organophosphate pesticide residues in various crops.
The effluent from one column was divided evenly between two detectors
to obtain dual analysis. A sodium thermionic detector, highly

sensitive to phosphorus compounds, was used to give quantitative
recovery data. A flame ionization detector was used to determine the
efficiency of the cleanup. The pesticides Diazion, malathion,
parathion, Trithon and DDT were used in the investigation. With the
sodium thermionic detector they were able to detect residues at levels
as low as 0.1 ppm. Paper chromatographic techniques were employed for
confirmation of the pesticides tested.
Ives and Guiffrida (1967) continued the work in the development
of thermionic detection systems (TD). Samples consisted of triphenyl
derivatives of group V (a) elements. Results indicated that therm
ionic response to group V (a) elements in organic compounds depended
on the salt cation used in the TD. The workers concluded that therm
ionic detection of organonitrogen compounds promises to help fill the
need for a sensitive nitrogen detector. They found it especially
useful for compounds containing several nitrogen atoms.
Watts and Klein (1962) constructed and modified the electron
capture detector described by Lovelock and Lipsky (1960). They found
one design that yielded a nearly linear relationship between amount
of pesticide injected and the peak area response. The researchers
felt the results clearly demonstrated that the use of an electron
capture detector cell with conventional gas chromatography permitted
the detection of chlorinated pesticides in amounts far below those
detectable by colorimetric or paper chromatographic techniques. The
electron capture technique was able to measure as little as 0.0001 ug.
levels of chlorinated pesticides with accuracy, whereas the other
methods required larger amounts. They noted that since so little of
the final sample solution was required for analysis, many duplicate
check runs could be conducted on the same sample solution.
Schmit et al. (1963) used tomatoes and tomato products as a source
of pesticide residues to develop a rapid method for their determination.
They homogenized the tomatoes with hexane, then slurried the extract
with silicic acid. The slurry was put into a sintered glass funnel and
the pesticidal residues were eluted with hexane. At this point, after
concentration, the solution was ready to inject into the gas-liquid
chromatograph. The method of Beasley and Ziegler (1970) compared
favorably to that of Schmit el al. (1963). Both used silicic acid as
the adsorbant, which allowed for elimination of the florisil column
cleanup step. The results that each obtained coincided completely.
Both groups of authors agreed that cleanups would be more efficient,
yeilding greater recoveries, if the FDA would approve this method over
the florisil column cleanup method.
Langois et al. (1964) reported that the development of the elec
tron capture detector by Lovelock and Lipsky (1960) gave the chemist
a valuable tool for detection of trace amounts of chlorinated insecti
cide residues. Using the electron capture detector, Langois et al.
(1964) developed a rapid cleanup of dairy products for analysis of
chlorinated insecticide residues. Butter, cheese, dried milk, cream,
evaporated milk and whole milk were used in the experimentation. Each
of these dairy products were spiked with DDT, lindane, heptachlor,
dieldrin and endrin. The rapid cleanup method consisted of grinding
the dairy product with the pesticides in florisil. The florisil was
placed into a column auu was elutid with 20% methylene chloride in

petroleum ether. The eluants obtained were pure enough to be injected
into the gas-liquid chromatograph. This method was a major breakthrough
in pesticide residue cleanup of dairy products. Previous to this time
all of the fats had to be saponified, which limited the quantity of
samples that could be analyzed per day and the amount of residues that
could be recovered.
Using a gas-liquid chromatograph with an electron capture detector,
Glotfelty and Caro (1970) were able to detect artifacts of the insecti
cide dieldrin. They found two artifacts in the green leaves of alfalfa,
wheat, corn, kale, clover, but not in soil, water or nongreen plant
parts. They found that the substances were extracted along with
dieldrin in the usual cleanup procedure. When the extract was injected
into a gas-liquid chromatograph a completely symmetrical "dieldrin"
peak with no base-line broadening was produced. The artifacts were
completely disguised. With the artifacts appearing in the dieldrin
peak, quantitation was impossible. They developed two methods to
remove the artifacts from the dieldrin extract. Thin-layer chroma
tography with unactivated silica gel was found to be effective in
removing the artifacts. Saponification with KOH as a part of the
cleanup procedure completely destroyed the artifacts. This procedure
was the only completely satisfactory cleanup procedure for dieldrin.
This method gave excellent cleanup and permitted correct identification
and quantitation of dieldrin residues at levels of 0.01 ppm or above.
The researchers also were able to tentatively identify the artifacts
as nonhalogenated, pigment related natural products found only in
photosynthetic tissue. Positive identification was not made, because
the compounds were not stable when isolated.

10
Pesticidal Residues in Foods
Gannon et a3 . (1959) studied the storage of dieldrin in tissues
of cattle and its excretion in milk. They stated that the chlorinated
hydrocarbon insecticides have long been known to be stored in animal
fat to varying degrees. The extent of the usage of these insecticides
on forage crops depends greatly on their propensity for storage in
fat and/or their excretion in milk. A few insecticides have been
assigned tolerances in the fat of certain animals, but to date (1959)
regulatory agencies have tended to maintain that milk is not to be
contaminated by pesticides or other substances.
Some research has been done by Claborn and Wells (1952), Ely et al.
(1954) and Harris et al. (1956) which indicated that dieldrin was
excreted in milk at fairly high levels when cows were sprayed or fed
at fairly high dosage rates.
The study of Gannon et al. (1959) was initiated to determine
whether or not there was a level of feeding below which contamination
of fat, and especially milk of dairy cows would not occur. The cows
in the study were first on a control diet that contained no pesticides.
Before the cows were put on a dieldrin diet, both the rations and the
milk samples were analyzed to insure they contained no dieldrin resi
dues. Once this was assured the cows were fed dieldrin at levels of
0.1, 0.25, 0.75, and 2.25 ppm for 12 weeks. Measurements of dieldrin
levels were performed for 18 weeks after the feeding study had begun.
At the end of the 12 week period, dieldrin was present in the milk in
measurable quantities at all levels of feeding. The workers found a
direct relationship between the fatness of the animal and the amount
of dieldrin appearing in the milk. The same was found for the amounts
of dieldrin stored in the fat.
Steaks and roasts from cows which had been fed high dosages of
dielrin were cooked and compared for dieldrin content with similar raw
cuts. No significant losses of dieldrin due to cooking were evident.
Henderson and Crosby (1968) investigated methods of photodecom
position of dieldrin residues in water. They fortified water samples
with dieldrin and stored the sample in sunlight for three months.
Other samples were stored in the dark to serve as controls. The
investigators found that 1/3 of the dieldrin had been decomposed in the
samples stored in sunlight. Further investigation, however, revealed
that a photoisomer had been produced in its place and was detectable
with gas-liquid chromatography. In the control samples no isomers
were produced.
Changes in pesticides in canned spinach were studied by Farrow
et al. (1966). Using chromatographic procedures for the analysis of
pesticide residues in various canned foods, the authors occasionally
observed traces of TDE. The investigators suspected that this com
pound resulted from DDT breakdown during processing or storage of
canned products, since DDT could be present as a legal residue.
Canned spinach from a local market was used in the experimentation.
Initial analysis indicated the presence of p,p'-TDE. DDT was added to
the spinach and then it was recanned, simulating commercial processing
conditions. Qualitative and quantitative determinations were per
formed to confirm the validity of the conversion of p,p'-DDT to
p,p’TDE. Results showed that both p,p'-DDT and p,p'-TDE were present
12
in all samples. The DDT losses ranged from 10 to 20% and TDE increased
in proportional amounts.
Saha et a]L. (1970) spiked rapeseed flakes with lindane- and
DDT- The rapeseed was processed in the laboratory simulating
actual commercial conditions. Six stages (cooking and oil extraction,
desolventization, refining, bleaching and deodorization) of processing
were performed on the product. After each stage, sample aliquots were
taken and analyzed with a scintillation detector.
Labeled compounds were used for two reasons. First, errors
involved in the determination of low levels of residues in oil by
electron capture gas chromatography were expected to be higher than
those in the determination of radioactivity in the oil. Second, it
was not known whether any of the processing techniques would convert
lindane or DDT into any other fat soluble product(s) which might escape
detection by gas chromatographic procedure. Determination of radio
activity in the processed oil included lindane- or DDT- and any
possible degradation product(s). Also, 100% recoveries were obtained
with this method.
Cooking of rapeseed flakes removed 96.4% of the lindane and 95.5%
of the DDT. The residues were transmitted to the oil fraction. None
of the other processing procedures removed a significant amount of
the pesticides from the oil, except for the deodorization step. This
phase of processing had a highly significant effect on the pesticidal
residues. Lindane- -^C had a 95.3% loss and DDT- incurred a
98.3% loss.Studies concentrated on the removal of DDT, parathion, and
carbaryl from spinach by commercial and home preparative methods were

13
performed by Lamb et al. (1968). The workers obtained treated samples
and processed part of them under commercial conditions and the remainder
under home preparative procedures. Home preparation consisted of home
cooking, freezing and canning. Sample analysis was performed during
each phase of both preparative procedures.
Results of the experimentation showed no significant differences
in residue levels of DDT and parathion after 15 and 13 days storage,
respectively. Minimum and maximum commercial washing removed 17 and
48% of the DDT, 0 and 9% of the parathion, and 66 and 87% of the
carbaryl. Use of a detergent in the wash water increased the percent
removal. After commercial water blanching, 38 to 60% of the DDT was
removed, 49 to 71% of the parathion, and 96 to 97% of the carbaryl.
Steam blanching removed little or no residue. After commercial canning
and storage for 5 months, no DDT remained, but small amounts of TDE and
DDE were found; parathion and carbaryl did not change. These findings
concurred with those of Farrow et al. (1966). The p,pT- isomer of DDT
decreased more than the o,p?- isomer during washing and blanching.
Home and commercial washing removed comparable amounts of DDT and
carbaryl. Little or no change in residue occurred after cooking washed
spinach without the addition of water.
Hemphill et al. (1967) studied the effects of home preparation
techniques on pesticide residues in green beans. The samples were
thoroughly washed and trimmed. Three different cooking techniques were
used in the experimental design. The beans were either boiled, cooked
in a pressure cooker, or cooked in a microwave oven. The green beans
and cooking water were analyzed separately. The researchers were able

to detect p,p'-DDT, o,p-DDT, p,p’-DDD, p,p-DDE, o,p-DDD and trace
amounts of heptachlor epoxide, dieldrin and endrin. All levels of
pesticides were within the tolerances set by the Food and Drug
Administration.
Washing reduced the total pesticide residues in green beans by an
average of 5.3%. Trimming had very little effect on the pesticide
level. The two procedures (washing and trimming), however, caused a
mean reduction in the total amount of pesticide by 9.2%. Washing,
trimming, and cooking green beans reduced the mean total pesticide
residues by 47.1% to 62.9%. The greatest effect (62.9%) was observed
in the pressure cooked samples.
Another group of researchers (Carlin et al., 1966) studied the
pesticidal residues in green beans. Reports of pronounced "musty" or
"earthy" flavors in different crops grown and processed under widely
varying conditions, dramatized the necessity for study of each pesti
cide on various crops and under many conditions of application.
Investigations were made using DDT and Guthion to determine: 1) the
influence of simulated commercially acceptable processes for canning
or freezing upon the magnitude of insecticides remaining after storage
for 11 months; and 2) the effect of the insecticide residues on the
flavor and quality of the processed beans.
Harvested, treated beans were initially washed, cut and blanched.
The samples to be frozen were immediately frozen; the canned samples
were placed into cans and heat processed.
After processing and 4 months storage at 0°F., the results showed
a lower level of Guthion as compared with the control. Unwashed beans

15
stored for 11 months at 0° F. showed decreased amounts of DDT. The
residues of DDT found on the unwashed beans were considerably less than
the FDA tolerance level. The samples that had been canned and heat
processed showed a 20 to 27% reduction in DDT level. Fleck and Haller
(1946) reported that small amounts of iron would catalytically decom
pose DDT. Carlin at al. (1966) felt that much of the DDT reduction in
the canned samples was attributable to this fact. They felt the pre
sence of iron had more effect on the DDT content reduction, than the
heat involved in processing. They also proposed that the heat may
have supplied the necessary energy to catalyze the reaction of DDT
with iron.
Sensory evaluation of the green beans indicated that the flavor
was not affected by the small residues of DDT and Guthion found on the
frozen beans, since the judges were not able to distinguish between the
flavor of untreated and treated beans. Also, no off-flavors were
reported.
Killgore and Windham (1970) reported the disappearance of malathion
residue in broccoli during cooking and freezing. The purpose of the
experiment was to determine the residue levels resulting from sprays
applied at different intervals before harvest and to determine to what
extent the residues were removed by cooking or by storing at -9° C. for
six months. Broccoli plants were harvested at intervals of 1, 2, 3,
and 4 days following malathion application. The broccoli was cooked
in boiling salted water. Samples to be frozen were blanched in steam
for 5 minutes, sealed in plastic bags with little air space, frozen
and stored at -9° C. for 6 months. Broccoli harvested 1 through 4 days
following application contained malathion residues of 10.3, 8.2, 5.4,
and 4.5 ppm, respectively. The samples after cooking showed losses of
9, 34, 8.1, and 7.2% malathion from the 1 through 4 day harvest period,
respectively. Disappearance of the residue varied from 36 to 90% in
samples stored at -9° C. for 6 months.
Endrin persistence on cabbage was studied and reported by Mattick
et al. (1963). The cabbage used in the analysis was obtained from
different field plots sprayed at rates of 0.8, 0.5, and 0.25 pounds
endrin per acre. Samples from each plot were harvested at intervals
of 0, 1, 3, 5, 7, 10, 14, and 21 days after application. The amount
of endrin in both 0.8 and 0.5 pound per acre samples showed a definite
rise between 0 and 1 day after spraying. The 0.25 pound per acre, 0
day sample was lost during laboratory preparation of the samples.
Following the initial rise at 1 day, endrin disappeared progressively
until 21 days after spraying when the level of endrin was 0.13 ppm or
less in all analyses attempted.
Farrow nt al. (1968) compared the effects of commercial and home
preparative methods on the removal of DDT, malathion, and carbaryl
from tomatoes. A field of growing tomatoes was divided into 3 plots.
Each plot was sprayed with either DDT, malathion, or carbaryl. Sam
ples were divided into two groups and were prepared by either simu
lating commercial or home preparative procedures. Residue determin
ations were made at appropriate points throughout the processing.
DDT residues on unwashed tomatoes showed no significant differences
with 7 days storage. There was no significant difference with storage
of unwashed tomatoes containing malathion, even though there was an

apparent decrease of 30%. Carbaryl also did not show a significant
change after 7 days storage.
Commercial preparative methods showed that the wash water removed
85 to 92% of the DDT. Peeling removed 99%+ of the DDT and 80 to 94%
of the malathion. Carbaryl followed the trend of the other two pesti
cides with as much as 92% removed by peeling. The investigators
could not find any significant differences between the commercial pro
cedure and the home preparative methods.
Elkins et al. (1968) performed the same study as Farrow e_t al.
(1968) with the exception of using green beans instead of tomatoes.
Commercial water blanching removed more than 50% of the DDT residue.
Additional commercial processing removed approximately 33% of the DDT
residue. During home preparative methods, cold water washing and home
canning removed a total of 80% of the original DDT residue. During
commercial heat processing and home canning methods p,p'-DDT was con
verted to p,p'-TDE. Commercial processing methods removed more than
94% of the original malathion residue. During home preparative pro
cedures cold water washing removed 96% of the malathion. Only trace
amounts remained in home cooked green beans. Commercial water blanch
ing removed 68 to 73% of the carbaryl residue from the beans. Further
processing removed no additional carbaryl. Home preparative procedures
reduced carbaryl residues to trace amounts.
Lamb et_ al. (1968) reported on the behavior of DDT in potatoes
during commercial and home preparation. The experimental design was
the same as reported by Elkins £t al. (1968) and Farrow et al. (1968).
Low concentrations of o,p'-DDT, p,p'-DDT, and p,p’-DDE were present

18
at harvest. Commercial washing operations removed about 20% of the
total DDT residue from potatoes and lye peeling plus washing removed
about 94%. Commercial processing further reduced the residue to
insignificant levels. During home preparative procedures, peeling
removed more than 91% of the residue.
There was no significant decrease from the original residue when
potatoes with skins were boiled or pressure cooked. Potatoes stored
at 45° F. for a period of 6 weeks showed no significant loss of residue.
Pentachloronitrobenzene (PCNB) residues in potatoes were studied
by Gorbach and Wagner (1967). The potatoes had been grown in PCNB
treated soil. The majority of the residue was found in the peel and
in the 1 to 2 mm. thick cellular tissue underneath the peel. Under
sterile conditions only PCNB was found; however, in potato homogenates
that had been allowed to ferment, two metabolites in addition to PCNB
were present. The researchers were able to isolate and identify one
of the metabolites. The experimental evidence indicated the compound
to be pentachloroaniline.

MATERIALS AND METHODS
Samples
Samples of Irish potatoes and sweet potatoes were used in the
investigation. Both types were commercial grade obtained from a local
supermarket. The Irish potatoes were grown in Idaho and the sweet
potatoes in Louisiana.
Sample Preparation
The potatoes were soaked in tap water to remove the excess dirt
on the surfaces. They were then peeled and allowed to soak in fresh
water. The soaking kept browning from taking place before the potatoes
could be placed into containers. Before canning, the samples were
coarsely ground in a food chopper. The ground potatoes were thoroughly
mixed in order to obtain homogeneous samples. Two hundred grams of
ground potatoes were placed into No. 1 metal cans. One milliliter of
endrin (100 ppm) dissolved in petroleum ether was introduced into the
center of the potatoes in each can. Figure 1 illustrates the design
of the experiment.
The samples that were processed with water had 25 ml. of tap water
introduced into each can. The blanched samples were placed into a
covered container of boiling water and blanched for 15 minutes. All
cans were then hermetically sealed. The heat processed group was
placed into a retort and heated at 235° F. under 10 psig for 30 minutes.
Dosimetry
Samples that were to be irradiated were separated and irradiated
at the Nuclear Science Center at Louisiana State University. The

Figure 1
Experimental Design for Storage and Processing of Potatoes
Storage: 0, 6 and 12 weeks
Potatoes: Irish or Sweet
Irradiated Nonirradiated
Heat Processed Frozen Heat Processed Frozen
1. 25 ml. water
2. No water
1. Blanched 1. 25 ml. water 1. Blanched
2. Unblanched 2. No water 2. Unblanched

21
Gamma radiation source used was a 19,850 curie Cobalt-60 irradiator.
The Fricke Dosimetry Method was used for determining the amount of
radiation which would be absorbed from the Cobalt-60 source (Weiss,
1952). The dose rate was measured on the basis of a ferrous ammonium
sulfate solution and spectro-photometric determination of the ferric
ion produced. Samples of dosimetry solutions were placed in the
radiation field for precisely measured lengths of time. After removal
of the specimens from the radiation field, their optical densities
were determined immediately in a Beckman Type DB Spectrophotometer at
wave length 305 millimicrons. A portion of the unirradiated ferrous
solution was used as a blank in the spectrophotometer. From the optical
density of the irradiated solutions, the radiation dosage was deter
mined from a calibration curve and the following empirical formula:
D = 2.94 x 10⁴ (1 - 0.007) (t - 20)(A/T)
D: Dose rate
t: Ambient room temperaturewhere
A: Absorbancy
T: Time of radiation, minutes
Figure 2 shows absorbancy vs. time curves for the irradiation of
the Fricke dosimetry solutions for three time periods: 5 minutes, 10
minutes and 15 minutes of irradiation. The five different curves in
Figure 2 represent five different positions in which the dosimetry
solutions were placed in the diving bell used to house the food which
was irradiated. It is seen in the figure that the absorbancy is
linearly proportional to the time of irradiation of the solution.The temperature of irradiation, t, the absorbancy, A, and time
of irradiation, T, necessary to give an absorbancy of 1.0 were the

A B
SO
RB
AN
CE
.50
24T I M E (MINUTES)
Figure 2. Relationship of Aosorbance vs. Time for Five Different Positions in the Irradiation Chamber.
K3N>

23
necessary factors inserted into the emperical formula of the Fricke
dosimetry method. The length of time required to give an absorbancy
of 1.0 was obtained by extrapolation of the absorbancy vs. time to the
1.0 absorbancy line (Figure 2). By inserting the extrapolated values
for the time and using the absorbancy of 1.0 and an ambient temperature
of 25° C. in the formula, five different dose rates for the five dif
ferent positions of the Fricke dosimetry solutions were obtained. The
mean value of the five determinations was calculated to be 87,258 rads/
hour. The potatoes were irradiated for a total of 1 hour and received
a dose of 0.087 million rads (Mrad).
Extraction of Pesticide Residues
Extraction of the pesticidal residues was performed as shown in
Figure 3. Each can was opened and the contents emptied into a 1000 ml.
blendor jar. Four hundred milliliters of nanograde acetonitrile was
placed in the jar along with the potatoes and the contents were
blended for two minutes. The jars were emptied into a large funnel con
taining a loose plug of glass wool. The filtrate dripped into a 250 ml.
graduated cylinder. The volume of liquid obtained was divided into
two parts so that each part represented 100 g. of sample. Each volume
was recorded (F). The filtrate was transferred to a 1000 ml. separa
tory funnel. One hundred milliliters of nanograde petroleum ether (R)
were added to the separatory funnel. The petroleum ether was measured
in the same graduated cylinder used to collect the filtrate. The
contents were vigorously shaken for two minutes to insure transfer of
the pesticide residues from the acetonitrile-water layer to the
petroleum ether layer. Ten milliliters of saturated sodium chloride
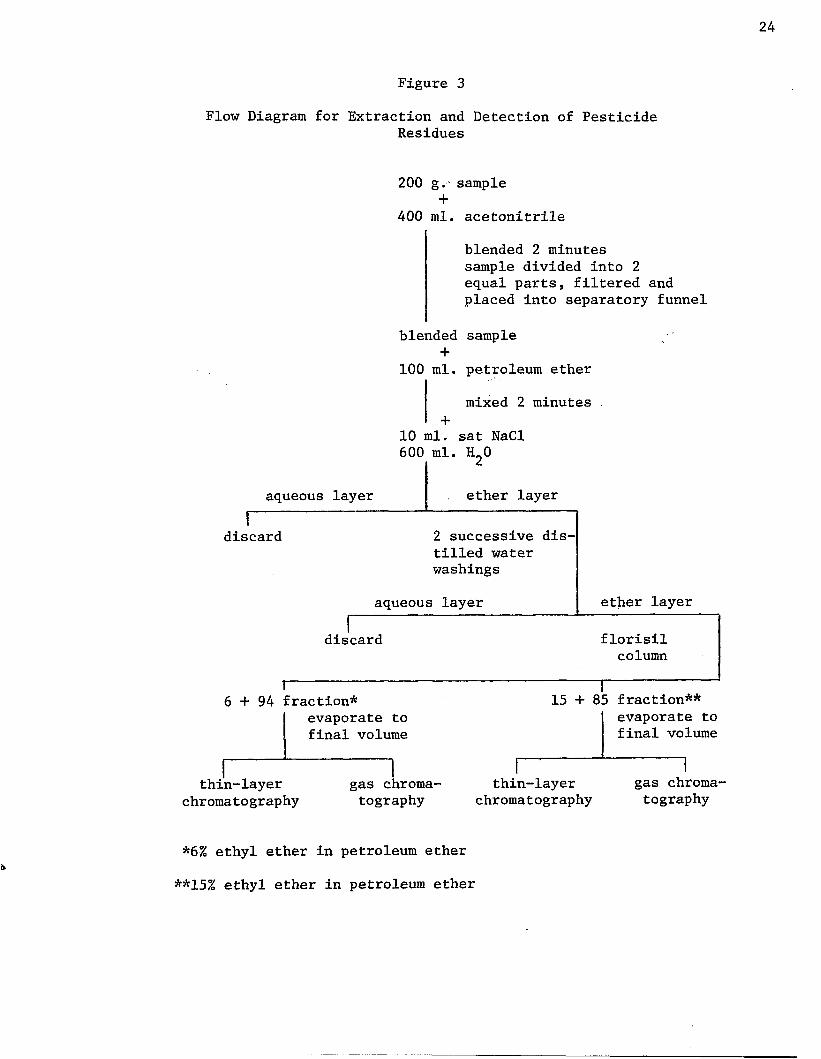
Figure 3
Flow Diagram for Extraction and Detection of PesticideResidues
200 g.- sample +
400 ml. acetonitrile
blended 2 minutes sample divided into 2 equal parts, filtered and placed into separatory funnel
blended sample +
100 ml. petroleum ether
mixed 2 minutes
10 ml. sat NaCl 600 ml. H„0
aqueous layer ether layer1
discard 2 successive distilled water washings
aqueous layer ether layerrdiscard florisil
column
6 + 9 4 fraction*evaporate to final volume
15 + 85 fraction**evaporate to final volume
thin-layerchromatography
gas chromatography
thin-layerchromatography
gas chromatography
*6% ethyl ether in petroleum ether
**15% ethyl ether in petroleum ether

25
and 600 ml. of distilled water were added to the separatory funnel. The
contents were mixed gently, but thoroughly. Ample time was given for
the layers to separate, then the aqueous layer was discarded. The sol
vent layer was washed with two successive 100 ml. portions of distilled
water. The washings were discarded and the solvent layer transferred
to a 100 ml. graduated cylinder. The volume was recorded (P). Just
prior to the florisil column cleanup, 15 g. of anhydrous granular sodium
sulfate was added to the petroleum ether extract to absorb the water.
Volumes (F, R, and P) were recorded in order to determine the
amount of sample represented by the eluants. This formula was used
for the calculation:
Sample represented by eluants = S x (F/T) x (P/R); (1)
where S = g. sample taken; F = volume of filtrate; T = total volume
(ml. water contained in sample + ml. acetonitrile added - correction
in ml. for volume contraction); P = ml. petroleum ether extract; and
R = ml. petroleum ether used to dissolve residue.
Florisil Column
A glass column 60 cm. long, with an inside diameter of 2.5 cm.
and a teflon stopcock was used for the column chromatography. Florisil
(60 - 100 mesh) was used as the adsorbant. The florisil was activated
by placing the adsorbant in a porcelain casserole and heating at
650° C. for 2 hours in a muffle furnace.
The bottom of the column was filled with glass wool to keep the
adsorbant in the column. Four inches of florisil was placed in the
column and topped with 1/2 inch anhydrous granular sodium sulfate.
The column was prewet with 30 ml. nanograde petroleum ether. The
petroleum ether extract from the 100 ml. graduated cylinder was trans
ferred to the column and allowed to flow through at a rate of about
5 ml. per minute. The graduated cylinder was washed with 2 successive
5 ml. portions of petroleum ether. The walls of the chromatographic
tube were washed with a small portion of petroleum ether.
The column was eluted with 200 ml. of eluting mixture (6 + 94).
This mixture was prepared by diluting 60 ml. of anhydrous purified
ethyl ether to 1000 ml. with nanograde petroleum ether. Twenty-five
grams of anhydrous granular sodium sulfate were added to remove any
water in the mixture. This fraction was collected in a separate col
lection vessel and labeled "6 + 94" fraction.
The second fraction collected was labeled "15 + 85" fraction.
This eluting mixture was prepared by diluting 150 ml. of purified
anhydrous ethyl ether to 1000 ml. with nanograde petroleum ether.
Twenty-five grams of anhydrous granular sodium sulfate were added to
remove any water. Two hundred milliliters of this mixture were used
as the second elution solvent. This fraction was collected in a
separate container.
Both fractions collected from the column were placed into a warm
water bath (45° C.) and evaporated to about 10 ml. During the drying
process the walls of the containers were periodically washed with
petroleum ether in order to keep the residues from adhering to the
walls and in solution. The solutions were transferred to 25 ml. volu
metric flasks that had been pre-rinsed with petroleum ether. The
volumetric flasks were brought up to final volume. These solutions
served for injection into the gas-liquid chromatograph. They were
also utilized in the thin-layer confirmative studies.

27
Gas-liquid Chromatography
Pesticide residue analysis was performed by means of a Varian
Aerograph Series 1200 Gas-liquid Chromatograph, equipped with an elec
tron capture detector. The operational conditions employed for the
analysis are shown in Figure 4.
The column was pre-conditioned at 250° C. and nitrogen gas with
a flow rate of 100 ml. per minute passed through the column. During
this time the column was disconnected from the detection port. The
detection port was capped to keep any contaminants from entering.
After 24 hr. the instrument was ready to perform the analysis.
The samples were injected into the gas chromatograph in amounts
varying from 1 ul. to 8 ul. Four replications of each sample were per
formed. The pesticidal residues were identified by means of standards
that were injected into the instrument after the unknown samples were
detected.
The standards were prepared by weighing 50 mg. of the material
and diluting to 100 ml. with petroleum ether. This was kept as the
stock solution. Working standards were prepared from the stock solution
giving the following final concentrations:
Qualitation was performed by means of comparing retention times
of the standard to the unknown. Retention time was considered as the
time elapsed between the injection and the zenith of the peak.
Quantitation of the pesticidal residues was achieved by deter
mining the areas of the peaks as compared with that of the known
Aldrin
Endrin
Heptachlor epoxide 1 nanogram/microliter
1 nanogram/microliter
2 nanograms/microliter

Figure 4
Gas Chromatograph Operating Conditions
Column substrate
Column support
Column length, shape
Column diameter, ID
Carrier gas
Carrier gas pressure
Carrier gas flow rate
Operating temperature
inlet
column
detector
Attenuation
Range
Detector
Recorder
Chart Speed
Anakrom ABS 90-100 mesh
10% Dow Corning silicone Fluid DC 200
6 feet, coiled helix
4 mm., glass
Pre-purified dry nitrogen
50 psig
120 ml./min.
210° C.
200° C.
210° C.
1 - 1 6
1Electron capture
Leeds and Northrup, Speedomax H
1 inch per min.

29
standard. Actual measurement of the areas was accomplished with the
use of a planimeter (Model 39231, Compensating Polar Planimeter, Gelman
Instrument Co., Ann Arbor, Michigan).
After the peak areas were determined, they were converted to
standard areas. The amount of sample represented by the eluants as
calculated by formula (1) was adjusted to 100 g. of sample; the area
was likewise adjusted proportionately. For example, if it was deter
mined that a peak area of 100 was represented by 80 g. of sample, the
peak area was adjusted to 125, thus representing 100 g. of sample
(the standard amount).
Thin-layer Chromatography
Glass plates (20 cm.^) used in thin-layer chromatographic proce
dures were thoroughly cleansed with detergent and rinsed first with
tap water then with distilled water. Immediately before applying the
stationary phase, the plates were scrubbed with acetone.
Forty grams of aluminum oxide-G was weighed into a 250 ml. cen
trifuge bottle. To this, 80 ml. of 0.2% HNO^ (prepared with double
distilled water) was added to the powder and shaken until the mixture
thickened. The slurry was centrifuged at 1500 rpm for 3 min. and the
supernatant decanted. The Al^O^ was then washed three successive times
with 80 ml. double-distilled water. Each time, the slurry was centri
fuged and the liquid decanted. Ten milliliters of 1% silver nitrate
and enough ethanol were added to make the weight about 110 g. over the
weight of the centrifuge bottle. The mixture was then shaken gently to
produce a smooth, uniform slurry. The slurry was poured into a
spreader previously set at 0.25 mm., thickness and spread evenly over

30
the surfaces of 5 plates. The plates were air dried for 15 min. and
then they were placed in an oven at 100° C. for 15 min. They were
immediately stored in a dessicator until needed.
As the plates were used, they were first activated for 15 min. in
a 100° C. oven. After cooling to ambient temperature in a dessicator,
the extracted pesticidal residues and the standards were spotted sepa
rately on the plates. Amounts spotted varied from 0.01 ul. to 0.15 ul.
Nine to 12 spots were spotted across the thin-layer plates.
A developing tank was prepared by lining the sides with filter
paper and adding N-heptane to the bottom. Ample time was allowed for
the solvent to saturate the atmosphere (30 min.). The spotted plates
were placed in the tank and resolved until the solvent front reached
1 cm. from the top. The plates were then air dried.
For detection the plates were exposed to ultraviolet light up to
1 hr. Confirmation of suspected pesticidal residues was made by com
parison with the standard. Also, determinations were made. f
*
RESULTS AND DISCUSSION
Findings in the study showed that three pesticidal residues were
consistently present in the two potato types. These three pesticides
were aldrin, heptachlor epoxide and endrin. Thin-layer chromatography
was used for confirmation of the pesticidal residues. The pesticides
extracted from the potatoes were compared to standards. The migration
of the spots in question was the same as the standards. RDDD values
were determined and were found to be: aldrin 2.15, heptachlor epoxide
0.45, and endrin 0.26.
Averages of the actual quantities of these residues are presented
in Tables A through G in the Appendix. Analyses of variance were cal
culated at the Louisiana State University Computer Science Center
through the Department of Experimental Statistics. Six analyses were
performed on the data. One analysis for each pesticide was done to
determine if irradiation had a significant effect on the quantity of
residues present in the control (Tables H, I, J of the Appendix). The
remaining three analyses were used to determine the effects of storage,
potato types, irradiation, and processing upon the quantities of
pesticidal residues (Tables K, L, M of the Appendix).
Table 1 illustrates the average quantities and differences of the
three pesticidal residues in unprocessed Irish and sweet potatoes.
Irish potatoes contained an average of 1.10 ppm aldrin. The sweet
potatoes contained significantly higher amounts (average of 1.31 ppm).
Calculations showed this to be a 16.09% difference of aldrin in the
two potato types. The statistical analysis (Table H) showed this to be
a highly significant difference.

Table 1
Average Quantity3 of Pesticidal Residues in Two Potato Typesin Nonprocessed Potatoes
Irish Sweet % Difference
Aldrin 1.10 1.31 16.09b
Heptachlor epoxide 1.26 1.16 8.03b
Endrin 97.68 96.69 1.02
appm
^highly significant difference (P<0.01)

33
Heptachlor epoxide concentrations were also significantly different
between the two potato types (Table I). As shown in Table 1, Irish
potatoes contained an average of 1.26 ppm, whereas the sweet potatoes
contained a lesser amount (1.16 ppm, average). There was an 8.03%
difference between the two potato types. Although the percent differ
ence of heptachlor epoxide in the potato types was only half that of
aldrin, the difference was great enough to be a highly significant one.
Endrin in Irish and sweet potatoes differed an extremely small
amount (1.02%). Since the potatoes were fortified with endrin, one
would expect very little difference in the analysis of the nonprocessed
potatoes. Irish potatoes contained an average of 97.68 ppm; sweet
potatoes contained an average of 96.69 ppm.
The differences in pesticidal residue content of irradiated and
nonirradiated, nonprocessed potatoes are shown in Table 2. Both aldrin
and heptachlor epoxide showed a decreased residue content with irradi
ation. Irradiated potatoes had an average of 0.99 ppm and nonirradiated
potatoes had a mean of 1.42 ppm, aldrin. This was a 30.1% difference
in aldrin content. The analysis of variance (Table H) showed this
difference to be highly significant. Irradiated potatoes had an
average of 0.89 ppm, heptachlor epoxide and the nonirradiated samples
contained 1.54 ppm, average. This was a 42.5% decrease of heptachlor
epoxide. Table I shows this difference to be highly significant.
The amount of endrin in nonirradiated potatoes averaged 99.27 ppm.
The irradiated samples contained 4.21% less endrin (95.10 ppm).
Although Table J showed the difference to be nonsignificant, the dif
ference approached significance (P>0.05).

Table 2
Average Quantity3 of Pesticidal Residues in Irradiated and Nonirradiated,Nonprocessed Potatoes
Irradiated Nonirradiated % Difference
Aldrin 0.99 1.42 30. lb
Heptachlor epoxide 0.89 1.54 42.5b
Endrin 95.10 99.27 4.21
appm
^highly significant difference (P<0.01)

Differences in processed potatoes are reported in Tables 3 through
9 with the effects of storage on the three pesticidal residues shown
in Table 3.
There was a slight increase in aldrin from 0 to 6 weeks storage.
The averages were 0.35 ppm and 0.40 ppm for 0 weeks and 6 weeks, respec
tively. This was an 11.82% increase. A considerable decrease in aldrin
content was detected after 12 weeks storage (0.23 ppm). Compared to 0
weeks quantity of aldrin, there was a 34.5% decrease. Table K showing
the analysis of variance of aldrin in processed potatoes, showed that
a highly significant difference occurred during storage. Orthogonal
comparisons (Table N) were performed to determine if one period of
storage was superior to another. The first comparison of 0 versus 6
and 12 weeks storage indicated there was no difference in the residue
content between nonstored and stored potatoes. However, when the 6
weeks storage was compared to the 12 weeks samples, the 34.5% decrease
was highly significant. This suggested that potatoes containing aldrin
must be stored more than six weeks before a significant quantity of the
residue will be degraded.
Heptachlor epoxide had averages of 0.36 ppm, 0.42 ppm, and 0.46
ppm at 0, 6, and 12 weeks storage, respectively (Table 3). There was
a 15.75% increase in the quantity of the residue between 0 and 6 weeks
storage. Overall, between 0 and 12 weeks storage, there was a total
increase of 22.5%. This increase was not a significant one (Table L).
Orthogonal comparisons (Table 0) detecting differences between 0 and 6
weeks storage showed that the increase was nonsignificant. Likewise,
there was no significant chajige when the difference between 6 and 12
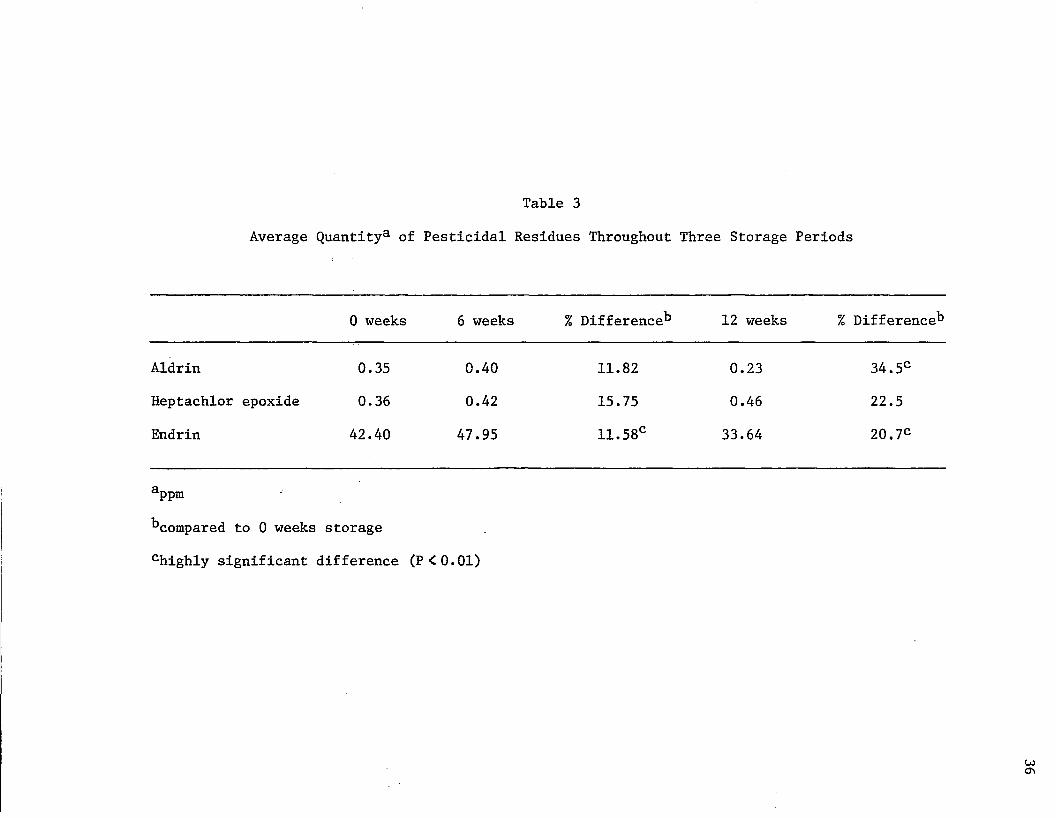
Table 3
Average Quantity3 of Pesticidal Residues Throughout Three Storage Periods
0 weeks 6 weeks % Difference*3 12 weeks % Difference*3
Aldrin 0.35 0.40 11.82 0.23 34.5C
Heptachlor epoxide 0.36 0.42 15.75 0.46 22.5
Endrin 42.40 47.95 11.58c 33.64 20.7C
^pmbcompared to 0 weeks storage
chighly significant difference (P<0.01)

week samples were compared. The consistent, nonsignificant increase in
the heptachlor epoxide residue content can only be attributed to bio
logical variation.
Endrin followed the trend of the other two pesticidal residues in
that it showed an increase after 6 weeks storage. The 0 weeks samples
had a mean of 42.40 ppm and increased 11.58% during storage for 6 weeks
(47.95 ppm, average). After 12 weeks storage, the residue content of
the potatoes was lowered to an average of 33.64 ppm. This was a 20.7%
decrease over 12 weeks storage.
Table M showed that a highly significant change occurred in endrin
residue quantities with storage. The orthogonal comparisons of Table P
showed that the decrease in endrin residue content between 0 weeks com
pared to 6 and 12> weeks was significant. Also, there was a highly
significant decrease in endrin residue content with 12 weeks storage,
compared to the content at 6 weeks.
These results indicate that aldrin and endrin residues in potatoes
can be significantly degraded if stored for an appropriate amount of
time. Perhaps the heptachlor epoxide could also be significantly
degraded if stored for longer periods. Lamb et al. (1968) used 5
month storage to initiate the degradation of DDT, parathion and carbaryl.
Table 4 compares the quantities of pesticidal residues in the two
potato types after processing. Irish potatoes contained 0.40 ppm
aldrin and sweet potatoes contained an average of 0.25 ppm of the
residue. This was a difference of 37.6%. Table K showed this dif
ference to be highly significant. In the control (Table 1) there was
a 16.09% difference between the two potato types with sweet potatoes

Table 4
Average Quantity3 of Pesticidal Residues in Processed Irish and Sweet Potatoes
Irish Sweet % Difference
Aldrin 0.40 0.25 37.6b
Heptachlor epoxide 0.36 0.46 21.9C
Endrin 34.07 48.58 29.9b
appm
^highly significant difference (P<0.01)
Significant difference (P<0.05)
containing more aldrin than Irish potatoes. After processing, aldrin
was found to a lesser degree in sweet potatoes. From the information
it is believed that aldrin is more easily degraded in sweet potatoes
than in Irish potatoes.
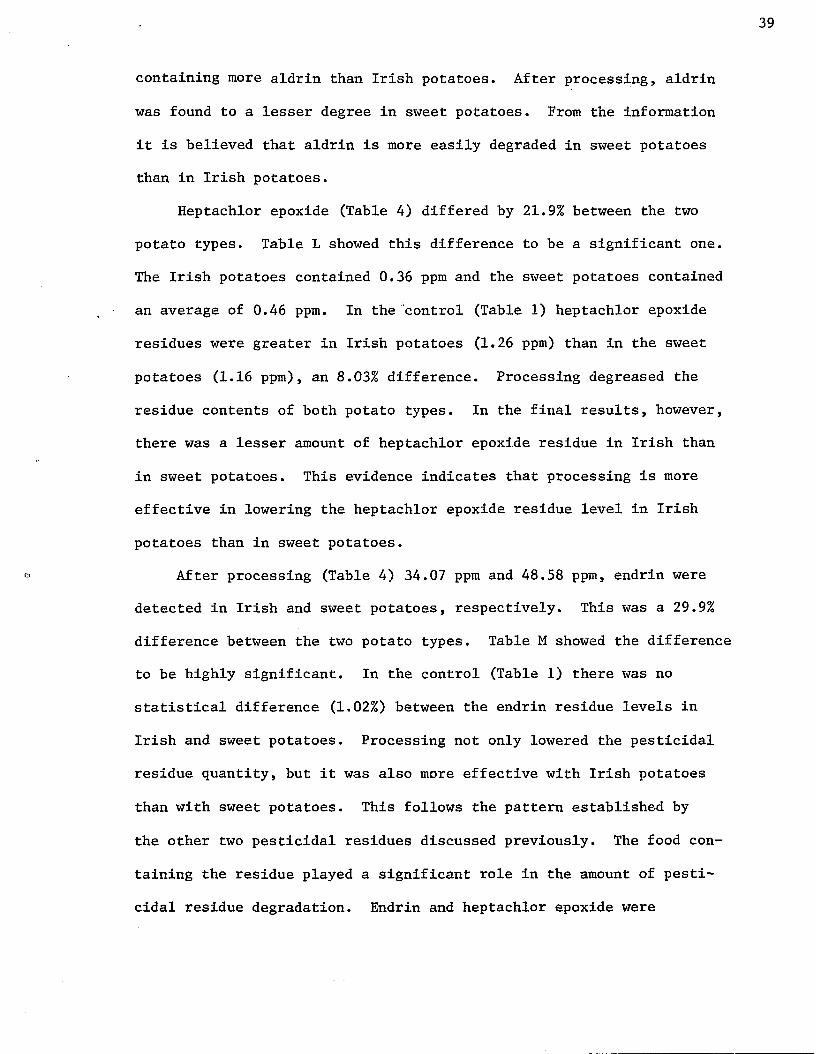
Heptachlor epoxide (Table 4) differed by 21.9% between the two
potato types. Table L showed this difference to be a significant one.
The Irish potatoes contained 0.36 ppm and the sweet potatoes contained
an average of 0.46 ppm. In the control (Table 1) heptachlor epoxide
residues were greater in Irish potatoes (1.26 ppm) than in the sweet
potatoes (1.16 ppm), an 8.03% difference. Processing degreased the
residue contents of both potato types. In the final results, however,
there was a lesser amount of heptachlor epoxide residue in Irish than
in sweet potatoes. This evidence indicates that processing is more
effective in lowering the heptachlor epoxide residue level in Irish
potatoes than in sweet potatoes.
After processing (Table 4) 34.07 ppm and 48.58 ppm, endrin were
detected in Irish and sweet potatoes, respectively. This was a 29.9%
difference between the two potato types. Table M showed the difference
to be highly significant. In the control (Table 1) there was no
statistical difference (1.02%) between the endrin residue levels in
Irish and sweet potatoes. Processing not only lowered the pesticidal
residue quantity, but it was also more effective with Irish potatoes
than with sweet potatoes. This follows the pattern established by
the other two pesticidal residues discussed previously. The food con
taining the residue played a significant role in the amount of pesti
cidal residue degradation. Endrin and heptachlor epoxide were

40
decreased to a greater extent in Irish potatoes; aldrin was decreased
to a greater extent in sweet potatoes.
Table 5 shows the average quantity of pesticidal residues after
irradiation of processed Irish and sweet potatoes. Irradiated potatoes
contained 0.47 ppm aldrin; nonirradiated potatoes 0.18 ppm. This was
a difference of 61.0%. Table K indicated this difference to be highly
significant. This finding was contrary to what might be expected.
The nonirradiated samples had a lower aldrin residue content than the
irradiated samples. The control (Table 2) showed that irradiation
without processing, significantly decreased the aldrin residue content
in Irish and sweet potatoes. The only conclusion that could be drawn
from the data was that irradiation in conjunction with processing
offered a sparing effect on aldrin.
Heptachlor epoxide was detected as 0.46 ppm in irradiated potatoes
and 0.36 ppm in nonirradiated potatoes. This was a difference of
22.6%. Table L showed the difference to be significant. As in the
case of aldrin, heptachlor epoxide increased (22.6%) with irradiation.
The control (Table 2) showed a 42.5% (highly significant) decrease
with irradiation. The same conclusion as with aldrin was drawn for
heptachlor epoxide. Apparently some other factor must influence the
effect of irradiation on aldrin and heptachlor epoxide residues.
Irradiation (Table M) did not significantly affect endrin residues
in the processed potatoes. There was a 3.5% decrease of the residue
with irradiation. -The mean of the irradiated group was 41.20 ppm
whereas the nonirradiated group was 42.69 ppm. Irradiation did not
significantly affect endrin in the control (Table 2) as it did for aldrin and heptachlor epoxide.

Table 5
Average Quantity3 of Pesticidal Residues Resulting from Irradiation ofProcessed Irish and Sweet Potatoes
Irradiated Nonirradiated % Difference
Aldrin 0.47 0.18 61.0b
Heptachlor epoxide 0.46 0.36 22.6C
Endrin 41.20 42.69 3.5
appm
^highly significant difference (P<0.01)
csignificant difference (PC0.05)

42
Table 6 compared the effect of heat processing to freezing on
pesticidal residue content of potatoes. Heat processing had a mean of
0.39 ppm aldrin and freezing had a mean of 0.26 ppm. This amounted to
a 35.2% difference between the processing methods. Table K showed that
there was a highly significant difference in pesticidal residue content
with processing method. Orthogonal comparisons were performed to
detect exactly where the differences occurred. The first comparison of
Table Q compared the effects of heat processing to freezing on aldrin
residue levels. Results showed that the 35.2% difference between the
two processes was highly significant. Aldrin was significantly
decreased with freezing.
Heat processed potatoes had a mean of 0.33 ppm heptachlor epoxide.
An average of 0.50 ppm of the residue was detected in the frozen sam
ples. There was a 34.4% difference between the two methods. Table L
showed that there was not a significant difference on heptachlor
epoxide content with processing. Table R illustrated the orthogonal
comparison to detect differences between heat processing and freezing
(first comparison). The difference was nonsignificant. Like aldrin,
heptachlor epoxide was not significantly decreased by means of heat
processing compared to freezing.
An average of endrin in the heat processed samples was 34.88 ppm;
in the frozen samples it was 47.79 ppm. This was a difference of
27.0% in the residue contents. Table M showed that there existed a
highly significant difference in endrin residues due to processing.
Table S compared the effects of heat processing to the effects of
freezing on endrin residue content. There was a highly significant

Table 6
Average Quantitya of Pesticidal Residues as a Result of Two DifferentProcessing Applications
Heat Processing Freezing % Difference
Aldrin 0.39 0.26 35.2b
Heptachlor epoxide 0.33 0.50 34.4b
Endrin 34.88 47.79 27.0b
appm
^highly significant difference (P<0.01)

44
difference between the two basic processing methods. Heat processing
was more effective for degradation of endrin.
Data indicated that one processing technique was not effective in
degrading all pesticidal residues. Aldrin was more effectively degraded
by freezing the samples. Endrin was degraded to a greater extent by
heat processing. Heptachlor epoxide was equally affected by both pro
cessing methods.
Calculations were performed to determine if heat processing with
water was more effective in pesticidal alterations than heat processing
without water. The results are found in Table 7. Heat processing with
water had a mean aldrin content of 0.47 ppm whereas the heat processed
without water samples had a mean of 0.32 ppm. This was a 31.8% dif
ference between the two processing methods. The second comparison of
Table Q showed this difference to be highly significant. Freezing was
the most effective method for lowering the aldrin residue content of
potatoes (Table 6). A highly significant difference did exist, however,
between heat processing with and without water (Table 7).
The second pesticidal residue, heptachlor epoxide, was present at
a level of 0.35 ppm in the heat processes with water samples. An
average of 0.31 ppm was detected in the heat processes without water
group. A difference of 11.8% was calculated. The second orthogonal
comparison of Table R showed this difference to be nonsignificant.
Potatoes heat processed with water had a mean endrin residue con
tent of 32.41 ppm. The comparable group (heat processed without water)
had a mean of 37.31 ppm. This amounted to a difference of 13.1%.
The second comparison of Table S showed that the difference was

Table 7
Average Quantities3 of Pesticidal Residues in Heat Processed Potatoes,with and without Water
Heat Processed
Water No Water % Difference
Aldrin 0.47 0.32 31.8b
Heptachlor epoxide 0.35 0.31 11.8
Endrin 32.41 37.31 13. lb
appm
^highly significant difference (P<0.01)

46
significant. Heat processing effected a significant decrease in the
endrin residue content, compared to freezing (Table 6). Heat pro
cessing with and without water brought about significant alterations
of the endrin residue levels; however heat processing with water was
superior to heat processing without water.
Table 8 compared differences obtained by freezing blanched and
unblanched potato samples. The frozen blanched group had an average
of 0.22 ppm, aldrin and the frozen unblanched group had an average of
0.29 ppm. There was a 25.8% difference between the two groups. The
third comparison of Table Q showed this difference to be nonsignificant.
Frozen blanched and frozen unblanched samples had an average of
0.47 and 0.53 ppm, heptachlor epoxide, respectively. A 12.1% difference
existed between the two groups. Table Q illustrated that this differ
ence was nonsignificant. Blanching prior to freezing did not effec
tively alter the heptachlor epoxide residue content.
Blanching before freezing reduced the amount of endrin in the
samples more than did freezing alone. There was a mean of 44.70 ppm
endrin in the blanched frozen group. The unblanched frozen group had
a mean of 50.72 ppm, endrin. There was only an 11.9% difference be
tween the two groups, but Table S (third comparison) showed that this
difference was highly significant. Endrin was the only pesticidal
residue of the three that had any significant changes due to blanching.
Summary of the Effects of Processing
Freezing was the most effective method of lowering the aldrin
content in potatoes. Blanching was not necessary in this respect.

Table 8
Average Quantity3 of Pesticidal Residues in Frozen, Blanchedand Unblanched Potatoes
Frozen
Blanched Unblanched % Difference
Aldrin 0.22 0.29 25.8
Heptachlor epoxide 0.47 0.53 12.1
Endrin 44.70 50.72 11.9b
appm
^highly significant difference (P<0.01)\

Heat processing without water was the next most effective method fol
lowed by heat processing with water.
Heptachlor epoxide was equally affected by all four of the pro
cessing methods. No one processing technique caused more degradation
of the pesticidal residue than any other.
Endrin was most significantly altered by heat processing with
water. Heat processing without water was the next most effective
method. Blanching prior to freezing had a significant effect on the
decrease of endrin levels.
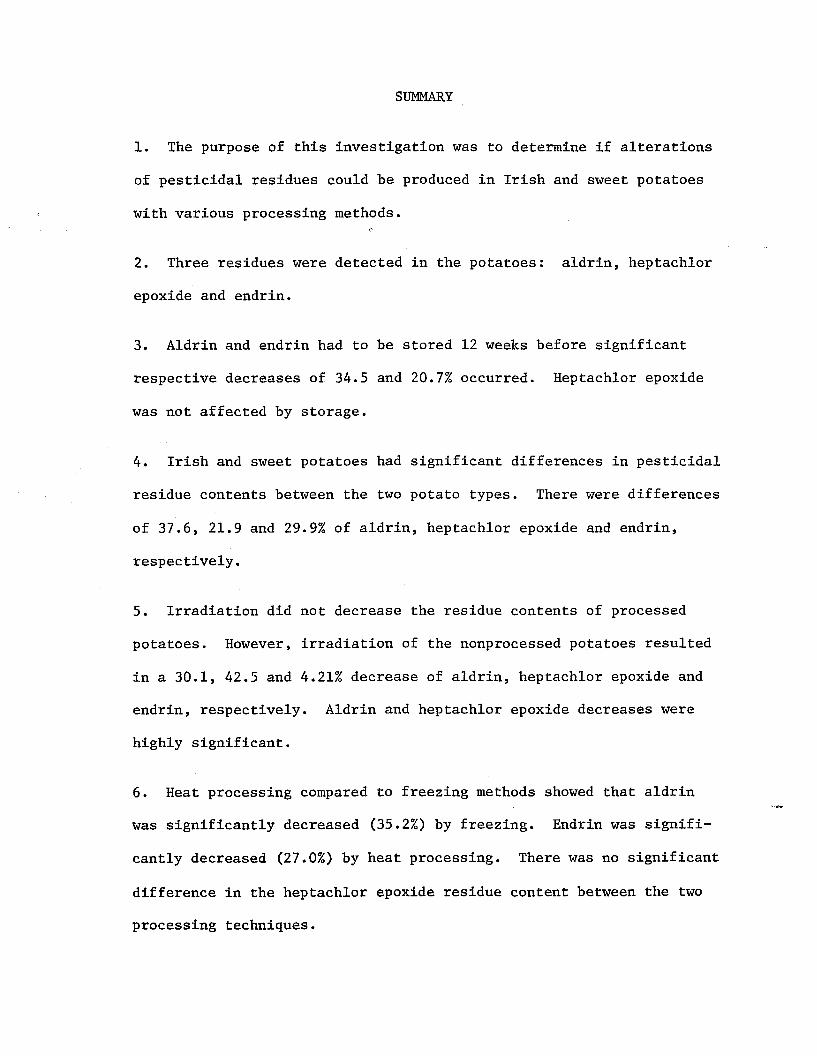
SUMMARY
1. The purpose of this investigation was to determine if alterations
of pesticidal residues could be produced in Irish and sweet potatoes
with various processing methods.
2. Three residues were detected in the potatoes: aldrin, heptachlor
epoxide and endrin.
3. Aldrin and endrin had to be stored 12 weeks before significant
respective decreases of 34.5 and 20.7% occurred. Heptachlor epoxide
was not affected by storage.
4. Irish and sweet potatoes had significant differences in pesticidal
residue contents between the two potato types. There were differences
of 37.6, 21.9 and 29.9% of aldrin, heptachlor epoxide and endrin,
respectively.
5. Irradiation did not decrease the residue contents of processed
potatoes. However, irradiation of the nonprocessed potatoes resulted
in a 30.1, 42.5 and 4.21% decrease of aldrin, heptachlor epoxide and
endrin, respectively. Aldrin and heptachlor epoxide decreases were
highly significant.
6. Heat processing compared to freezing methods showed that aldrin
was significantly decreased (35.2%) by freezing. Endrin was signifi
cantly decreased (27.0%) by heat processing. There was no significant
difference in the heptachlor epoxide residue content between the two
processing techniques.

7. Aldrin was significantly decreased (31.8%) by heat processing with
out water, when comparing heat processing, with and without water.
Heptachlor epoxide was not affected. Endrin was significantly decreased
(13.1%) by heat processing with water.
8. When comparing freezing, with and without blanching, it was found that aldrin and heptachlor epoxide were not significantly"altered.
Endrin was significantly altered (11.9%) by blanching before freezing.
9. Thin-layer chromatography of the extracted residues compared
favorably in values to the standards.

BIBLIOGRAPHY
Beasley, T. H., Sr. and H. W. Ziegler. 1970. Chlorinated pesticide residue analysis of spinach extracts using silicic acid-glass fiber sheet instead of the usual Florisil column for the cleanup operation. A Seminar. Pittsburgh Conference in Analytical
<v o Chemistry. Cleveland, Ohio. 0*.o
o ° 0o,o
Blinn, R. C. and F. A. Gunther. 1962. Pesticides Research Bulletin,o °Stanford Research Institute. Vol. 2, No.'3.
Blinn, R. C. and F. A. Gunther. 1962a. Pesticides Research Bulletin,Stanford Research Institute. Vol. 2, No. 4.
Blinn, R. C. and F. A. Gunther. 1963. Pesticides Research Bulletin,Stanford Research Institute. Vol. 3, No. 1.
Blinn, R. C. 1963. Thin-layer chromatographic isolation and infrared or colorimetric identification of thimet residues. >J.A.O .A.C .46, 952.
Bonner, F. 1968. Summary of pesticide residue analysis methods.Harry D. Wilson Laboratories, Louisiana State University,Baton Rouge.
Burke, J. and W. Holswade. 1964. Gas chromatography with micro-coulometric detection for pesticide residue analysis. .A.O .A.iC.47, 845.
Carlin, A. F., E. T. Hibbs and P. A. Dahm. 1966. Insecticide residues and sensory evaluation of canned and frozen snap beans field- sprayed with guthion and DDT. .J. Food Tech. 20, 80.
Claborn, H. V. and R. W. Wells. 1952. Methoxychlor, DDT, CS-708 and dieldrin — their rates of excretion in milk. Agr. Chem. 7, (10), 28.
Coffin, E. E. and W. P. McKinley. 1963. Determination of parathion, methyl parathion, epm, and their oxons in some fruit and^vege- table crops. «J.A.0_.A.C_. 46, 223. ^
Elkins, E. R., F. C. Lamb, R. P. Farrow, R. W. Cook, M. Kawai andj V^RV-Kimball. 1968. Removal of DDT, malathion, and carbarylufrom_ green beans by commercial and home preparative procedures.
° Agri. and FoSd Chem. 1 6 9 6 2 .
Ely, R. E., L. A. Moore, R. H. Carter, P. E. Hubanks and F. W. Poos. 1954. Excretion of dieldrin in the milk of cows fed dieldrin- sprayed forage and technical dieldrin. J_. Dairy Sci. 37, 1461.

Farrow, R. P., E. R. Elkins, Jr. and R. W. Cook. 1966. Conversion of DDT to TDE in canned spinach. Agri. and Food Chem. 14, 430.
Farrow, R. P., F. C. Lamb, R. W. Cook, J. R. Kimball and E. R. Elkins. 1968. Removal of DDT, malathion, and carbaryl from tomatoes by commercial and home preparative methods. Agri. and Food Chem.16, 65.
Fleck, E. E. and H. L. Haller. 1946. Stability of DDT and related compounds. .J. Am. Chem. Soc. 68, 142.
Gannon, N., R. P. Link and G. C. Decker. 1959. Storage of dieldrin in tissues and its excretion in milk of dairy cows fed dieldrin in their diets. Agri. and Food Chem. 7, 824.
Giuffrida, L. and F. Ives. 1964. Investigation of two gas chromatographic techniques for the determination of organophosphate pesticide residues. J.A.().A.C_. 47, 1112.
Glotfelty, D. E. and J. H. Caro. 1970. Artifacts of dieldrin in gas chromatographic analysis of green plant material. Anal. Chem.42, 282.
Gorbach, S. and U. Wagner. 1967. Pentachloronitrobenzene residues in potatoes. Agri. and Food Chem. 15, 654.
Hallab, A. H. 1968. Detoxification of pesticidal residues in fishand shellfish. A Ph.D. dissertation. Louisiana State University, Baton Rouge.
Harris, J. R., G. E. Stoddard, G. Q. Bateman, J. L. Shupe, D. A. Greenwood, L. E. Harris, T. L. Bahler and F. V. Liebermann.1956. Effect of feeding dieldrin- and heptachlor-treated alfalfa hay to dairy cows. Agri. and Food Chem. 4, 694.
Hemphill, D. D., R. E. Baldwin, A. Deguzman and H. K. Deloach. 1967. Effects of washing, trimming, and cooking on levels of DDT and derivatives in green beans. Agri. and Food Chem. 15, 290.
Henderson, G. L. and D. G. Crosby. 1968. The photodecomposition of dieldrin residues in water. Bull, of Environ. Contam. and Toxicology. 3, 131.
Ives, N. F. and L. Giuffrida. 1967. Investigation of thermionic detector response for the gas chromatography of P, N, As, and Cl organic compounds. J .A.O .A.C . 50, 1.
Kilgore, L. and F. Windham. 1970. Disappearance of malathion residue in broccoli during cooking and freezing. Agri. and Food Chem.18, 162.

53
Lamb, F. C., R. P. Farrow, E. R. Elkins, R. W. Cook and J. R. Kimball.1968. Behavior of DDT in potatoes during commercial and homepreparation. Agri. and Food Chem. 16, 272.
Lamb, F. C., R. P. Farrow, E. R. Elkins, J. R. Kimball and R. W. Cook.1968. Removal of DDT, parathion, and carbaryl from spinach by commercial and home preparative methods. Agri. and Food Chem.16, 967.
Langois, B. E., A. R. Stemp and B. J. Liska. 1964. Rapid cleanup of dairy products for analysis of chlorinated insecticide residue by electron capture gas chromatography. Agri. and Food Chem.12, 243.
Lovelock, J. E. and S. R. Lipsky. 1960. Electron affinity spectroscopy- a new method for the identification of functional groups in chemical compounds separated by gas chromatography. jJ. Am. Chem. Soc. 82, 431.
Mattick, L. R., D. L. Barry, F. M. Antenucci and A. W. Avens. 1963.The disappearance of endrin residues on cabbage. Agri. and Food Chem. 11, 54.
Morley, H. V. and M. Chiba. 1964. Thin-layer chromatography forchlorinated pesticide residue analysis without cleanup. ^*A.().A.£. 47, 306.
Morris, W. W., Jr. and E. 0. Haenni. 1963. Infrared spectra of pesticides. J.A.O.A.C. 46, 964.
Payne, W. R., Jr. and W. S. Cox. 1966. Micro-infrared analysis of dieldrin, endrin, and other chlorinated pesticide residues in complex substrates. J/A.CLA.C^ 49, 989.
Saha, J. G., M. A. Nielsen and A. K. Sumner. 1970. Effect of commercial processing techniques on lindane- and DDT- l^C residues in rapeseed oil. Agri. and Food Chem. 18, 43.
Schmit, J. A., U. J. Peters and M. A. Loskaris. 1963. A rapid method for the determination of pesticide residues in tomatoes and tomato products. Presented at Annual Meeting of the AOAC. Washington, D. C.
Snedecor, G. W. 1967. Statistical methods. 5th Edition. Iowa State University Press.
Susi, H. and H. E. Rector. 1958. Quantitative infrared analysis of pesticides in the solid state. Anal. Chem. 30, 1933.

Watts, J. 0. and A. K. Klein. 1962. Determination of chlorinated pesticide residues by electron-capture gas chromatography. J.A.O.A.C. 45, 102.
Weiss, J. 1952. Chemical dosimetry using ferrous and eerie sulfates. Nucleonics. 10, 28.
Westlake, A., W. E. Westlake and F. A. Gunther. 1970. Determination of Residues of GC-9160 in Cabbage, Lettuce, and Citrus Fruit. Agri. and Food Chem. 18, 159.

APPENDIX
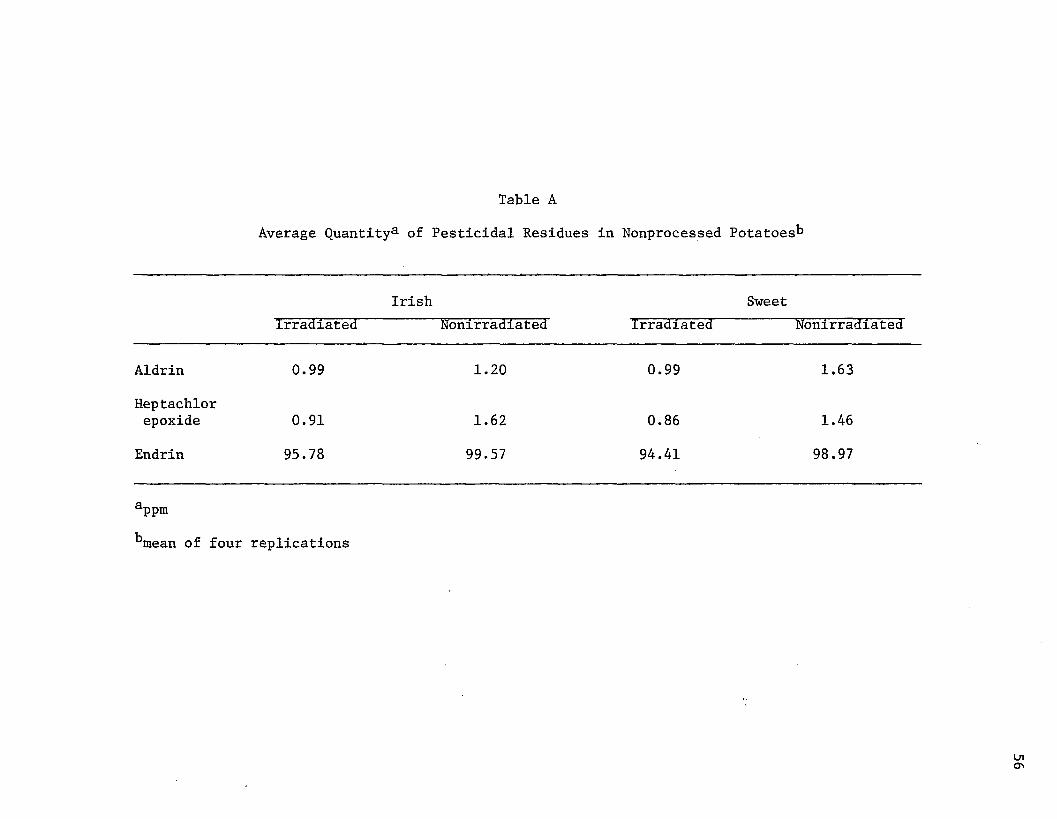
Table A
Average Quantity3 of Pesticidal Residues in Nonprocessed Potatoes^
Irish SweetIrradiated Nonirradiated Irradiated Nonirradiated
Aldrin 0.99 1.20 0.99 1.63
Heptachlorepoxide 0.91 1.62 0.86 1.46
Endrin 95.78 99.57 94.41 98.97
appm
^mean of four replications

Table B
Quantities3 of Pesticidal Residues in Irish Potatoes, 0 weeks Storage^3
Irradiated Nonirradiated[Heat Processed Frozen Heat Processed Frozen
Water No water Blanched Unblanched Water No water Blanched Unblanched
Aldrin 0.95 0.40 0.56 0.31 0.36 0.15 0.27 0.28Heptachlorepoxide 0.34 0.28 0.19 0.15 0.21 0.06 0.44 0.50
Endrin ? 24.12 3.05 41.10 31.35 26.95 26.68 49.48 _ 79.83
appm
^mean of four replications
Ui*^J

Table CI
Quantities3 of Pesticidal Residues in Irish Potatoes, 6 Weeks Storage*5
i; Irradiated Nonirradiated1- Heat Processed Frozen Heat Processed Frozen
r Water No water Blanched Unblanched Water No water Blanched Unblanched
Aldrin 0.42 0.51 0.67 0.72 0.32 0.55 0.38 0.26c*
Heptachlorepoxide ' 0.00 0.17 0.33 0.48 0.19 0.42 0.31 0.51
Endrin 25.46 23.37 43.02 61.48 41.89 35.74 64.01 66.72
appm
bmean of four replications
Ln00

c Table D
Quantities3 of Pesticidal Residues in Irish Potatoes, 12 Weeks Storage^
Irradiated Nonirradiated
Heat Processed Frozen Heat Processed Frozen
Water No water Blanched Unblanched Water No water Blanched Unblanched
Aldrin 0.78 0.66 0.00 1.07 0.00 0.00 0.00 0.00
Heptachlorepoxide 0.54 0.66 0.27 1.49 0.37 0.18 0.23 0.50
Endrin 46.91 44.39 7.50 57.15 7.04 1.24 1.63 7.61
appm
^mean of four replications

Table Ea
Quantities3 of Pesticidal Residues in Sweet Potatoes, 0 Weeks Storage*3
Irradiated Nonirradiated
Heat Processed Frozen Heat Processed Frozen
Water No water Blanched Unblanched Water No water Blanched Unblanched
Aldrin 0.71 0.31 0.03 0.70 0.46 0.00 0.00 0.13
Heptachlorepoxide 0.37 0.29 1.13 0.58 0.26 0.00 0.33 0.55
Endrin 50.80 30.57 74.96 69.00 42.51 31.26 36.16 60.53
appm
kmean of four replications

Table F
Quantities3 of Pesticidal Residues in Sweet Potatoes, 6 Weeks Storage^3
Irradiated Nonirradiated
Heat Processed Frozen Heat Processed Frozen
Water No water Blanched Unblanched Water No water Blanched Unblanched
Aldrin 0.40 0.33 0.55 0.00 1.24 0.00 0.00 0.00
Heptachlorepoxide 0.50 0.39 0.69 0.43 0.61 0.61 0.58 0.53
Endrin 36.14 34.84 52.02 41.32 63.97 58.01 54.96 64.16
appm
Wiean of four replications

Table G
Quantities3 of Pesticidal Residues in Sweet Potatoes, 12 Weeks Storage*5
Irradiated Nonirradiated
Heat Processed Frozen Heat Processed Frozen
Water No water Blanched Unblanched Water No water Blanched Unblanched
Aldrin 0.00 0.93 0.15 0.08 0.00 0.00 0.00 0.00
Heptachlorepoxide 0.43 0.60 0.57 0.27 0.35 0.00 0.51 0.37
Endrin 2.00 89.33 57.66 41.39 21.17 69.24 53.89 30.14
appm
bmean of four replications

Table H
Analysis of Variance of Aldrin in Nonprocessed and Irradiated Potatoes
SourceDegrees of Freedom
Sum of Squares
MeanSquares F
Total 15 1.1671
Potatoes 1 0.1771 0.1771 27.2307**
Irradiation 1 0.7260 0.7260 111.6923**
Potatoes x Irradiation 1 0.1854 0.1854 28.5230**
Error 12 0.0786 0.0065
**P<0.01
o\Ld

Table I
Analysis of Variance of Heptachlor Epoxide in Nonprocessedand Irradiated Potatoes
SourceDegrees of Freedom
Sum of Squares
MeanSquares F
Total 15 1.8539
Potatoes 1 0.0411 0.0411 5,9600**
Irradiation 1 1.7170 1.7170 247.8000**
Potatoes x Irradiation 1 0.0124 0.0124 1.75
<.
Error 12 0.0833 0.0069
**P <0.01
O'■P*

Table J
Analysis of Variance of Endrin in Nonprocessed and Irradiated Potatoes
SourceDegrees of Freedom
Sum of Squares
MeanSquares
Total
Potatoes
Irradiation
Potatoes x Irradiation
Error
15
1
1
1
12
0.0148
0.0004
0.0070
0.00010.0209
0.00120.0004
0.0070
0.00010.0017
0.2352
4.1176
0.0588

66
Table K
Analysis of Variance of Aldrin in Processed Potatoes
SourceDegrees i Freedom
of Sum of Squares
MeanSquares F
Total 191 28.5421
Weeks 2 0.9213 0.4607 9.1590**Potatoes 1 1.0049 1.0049 19.9781**
Weeks x Potatoes 2 0.0927 0.0471 0.9363Irradiation 1 4.3724 4.3724 86.9624**Potatoes x
Irradiation 1 0.3314 0.3314 6.5884**
Weeks x Irradiation 2 1.0911 0.5456 10.8469**
Weeks x Potatoes x Irradiation 2 0.3878 0.1939 3.5848*
Process 3 1.3534 0.4511 8.9681**
Irradiation x Process 3 0.5235 0.1745 3.4691*
Potato x Process 3 0.5614 0.1871 3.7196*
Potato x Process x Irradiation 3 1.6610 0.5537 11.0079**
Weeks x Process 6 2.3798 0.3966 7.8846**
Weeks x Irradiation x Process &
G- ” *6 2.0654 W 0.34&
a6.-8429**
Wjeks x Potatoes x Process 6 3.2568 0.5428 10.7912**
Weeks x Potatoes x Irradiation x Process 6 1.2815 0.2136 4.2465**
Error 144 7.2558 0.0503
*P <0.05 **P <0.01

67
Table L
Analysis of Variance of Heptachlor Epoxide in Processed Potatoes
SourceDegrees of Freedom
Sum of Squares
MeanSquares F
Total 191 28.0117
Weeks 2 0.3526 0.1763 1.6790
Potatoes 1 0.3732 0.3732 3.5542
Weeks x Potatoes 2 1.3354 0.6677 6.3590**
Irradiation 1 0.5273 0.5273 5.0228*
Potatoes x Irradiation 1 0.0250 0.0250 0.0238
Weeks x Irradiation 2 1.1995 0.5998 5.7123**
Weeks x Potatoes x Irradiation 2 0.7954 0.3977 3.7876*
Process 3 0.1544 0.0515 0.4904
Irradiation x Process 3 0.1679 0.0560 0.5333
Potato x Process 3 0.1536 0.5119 4.8752**
Potato x Process x Irradiation 3 0.6304 0.2101 2.0009
Weeks x Process 6 0.8546 0.1424 1.3561
Weeks x Irradiation x Process 6 1.1889 0.1981 1.8876
Weeks x Potatoes x Process 6 1.3058 0.2176 2.0723
Weeks x Potatoes x Irradiation x Process 6 1.0398 0.1733 1.6504
Error 144 15.1360 0.1050
*P <0.05**P< 0.01

68
Table M
Analysis of Variancfe of Endrin in Processed Potatoes
SourceDegrees of Freedom
Sum of Squares
MeanSquares F
Total 191 1090.1030Weeks 2 66.4575 33.2287 26.9123**
Potatoes 1 101.1044 101.1044 81.8858**
Weeks x Potatoes 2 27.3490 13.6745 11.0751**
Irradiation 1 0.0309 0.0309 0.0250
Potatoes x Irradiation 1 0.0317 0.0317 0.0256
Weeks x Irradiation 2 104.9619 52.4810 42.5050**
Weeks x Potatoes x Irradiation 2 86.5080 43.2540 35.0319**
Process 3 95.1759 31-7253 25.6946**
Irradiation x Process 3 2.1507 0.7169 0.5806
Potato x Process 3 62.4314 20.8105 16.8547**
Potato x Process x Irradiation 3 25.3339 8.4447 6.8394**
Weeks x Process 6 160.8501 26.8083 21.7123**
Weeks x Irradiation x Process 6 52.1868 8.6978 7.0444**
Weeks x Potatoes x Process 6 114.6609 19.1101 15.4775**
Weeks x Potatoes x Irradiation x Process 6 13.0580 2.1763 1.7026
Error 144 177.8093 1.2347
**P <0.01

69
Table N
Orthogonal Comparisons of Effects of Storage on Aldrin
SourceDegrees of Freedom
MeanSquares F
1 vs. 2, 3 1 0.0286 0.5685
2 vs. 3 1 0.8944 12.0258**
Error 144 0.0503
**P <0.01
1 = 0 weeks storage2 = 6 weeks storage3 = 12 weeks storage
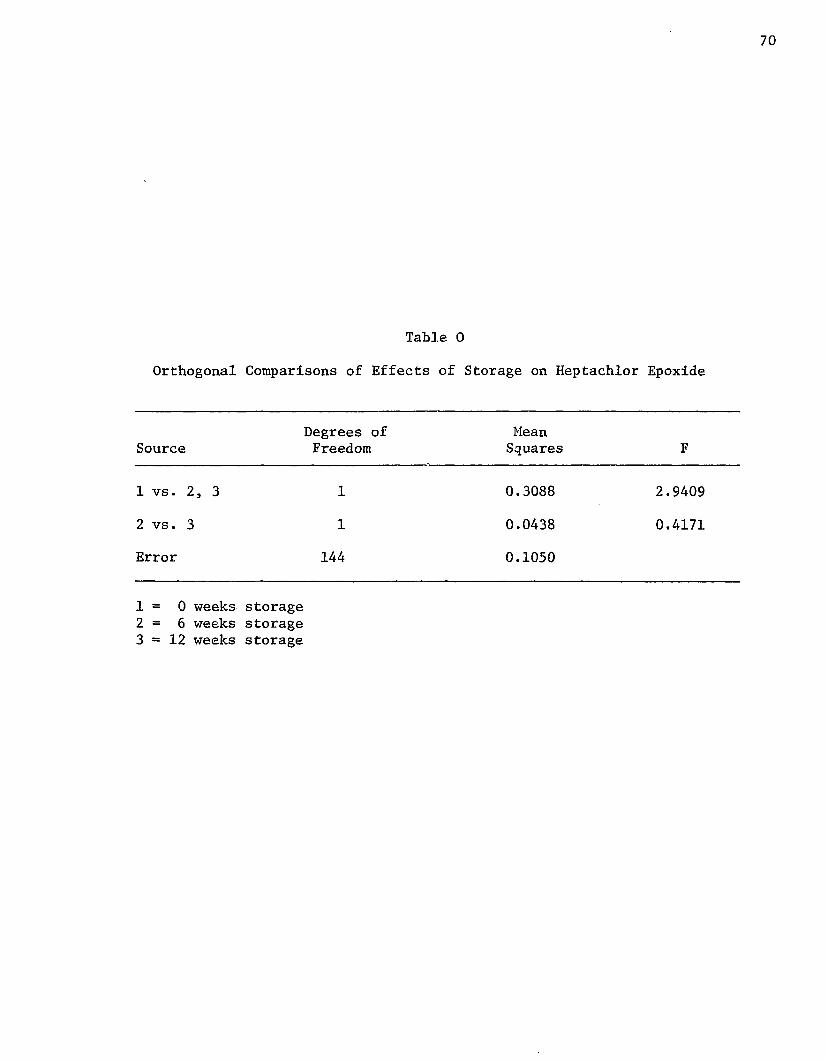
70
Table 0
Orthogonal Comparisons of Effects of Storage on Heptachlor Epoxide
SourceDegrees of Freedom
MeanSquares F
1 vs. 2, 3 1 0.3088 2.9409
2 vs. 3 1 0.0438 0.4171Error 144 0.1050
1 = 0 weeks storage2 = 6 weeks storage3 = 12 weeks storage

71
Table P
Orthogonal Comparisons of Effects of Storage on Endrin
SourceDegrees of Freedom
MeanSquares F
1 vs. 2, 3 1 6.3693 5.1585*
2 vs. 3 1 60.0882 48.6662**
Error 144 1.2347
*P <0.05 **P <0.01
1 = 0 weeks storage2 = 6 weeks storage3 = 12 weeks storage

72
Table Q
Orthogonal Comparisons of Effects of Processes on Aldrin
Degrees of MeanSource Freedom Squares F
1, 2 vs. 3, 4 1 0.7807 15.5208**
1 vs. 2 1 0.5353 10.6421**
3 vs. 4 1 0.0680 1.3518Error 144 0.0503
**P <0.011 = Heat processed with water2 = Heat processed without water3 = Blanched and frozen4 = Unblanched and frozen

73
Table R
Orthogonal Comparisons of Effects of Processes on Heptachlor Epoxide
SourceDegrees of Freedom
MeanSquares F
1, 2 vs. 3, 4 1 0.1403 1.3361
1 vs. 2 1 0.0045 0.0428
3 vs. 4 1 0.0098 0.0933Error 144 0.1050
1 = Heat processed with water2 = Heat processed without water3 = Blanched and frozen4 = Unblanched and frozen
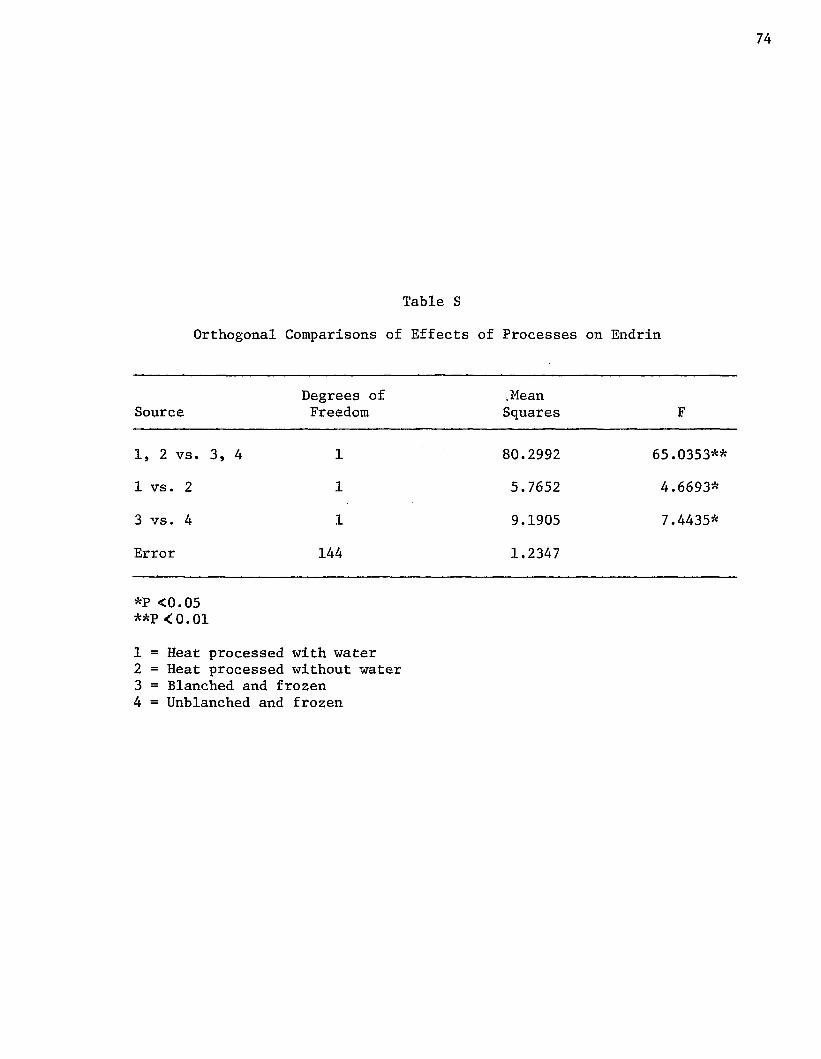
74
Table S
Orthogonal Comparisons of Effects of Processes on Endrin
SourceDegrees of Freedom
.MeanSquares F
1, 2 vs. 3, 4 1 80.2992 65.0353**1 vs. 2 1 5.7652 4.6693*
3 vs. 4 1 9.1905 7.4435*
Error 144 1.2347
*P <0.05 **P <0.01
1 = Heat processed with water2 = Heat processed without water3 = Blanched and frozen4 = Unblanched and frozen

75
VITA
James M. Solar, son of Mr. and Mrs. Henry J. Solar, Sr., was born
in Baton Rouge, Louisiana, on January 3, 1943. He was educated in the
parochial and public schools of Baton Rouge, Louisiana, and was gradu
ated from Istrouma Senior High School in 1960. In June of the same
year he entered Louisiana State University. After two years of study
he transferred to Southeastern Louisiana College and was graduated in
January, 1965 with a Bachelor of Science Degree in Biology. He remained
at Southeastern Louisiana College as a special student and a laboratory
instructor for one semester. In June, 1965, he entered the Department
of Food Science and Technology at Louisiana State University and was
granted a graduate assistantship. He received his Master of Science
degree in January, 1968. He is presently a candidate for the degree of
Doctor of Philosophy in Food Science with a minor in Foods and Nutrition.

EXAMINATION AND THESIS REPORT
Candidate: JAMES MICHAEL .SOLAR
Major Field: Food Science
Title of Thesis: Pesticidal Residue Alterations in Potatoes During Processing.
Approved:
yjp£>.Cj^ajor Professor and Chairman
/ -Dean of the Graduate School
EXAMINING COMMITTEE:
Date of Examination:
May 8, 1970