Embed Size (px)
Citation preview
Pesticide fate and climate: how are they linked?
James GarrattEnviresearch
Uppsala, 7 September 2016
Outline
• What is fate?• What is climate?• Basic processes• Indirect effects• Modelling the link• What really matters
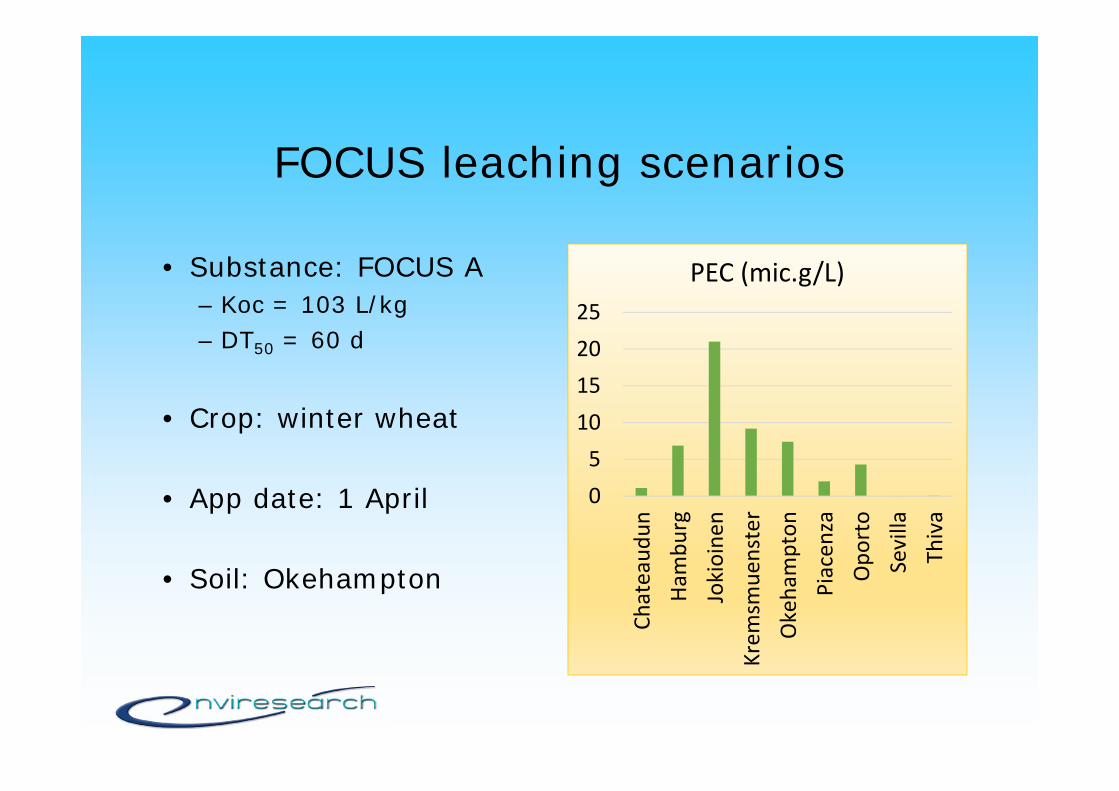
FOCUS leaching scenarios
• Substance: FOCUS A– Koc = 103 L/kg– DT50 = 60 d
• Crop: winter wheat
• App date: 1 April
• Soil: Okehampton
0510152025
Chateaud
unHa
mbu
rgJokioine
nKrem
smue
nster
Okehampton
Piacen
zaOpo
rto
Sevilla
Thiva
PEC (mic.g/L)
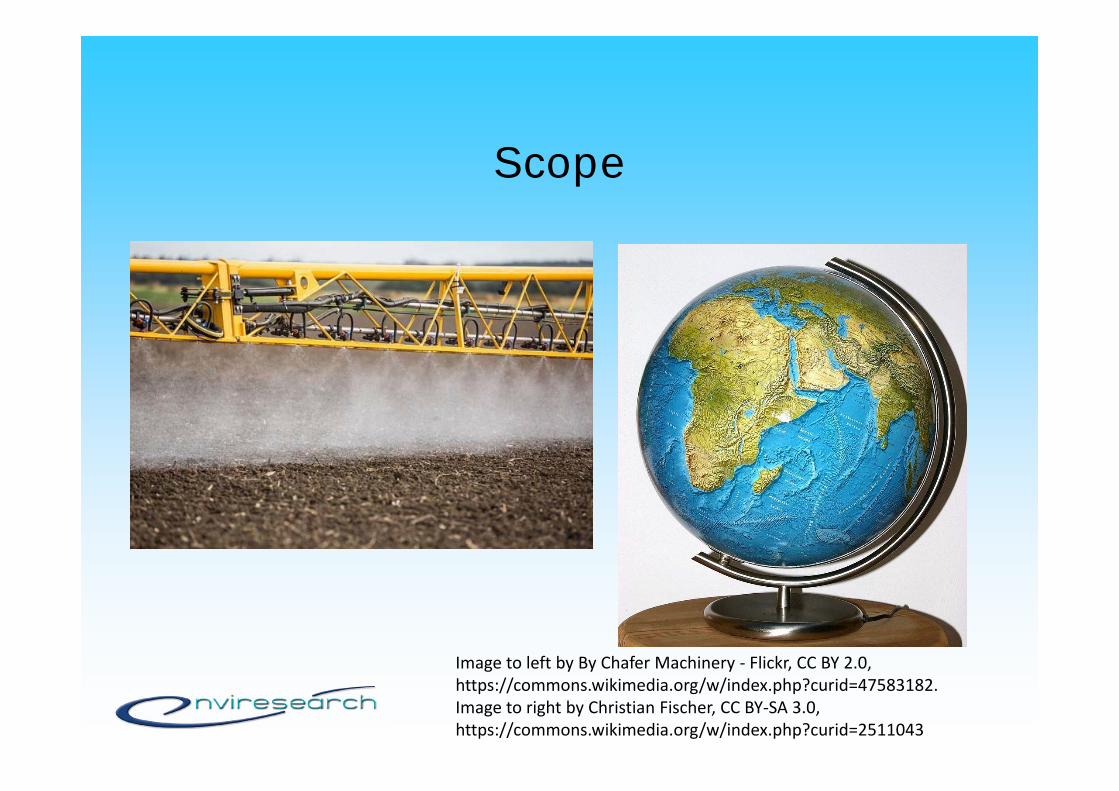
Scope
Image to left by By Chafer Machinery ‐ Flickr, CC BY 2.0, https://commons.wikimedia.org/w/index.php?curid=47583182.Image to right by Christian Fischer, CC BY‐SA 3.0, https://commons.wikimedia.org/w/index.php?curid=2511043
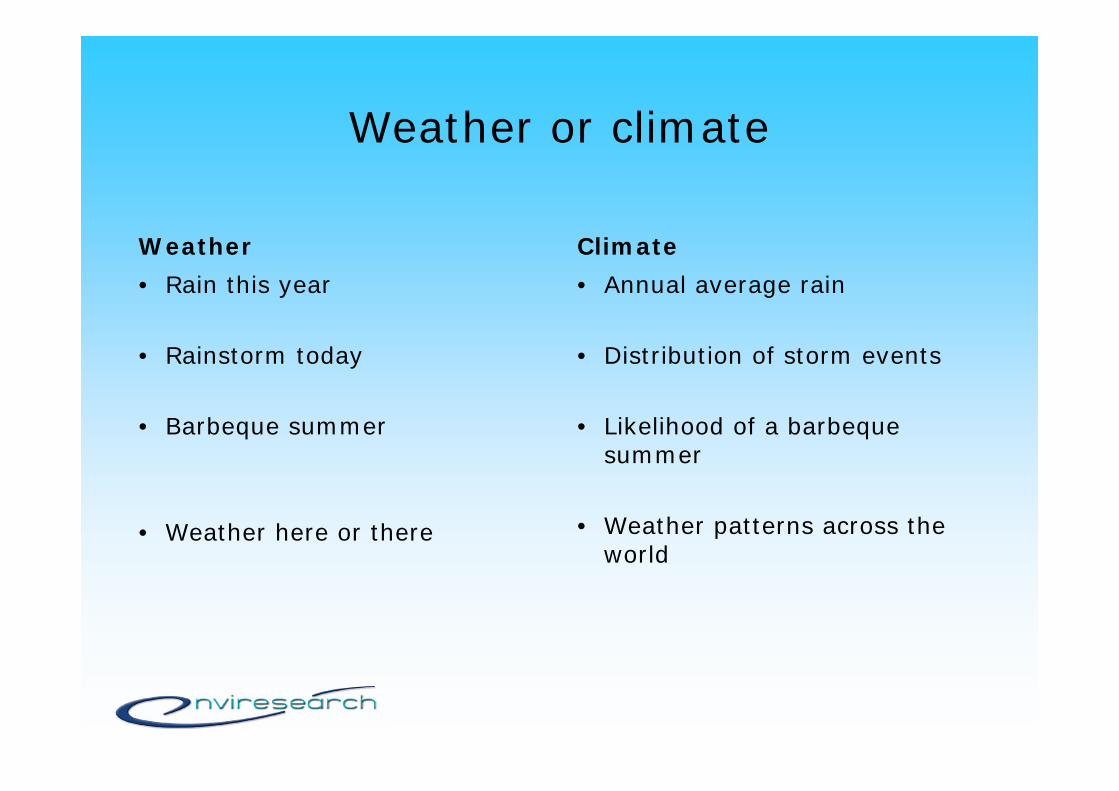
Weather or climate
Weather• Rain this year
• Rainstorm today
• Barbeque summer
• Weather here or there
Climate• Annual average rain
• Distribution of storm events
• Likelihood of a barbeque summer
• Weather patterns across the world
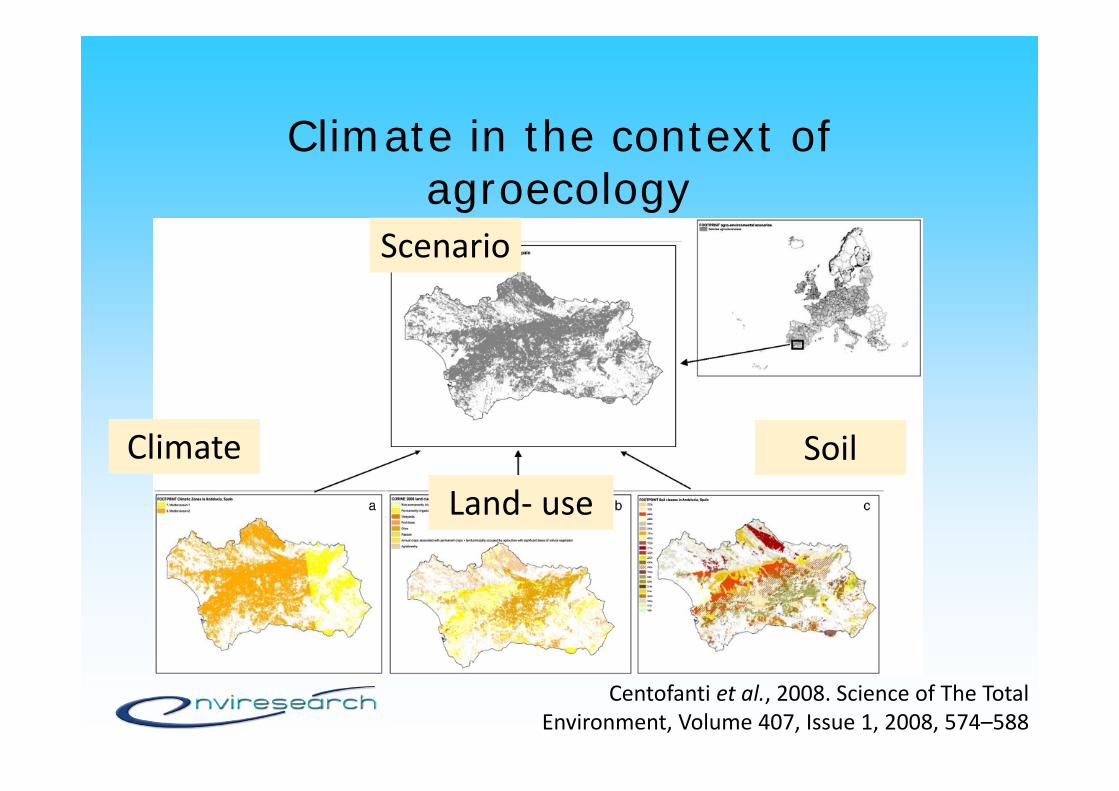
Climate in the context of agroecology
ClimateLand‐ use
Soil
Centofanti et al., 2008. Science of The Total Environment, Volume 407, Issue 1, 2008, 574–588
Scenario
Basic processes
• Partitioning
• Chemical transformation
• Flow
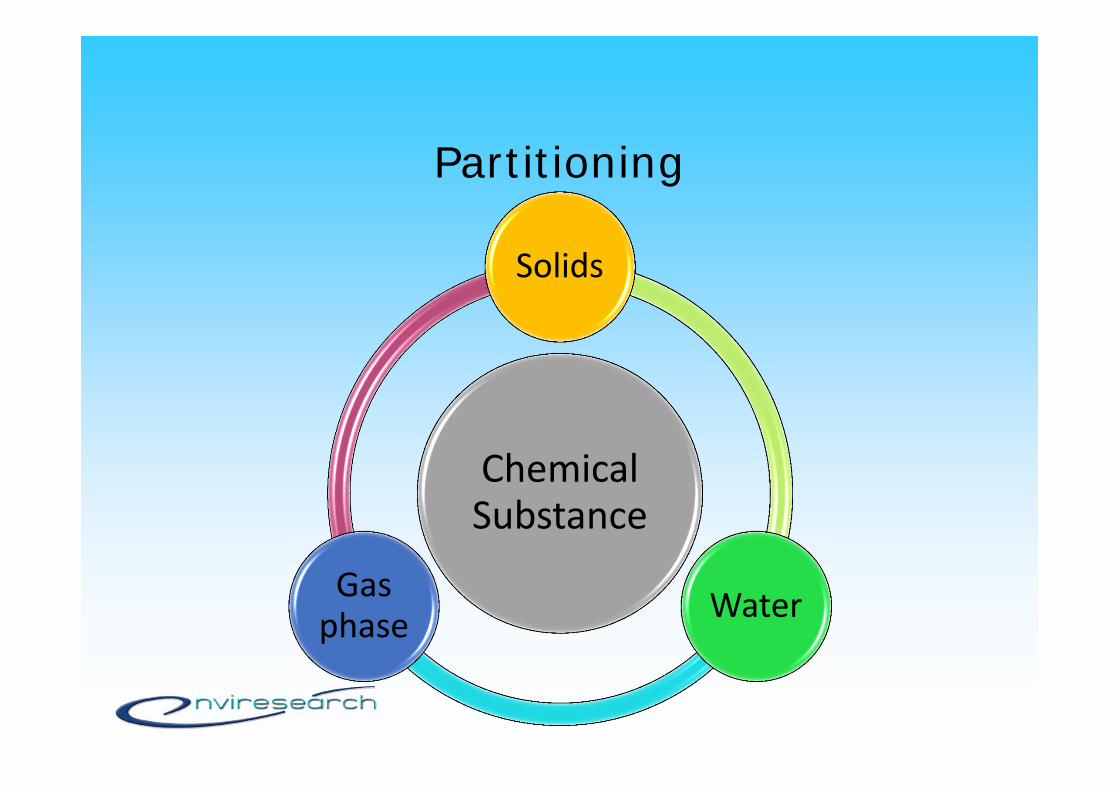
Partitioning
Chemical Substance
Solids
WaterGas phase
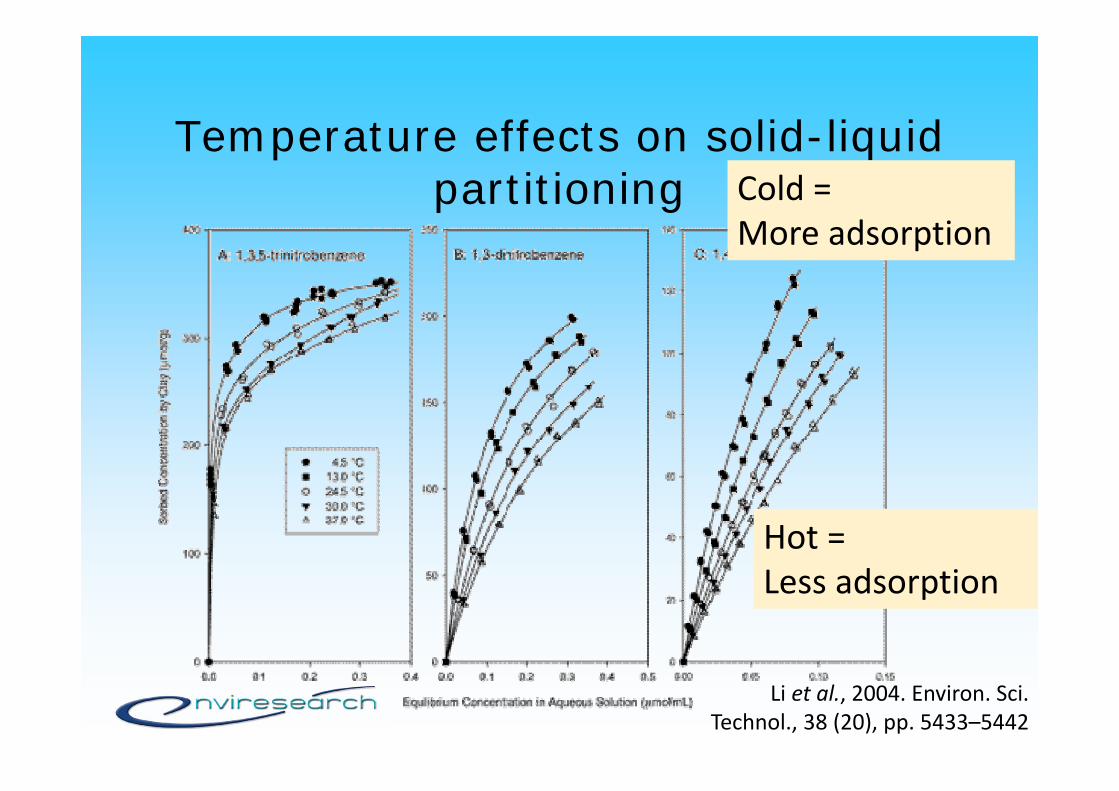
Temperature effects on solid-liquid partitioning Cold =
More adsorption
Hot =Less adsorption
Li et al., 2004. Environ. Sci. Technol., 38 (20), pp. 5433–5442
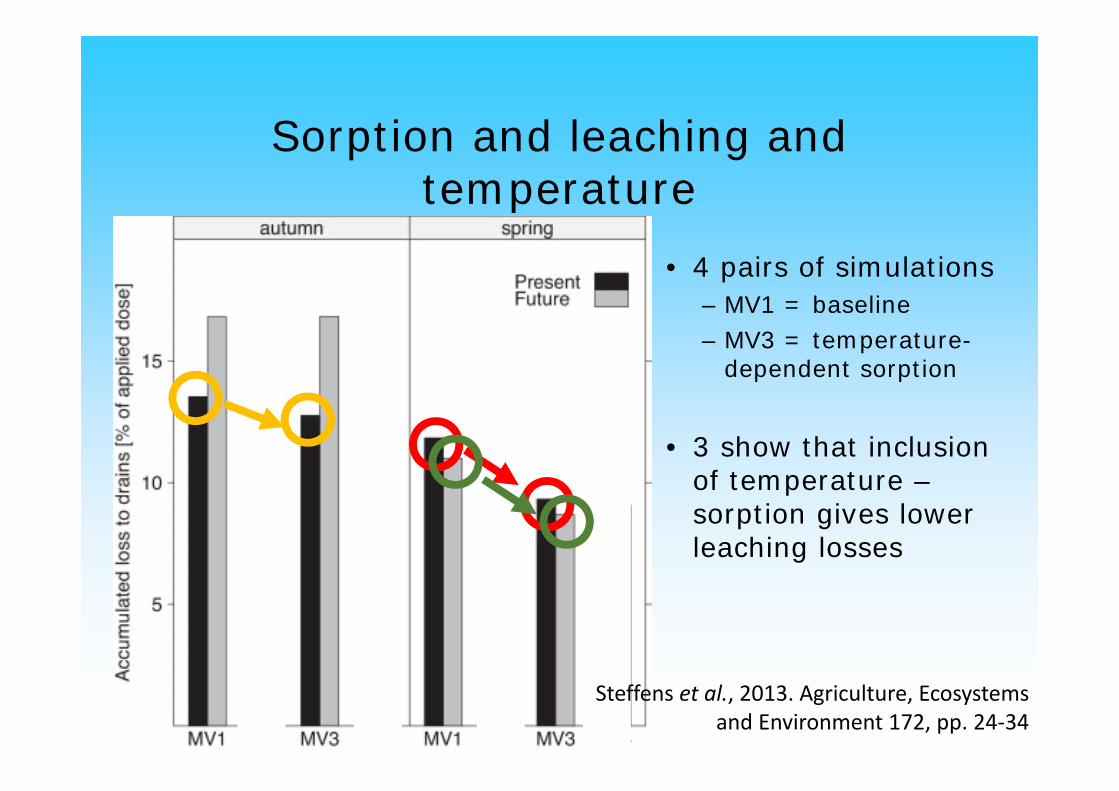
Sorption and leaching and temperature
• 4 pairs of simulations– MV1 = baseline– MV3 = temperature-
dependent sorption
• 3 show that inclusion of temperature –sorption gives lower leaching losses
Steffens et al., 2013. Agriculture, Ecosystemsand Environment 172, pp. 24‐34
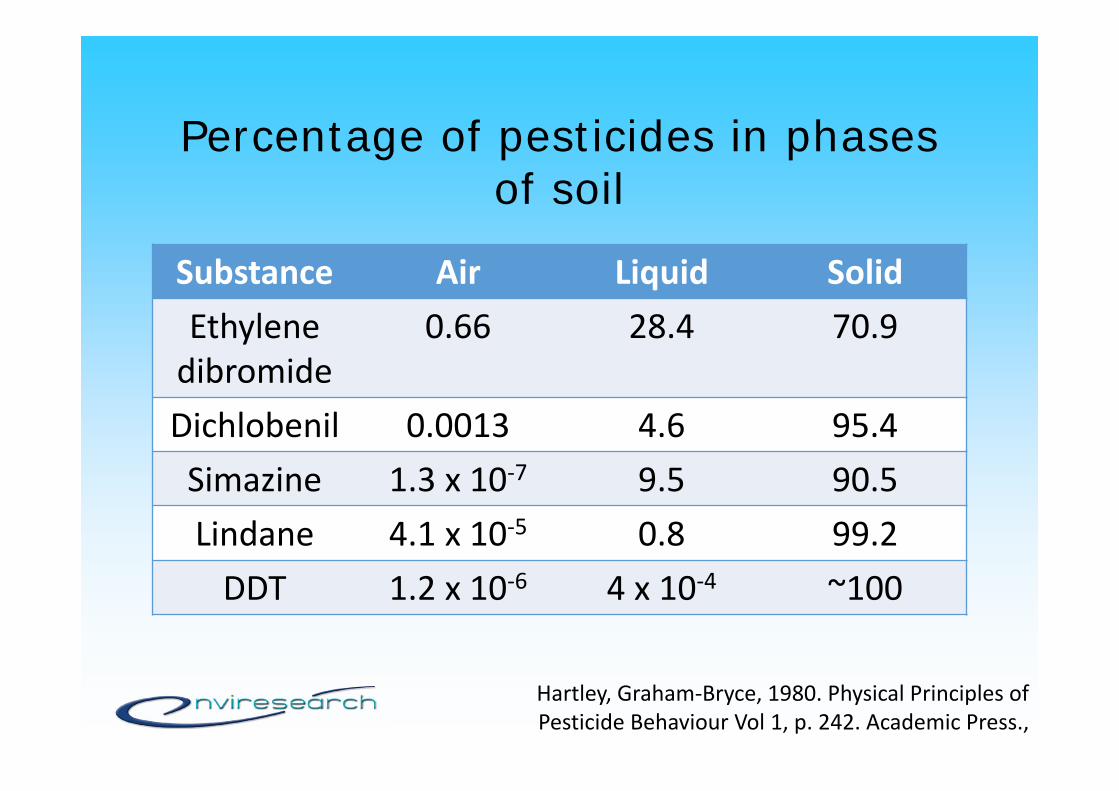
Percentage of pesticides in phases of soil
Substance Air Liquid SolidEthylene dibromide
0.66 28.4 70.9
Dichlobenil 0.0013 4.6 95.4Simazine 1.3 x 10‐7 9.5 90.5Lindane 4.1 x 10‐5 0.8 99.2DDT 1.2 x 10‐6 4 x 10‐4 ~100
Hartley, Graham‐Bryce, 1980. Physical Principles of Pesticide Behaviour Vol 1, p. 242. Academic Press.,
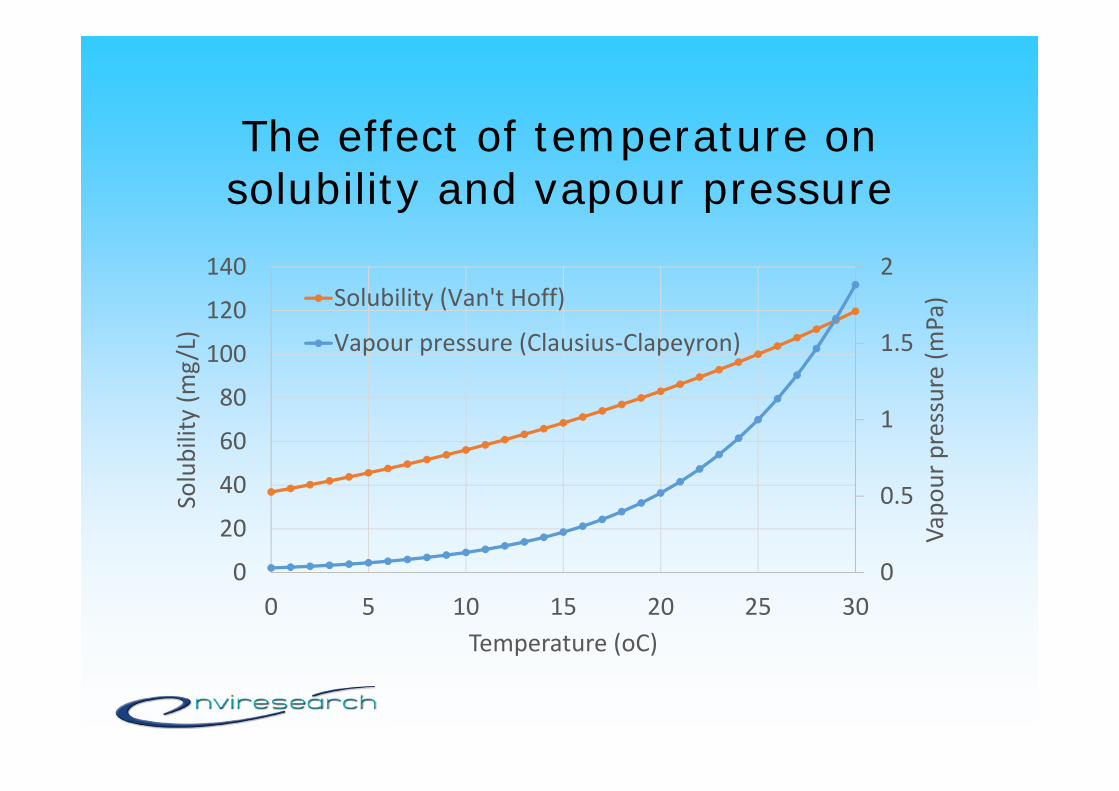
The effect of temperature on solubility and vapour pressure
0
0.5
1
1.5
2
0
20
40
60
80
100
120
140
0 5 10 15 20 25 30
Vapo
ur pressure (m
Pa)
Solubility (m
g/L)
Temperature (oC)
Solubility (Van't Hoff)
Vapour pressure (Clausius‐Clapeyron)
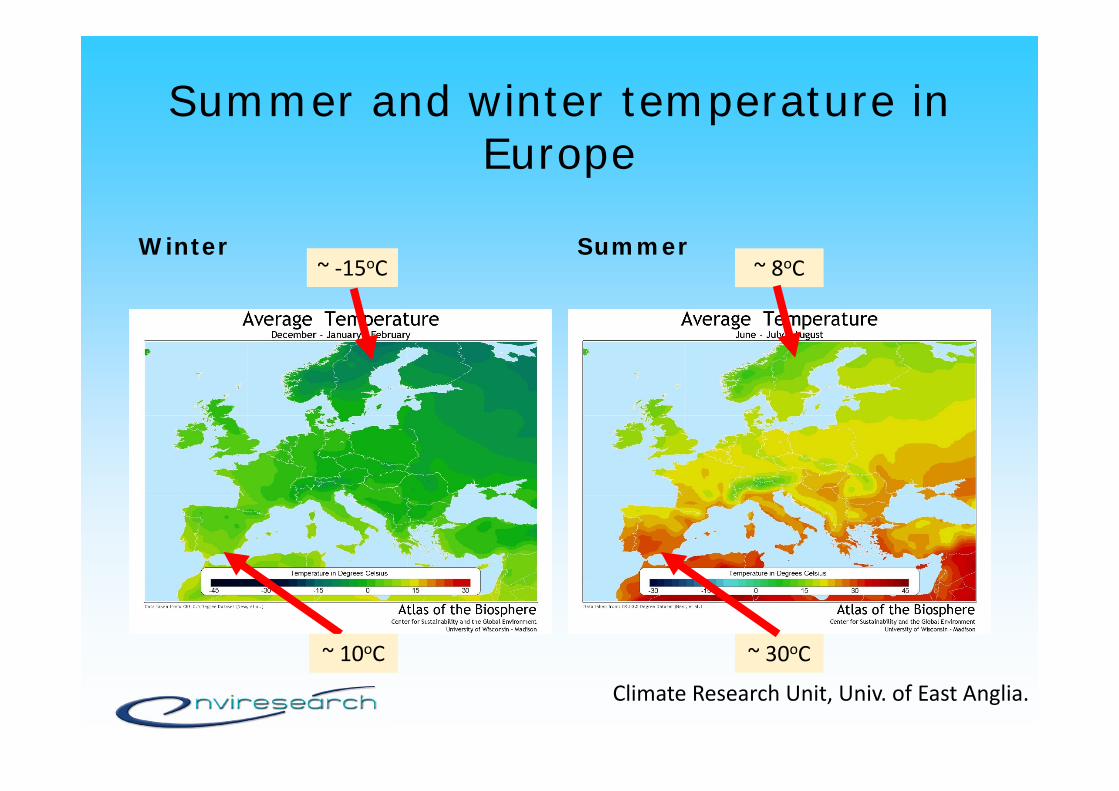
Summer and winter temperature in Europe
Winter Summer
~10oC ~ 30oC~ 10oC
~ 8oC~ ‐15oC
Climate Research Unit, Univ. of East Anglia.
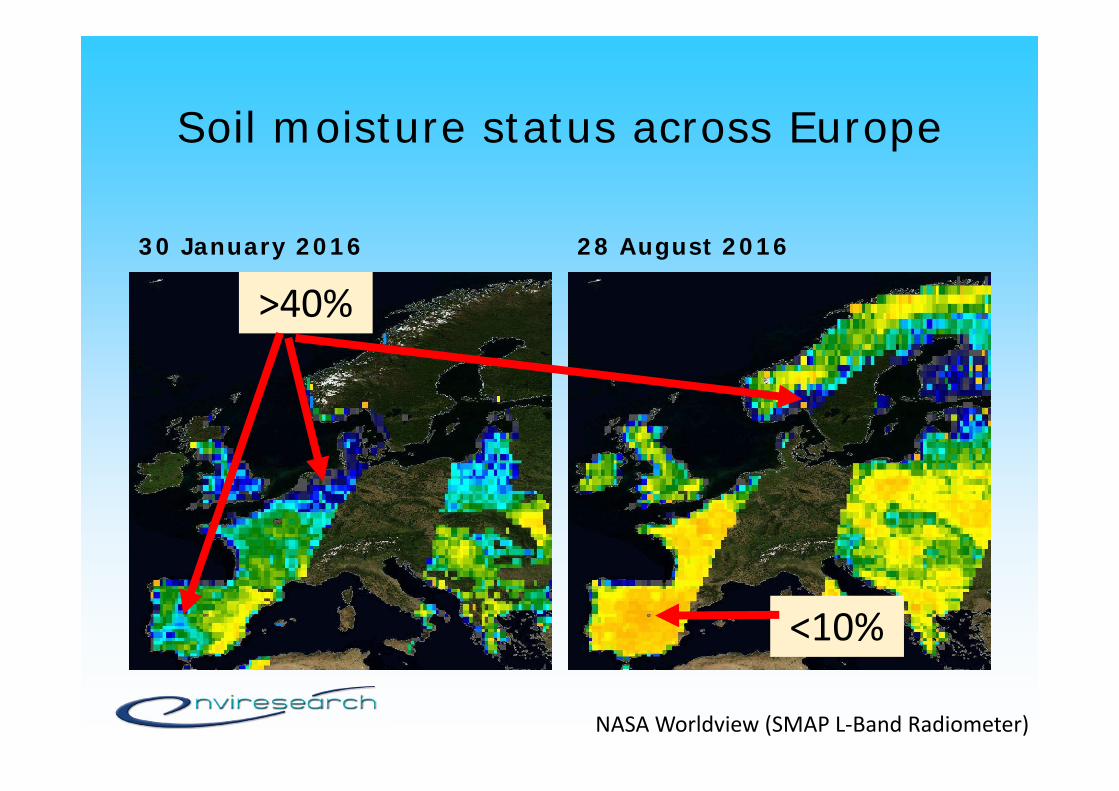
Soil moisture status across Europe
30 January 2016 28 August 2016
NASA Worldview (SMAP L‐Band Radiometer)
>40%
<10%
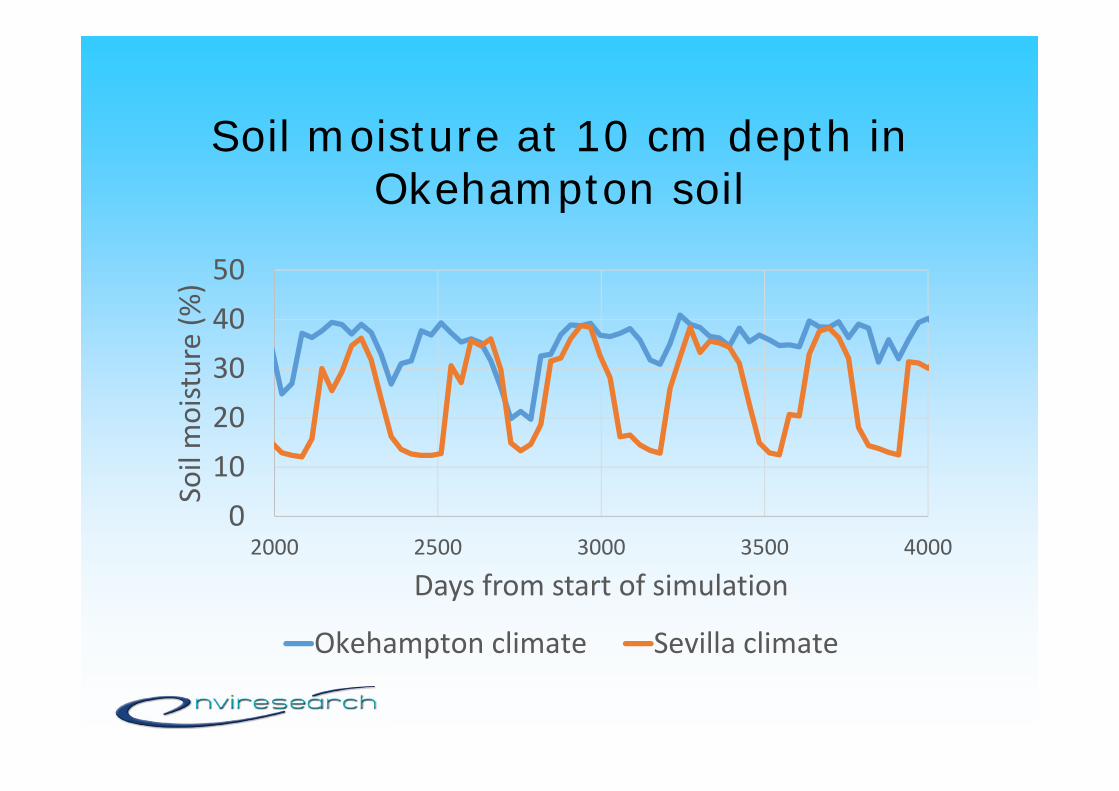
Soil moisture at 10 cm depth in Okehampton soil
01020304050
2000 2500 3000 3500 4000
Soil moisture (%
)
Days from start of simulation
Okehampton climate Sevilla climate
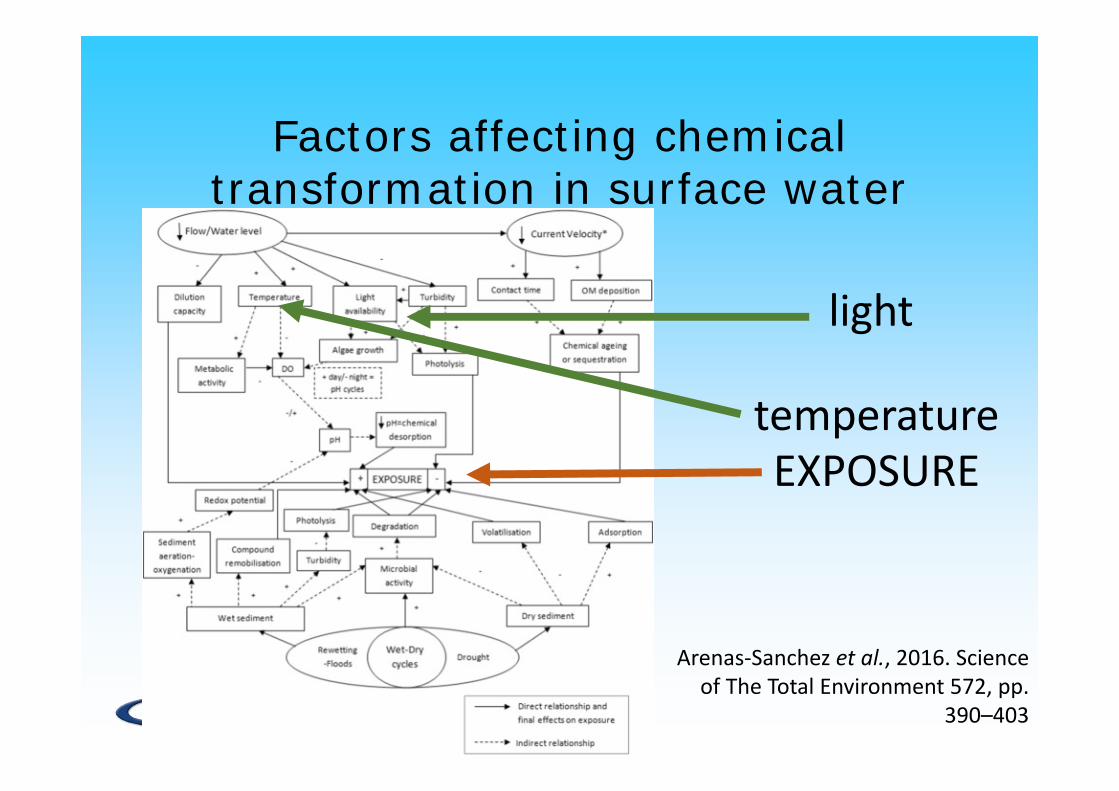
Factors affecting chemical transformation in surface water
light
temperatureEXPOSURE
Arenas‐Sanchez et al., 2016. Science of The Total Environment 572, pp.
390–403
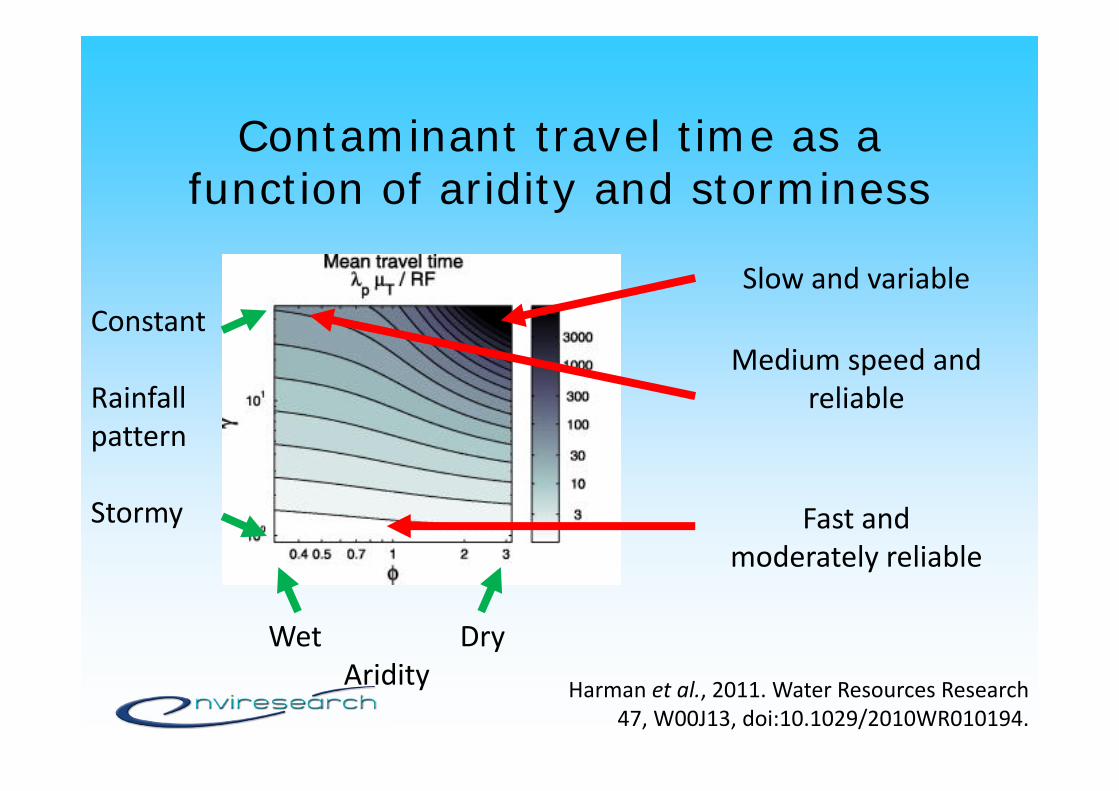
Contaminant travel time as a function of aridity and storminess
Wet DryAridity
Constant
Rainfallpattern
Stormy
Slow and variable
Medium speed and reliable
Fast and moderately reliable
Harman et al., 2011. Water Resources Research 47, W00J13, doi:10.1029/2010WR010194.
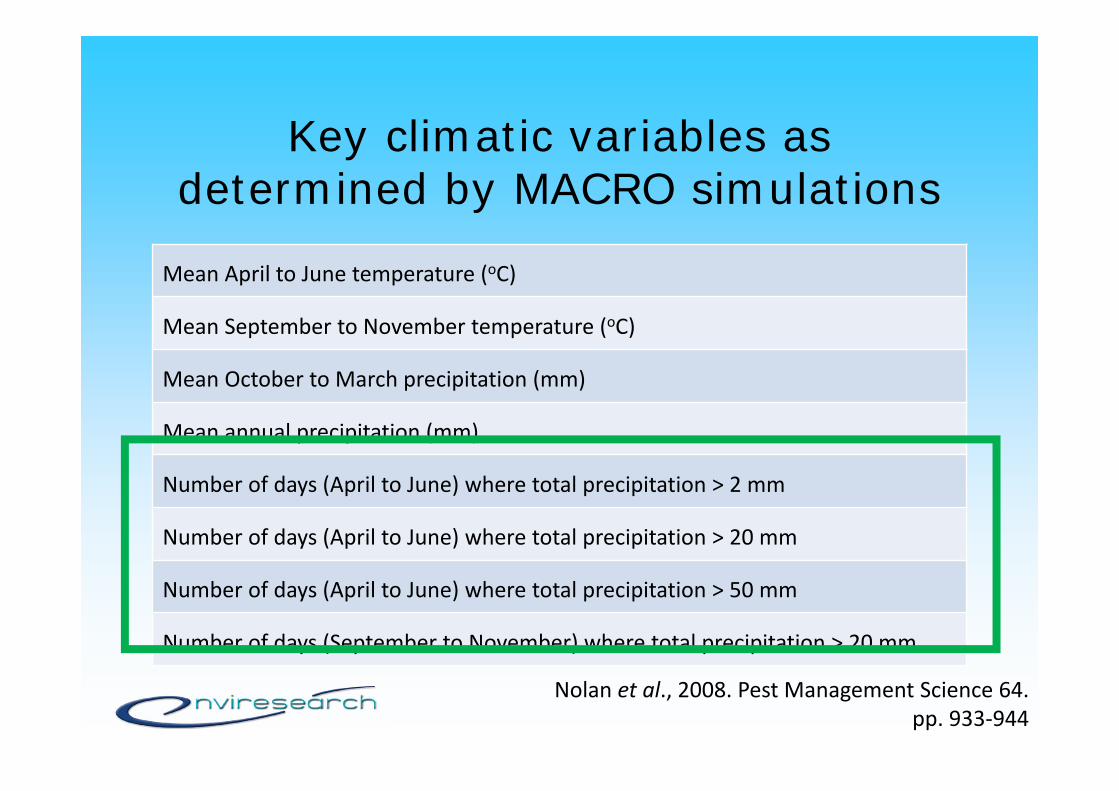
Key climatic variables as determined by MACRO simulations
Mean April to June temperature (oC)
Mean September to November temperature (oC)
Mean October to March precipitation (mm)
Mean annual precipitation (mm)
Number of days (April to June) where total precipitation > 2 mm
Number of days (April to June) where total precipitation > 20 mm
Number of days (April to June) where total precipitation > 50 mm
Number of days (September to November) where total precipitation > 20 mm
Nolan et al., 2008. Pest Management Science 64. pp. 933‐944
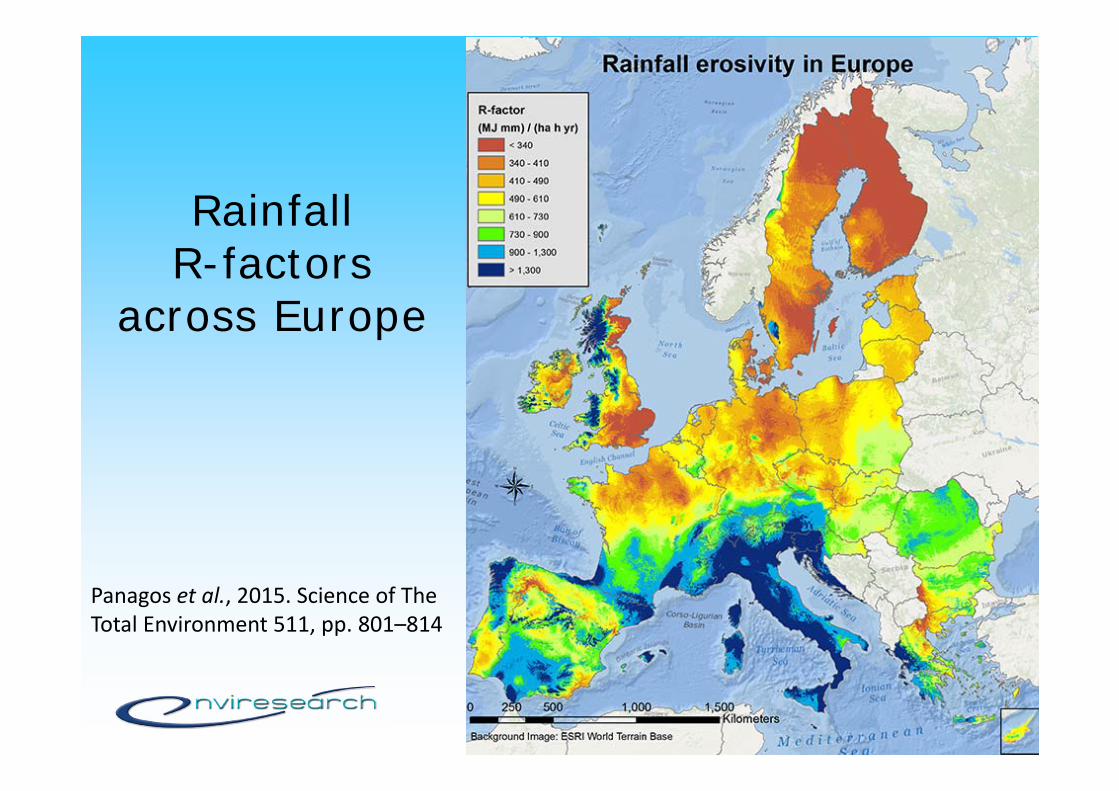
RainfallR-factors
across Europe
Panagos et al., 2015. Science of The Total Environment 511, pp. 801–814
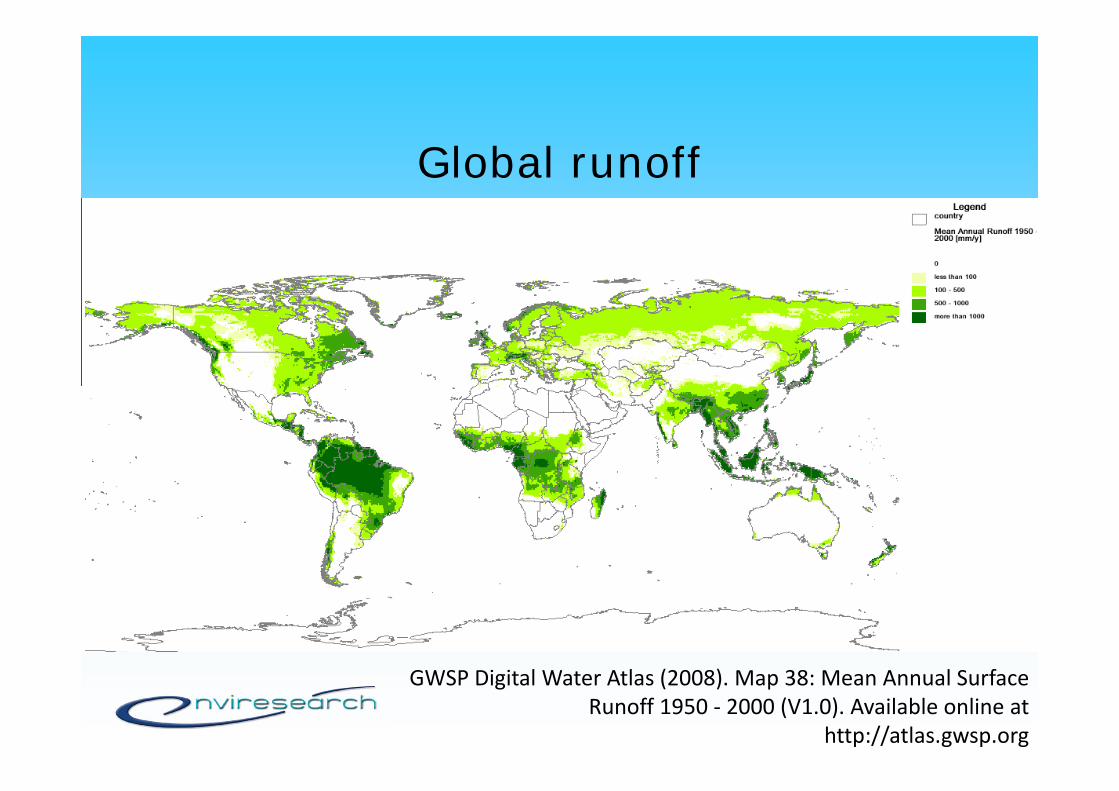
Global runoff
GWSP Digital Water Atlas (2008). Map 38: Mean Annual Surface Runoff 1950 ‐ 2000 (V1.0). Available online at
http://atlas.gwsp.org
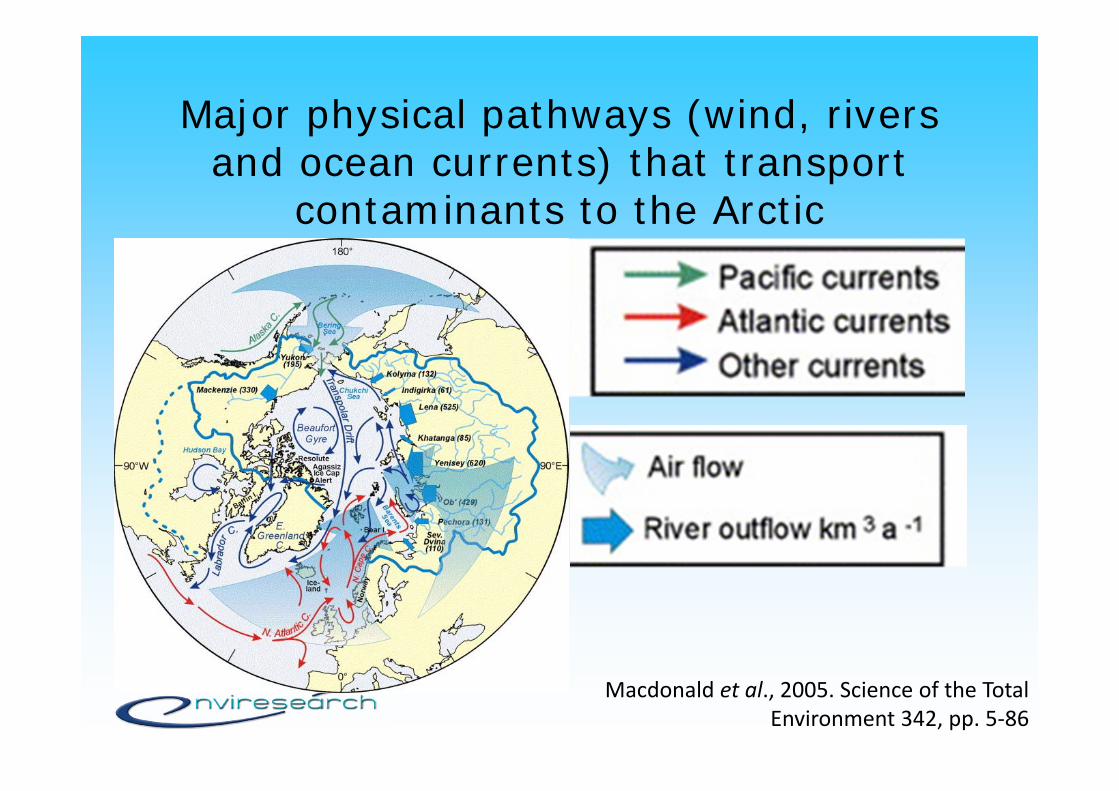
Major physical pathways (wind, rivers and ocean currents) that transport
contaminants to the Arctic
Macdonald et al., 2005. Science of the Total Environment 342, pp. 5‐86
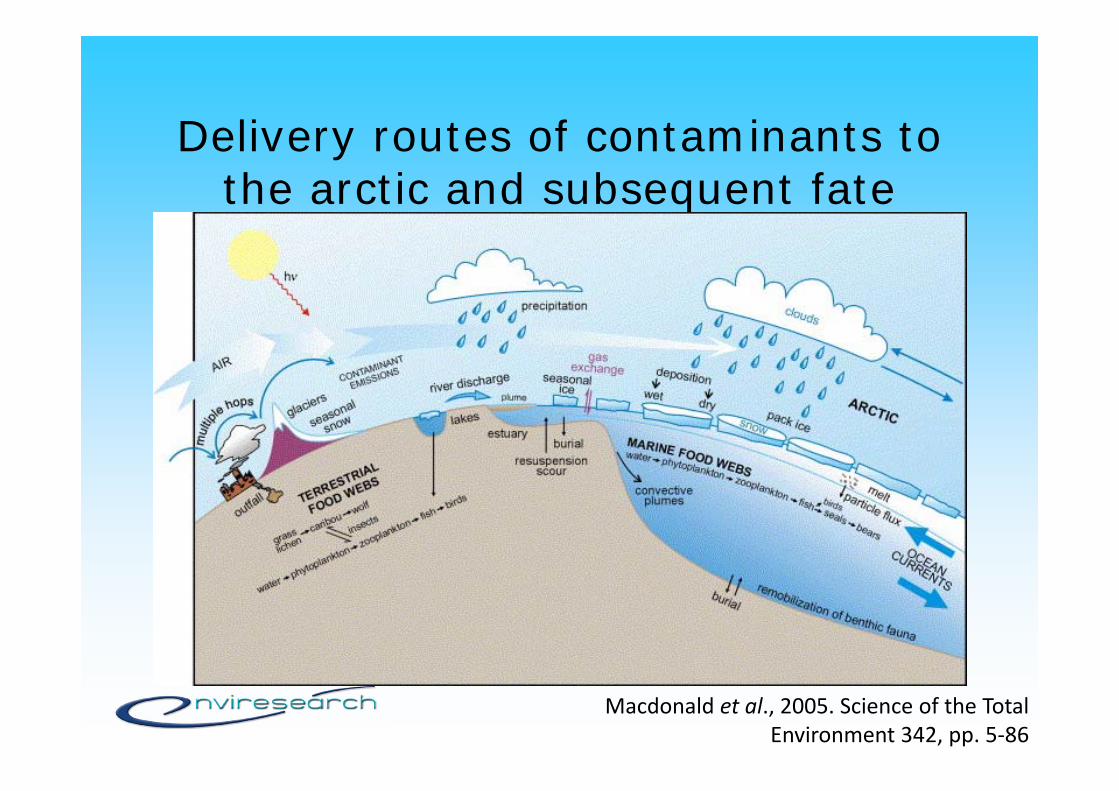
Delivery routes of contaminants to the arctic and subsequent fate
Macdonald et al., 2005. Science of the Total Environment 342, pp. 5‐86
Indirect impacts of climate
Main impacts• The decision to cultivate a
piece of land• The crop species• The cultivar• Irrigation• Selection of pesticide• Rate, timing and frequency of
pesticide use.
A collection of references• Chen & McCarl, 2001• Bloomfield et al., 2006• Boxall et al., 2009• Noyes et al., 2009• Tu, 2009• Kattwinkel et al., 2011• Wilson & Weng, 2011• Visser et al., 2012• Delcour et al., 2015• Gagnon et al., 2015• Steffens et al., 2015
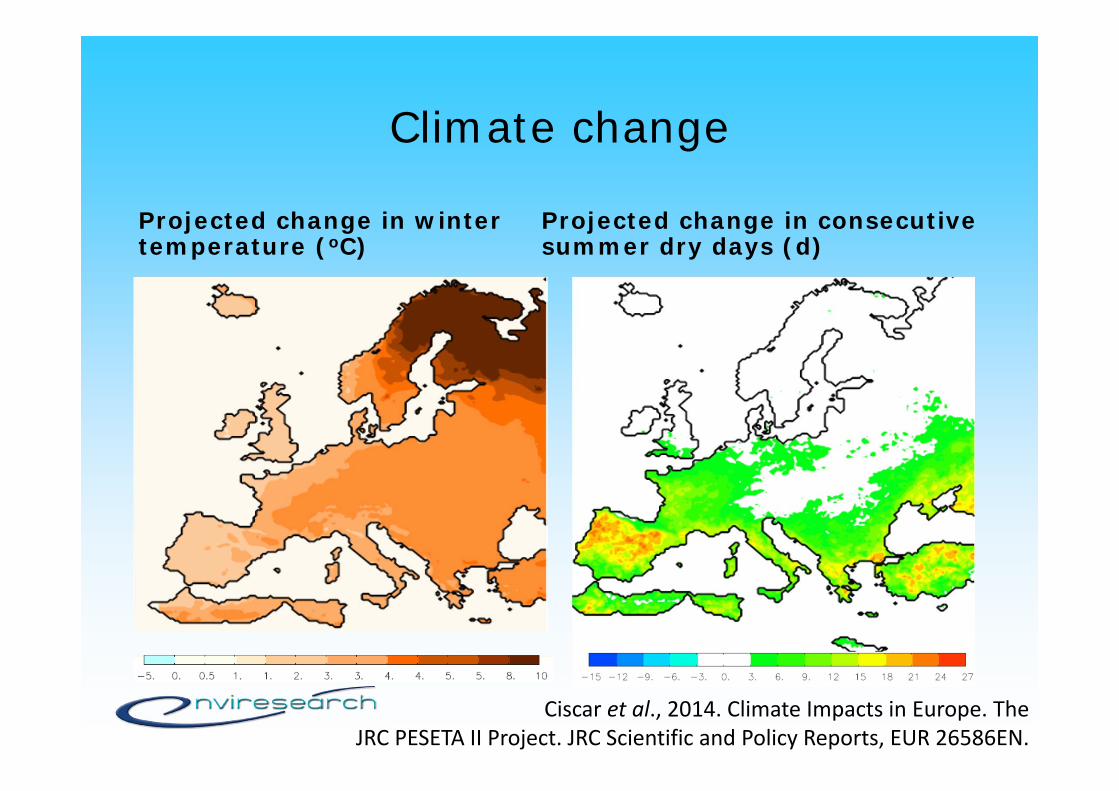
Climate change
Projected change in winter temperature (oC)
Projected change in consecutive summer dry days (d)
Ciscar et al., 2014. Climate Impacts in Europe. TheJRC PESETA II Project. JRC Scientific and Policy Reports, EUR 26586EN.
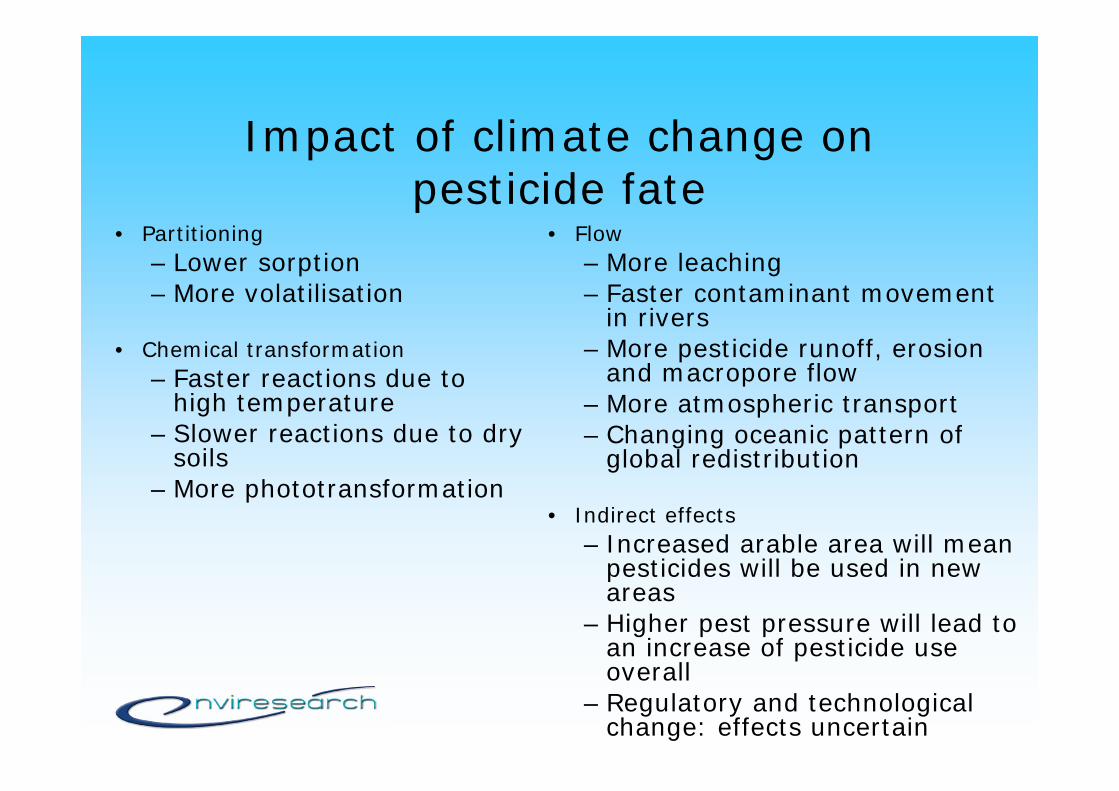
Impact of climate change on pesticide fate
• Partitioning– Lower sorption– More volatilisation
• Chemical transformation– Faster reactions due to
high temperature– Slower reactions due to dry
soils– More phototransformation
• Flow– More leaching– Faster contaminant movement
in rivers– More pesticide runoff, erosion
and macropore flow– More atmospheric transport– Changing oceanic pattern of
global redistribution
• Indirect effects– Increased arable area will mean
pesticides will be used in new areas
– Higher pest pressure will lead to an increase of pesticide use overall
– Regulatory and technological change: effects uncertain
Conclusion:What is important?
“In the long-term, land-use change driven by
changes in climate may have a more significant
effect on pesticides in the environment than the
direct impacts of climate change on specific
pesticide fate and transport processes.”
Bloomfield et al., 2006. Science of the Total Environment 369, pp. 163‐177