Embed Size (px)
Citation preview
ChapterS
PET-SWNT nanocomposite fibers through
melt spinning
Abstract
PET-SWNT nanocomposite jibers have been prepared through melt spinning and
drawing. The mechanical properties indicated that SWNTs provide significant
reinforcement to PET jibers. For example, the tenacity and initial modulus of the
compositejiber with 2.0 wtJ/o SWNTs were, respectively, 2.5 times and 5 times higher
as compared to those of the pristine PET fiber prepared under identical conditions.
When the draw ratio was increased, tenacity and modulus of the flbers increased,
indicating that drawing induced orientation of the polymer molecules and SWNTs.
Thermal stability ofthe jibers was not significantly affected by the presence ofSWNTs
at low concentrations.
107
Chapter 5
5.1 Introduction
Today, polyester fibers are used in a wide variety of applications ranging from
textiles to automobiles. They are known for their high resilience, resistance to
wrinkling, high durability, dimensional stability, and resistance to chemical and
environmental attack. Poly(ethylene terephthalate) fiber accounts for over 97 percent
of all polyester fibers manufactured today. Only small amounts of other types of
polyester fibers are presently or have been produced commercially, of which the
larger volume materials include poly(l,4-cyclohexane dimethylene terephthalate)
(PCDT), poly(butylene terephthalate) (PBT), and poly(trimethylene terephthalate)
(PIT).
The idea of spinning polyester fibers dates back to the original W.H. Carothers
(DuPont) patents and papers from the 1930s.1 However, the use of polyester fibers
did not become commercially feasible until the 1950s when J.R. Whinfield and
J.T. Dickson of Calico Printers made poly(ethylene terephthalate) from terephthalic acid.
Although several types of fiber spinning methods are commercially used, essentially
polyester fibers are produced by melt spinning. 2•3 Melt spinning is the least complex
spinning method; it simply involves forcing a polymer melt through a spinneret and
into air to cause the polymer to solidify. It does not involve the problems associated
with the use of solvents and is therefore the preferred method provided that the
polymer gives a stable melt. The homogenized and filtered melt is extruded through
the spinneret and can solidify anywhere from a few centimeters from the spinneret
plate to as far away as several meters.
Polyester fibers have been categorized on the basis of degree of orientation
introduced into the fiber during the melt spinning process. These categories are Low,
Medium or Partial, High, and Fully oriented fiber. Low oriented polyester fiber is
used to make staple products. Of the oriented fiber categories, partially oriented yam
(pay) is by far the most common material in commercial production. pay has
gained sudden popularity since its introduction in the early 1980s, and now accounts
108
PET-SWNT nanocomposite fibers through melt spinning
for the majority of the polyester filament category. Highly oriented yam (HOY) is
spun at 4,000-6,500 m/min, whereas fully oriented yam (FOY) is spun at greater than
6,500 m/min. The last of these categories is stilI developing, as these spinning rates
have proven challenging to achieve in commercial operations.
In 1950s, PET fiber spinning typicalIy occurred at speeds of 1,200 m/min followed
by a drawing stage where the fibers were stretched to three to five times their initial
length. Drawing fine-tunes the fiber properties by increasing orientation,
crystallinity, and strength. Higher fiber spinning speeds increase orientation and
crystallinity prior to drawing. In poly(ethylene terephthalate), interaction between the
aromatic n-electron systems of the benzene rings and the carbonyl groups result in
dipole-dipole interactions (chapter 2, figure 2.\). This interaction affects the
alignment of the polymer molecules themselves in fibers.
PET fibers are highly crystalline; crystallinity can be altered and controlled through
various processing techniques. The strength of PET fiber is a result of molecular
orientation and crystallinity introduced during fiber spinning or during subsequent
drawing, texturizing, and heat treating. A fiber contains crystalline areas in which the
polymer units are neatly folded and stacked, and amorphous regions in which the
molecules are less ordered. Tie molecules link the various regions together. It is this
non-rigid structure that allows the fibers to be stretched and their properties to be
tuned by post-spinning processing. The more crystalline a fiber structure becomes,
the less stretchable it will be. In PET fibers, the phenylene groups provide rigidity,
whereas the methylene groups provide flexibility.
Fiber spinning and drawing were conventionally two separate steps. After the fibers
were spun, they were transported and drawn or stretched in a second step. Typically,
the two step process yielded fibers that have high strength but low dimensional
stability. The development of high speed winders led to coupled spin/draw processes
being introduced in the late 1960s. In the coupled process, after the filaments are
adequately cooled, they are directly stretched by moving them over heated or
unheated rollers moving at different speeds. This forces the polymer molecules to
109
Chapter 5
align or orient themselves along the longitudinal axis of the fiber. Spun fibers can be
stretched by more than 200 percent. The actual stretch given to the fiber is generally
expressed in terms of draw ratio. The draw ratio measures the fiber take-up velocity
compared to the extrusion velocity. Fibers spun at higher speed will have greater pre
orientation and will need less drawing.
5.1.1 State-of-art research in nanocomposite fibers
Scientists all over the world have made several attempts in the past to modify the
performance characteristics of polymer fibers; mostly PET fibers. 4•
1O Carbon
nanotubes have recently been reported as imparting several properties to polymer
fibers. II-14 For example, multi walled carbon nanotubes have been incorporated to
nylon 6 and PET fibers by Xushan et al.15 They observed that, when adding 0.03 wt%
MWNTs into nylon 6 fiber, the strength of the nylon fiber enhanced by 33.3 %. Its
modulus was also enhanced by 74.4 %. Adding 0.1 wt% MWNTs into PET fiber
made the latter fairly conducting. The breaking strength of this conducting PET fiber
showed almost no decrease and initial modulus was slightly enhanced in comparison
with pure PET fiber.
Poly(p-phenylene benzobisoxazole) (PBO) based nanocomposite fibers with SWNTs
have been prepared by Kumar et al. 16 They reported that the fibers containing 10 wt%
SWNTs exhibited 50 % higher tensile strength as compared to the control PBO fiber.
Sandler et al. also observed that carbon nanotubes act as effective reinforcements in
melt spun polyamide-l 2 fibers. 17
Sreekumar et al. have prepared polyacrylonitrile-SWNT nanocomposite fibers
through solution spinning. IS The spun nanocomposite fibers containing 10 wt%
SWNTs exhibited a 100 % increase in tensile modulus at room temperature, and it
increased by an order of magnitude at 150 QC. They also observed a significant
reduction in thermal shrinkage as well as polymer solubility and the glass transition
temperature was increased by 40 QC as compared with control PAN fiber.
110
PET-SWNT nanocomposite fibers through melt spinning
Crystallization and orientation studies in PP-SWNT nanocomposite fibers have been
studied by Bhattacharyya et al. ' 9 Using WAXD and Raman spectroscopy, the authors
established that SWNTs have higher orientation than pp in drawn PP-SWNT
nanocomposite fibers. This report also claims that even with a limited dispersion,
SWNTs could act as nucleating agents for pp crystallization. pp fiber modulus has
also been reported as increased by 50 % with the addition of 5 wt% carbon
nanofibers.i" It is anticipated that the shear forces during melt spinning can induce
alignment of SWNTs in the fiber axis direction to impart significant reinforcement to
the polymer matrix. Indeed, several other groups have demonstrated improvement in
properties of polystyrene, PMMA, etc. as a result of melt/wet spinning various
amounts of SWNTs with the polymer matrix.21-23 In a recent publication, Neri et al.
have described a surfactant free wet spinning method for the production of composite
carbon nanotube fibers?4
Ma et al. have prepared poly(ethylene terephthalate) based composite fibers reinforced
with various grades of carbon nano fibers (CNFs, 5 wt%).2S They reported that the
tensile modulii of the composite fibers were marginally higher than that of the pristine
PET tiber. On the other hand, tensile strength of the composite fibers was either
comparable to or lower than the control fiber.
Siochi et al. have prepared fibers from melt-processed nanocomposites of polyimide
with SWNTs.26 They demonstrated that, the fibers containing upto I wt% SWNTs, in
which the nanotube alignment in the fiber direction was induced by shear forces during
melt extrusion and fiber drawing, exhibited significantly higher tensile modulii and
yield stress relative to unoriented nanocomposite films having the same SWNT
concentration.
In this part of the work, nanocomposite fibers were melt spun from melt compounded
PET-SWNT nanocomposites and were subsequently drawn at 100°C. Effect of fiber
formation conditions on the development of their mechanical properties has been
studied.
III
Chapter 5
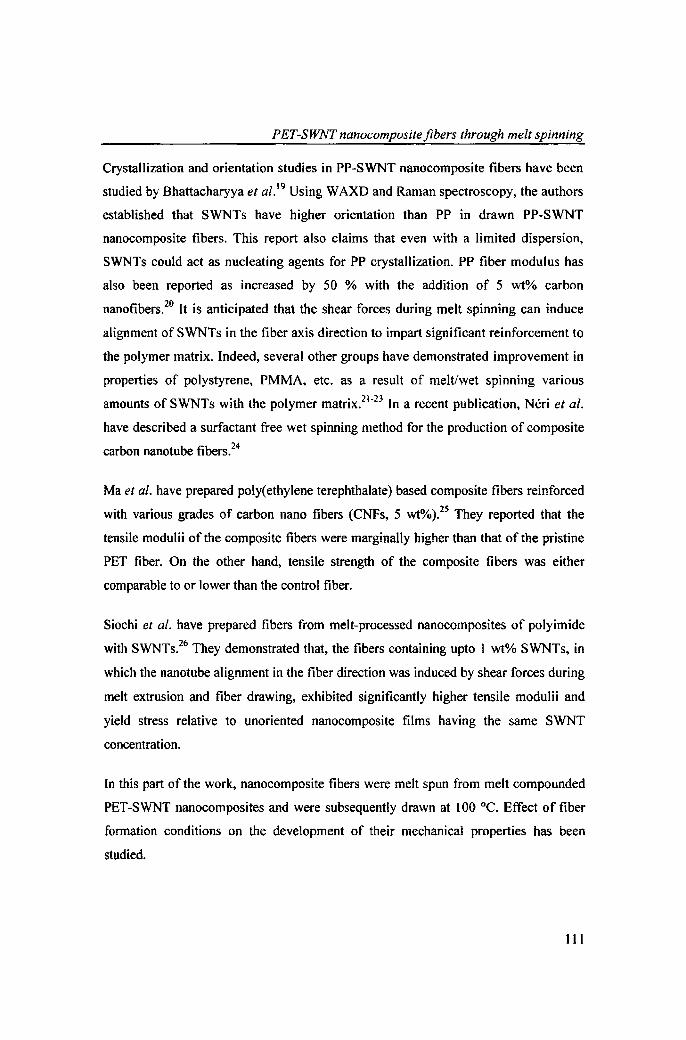
5.2 Experimental
5.2.1 Melt spinning and drawing
Melt compounded nanocomposites (section 2.2.2 of this thesis) of PET and SWNTs
were ground using a cryo-grinder (Lloyd instruments Ltd.). The ground samples
were dried at 150 QC under vacuum for atleast 24 h. They were spun into fibers using
a small scale spinning machine manufactured by Bradford University Research Ltd.,
UK, using a single hole spinneret (figure 5.1). The conditions of spinning were as
follows:
Spinneret
Cylinder temperature
Piston speed
Winding speed
Filament type
: Single hole, dia = I mm, length = 7 mm
: 265 (± 0.5) QC
: 3 (± 0.02) mm/min
: 70 (± 0.2) mlmin
: mono filament
Piston _~~==-*--tJ---=.......I-Oil box -II-..-!~-!--.
Hydraulic ---If----+pump
Distributor -.....,r---I--F-'Spinneret ----1f-~t:~C:::j
Controlpanel
Stand
1Monofilament to thewinding unit
Fig. 5.1 Schematic drawing ofthe laboratory scale melt spinning machine
112
PET-SWNT nanocomposite fibers through melt spinning
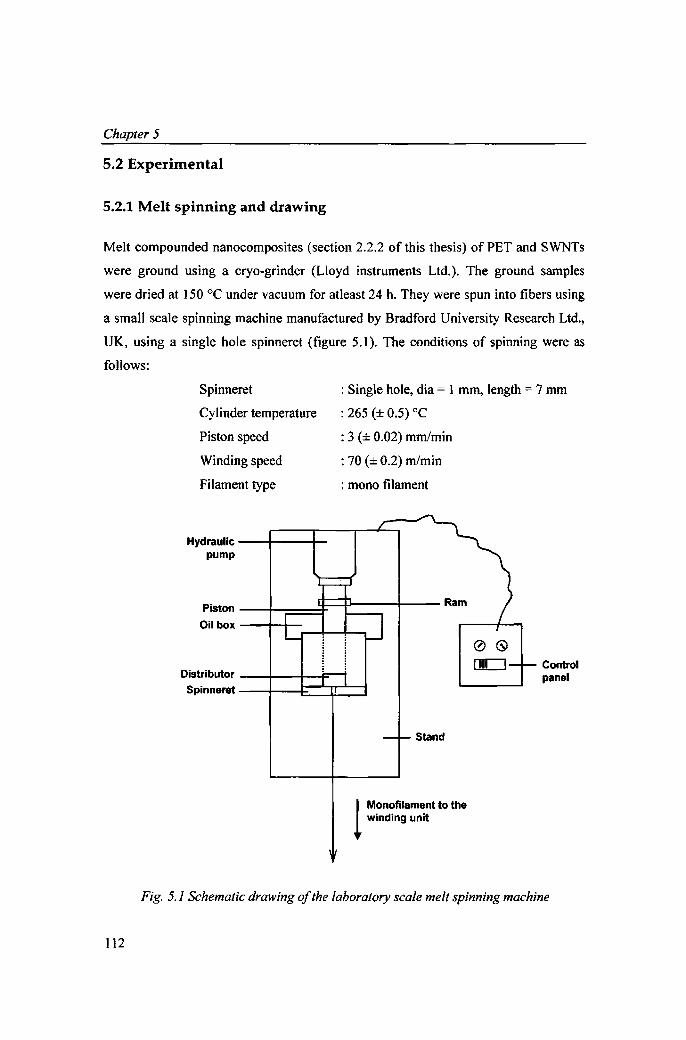
The spun fibers were subsequently drawn using a laboratory single zone drawing
machine, a schematic representation of which is given in figure 5.2. PET fibers are
typically drawn above 80 QC; additional heat is necessary because it provides the fiber
molecules with the mobility to rearrange. The specifications and conditions of drawing
were as follows:
Speed of the feed roller
Outer diameter of the rollers
Speed of the take up roller
Length of the heating plate
Heater temperature
:4rpm
: 11.2 cm
: variable
: 20.5 cm
: 100± 0.5 QC
Heater plate
...........,f--....... I Thread guides
Take up rollers'----~-----'
Temperaturecontrol unit
Monofilament
Fig. 5.2 Schematic representation ofthe jiber drawing set-up
113
Chapter .s
5.2.2 Mechanical properties of the fibers
Mechan ical properties of the PET-SWNT nanocomposite fibers were dete rmined using
a Favimat Fiber Testing machine (Textec hno-textile test ing technology) with a load
cell of 1.200 eN capacity. The distance between thejaws at the start of the test was20 mm
and the test speed was 20 mm/min. The pretension was set at 0.50 eNltex and the test
tem pera ture was maintained at 25 ± I QC. Atleas t 30 measurements were taken to
represent each data point
5.2.3 Thennal analysis
Therm ogravimetrie analysis (section 3.2.6) was used to determine the effect of carbon
nanotu bes on the therm al stab ility of PET fibers.
5.3 Results and di scussion
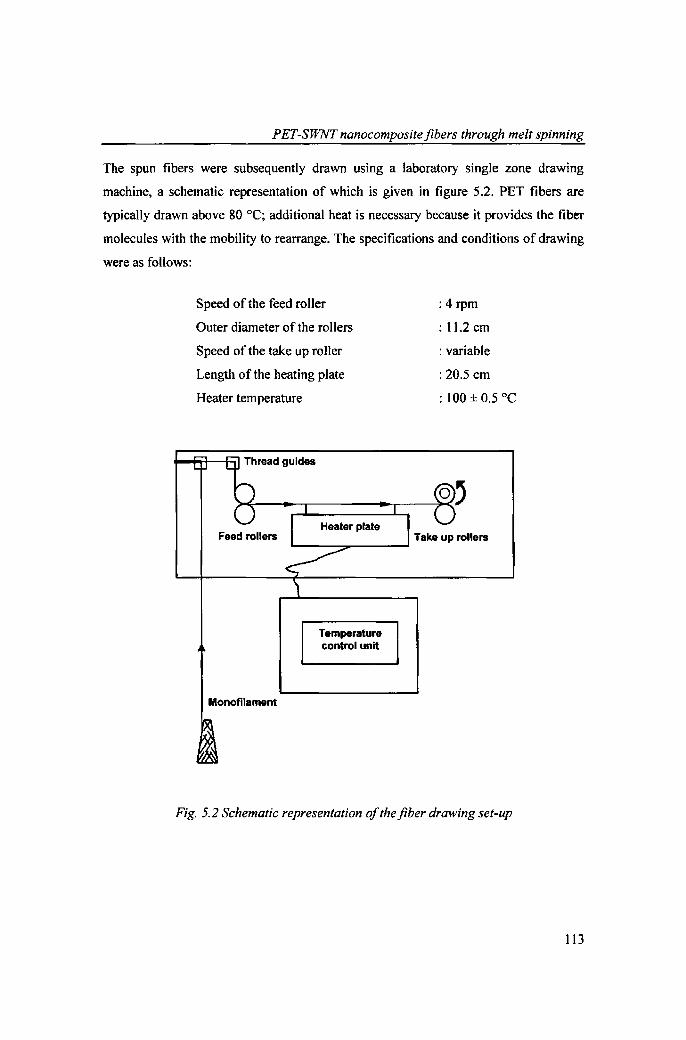
Figure 5.3 is a photograph of PET-SWNT nanocompos ite flber prepared by us through
melt sp inning followed by drawing.
Fig. .s.J Picture ofPET-SWNT nanocomposite (1 .0 wt%) fiber
114
PEr-SWNT nanocomposite fibers through melt spinning
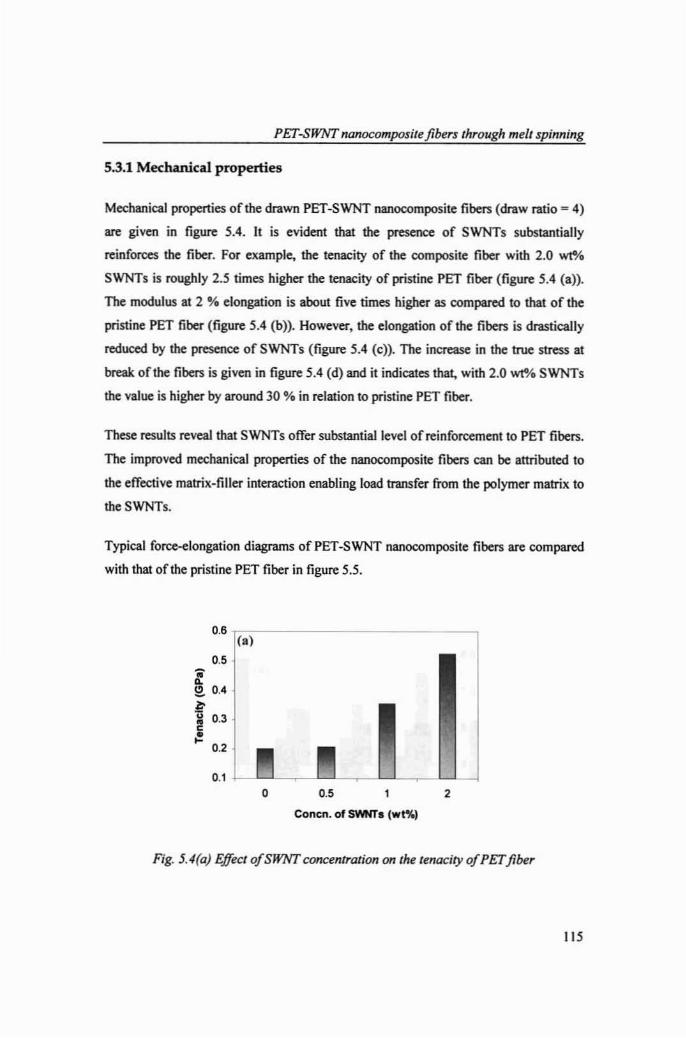
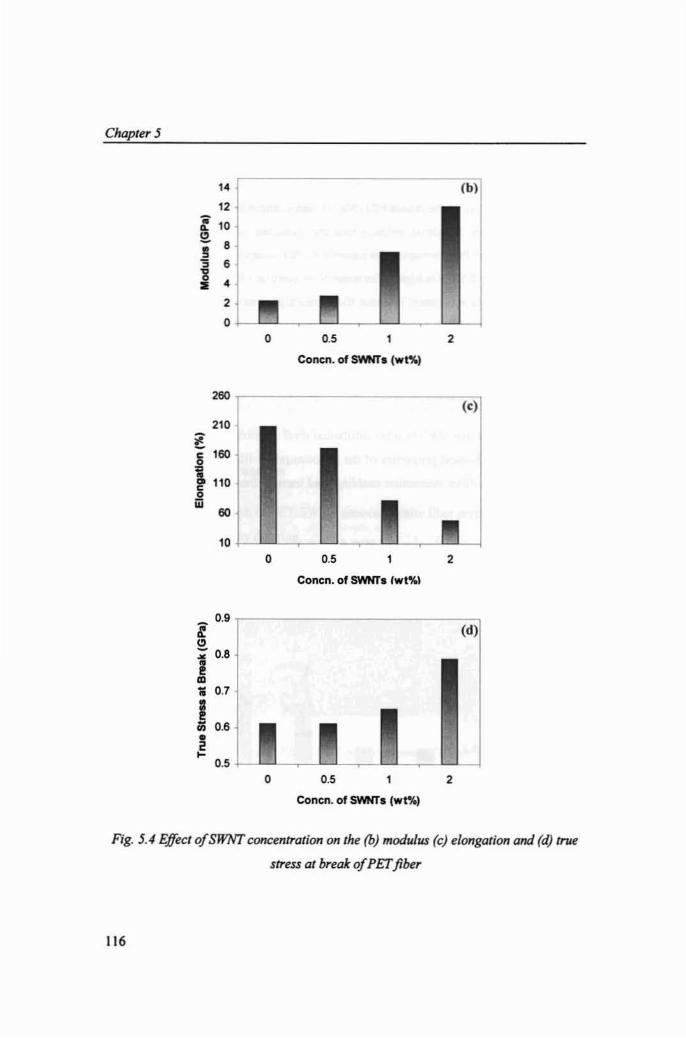
5.3.1 Mechanical properties
Mechanical properti es of the drawn PET-SWNT nanocomposite tibers (draw ratio > 4)
are given in figure 5.4. It is evident that the presence of SWNTs substantially
reinforces the tiber. For exampl e, the tenacity of the compos ite tibe r with 2.0 wt%
SWNTs is rough ly 2.5 times higher the tenacity of pristine PET tiber (figure 5.4 (a».
The modulus at 2 % elongat ion is abo ut five times higher as compared to that of the
pristine PET tiber (figure 5.4 (b». However, the elongat ion of the fibers is drastically
reduced by the presence of SWNTs (figure 5.4 (e» . The increase in the true stress at
break of the fibers is given in figure 5.4 (d) and it indicates that. with 2.0~/o SWNTs
the value is higher by around 30 % in relation to pristine PET tiber.
These results reveal that SWNTs offer substan tial level of reinforce ment to PET fibers .
The improved mechanical properties of the nanocomposite tibers can be attri buted to
the effective matrix-filler interaction enabling load trans fer from the polymer matrix to
theSWNTs.
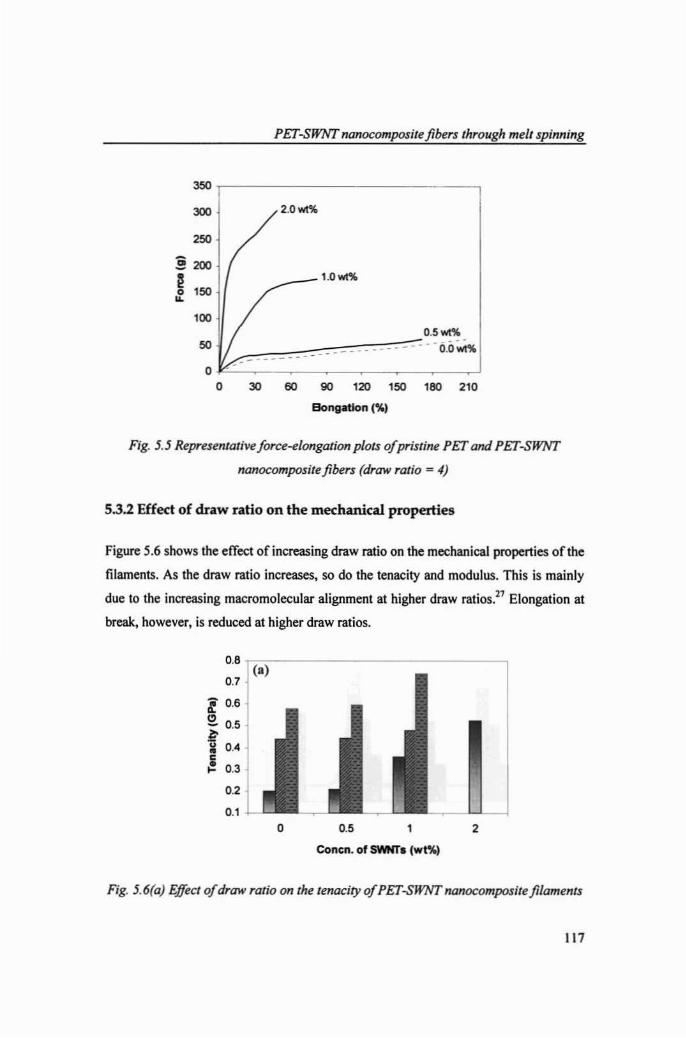
Typ ical force-elo ngation diagrams of PET-SWNT nanocom posite flbers are compared
with that of the pristine PET fiber in figure 5.5.
Ca)
a.';f!2. 0 .4
~~ 0.3<~
0.2
0.1o a.'
Conen. of S'NNTs (wt%)
2
Fig. 5.4(a) Efftct ofSWNI' concentration on the tenacity of PErfiber
115
Chapter 5
" (b)
12
t 10s 8
~ •"8 •..2
00 0.' 2
Concn . of SWNTs (wt%1
260(c)
210
lli '"~
t 110
ill ..10 ~
0 0.' 1 2
Conen. of SWNTs Iwt%)
D.': (d)!;!.
0.8~••CD~ 0.7
j 0.s~0-
D.' ~ ~
0 0.' 1 2
Conen . of SWNTs (wt%)
Fig. 5.4Effect ofSWNrconcentration onthe (b) modulus (c) elongation and(d) true
stress at breakof PETflber
116
350
300
250
§ 200
~150•"-l OO
50
00
PET-SWNT nanocomposile fi bers through melt spinning
2.0"'""'"
___ 1.0wt%
0.5"'""'"_, __ · ·- ··-· O.O~
30 60 90 120 150 180 210
Bongation (%1
Fig. J.J Represenrative j orce-elongation plots ojpristine PEr and PET-SWNT
nanocomposite fibers (draw ratto » 4)
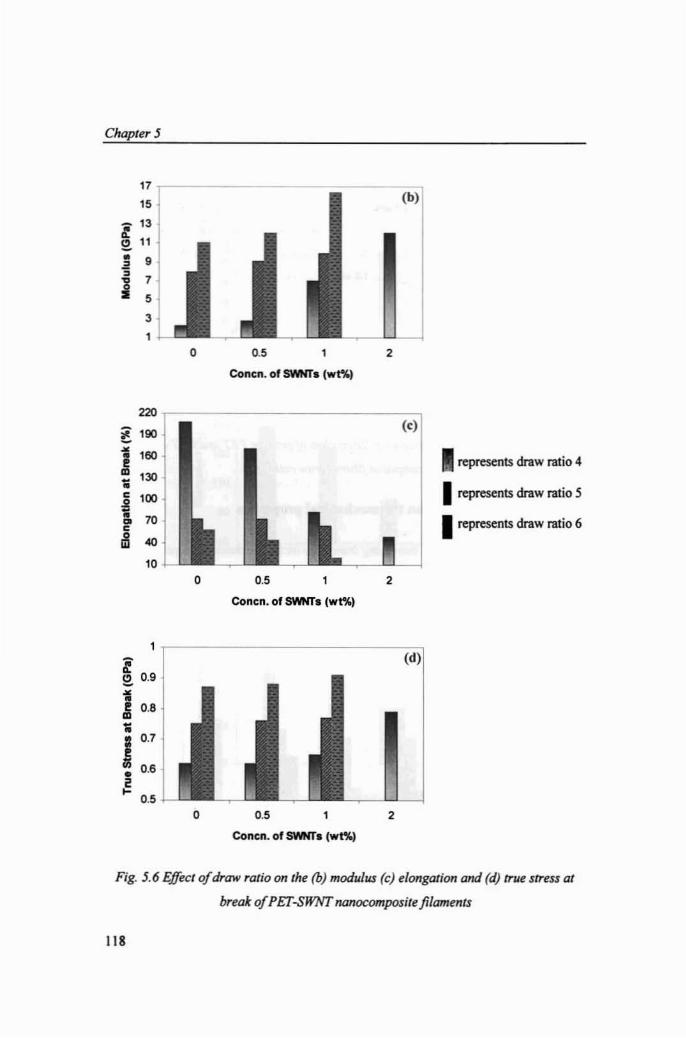
5.3.2 Effect of draw ratio on the mechanical properties
Figure 5.6 shows the effect of increasing draw ratio on the mechanical properties of the
filaments. As the draw ratio increases, so do the tenacity and modulus. Th is is mainly
due to the increasing macromolecular alignment at higher draw ratios." Elongation at
break, however, is reduced at higher draw ratios.
08(a)
0.7
l 0.8
e. 0.5~u 0.'••~ 0.3
0.2
0.1o 0.5
Concn. of S'MfTs (wt%)
2
Fig. J.6(a) Effect ofdraw ratio on the tenacity ofPEr-SWNT nanocompos ile filamen ts
117
Chapter 5
17
"(b)
1 13
~ 11
• 92• 7j s3
1 ~
0 D.' 1 2
Conen. of swms (w t%)
220
~ '"(c)
M lOO I represents draw ratio 4••.. 1301; I representsdraw ratio Sc lDO..1;
70 I represents draw ratio6ac
ill 40
10 ~ ~
0 D.' 2
cenen. of SWNTs(wt%1
1 (d)
~ 0.9M•~ 0.9~•
10.7
0.6•~
D.'0 D.' 1 2
Conen. of swms (wt%)
Fig. 5.6 Effect ofdraw ratio on the (b) modulus(e) elongation and(d) true stress at
breakofPEr-SWNf nanocompositefilaments
118
PET-SWNT nanocomposite fibers through melt spinning
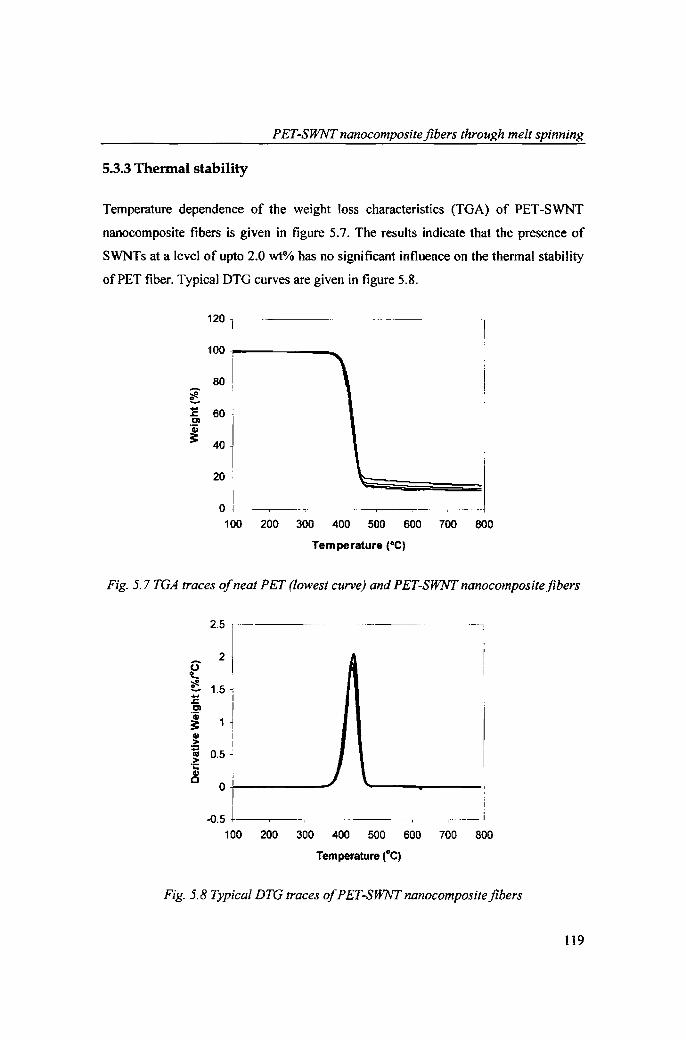
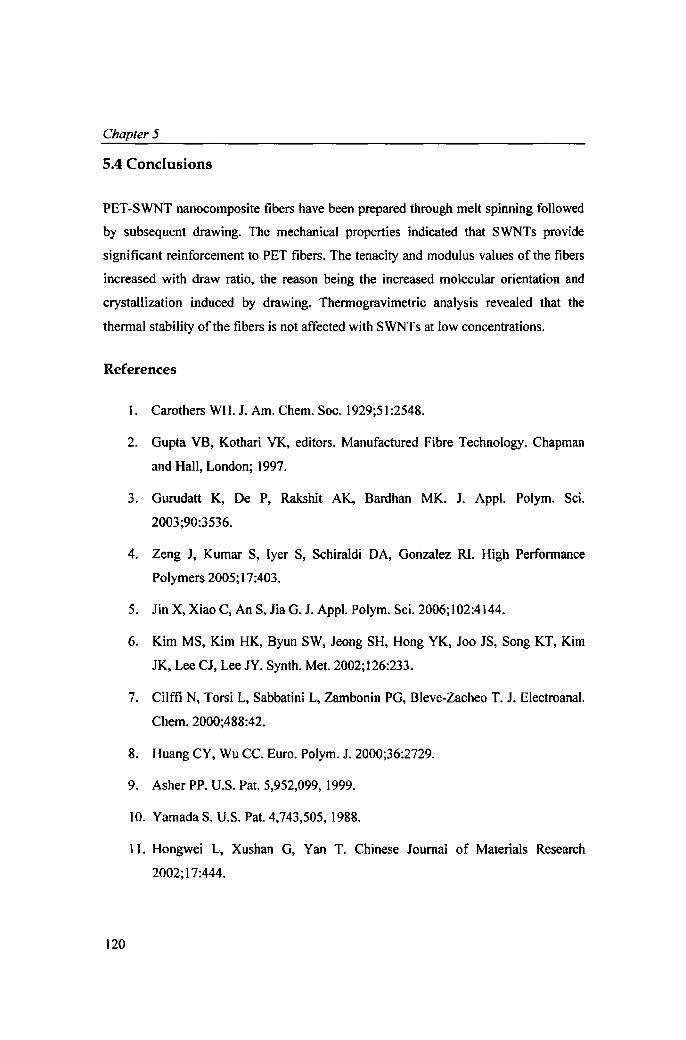
5.3.3 Thermal stability
Temperature dependence of the weight loss characteristics (TGA) of PET-SWNT
nanocomposite fibers is given in figure 5.7. The results indicate that the presence of
SWNTs at a level of upto 2.0 wt% has no significant influence on the thermal stability
of PET fiber. Typical DTG curves are given in figure 5.8.
120 1
100~--- _
80;eo~
1: 60:Cl
~ 40
20
o +-1------,--
100 200 300 400 500 600 700 800
Temperature (QC)
Fig. 5.7 TGA traces ofneat PET (lowest curve) and PET-SWNT nanocomposite fibers
2.5 ._------
20s;:.li:a 1.5 -;-.... I.c;
1 ~Q
~41 i> I+lIII 0.5 ~>.;::41a
0
-0.5 --.-~--
__--J100 200 300 400 500 600 700 800
Temperature (0C)
Fig. 5.8 Typical DTG traces oJPET-SWNTnanocompositefibers
119
Chapter 5
5.4 Conclusions
PET-SWNT nanocomposite fibers have been prepared through melt spinning followed
by subsequent drawing. The mechanical properties indicated that SWNTs provide
significant reinforcement to PET fibers. The tenacity and modulus values of the fibers
increased with draw ratio, the reason being the increased molecular orientation and
crystallization induced by drawing. Thennogravimetric analysis revealed that the
thermal stability ofthe fibers is not affected with SWNTs at low concentrations.
References
I. Carothers WHo J. Am. Chem. Soc. 1929;51 :2548.
2. Gupta VB, Kothari VK, editors. Manufactured Fibre Technology. Chapman
and Hall, London; 1997.
3. Gurudatt K, De P, Rakshit AK, Bardhan MK. J. AppI. Polym. Sci.
2003;90:3536.
4. Zeng J, Kumar S, Iyer S, Schiraldi DA, Gonzalez RI. High Performance
Polymers 2005;17:403.
5. Jin X, Xiao C, An S, Jia G. J. Appl. Polym, Sci. 2006;I02:4144.
6. Kim MS, Kim HK, Byun SW, Jeong SH, Hong YK, Joo JS, Song KT, Kim
lK, Lee CJ, Lee lY. Synth. Met. 2002;126:233.
7. cure N, Torsi L, Sabbatini L, Zambonin PG, Bleve-Zacheo T. l. Electroanal.
Chem. 2000;488:42.
8. Huang CV, Wu Cc. Euro. Polym. J. 2000;36:2729.
9. Asher PP. V.S. Pat. 5,952,099, 1999.
10. Yamada S. V.S. Pat. 4,743,505, 1988.
11. Hongwei L, Xushan G, Van T. Chinese Journal of Materials Research
2002;17:444.
120
PET-SWNT nanocomposite fibers through melt spinning
12. Junping Y, Xushan G, Van T. Chinese Journal of Materials Research
2004; 18:556.
13. Lee HJ, Oh SJ, Choi JY, Kim JW, Han J, Tan LS, Baek JB. Chem. Mater.
2005; 17:5057.
14. Shin OH, Yoon KH, Kwon OH. Min BO, Hwang Cl. J. Appl, Polym, Sci.
2006;99:900.
15. Xushan G, Van T, Shuangyan H, Zhenfu G. Chemical Fibers International
2005;55: 170.
16. Kumar S, Dang TO, Arnold FE, Bhattacharyya AR, Min BO, Zhang XF,
Vaia RA, Park C, Adams WW, Hauge RH, Smalley RE, Ramesh S, Willis PA.
Macromolecules 2002;35:9039.
17. Sandler JKW, Pegel S, Cadek M, Gojny F, van Es M, Lohmar J, Blau WJ,
Schulte K, Windle AH, ShatTer MSP. Polymer 2004;45:200 I.
18. Sreekumar TV, Liu T, Min BG, Guo H, Kumar S, Hauge RH, Smalley RE.
Adv. Mater. 2004;16:58.
19. Bhattacharyya AR, Sreekumar TV, Liu T, Kumar S, Ericson LM, Hauge RH,
Smalley RE. Polymer 2003;44:2373.
20. Kumar S, Doshi H, Srinivasrao M, Park JO, Schiraldi DA. Polymer
2002;43: 170 l.
21. Andrews R, Jacques 0, Rao AM, Rantell T, Derbyshire F, Chen Y, Chen J,
Haddon RC. Appl. Phys. Lett. 1999;75:1329.
22. Qian 0, Dickey EC, Andrews R, Rantell T. Appl. Phys. Lett. 2000;76:20.
23. Haggenmueller R, Gommans HH, Rinzler AG, Fischer JE, Winey Kt Chem.
Phys. Lett. 2000;330:219.
24. Neri W, Maugey M, Miaudet P, Derre A, Zakri C, Poulin P. Macromol. Rapid
Commun.2006;27:1035.
121
Chapter 5
25. Ma H, Zeng J, Realff ML, Kumar S, Schiraldi DA. Compos. Sci. Technol.
2003;63:1617.
26. Siochi EJ, Working DC, Park C, Lillehei PT, Rouse JH, Topping CC,
Bhattacharyya AR, Kumar S. Composites: Part B 2004;35:439.
27. Doi M, Edwards SF. The Theory of Polymer Dynamics. Oxford University
Press; 1986.
122