Embed Size (px)
Citation preview
PET/CT imaging for response monitoring in multicenter studies: An update and future challenges Paul Kinahan, PhD
Director of PET/CT Physics Imaging Research Laboratory Department of Radiology University of Washington, Seattle, WA
Disclosures • Research Contract, GE Healthcare
Acknowledgements • Tom Lewellen, Robert Miyaoka, Adam Alessio, Larry
Macdonald, Mark Muzi, Hannah Linden, Steve Bowen, Darrin Byrd, U Washington
• David Mankoff, Robert Doot, U Penn • Wolfgang Weber, Memorial Sloan Kettering Cancer Center • Robert Jeraj, U Wisconsin • Larry Clarke, NCI-CIP • Dan Sullivan, RSNA • Ronald Boellaard, VUMC • Rich Wahl, Martin Lodge, Johns Hopkins • Osama Mawlawi, Tinsu Pan, MD Anderson Cancer Center • Support from NCI, RSNA, SNMMI, AAPM, ACRIN

PET/CT Imaging is a powerful tool for detection, diagnosis, and staging of cancer
PET Image of Function
Function+Anatomy CT Image of Anatomy
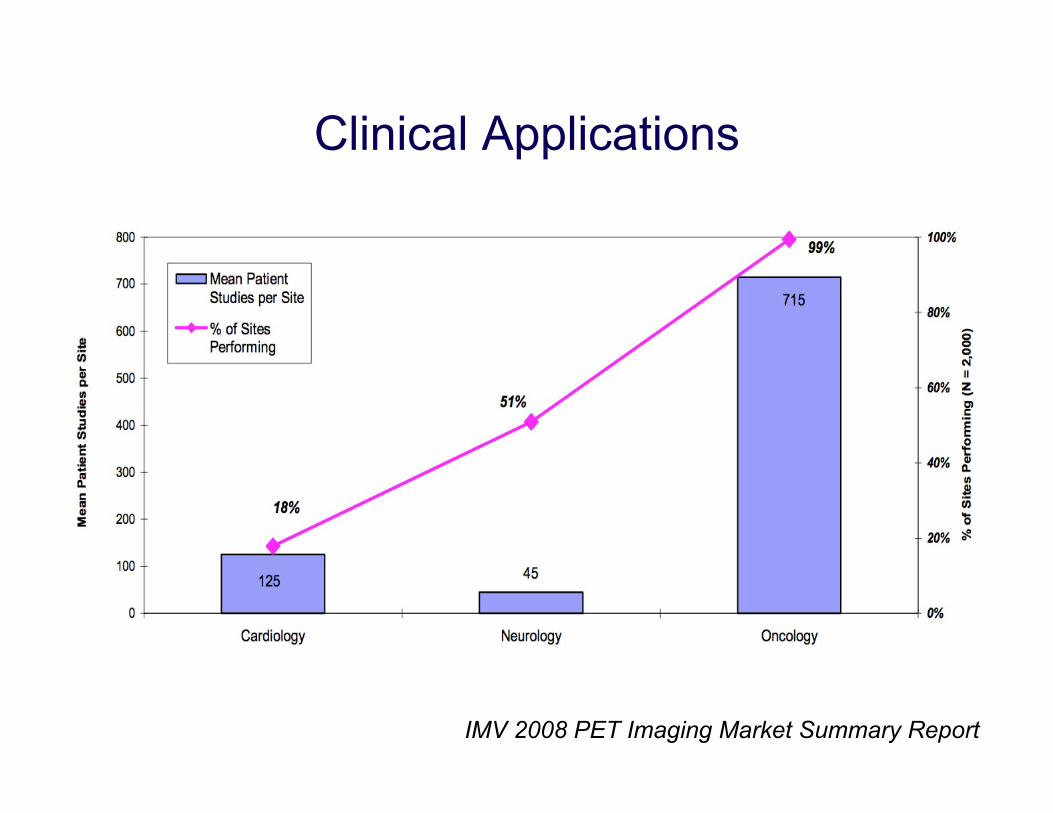
Clinical Applications
IMV 2008 PET Imaging Market Summary Report
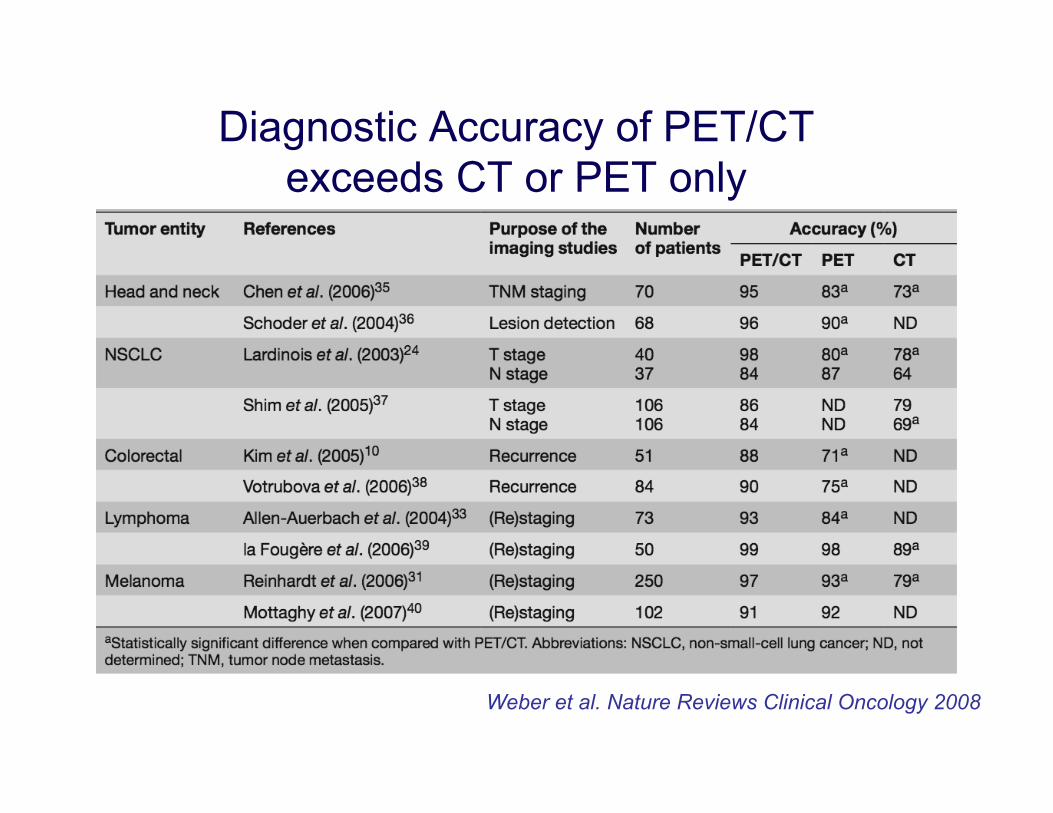
Diagnostic Accuracy of PET/CT exceeds CT or PET only
Weber et al. Nature Reviews Clinical Oncology 2008
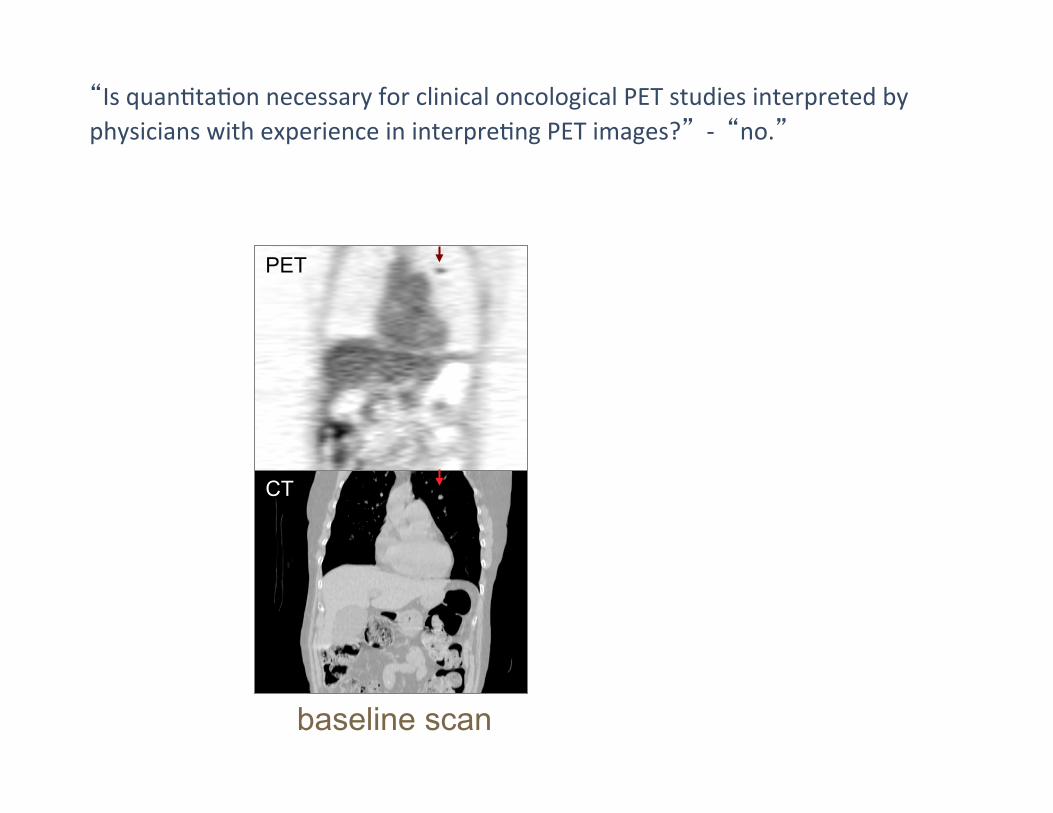
PET
CT
baseline scan
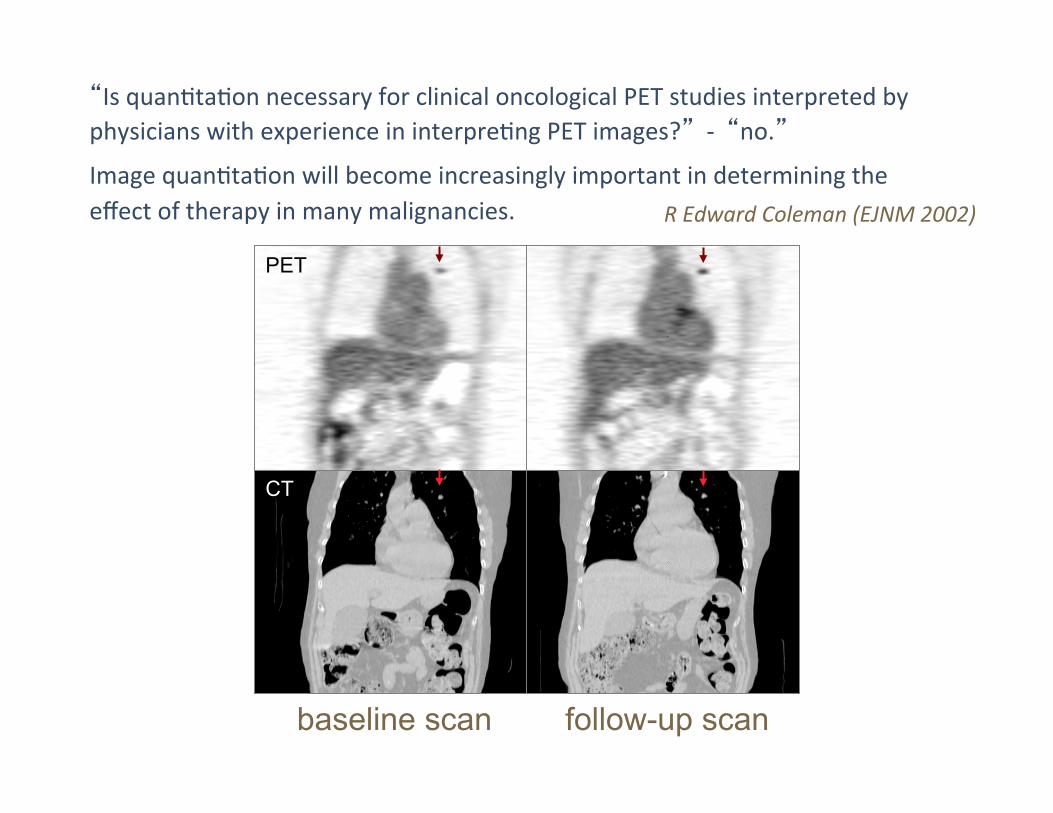
“Is quan(ta(on necessary for clinical oncological PET studies interpreted by physicians with experience in interpre(ng PET images?” -‐ “no.”
“Is quan(ta(on necessary for clinical oncological PET studies interpreted by physicians with experience in interpre(ng PET images?” -‐ “no.”
Image quan(ta(on will become increasingly important in determining the effect of therapy in many malignancies.
PET
CT
baseline scan follow-up scan
R Edward Coleman (EJNM 2002)
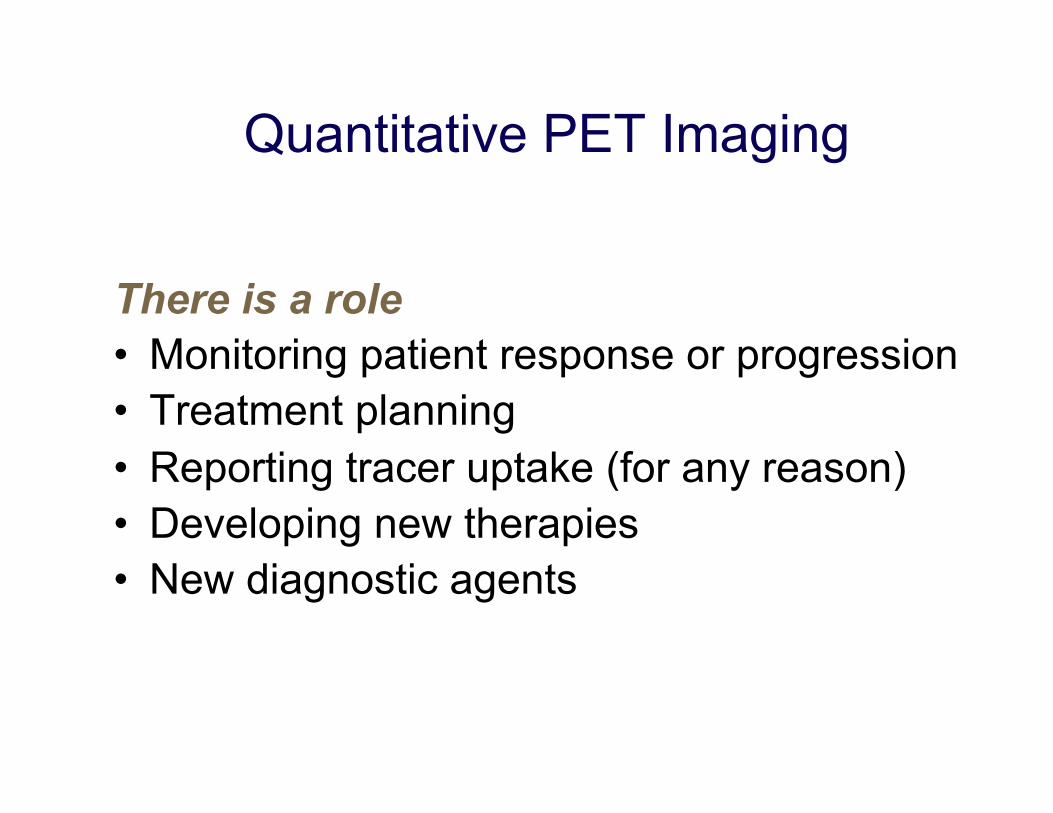
Quantitative PET Imaging
There is a role • Monitoring patient response or progression • Treatment planning • Reporting tracer uptake (for any reason) • Developing new therapies • New diagnostic agents
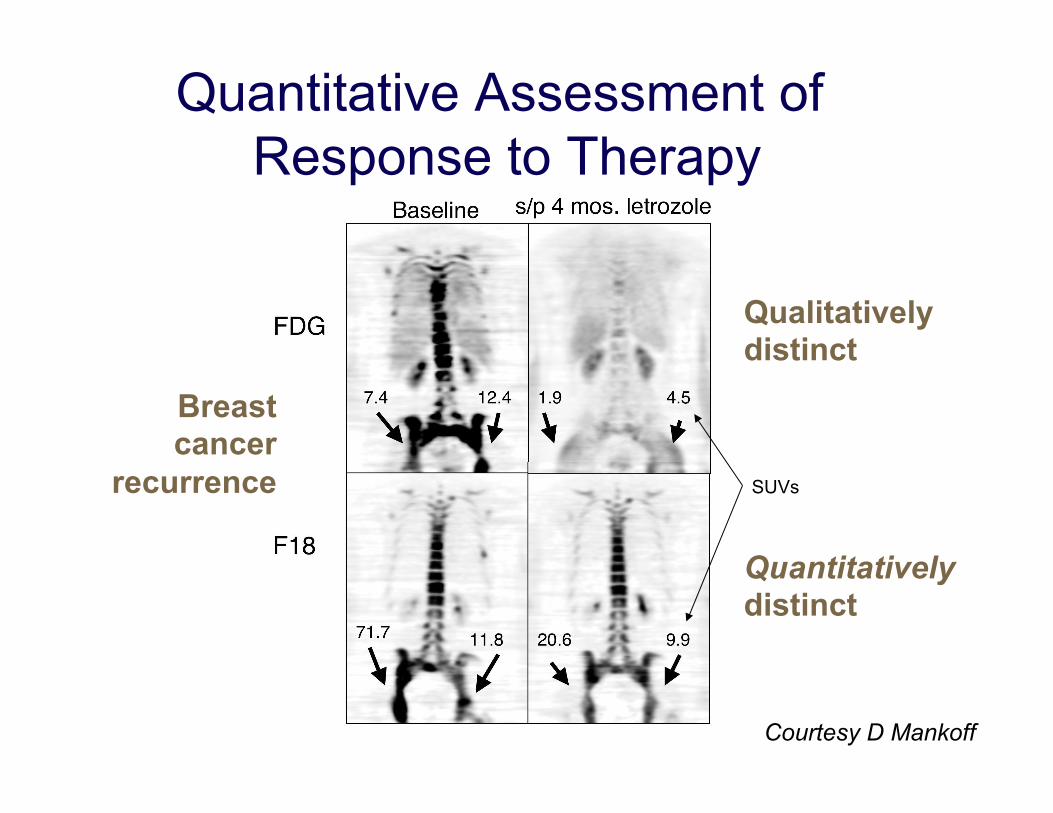
Quantitative Assessment of Response to Therapy
Courtesy D Mankoff
Qualitatively distinct
Quantitatively distinct
SUVs
Breast cancer
recurrence
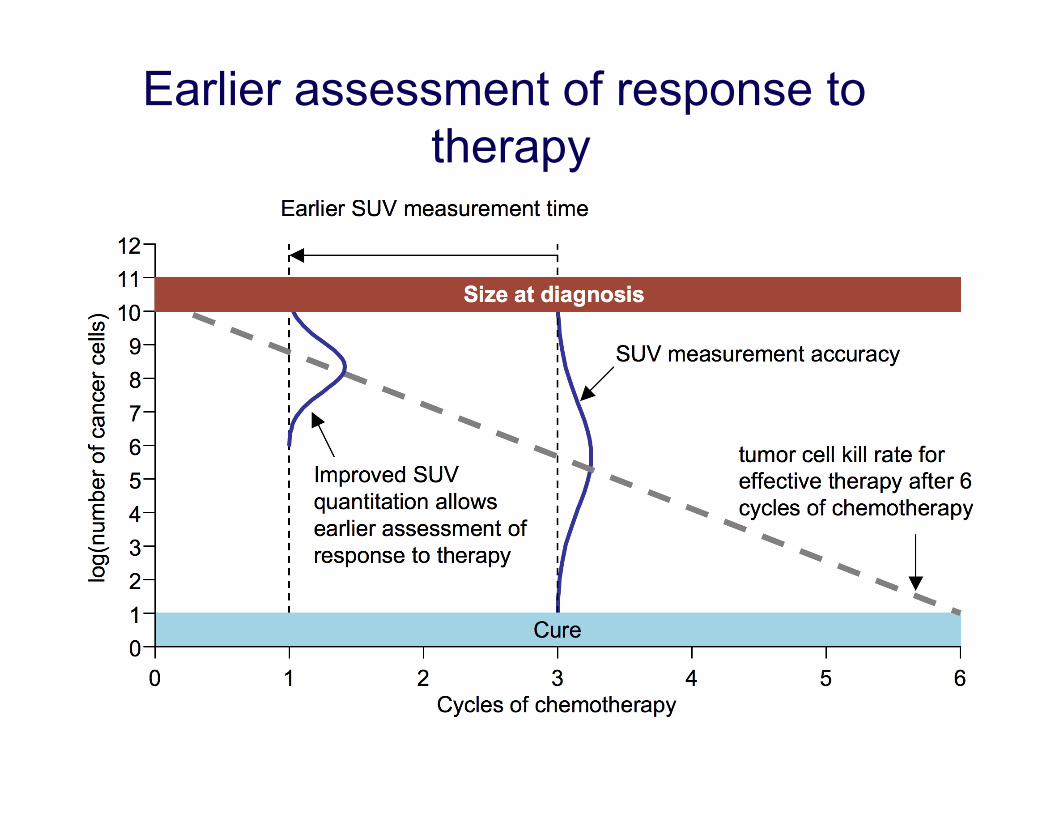
Earlier assessment of response to therapy

Drivers for Quantitative PET
• FDG uptake is now rou(nely reported, and are asked for, by referring physicians
• Assessing individual response to therapy • Treatment planning (including RT)
• New molecular diagnos(c agents
• Clinical trials and Drug discovery
increasing volume
short term drivers
Isn't PET imaging already accurate?
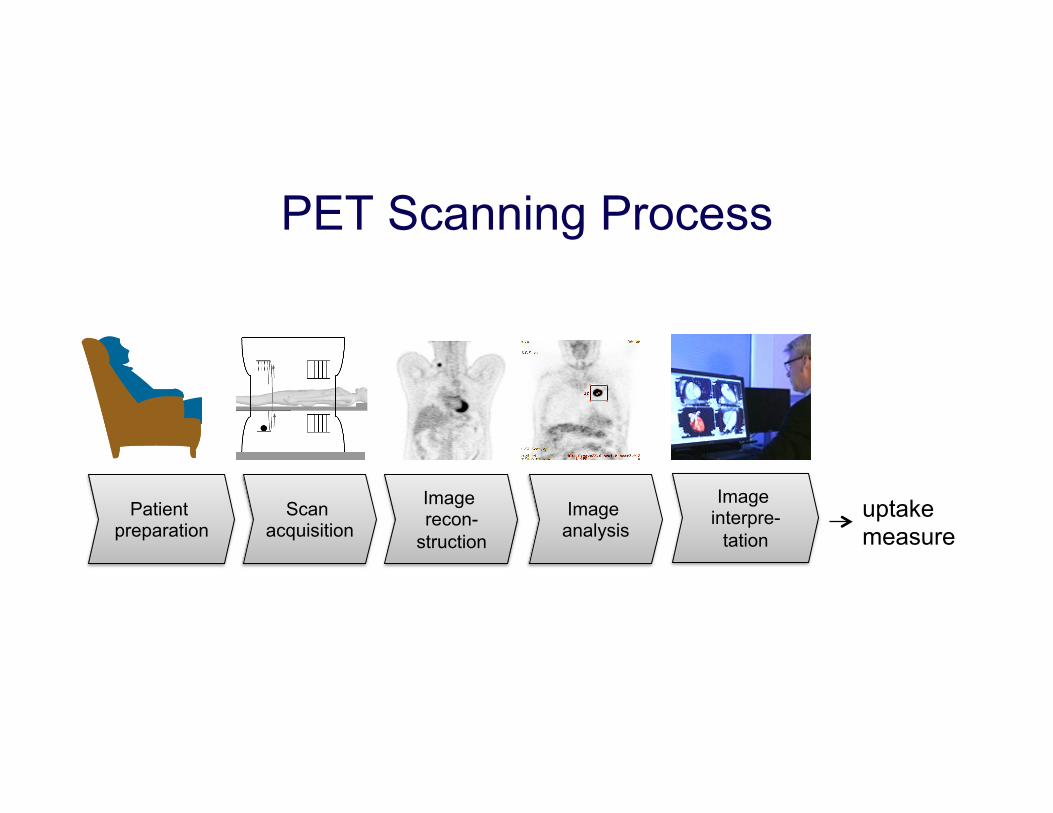
PET Scanning Process
Image interpre-
tation
Patient preparation
Scan acquisition
Image recon-
struction
Image analysis
uptake measure
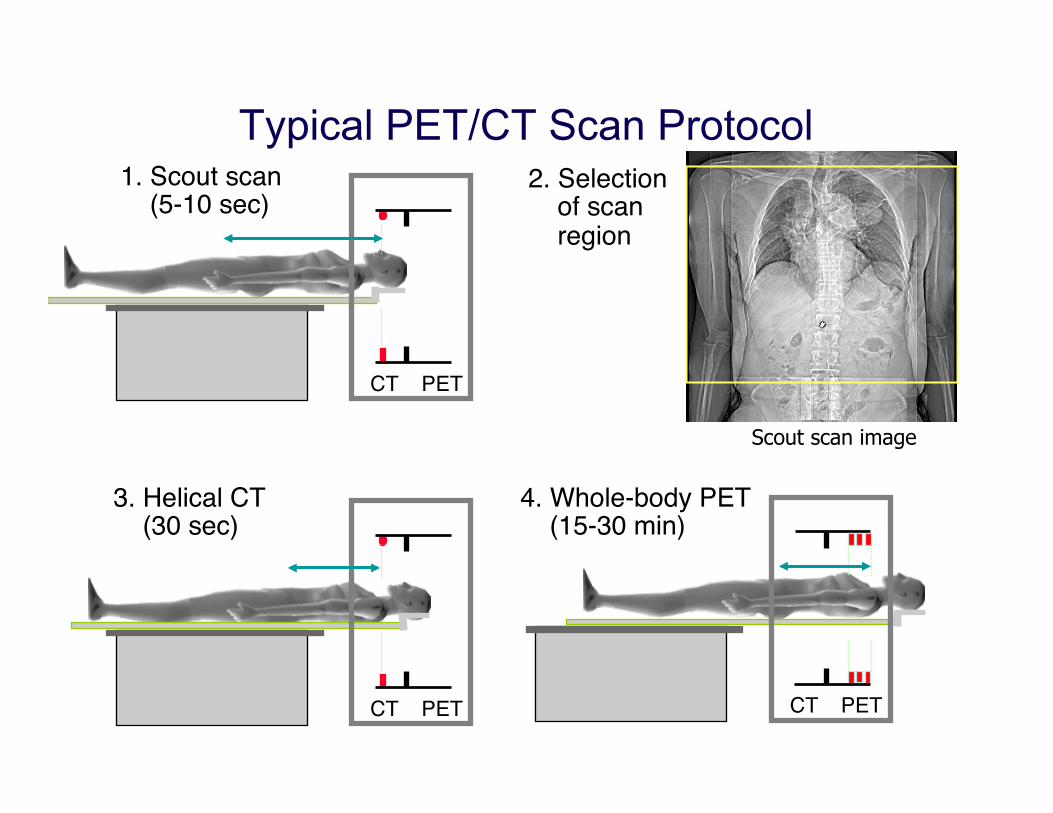
1. Scout scan (5-10 sec)"
CT" PET"
4. Whole-body PET (15-30 min)"
CT" PET"
Typical PET/CT Scan Protocol
3. Helical CT (30 sec)"
CT" PET"
2. Selection of scan region"
Scout scan image

10 mCi = 370 MBq inject
SUV = 5.3 kBq/ml / (370MBq/70 Kg) = 1.0 gm/ml
5 mCi = 185 MBq inject
SUV = 1.0 gm/ml
10 mCi = 370 MBq inject
SUV = 1.0 gm/ml
35 kg ~ 35 L
SUV = 5.0
SUV = 5.0
SUV = 5.0
A hot spot has the same SUV Independent of activity injected or patient size
Standardized uptake value (SUV) in PET • Normalize by amounts injected and weight to get the
same relative distribution
70 kg ~ 70 L
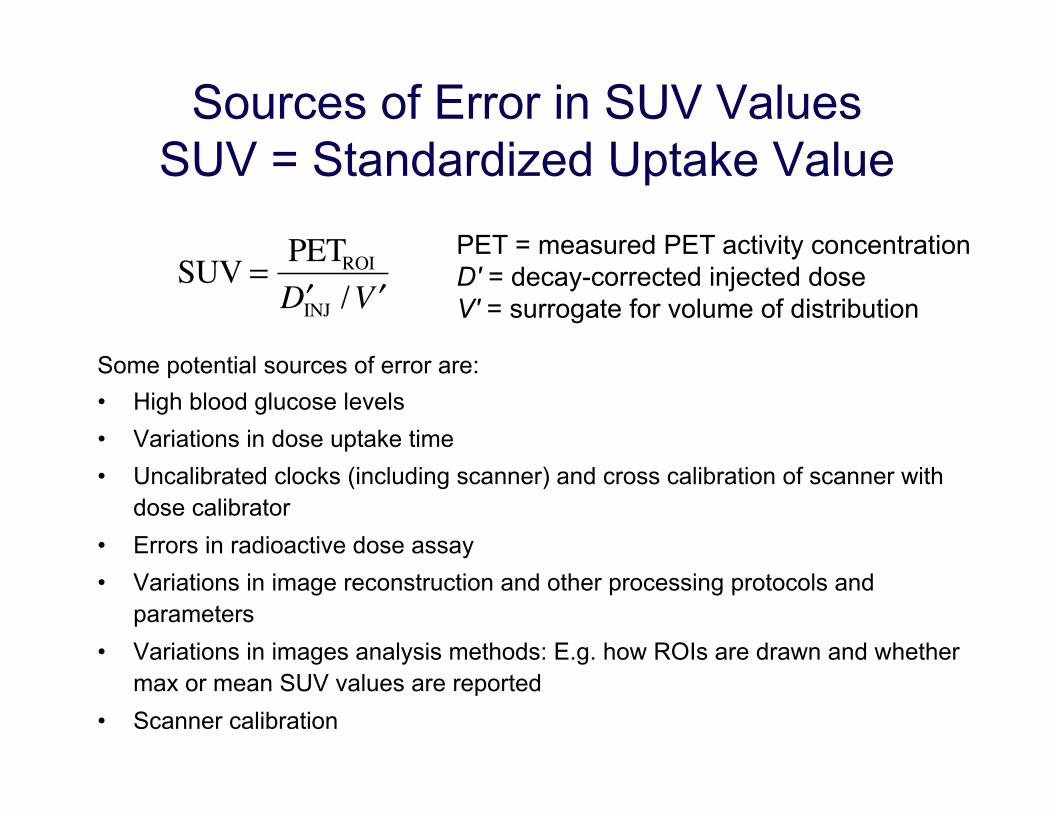
Sources of Error in SUV Values SUV = Standardized Uptake Value
Some potential sources of error are: • High blood glucose levels • Variations in dose uptake time • Uncalibrated clocks (including scanner) and cross calibration of scanner with
dose calibrator • Errors in radioactive dose assay • Variations in image reconstruction and other processing protocols and
parameters • Variations in images analysis methods: E.g. how ROIs are drawn and whether
max or mean SUV values are reported • Scanner calibration
SUV = PETROI′DINJ / ′V
PET = measured PET activity concentration D' = decay-corrected injected dose V' = surrogate for volume of distribution
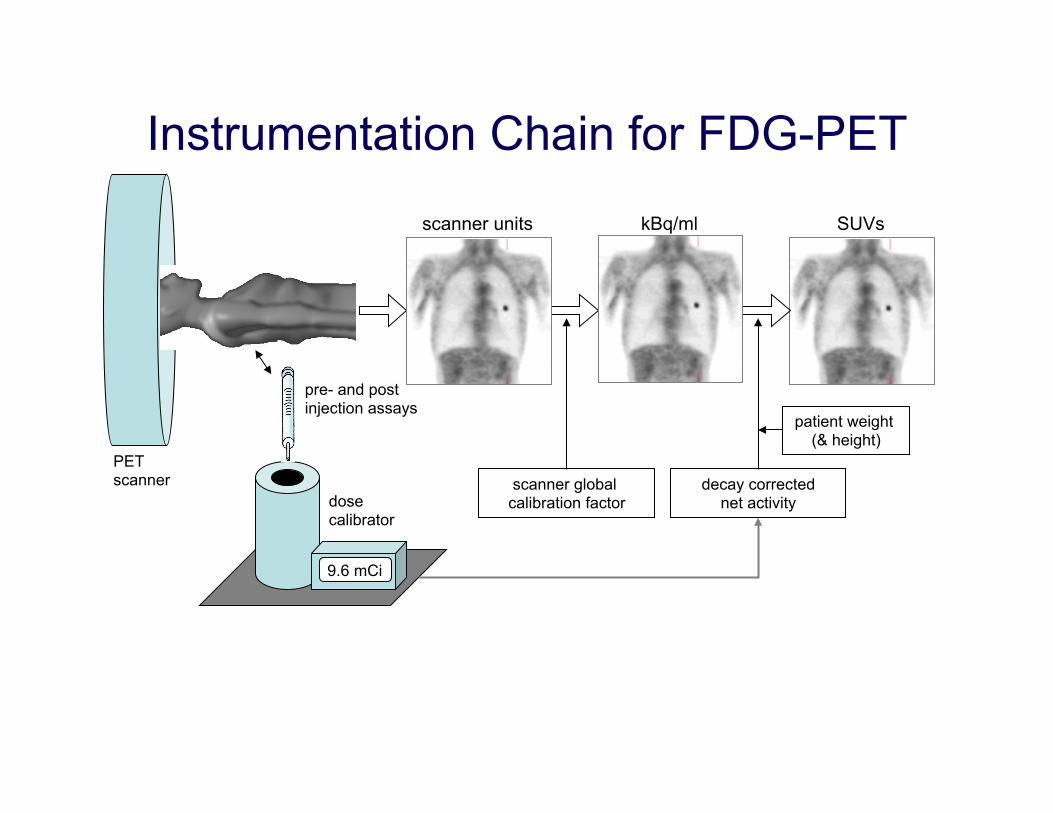
Instrumentation Chain for FDG-PET
9.6 mCi
dose calibrator
pre- and post injection assays
decay corrected net activity
PET scanner scanner global
calibration factor
patient weight (& height)
scanner units kBq/ml SUVs
imaging physics scan
protocol data processing
analysis methods
calibration patient status
accuracy & precision of PET SUVs
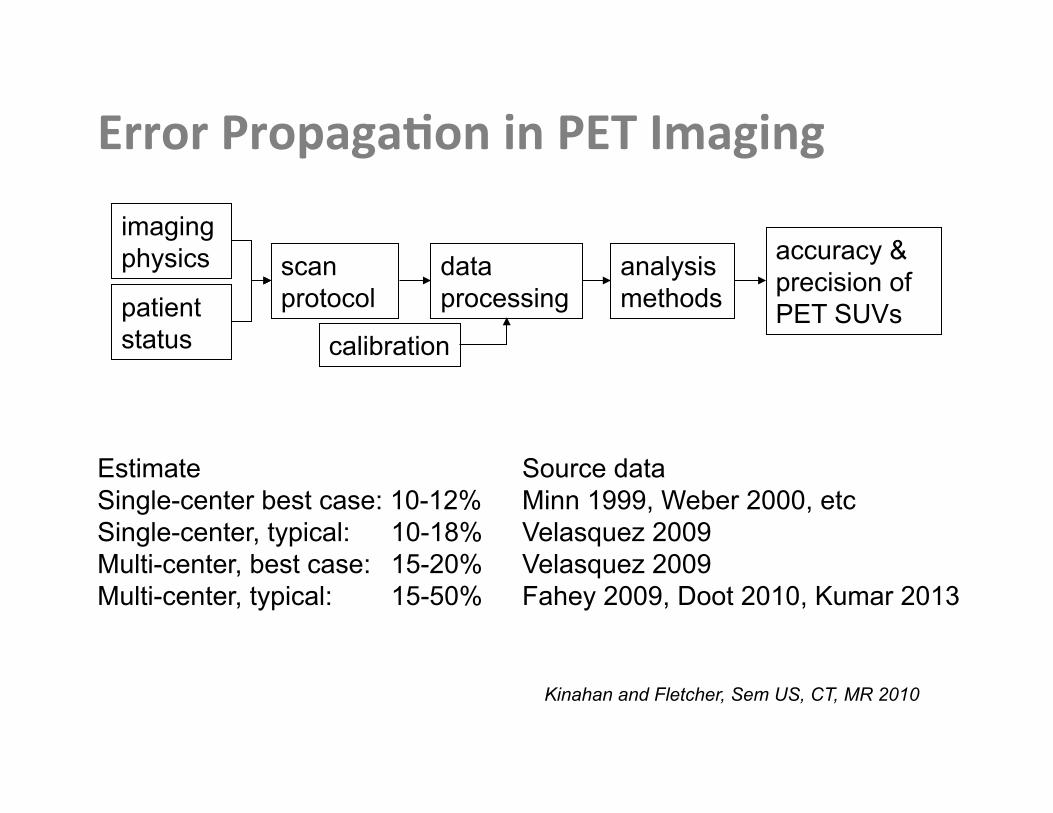
Error Propaga)on in PET Imaging
Kinahan and Fletcher, Sem US, CT, MR 2010
Estimate Source data Single-center best case: 10-12% Minn 1999, Weber 2000, etc Single-center, typical: 10-18% Velasquez 2009 Multi-center, best case: 15-20% Velasquez 2009 Multi-center, typical: 15-50% Fahey 2009, Doot 2010, Kumar 2013
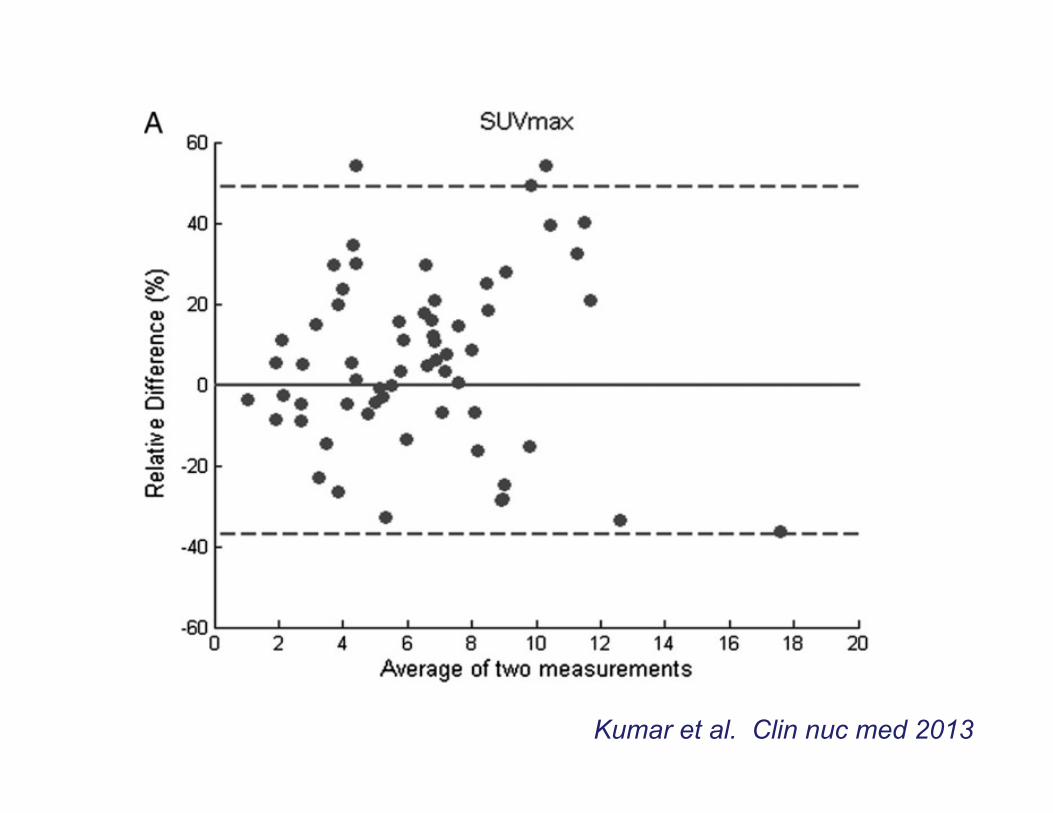
Kumar et al. Clin nuc med 2013

Trial Scenario error # of pa(ents
Single site 10% 12 Mul(-‐center
(good calibra(on) 20% 42 Mul(-‐center
(poor calibra(on) 40% 158
Doot et al., Acad Rad 2012
Impact of measurement error and sensitivity to true change on sample size
effect size (e.g. SUV) = 20% power = 80%
significance = 0.05
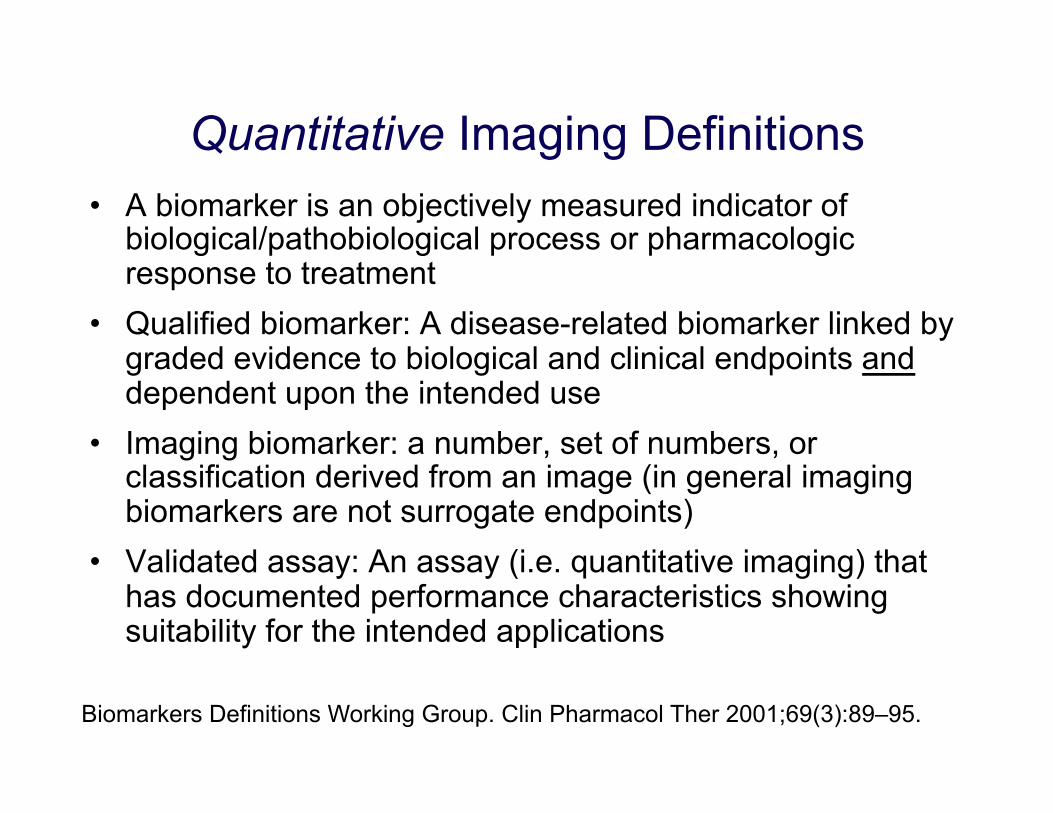
Quantitative Imaging Definitions • A biomarker is an objectively measured indicator of
biological/pathobiological process or pharmacologic response to treatment
• Qualified biomarker: A disease-related biomarker linked by graded evidence to biological and clinical endpoints and dependent upon the intended use
• Imaging biomarker: a number, set of numbers, or classification derived from an image (in general imaging biomarkers are not surrogate endpoints)
• Validated assay: An assay (i.e. quantitative imaging) that has documented performance characteristics showing suitability for the intended applications
Biomarkers Definitions Working Group. Clin Pharmacol Ther 2001;69(3):89–95.
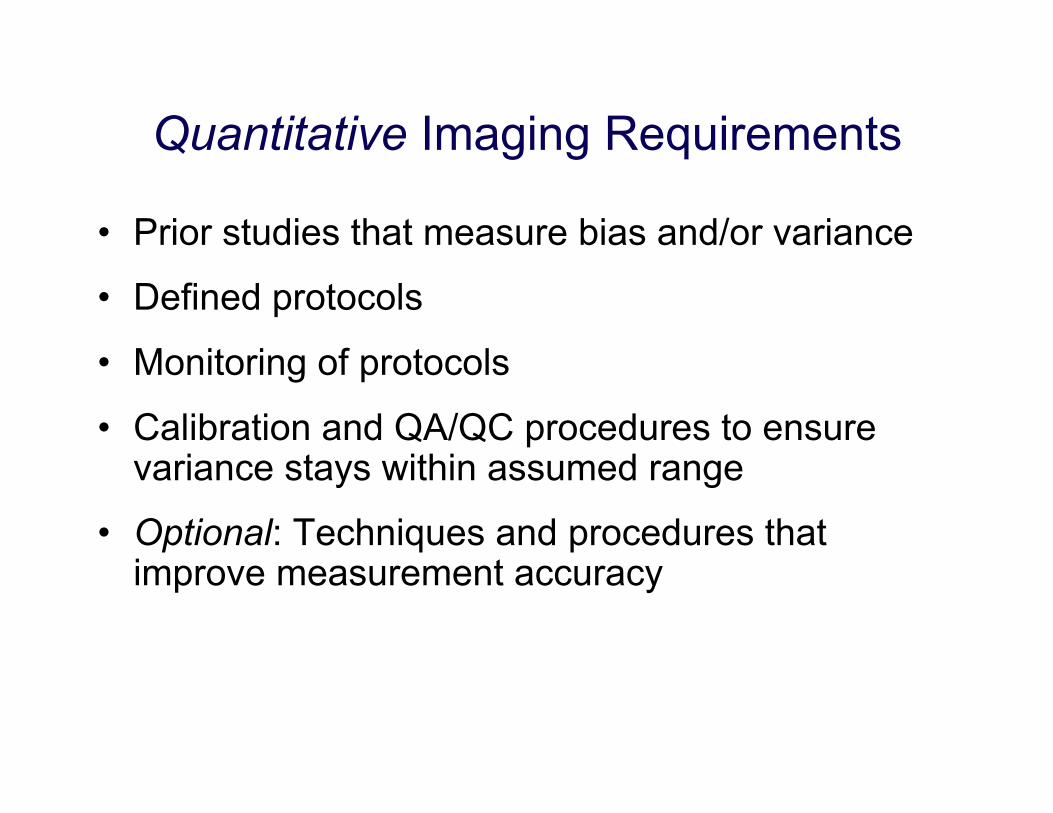
Quantitative Imaging Requirements
• Prior studies that measure bias and/or variance
• Defined protocols
• Monitoring of protocols
• Calibration and QA/QC procedures to ensure variance stays within assumed range
• Optional: Techniques and procedures that improve measurement accuracy

The Imaging Chain • Quantitative measurements have known a measurement
error, e.g. SUV = x ± y • For quantitative imaging each component of the imaging
chain requires: – Quality Assurance (i.e protocol saying what to do) – Quality Control (checking what actually happened)
• Outline of propagation of errors through main components for all imaging methods:
imaging physics scan
protocol processing & reconstruction
analysis methods
calibration
patient status
final accuracy & precision
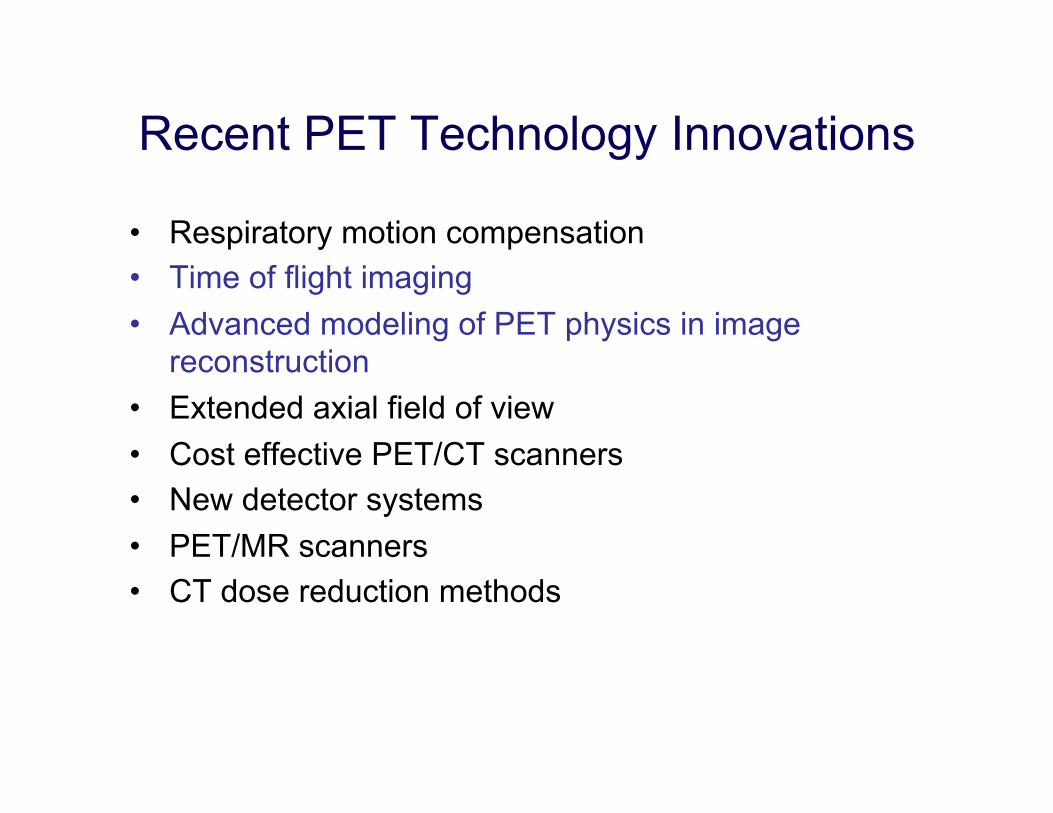
Recent PET Technology Innovations
• Respiratory motion compensation • Time of flight imaging • Advanced modeling of PET physics in image
reconstruction • Extended axial field of view • Cost effective PET/CT scanners • New detector systems • PET/MR scanners • CT dose reduction methods

75 kg patient, 120 MBq, 3 min/bed(BG = ~1kBq/cc)
0.25
0.5
0.75
1
1.25
1.5
0.1 1 10 100
Sphere volume (mL)
Re
co
ve
ry c
oe
ffi c
ien
t
VOI & EANM VOI & PSF+TOF
MAX & EANM MAX & PSF+TOF
Courtesy Ronald Boellaard
Clinical PET scanners are a moving target
• Hot sphere diameters of 10, 13, 17, 22, 28, and 37-‐mm
• Target/background ra(o 4:1
Modified NEMA NU-2 IQ phantom Different reconstruction methods on the same PET/CT scanner 75 kg patient, 120 MBq, 3 min/bed
(BG = ~1kBq/cc)
0.25
0.5
0.75
1
1.25
1.5
0.1 1 10 100
Sphere volume (mL)
Re
co
ve
ry c
oe
ffic
ien
t
VOI & EANM VOI & PSF+TOF
MAX & EANM MAX & PSF+TOF
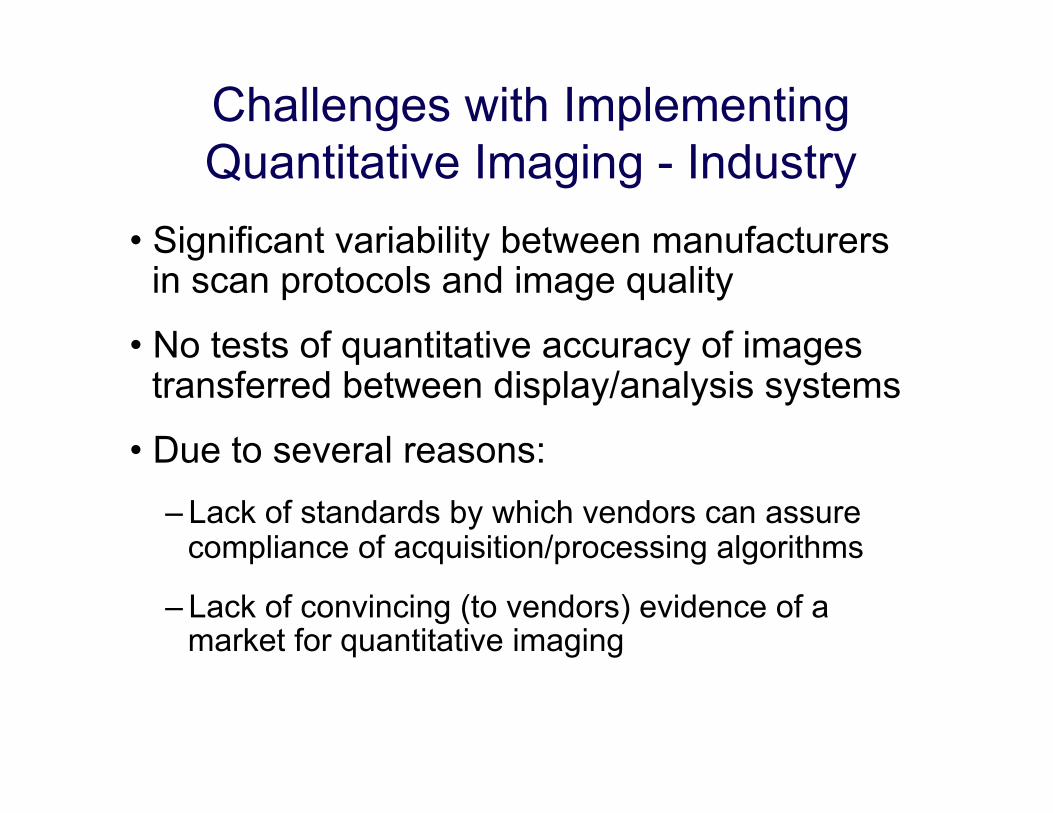
Challenges with Implementing Quantitative Imaging - Industry
• Significant variability between manufacturers in scan protocols and image quality
• No tests of quantitative accuracy of images transferred between display/analysis systems
• Due to several reasons: – Lack of standards by which vendors can assure
compliance of acquisition/processing algorithms
– Lack of convincing (to vendors) evidence of a market for quantitative imaging
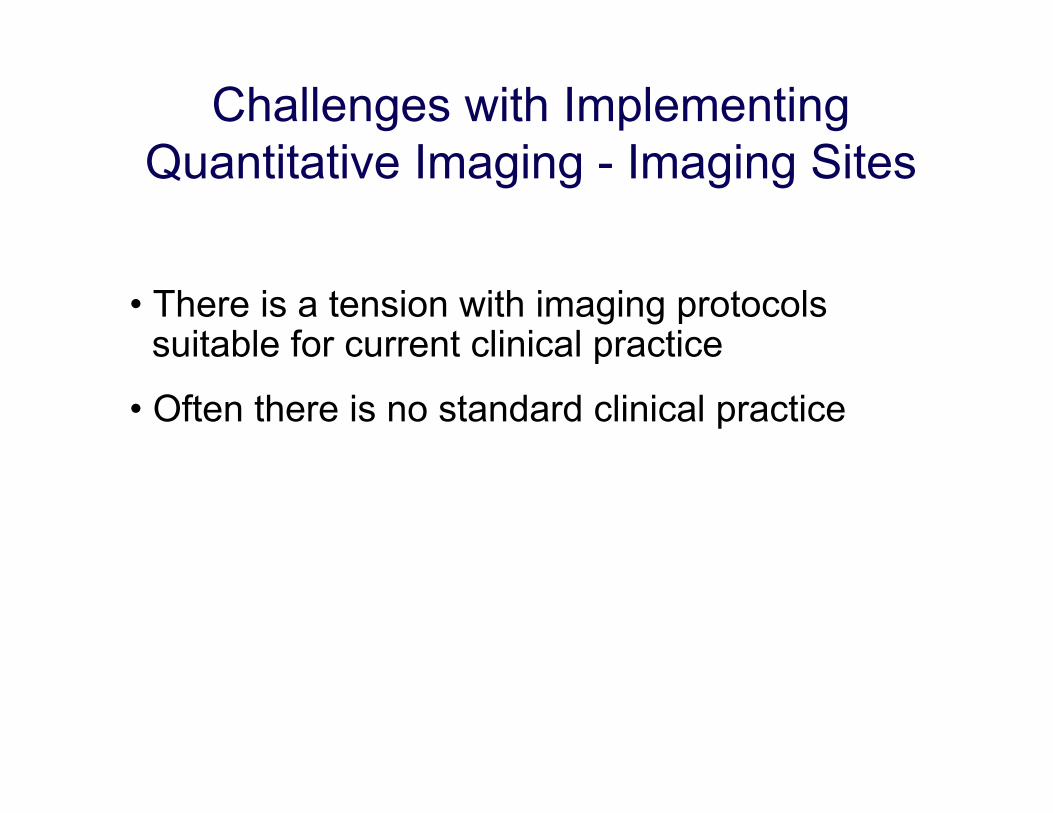
Challenges with Implementing Quantitative Imaging - Imaging Sites
• There is a tension with imaging protocols suitable for current clinical practice
• Often there is no standard clinical practice
Guidance for Industry Standards for Clinical Trial
Imaging Endpoints
DRAFT GUIDANCE This guidance document is being distributed for comment purposes only.
Comments and suggestions regarding this draft document should be submitted within 60 days of publication in the Federal Register of the notice announcing the availability of the draft guidance. Submit electronic comments to http://www.regulations.gov. Submit written comments to the Division of Dockets Management (HFA-305), Food and Drug Administration, 5630 Fishers Lane, rm. 1061, Rockville, MD 20852. All comments should be identified with the docket number listed in the notice of availability that publishes in the Federal Register.
For questions regarding this draft document contact (CDER) Dr. Rafel Rieves at 301-796-2050 or (CBER) Office of Communication, Outreach, and Development at 301-827-1800 or 800-835-4709.
U.S. Department of Health and Human Services Food and Drug Administration
Center for Drug Evaluation and Research (CDER) Center for Biologics Evaluation and Research (CBER)
August 2011 Clinical/Medical
I:\9676dft.doc 08/08/11
(FDA, August 2011)
Defines: • medical practice standard • clinical trial standard
“… clinical trial standard[s] for image acquisition and interpretation… exceed those typically used in medical practice.”
What do we do?
There are three main routes of action 1. Accreditation authorities 2. Standards definitions and
harmonization initiatives 3. Calibration methods and/or
phantoms
Quantitative Imaging Initiatives
• ACRIN Centers of Quantitative Imaging Excellence (CQIE)
• RSNA Quantitative Imaging Biomarkers Alliance (QIBA)
• NCI Quantitative Imaging Network (QIN)
• AAPM Task Group 145: Quantitative Imaging for PET
• Reconstruction Harmonization Project (ACRIN / SNM-CTN / QIN / QIBA)
• EANM and EORTC initiatives
Quantitative Imaging Network (QIN)
Laurence Clarke PhD, Science Officer Robert Nordstrom PhD: Lead Program Director Gary Kelloff MD: Science Officer CIP and RRP Program Staff
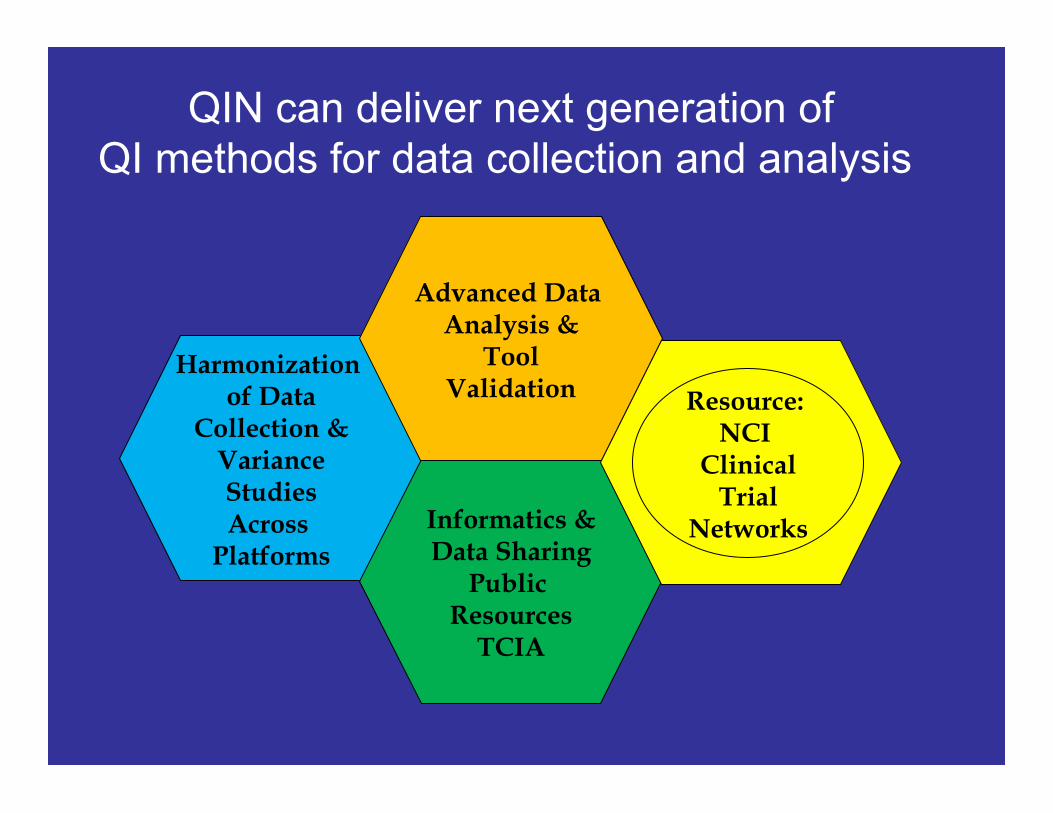
QIN can deliver next generation of QI methods for data collection and analysis
Harmonization of Data
Collection & Variance Studies Across
Platforms Informatics & Data Sharing
Public Resources
TCIA
Advanced Data Analysis &
Tool Validation Resource:
NCI Clinical
Trial Networks
H. Lee Moffitt
Vanderbilt Univ.
Univ. of Iowa
Univ. of Washington
Stanford Univ.
Univ. of Pittsburgh
Brigham & Women’s
Columbia Univ.
Mass General
Oregon Health & Science.
Johns Hopkins
Univ.
UCSF
MSKCC
Univ. of Michigan
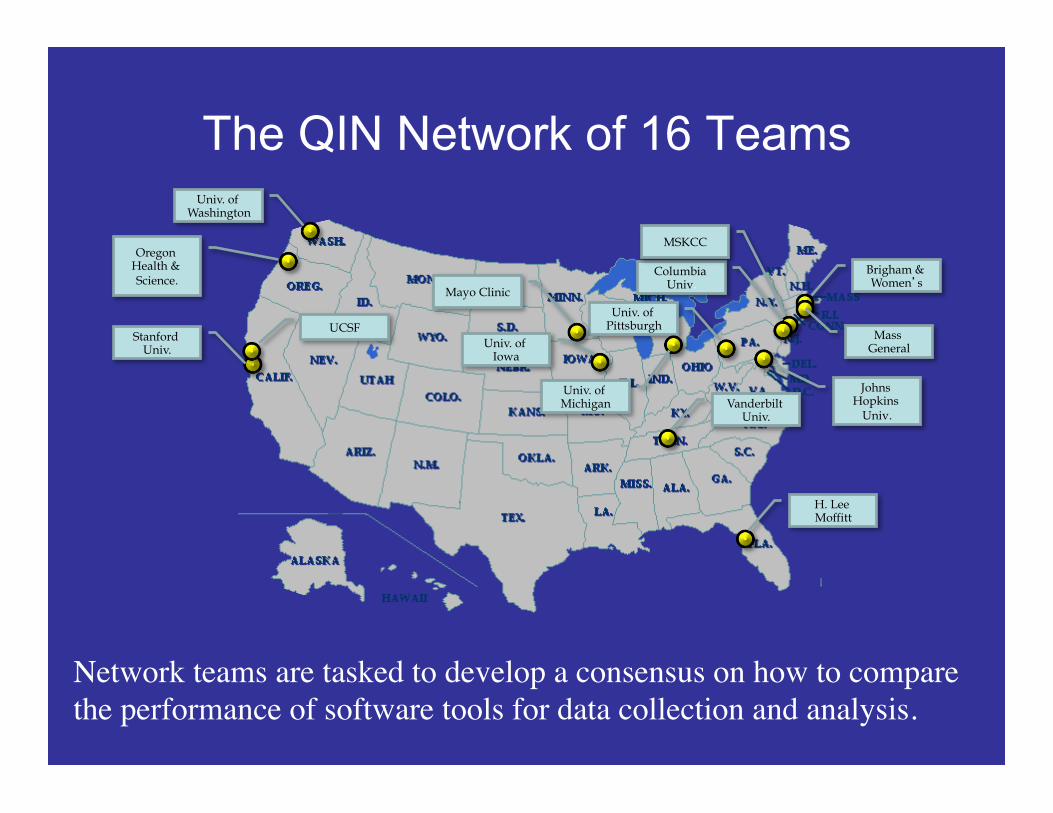
The QIN Network of 16 Teams
Network teams are tasked to develop a consensus on how to compare the performance of software tools for data collection and analysis.
Mayo Clinic
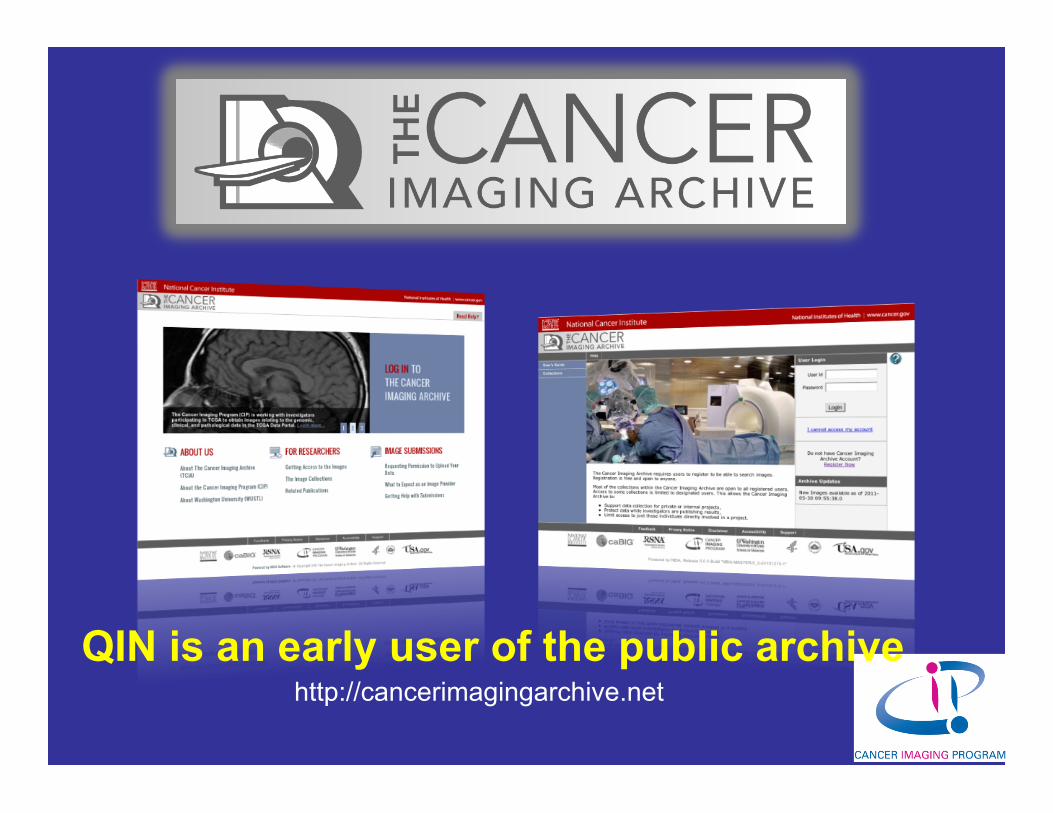
http://cancerimagingarchive.net QIN is an early user of the public archive.

Quantitative Imaging Biomarkers Alliance (QIBA)
• Basic premise for the RSNA: Extracting objective, quantitative results from imaging studies will improve the value of imaging in clinical practice
• Mission: Improve value and practicality of quantitative imaging biomarkers by reducing variability across devices, patients, and time.
• Build 'measuring devices' rather than imaging devices
• 'Industrialize' imaging biomarkers

QIBA Protocols & Profiles
• QIBA Profile Describes a specific performance Claim and how it can be achieved Establishes a written standard procedure for all parties to obtain an accurate and reproducible measurement that reflects an imaging biomarker of clinical interest
• UPICT Protocol (Uniform Protocol for Imaging in Clinical Trials) Consensus-derived description of a process to create quantitative medical images
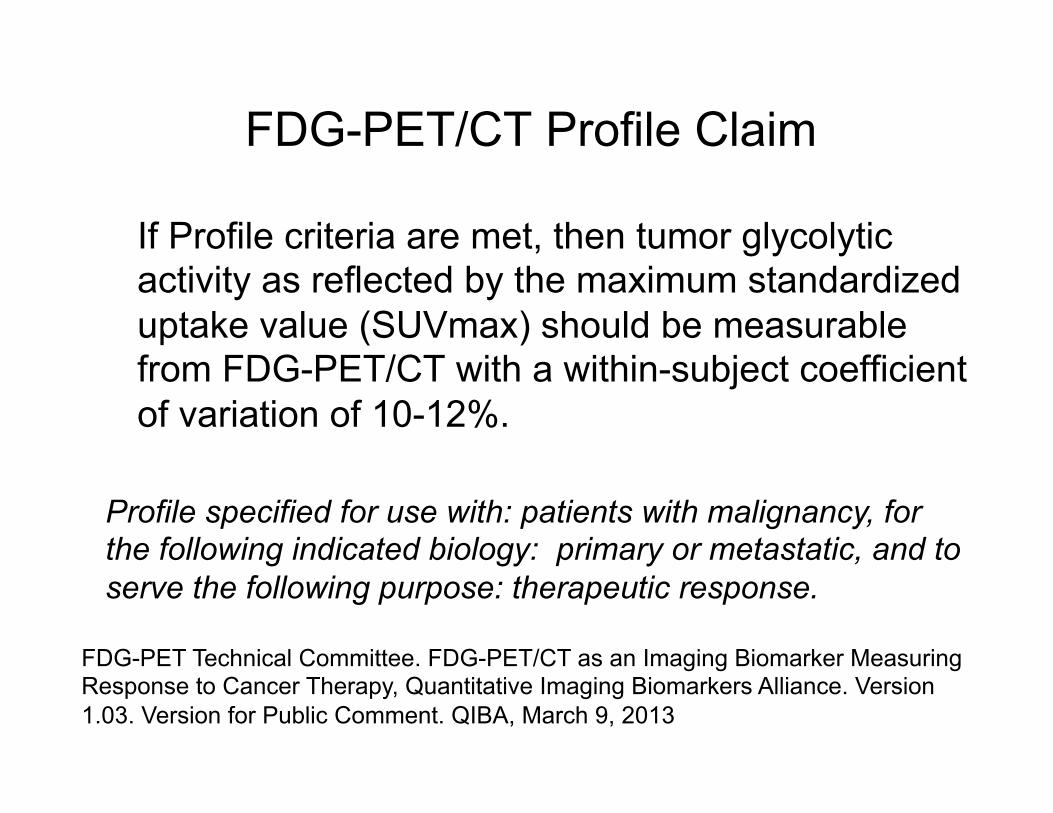
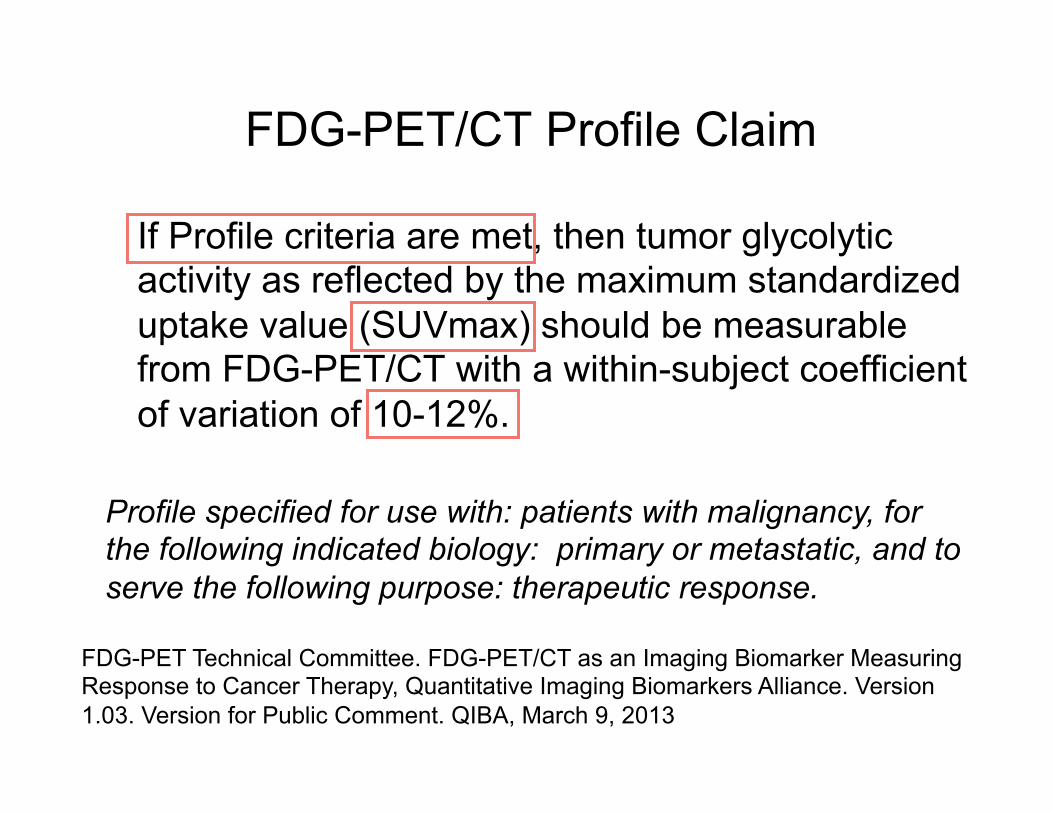
FDG-PET/CT Profile Claim
If Profile criteria are met, then tumor glycolytic activity as reflected by the maximum standardized uptake value (SUVmax) should be measurable from FDG-PET/CT with a within-subject coefficient of variation of 10-12%.
Profile specified for use with: patients with malignancy, for the following indicated biology: primary or metastatic, and to serve the following purpose: therapeutic response.
FDG-PET Technical Committee. FDG-PET/CT as an Imaging Biomarker Measuring Response to Cancer Therapy, Quantitative Imaging Biomarkers Alliance. Version 1.03. Version for Public Comment. QIBA, March 9, 2013
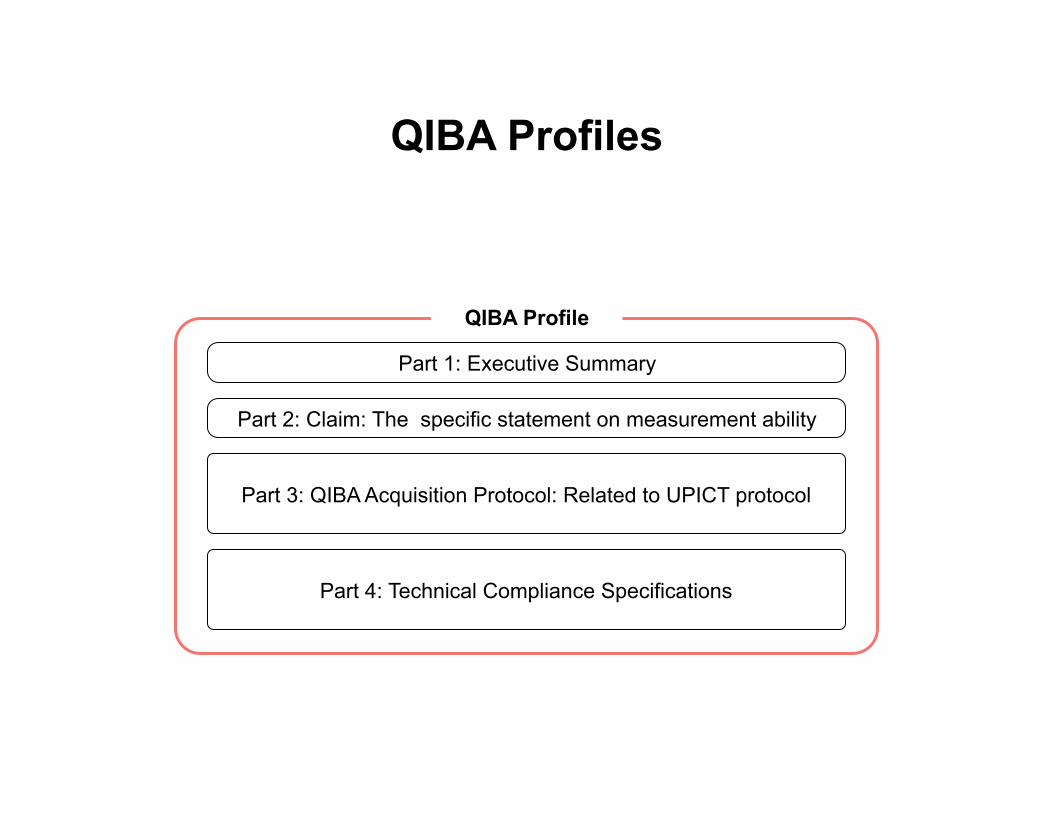
Part 4: Technical Compliance Specifications
QIBA Profile
Part 2: Claim: The specific statement on measurement ability
Part 3: QIBA Acquisition Protocol: Related to UPICT protocol
Part 1: Executive Summary
QIBA Profiles
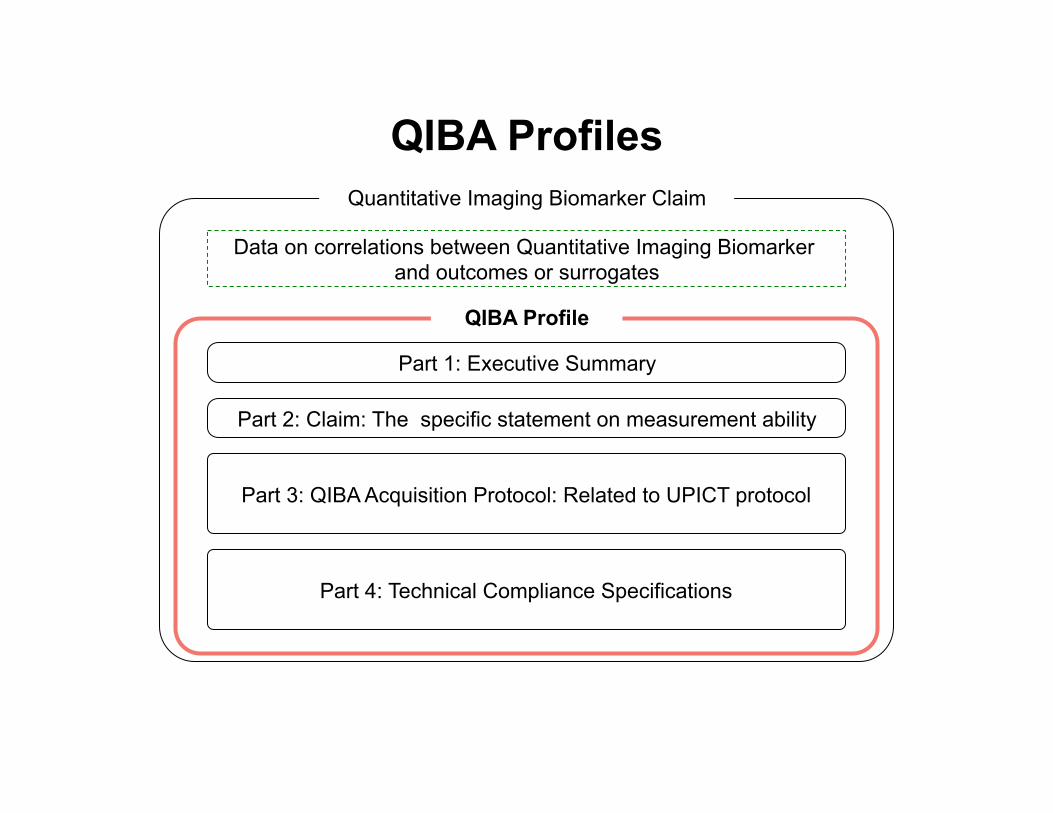
Quantitative Imaging Biomarker Claim
Data on correlations between Quantitative Imaging Biomarker and outcomes or surrogates
Part 4: Technical Compliance Specifications
QIBA Profile
Part 2: Claim: The specific statement on measurement ability
Part 3: QIBA Acquisition Protocol: Related to UPICT protocol
Part 1: Executive Summary
QIBA Profiles
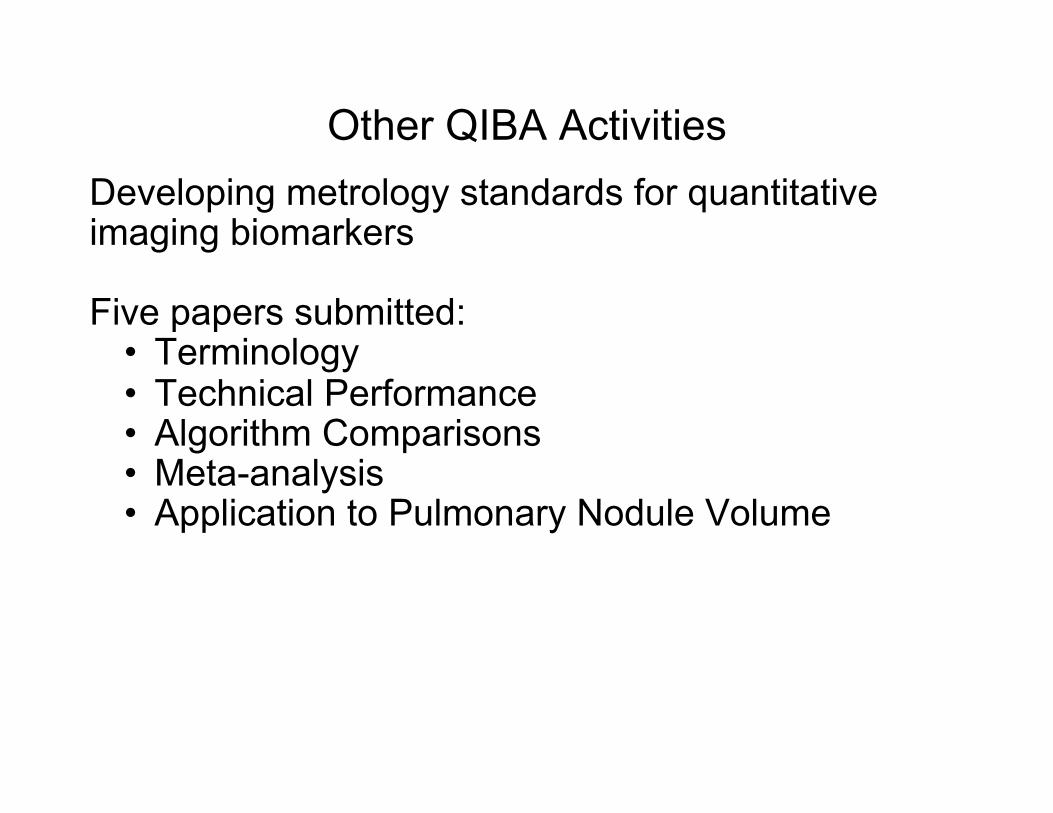
Other QIBA Activities Developing metrology standards for quantitative imaging biomarkers Five papers submitted:
• Terminology • Technical Performance • Algorithm Comparisons • Meta-analysis • Application to Pulmonary Nodule Volume

Calibration phantoms for Quantitative PET/CT Standards and/or Accreditation
• Uniform Cylinder (used by ACRIN and many others)
• ACR PET phantom • NEMA NU-2 Image Quality (IQ) phantom • Modified NEMA Image Quality (IQ) phantom • SNM CTN phantom • Cross Calibration Phantom with NIST-traceable
68Ge standard for Dose Calibrator • Digital reference object
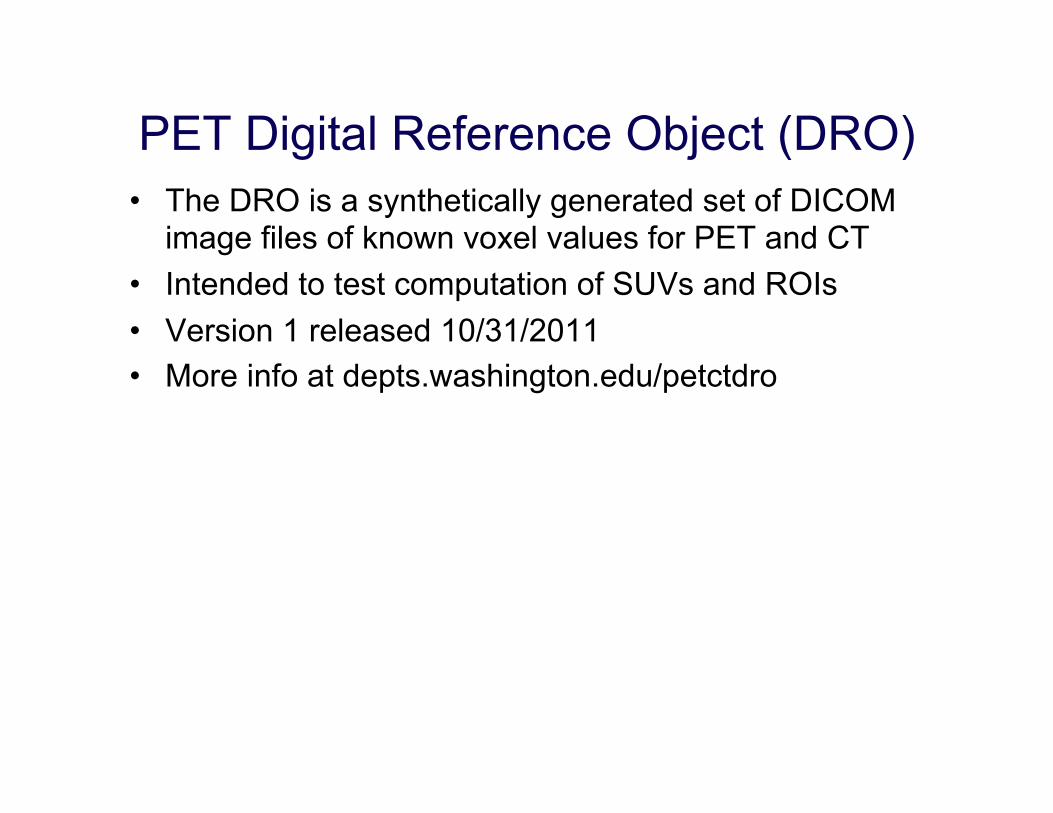
PET Digital Reference Object (DRO) • The DRO is a synthetically generated set of DICOM
image files of known voxel values for PET and CT • Intended to test computation of SUVs and ROIs • Version 1 released 10/31/2011 • More info at depts.washington.edu/petctdro
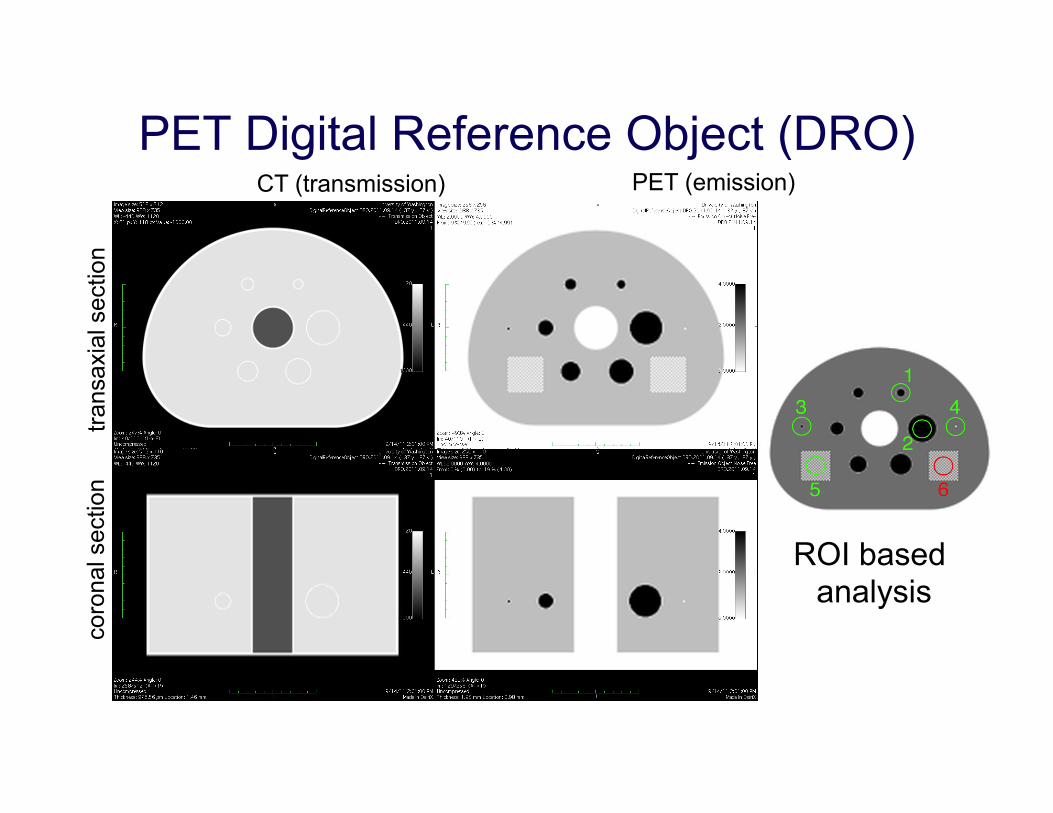
PET Digital Reference Object (DRO) CT (transmission) PET (emission)
trans
axia
l sec
tion
coro
nal s
ectio
n
ROI based analysis
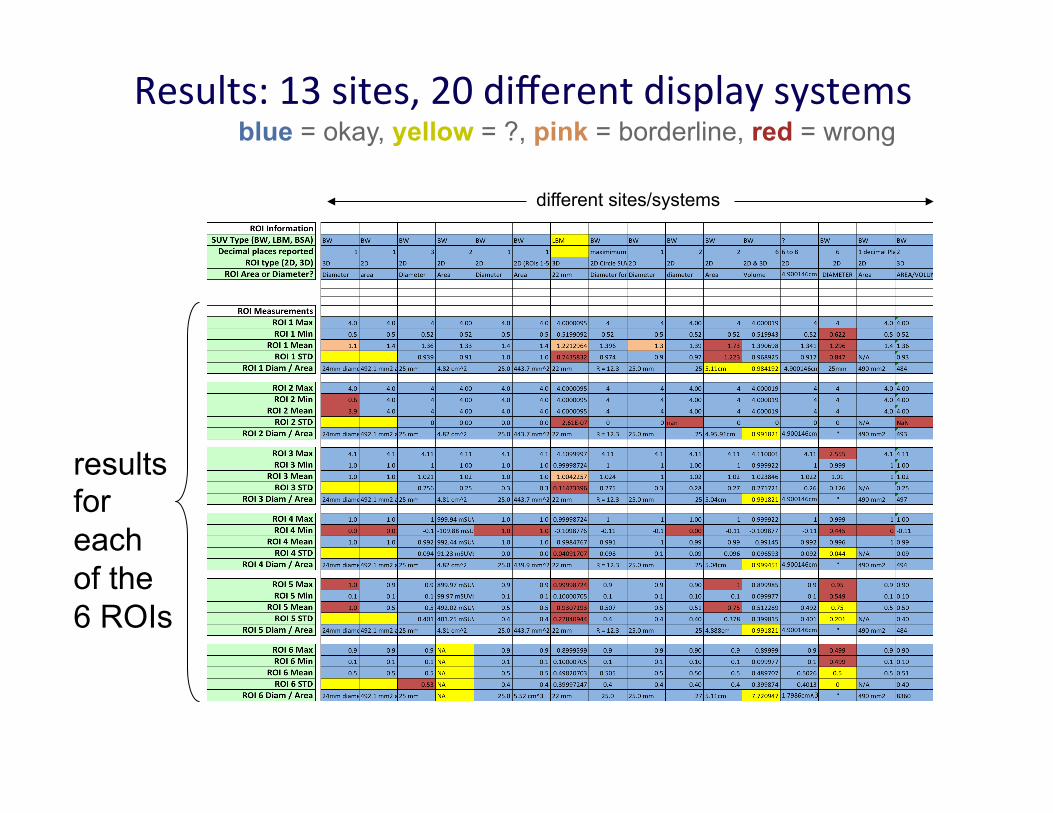
Results: 13 sites, 20 different display systems blue = okay, yellow = ?, pink = borderline, red = wrong
results for each of the 6 ROIs
different sites/systems

CONCLUSION
State of the art for FDG-PET/CT: Quantitative imaging requirements
• Test-retest studies in the literature demonstrate that quantitative image acquisition protocols are definable and possible
• To enable quantitative image acquisition protocols we need – Standards by which users can assure compliance,
e.g. QIBA Profile – Methods to collectively agree on data transfer and
analysis, e.g. QIN/ACRIN methods – Education for (and adoption by) radiologists, if they
are to remain in the image processing chain

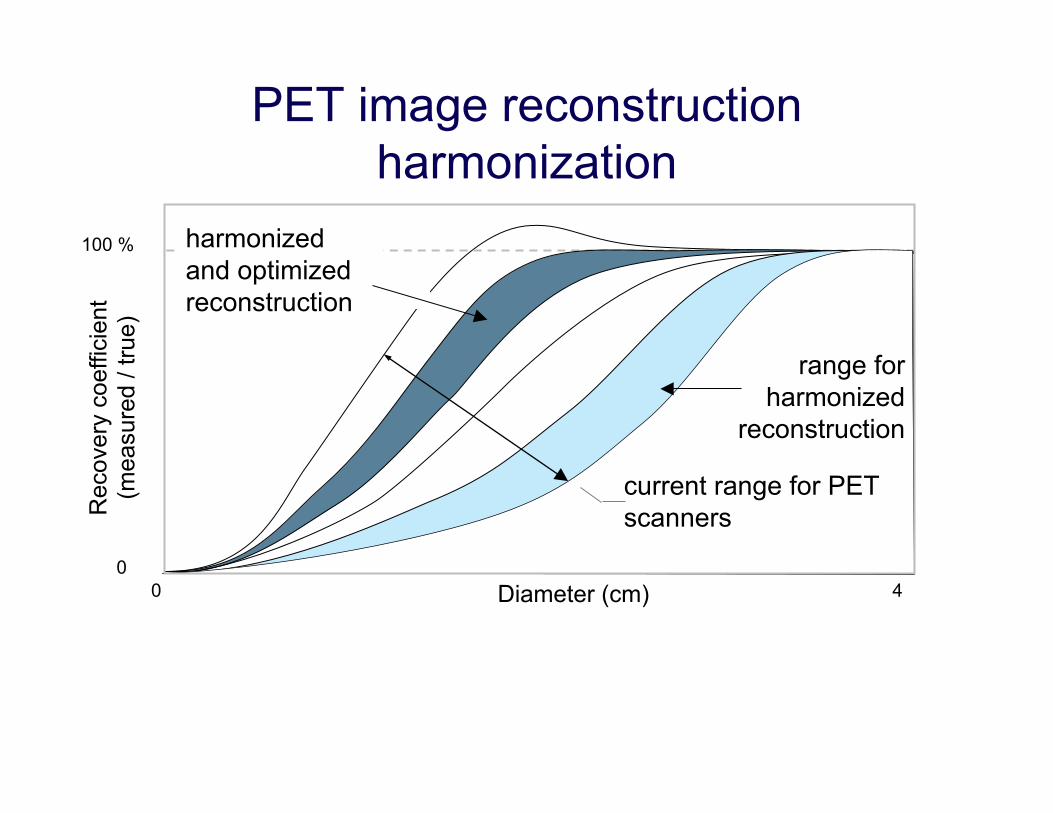
PET image reconstruction harmonization
Diameter (cm) 0 4 0
Rec
over
y co
effic
ient
(m
easu
red
/ tru
e)
100 %
current range for PET scanners
range for harmonized
reconstruction
harmonized and optimized reconstruction