Embed Size (px)
DESCRIPTION
Economic Speech. Washington Speeches. Background image located in: R:\Adm\f000024\2005 Social Security Speech\_cover\_cover\Cover-blue.jpg. February 6&8, 2007. Peter G. Peterson, Senior Chairman and Co-Founder, The Blackstone Group. The QUAD-DEFICITS. Long Term Budget Deficits - PowerPoint PPT Presentation
Citation preview

Peter G. Peterson, Senior Chairman and Co-Founder,The Blackstone Group
February 6&8, 2007
Economic Speech
Washington Speeches

PSERSThe Blackstone Group®2
The QUAD-DEFICITS
1. Long Term Budget Deficits 10 years and beyond
2. Current Account Deficits
3. Savings Deficits
4. Political or Leadership Deficit
These four deficits are inter-related and should be resolved together
PSERSThe Blackstone Group®3

PSERSThe Blackstone Group®4
The Concord Coalition: Using reasonable projections, entitlement and interest alone are expected to consume all federal revenues in under 20 years

PSERSThe Blackstone Group®5

PSERSThe Blackstone Group®6
Indeed, if the federal government had to observe Sarbanes-Oxley and ERISA and amortize its unfunded pension benefit liabilities over a maximum of 30 years the same way public corporations are required to do, it would add a minimum of $1.5 trillion annually to the federal budget deficit!

PSERSThe Blackstone Group®7
% of GDP
9.0%
1.0%0%
5%
10%
15%
Bush Tax Cuts Growth in EntitlementSpending from 2000 to 2040

PSERSThe Blackstone Group®8
Alternative 1: Social Security Reform: Borrow the Money
How much would we have to borrow? Between 2018 and 2042, how big are cumulative cash flow deficits? $5.4 trillion in inflation adjusted dollars!

PSERSThe Blackstone Group®9
[Section Title]

PSERSThe Blackstone Group®10
What about increased payroll taxes?
The cost of Social Security alone is due to rise from 11.2% of workers’ pay in 2006 to 17.5% in 2040. Hiking payroll taxes to cover the growing cost would put a heavy burden on the middle class – and that doesn’t include a much larger tax increase to cover projected costs of Medicare
11.2%
17.5%
0%
5%
10%
15%
20%
Cost in 2006 Cost in 2040
Perc
ent o
f Tax
able
Pay
roll
Alternative 2: Social Security Reform: Increase Taxes

PSERSThe Blackstone Group®11
The Concord Coalition: Using reasonable projections, entitlements and interest are expected to consume all federal revenues in under 20 years

PSERSThe Blackstone Group®12
2. Beyond benefit reductions, we should also seize this opportunity to increase personal savings, which are at historic low levels
I have come to conclude that America is so consumption and borrowing obsessed that one must seriously consider a program of mandatory savings much as Singapore, Chile, and recently Australia has instituted

PSERSThe Blackstone Group®13

PSERSThe Blackstone Group®14
Healthcare Costs: Pre- and Post-Medicare(U.S. vs. Other G-7 Countries)
Health Care Costs as a % of GDP
4.8%9.2%
5.6%
15.2%
0%
5%
10%
15%
20%
1965 2003US Other G-7 Countries

PSERSThe Blackstone Group®15
Healthcare Costs: Pre- and Post-Medicare(U.S. vs. Other G-7 Countries)
In per capita dollars, the U.S. spends more than twice the developed country average – $5,711 vs. $2,681 in 2003
And there is very little evidence that our health outcomes are anywhere close to being twice as good as other developed countries

PSERSThe Blackstone Group®16
We Also Spend Much More on Last Months of Life

PSERSThe Blackstone Group®17
We Also Spend Much More on High-tech, High-cost Medicine
High cost surgical procedures High cost equipment

PSERSThe Blackstone Group®18
Deficit #2: Current Account Deficits:
Previous Record in the 1980’s: 3.45% of GDP
Today: Nearly 7% of GDP (and widening by every account)
Import over $6 billion of foreign capital every work day
$2.9 billion to finance current account deficits
$3.2 billion to finance investments. These foreign borrowings finance about ¾ of our critically needed investments

PSERSThe Blackstone Group®19
PSERSThe Blackstone Group®20
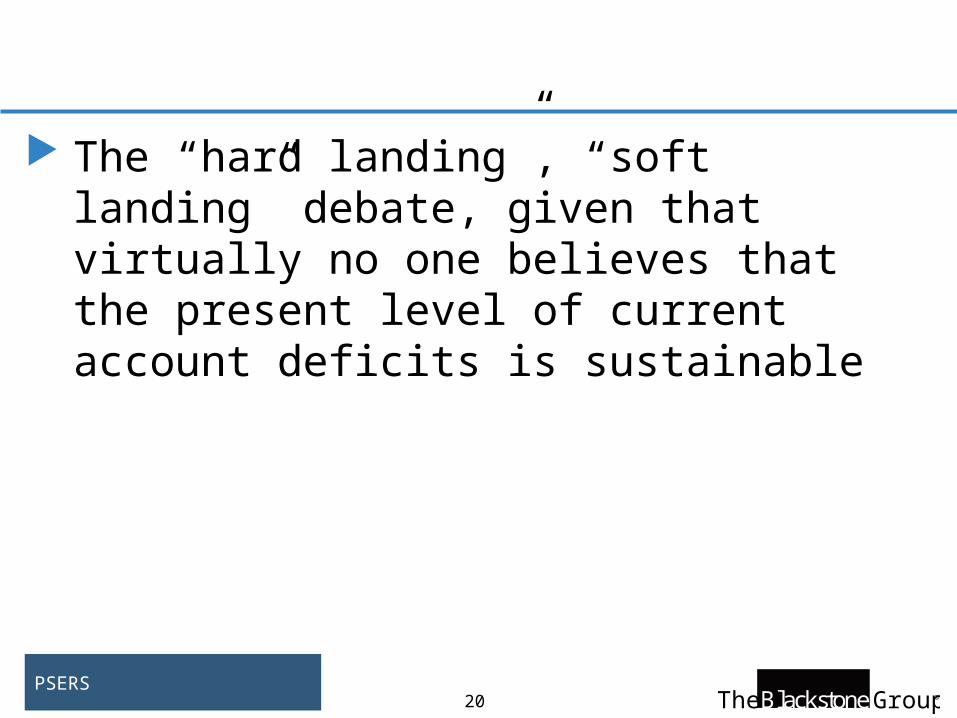
The “hard landing”, “soft landing” debate, given that virtually no one believes that the present level of current account deficits is sustainable

PSERSThe Blackstone Group®21
PSERSThe Blackstone Group®22
11.1%8.7%6.2%4.5%1.9%0%5%10%15%1960's1970's1980's1990's2006
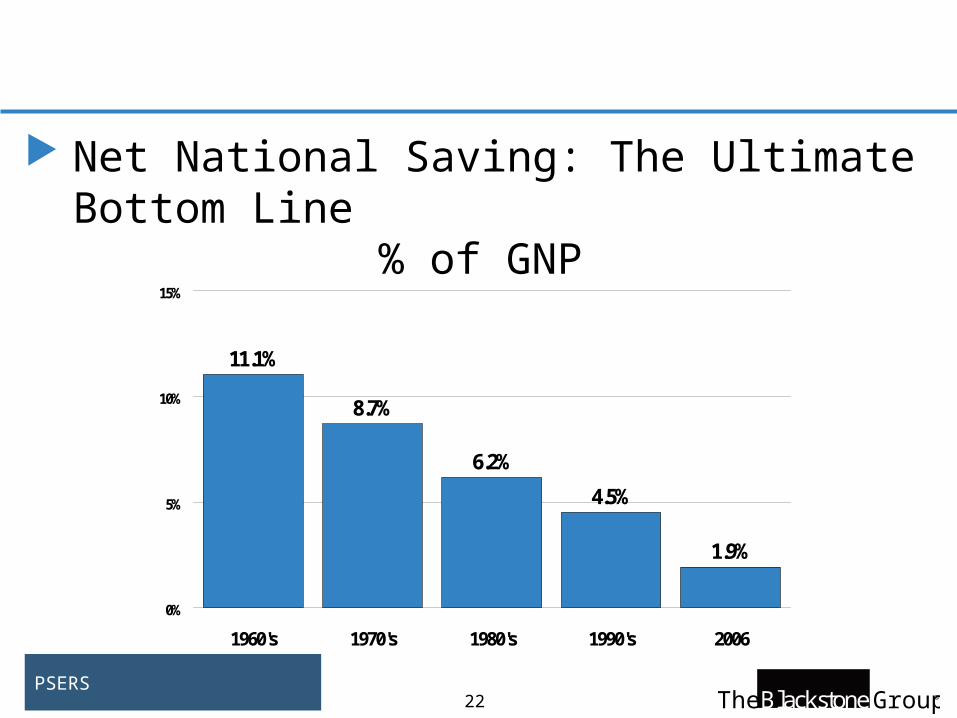
Net National Saving: The Ultimate Bottom Line
% of GNP
11.1%
8.7%
6.2%
4.5%
1.9%
0%
5%
10%
15%
1960's 1970's 1980's 1990's 2006

PSERSThe Blackstone Group®23
Personal Savings as a % of Disposable Income
-1.2%
7.9%
1992 3Q: 2006

PSERSThe Blackstone Group®24
Household Debt Service is 14.5% of Disposable Income as of Q3:06, a higher level than at any time in the last twenty-five years.

PSERSThe Blackstone Group®25
By some accounts, more than 60% of the country is considered in a housing “bubble” versus 40% a year ago(1)
1. Home price/income ratio more than 3 standard deviations above average.Source: Merrill Lynch

PSERSThe Blackstone Group®26
Ask All of Us A Rude Question:
Given that households are highly leveraged, that energy costs remain at high levels, that there are long term inflation fears and the potential for a decline in the dollar and a related increase in interest rates, what might be the effect of a significant rise in interest rates and a significant decline in housing values on consumer spending and the US economy?

PSERSThe Blackstone Group®27

PSERSThe Blackstone Group®28

PSERSThe Blackstone Group®29

PSERSThe Blackstone Group®30

PSERSThe Blackstone Group®31

PSERSThe Blackstone Group®32

PSERSThe Blackstone Group®33