Embed Size (px)
Citation preview

Peter Hobson - Brunel University, UK 3 July 2003
VPT 4 Tesla testing
An automated characterisation facility based at Brunel has been commissioned to handle VPT devices.
Samples (about 10%) from the production batch (of 15000 total) are now being tested at Brunel.
Currently processing about 60 tubes per month.
Small improvements over the last 6 months to improve stability of pulsed and DC LED and to minimise the effect of humidity on DC leakage currents.
Developing a new VPT carrier which could allow us to test around 200 per month or more.

Peter Hobson - Brunel University, UK 3 July 2003
4T System at Brunel
Floating unit1.5 kVmaximum
HV Anode
SR PS310
HV Dynode
SR PS310
DVM(General)
Keithley2700
GPIB BusIsolator
NI GBIB-120A
DVM(Floating)
Keithley2000
PCNT4 WorkStn
IEEE 488.2
Non-Floating0.5 kVmaximumDAQ Card
NI 6033E
Step Motor
Maclennan
PCI bus
RS 232
Automated VPT testerat Brunel. Mainly uses IEEE488.2 instruments.ADC is multiplexed and PCI based.
VPT andPre-amp
Anode current
Cathode current
Peter Hobson - Brunel University, UK 3 July 2003
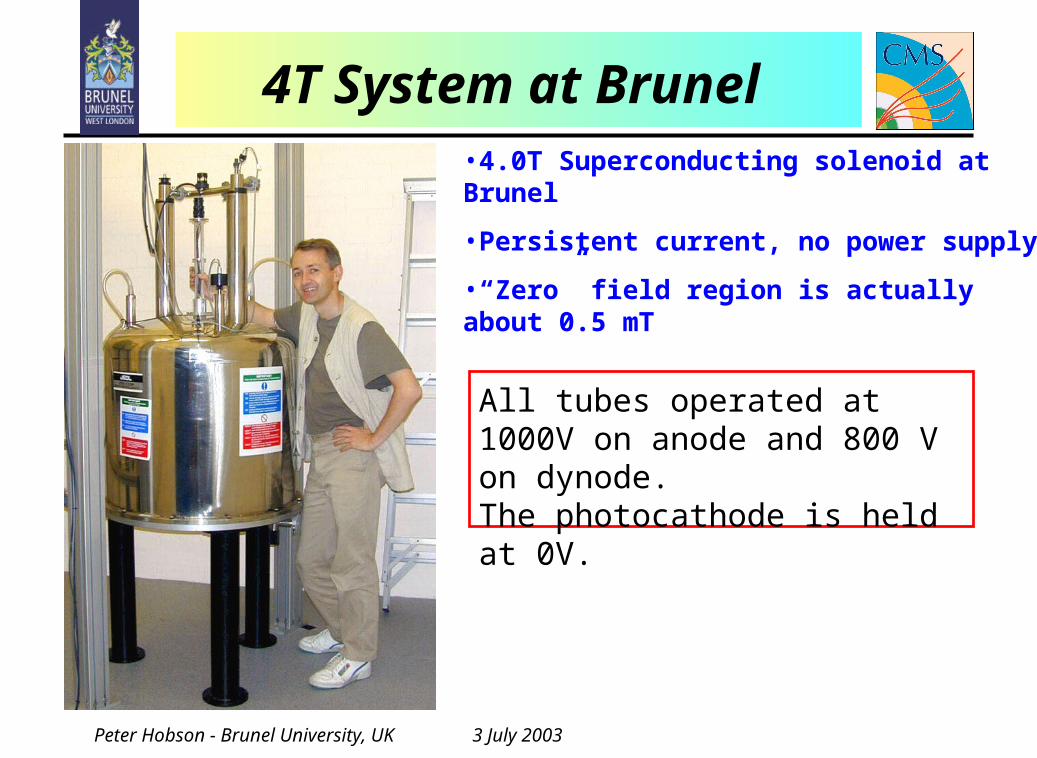
4T System at Brunel •4.0T Superconducting solenoid at Brunel
•Persistent current, no power supply
•“Zero” field region is actually about 0.5 mT
All tubes operated at 1000V on anode and 800 V on dynode.The photocathode is held at 0V.

Peter Hobson - Brunel University, UK 3 July 2003
DC illumination data
Tube 3273
0.00E+00
5.00E-02
1.00E-01
1.50E-01
2.00E-01
2.50E-01
1 11 21 31 41 51 61 71 81 91
Measurement number
Rec
ord
ed v
olt
age
acro
ss s
ensi
ng
res
isto
rs
Anode, illuminated
Cathode, illuminated
Dark currents
~ 180 nA (at 0T)
30 seconds

Peter Hobson - Brunel University, UK 3 July 2003
Pulsed LED data
Tube 3273
-5.00E-02
0.00E+00
5.00E-02
1.00E-01
1.50E-01
2.00E-01
2.50E-01
3.00E-01
1 1001 2001 3001 4001
Measurement number
AD
C v
olt
age
fro
m a
no
de
(pu
lsed
LE
D)
Signal
Pedestal
0T
4T
LED pulsed at 500 Hz
10 seconds
Peter Hobson - Brunel University, UK 3 July 2003
Measurement correlations
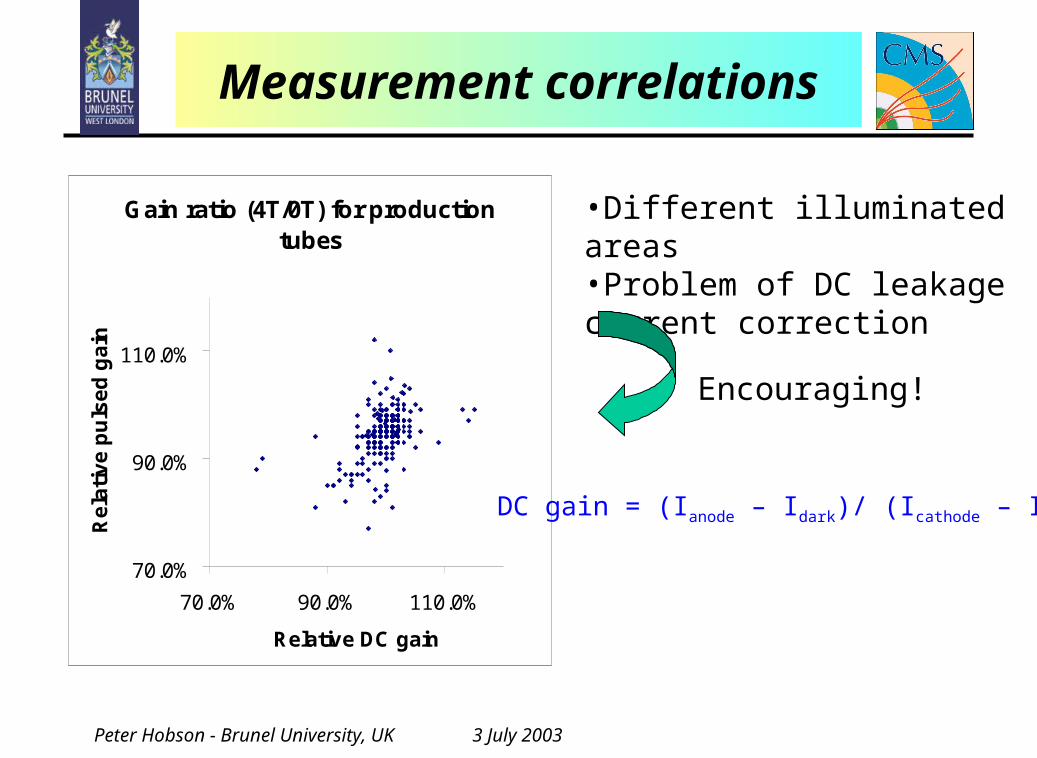
Gain ratio (4T/0T) for production tubes
70.0%
90.0%
110.0%
70.0% 90.0% 110.0%
Relative DC gain
Re
lati
ve
pu
lse
d g
ain
•Different illuminated areas•Problem of DC leakage current correction
Encouraging!
DC gain = (Ianode – Idark)/ (Icathode – Idark)

Peter Hobson - Brunel University, UK 3 July 2003
Batch acceptance test at 4T
Arrows indicate angular regions of
end caps
Production tubes
0
20
40
60
80
100
120
140
0.8 0.85 0.9 0.95 1 1.05 1.1 More
Relative 4T/0T pulsed gain (upper bin edge)
Nu
mb
er
in b
in
PassedVPT Axis at 15o to Magnetic Field
Central illumination

Peter Hobson - Brunel University, UK 3 July 2003
VPT Summary
About 10% of all delivered tubes have been measured at 4T, only one working tube failed to pass the acceptance criterion.
Some tubes noisy at 1.8T are also noisy at 4T. All tubes noisy at 4T were found to be noisy at 1.8T (or at 0T).
Almost all tubes at Brunel are measured by the same skilled technician consistency.
Problems with tubes (or system) are found rapidly due to on-line display of measured DC and pulsed data.
All raw measurement data is archived at Brunel, processed (summary) data is archived in a database at RAL.