Embed Size (px)
Citation preview

Peter Schnedlitz, Dirk Morschett,Thomas Rudolph, Hanna Schramm-Klein, Bernhard Swoboda (Eds.)
European Retail Research
GABLER RESEARCH EditorsDirk Morschett, University of Fribourg, Switzerland, [email protected] Rudolph, University of St. Gallen, Switzerland, [email protected] Schnedlitz, Vienna University of Economics and Business, Austria, [email protected] Schramm-Klein, Siegen University, Germany, [email protected] Swoboda, University of Trier, Germany, [email protected]
EDITORIAL ADVISORY BOARDIn the editorial advisory board, a number of distinguished experts in retail research from different countries support the editors:
– Steve Burt, University of Stirling, UK– Michael Cant, University of South Africa, South Africa– Gérard Cliquet, University of Rennes I, France– Enrico Colla, Negocia, France– Ulf Elg, Lund University, Sweden– Martin Fassnacht, WHU - Otto Beisheim School of Management, Germany– Marc Filser, University of Dijon, France– Thomas Foscht, University of Graz, Austria– Juan Carlos Gázquez Abad, University of Almeria, Spain– Arieh Goldman, Hebrew University, Israel (†)– David Grant, University of Hull, UK– Andrea Gröppel-Klein, Saarland University, Germany– Herbert Kotzab, Copenhagen Business School, Denmark– Michael Levy, Babson College, USA– Cesar M. Maloles III, California State University, USA– Peter J. McGoldrick, Manchester Business School, Manchester University, UK– Richard Michon, Ryerson University, Canada– Dirk Möhlenbruch, University Halle-Wittenberg, Germany– Heli Paavola, University of Tampere, Finland– Luca Pellegrini, IULM University Milan, Italy– Barry Quinn, University of Ulster, Northern Ireland– Will Reijnders, Tilburg University, The Netherlands– Thomas Reutterer, Vienna University of Economics and Business, Austria– Jonathan Reynolds, Oxford, UK– Sharyn Rundle-Thiele, University of Southern Queensland, Australia– Brenda Sternquist, Michigan State University, USA– Gilbert Swinnen, Universiteit Hasselt, Belgium– Ikuo Takahashi, Keio University, Japan– Waldemar Toporowski, University of Goettingen, Germany– Volker Trommsdorff, Technical University Berlin, Germany– Gianfranco Walsh, Koblenz-Landau University, Germany– Barton Weitz, University of Florida, USA– Joachim Zentes, Saarland University, Germany
Peter Schnedlitz, Dirk Morschett,Thomas Rudolph, Hanna Schramm-Klein, Bernhard Swoboda (Eds.)
European Retail Research 2010 | Volume 24 Issue I
RESEARCH
Bibliographic information published by the Deutsche Nationalbibliothek
The Deutsche Nationalbibliothek lists this publication in the Deutsche Nationalbibliografi e;
detailed bibliographic data are available in the Internet at http://dnb.d-nb.de.
”Jahrbücher zur Handelsforschung“ were fi rst published at:
Physica-Verlag (1986-1988)
Gabler Verlag (1989-1999/2000)
BBE-Verlag (2000/01-2004)
Kohlhammer Verlag (2005-2007)
The 24th Volume Issue I is sponsored by
1st Edition 2010
All rights reserved
© Gabler Verlag | Springer Fachmedien Wiesbaden GmbH 2010
Editorial Offi ce: Ute Wrasman | Sabine Schöller
Gabler Verlag is a brand of Springer Fachmedien.
Springer Fachmedien is part of Springer Science+Business Media..
www.gabler.de
No part of this publication may be reproduced, stored in a retrieval system
or transmitted, in any form or by any means, electronic, mechanical, photo-
copying, recording, or otherwise, without the prior written permission of the
copyright holder.
Registered and/or industrial names, trade names, trade descriptions etc. cited in this publica-
tion are part of the law for trade-mark protection and may not be used free in any form or by
any means even if this is not specifi cally marked.
Umschlaggestaltung: KünkelLopka Medienentwicklung, Heidelberg
Printed on acid-free paper
Printed in Germany
ISBN 978-3-8349-2254-0
Preface of the Editors
EUROPEAN RETAIL RESEARCH is a new bi-annual that is in the tradition of the reputable
and distinguished book series „Handelsforschung“ (Retail Research) which has been published
by Prof. Dr. Volker Trommsdorff in Germany for more than two decades. With Volume 22
appearing in 2008, Prof. Trommsdorff handed over this publication to a team currently consist-
ing of retail researchers from Austria, Germany and Switzerland. The aim of the publication is
to publish interesting manuscripts of high quality with a focus on retail researchers and lectur-
ers, retail students and retail executives. As it has always been, retail executives are part of the
target group and the knowledge transfer between retail research and retail management remains
a part of the publication’s concept. Following the international development in the field of retail
research and publication, the new team has decided to introduce some changes and extensions
to the concept:
- Language - articles will appear in English
- Content - manuscripts will be double-blind reviewed and the book will invite manuscripts
from a wider regional context but with a focus on Europe
- Institutional - a permanent team of editors will be supported by an Editorial Advisory Board
Frequency - EUROPEAN RETAIL RESEARCH will be published in two parts per year, Issue I
in spring and Issue II in fall. The review process will support the authors in enhancing the qual-
ity of their work and will offer the authors a reviewed book as a publication outlet. Part of the
concept is an only short delay between manuscript submission and final publication, so the
book is intended to become a quick publication platform. Therefore the deadlines are always
fixed. Issue I (publication in April): submission deadline: End of August, notification of accept-
ance: End of October, re-submission of revised manuscript: End of January. Issue II (publica-
tion in October): submission deadline: End of February, notification of acceptance: End of
April, re-submission of revised manuscript: End of June. An electronic database with all pub-
lished articles will be prepared and will be available with an adequate delay after the printed
edition.
EUROPEAN RETAIL RESEARCH welcomes manuscripts on original theoretical or conceptu-
al contributions as well as empirical research – based either on large-scale empirical data or on
the casestudy method. Following the state of the art in retail research, articles on any major
issues that concern the general field of retailing and distribution are welcome, e.g.
- different institutions in the value chain, e.g. customers, retailers, wholesalers, traders, service
companies such as logistics service providers, but also manufacturers’ distribution activities,
- different value chain processes, esp. marketing-orientated processes (e.g. innovation, customer
relationship management, category management), supply chain processes (e.g. purchasing,
logistics), organisational processes, informational or financial management processes,
V

- different aspects of retail management and retail marketing, e.g. retail corporate and compet-
itive strategies, incl. internationalisation, retail formats, e-commerce, customer behaviour,
branding and store image, retail location, assortment, pricing, service, communication, in-
store marketing, human resource management,
- different aspects of distribution systems, e.g. sales management, key account management, ver-
tical integration, alliances and networks, channel power, conflicts and multi channel strategies.
However, EUROPEAN RETAIL RESEARCH is also interested in manuscripts that focus on
wholesaling, distribution concepts, specific strategies or country markets and we accept that
non-English literature is used to. Basically, we are considering different types of papers. Arti-
cles can be based on large-scale empirical data, on the case-study method or on conceptual
issues:
- Research articles should provide a relevant and significant contribution to theory and prac-
tice; they are theoretically well grounded and methodologically on a high level.
- Manuscripts submitted as more practice- or conceptual-based articles show new questions,
issues, solutions and contributions from practice or conceptual issues. These papers are
selected based on relevance and continuing importance to the future retail research communi-
ty as well as on originality.
Manuscripts are reviewed with the understanding that they are substantially new, have not been
previously published in English and in whole, have not been previously accepted for publica-
tion, are not under consideration by any other publisher, and will not be submitted elsewhere
until a decision is reached regarding their publication in EUROPEAN RETAIL RESEARCH.
The only exceptions are papers in conference proceedings that we treat as work-in-progress.
Furthermore, the editors invite articles from specific authors, which address the retailing situa-
tion in a specific European country. Those articles will also be double blind reviewed.
Contributions should be submitted in English language in Microsoft Word format by e-mail to
the current EUROPEAN RETAIL RESEARCH managing editor or to info@european-retail-
research.org. Questions or comments regarding this publication are very welcome. They may be
sent to one of the editors or to the above mentioned e-mail-address.
Full information for prospective contributors is available at: http://www.european-retail-
research.org. For ordering an issue please contact the German publisher “Gabler Research”
(www.gabler.de).
We are extremely grateful for editorial assistance provided by Eva Lienbacher, Robert Zniva and
Ruth Angerer.
Fribourg, St. Gallen, Siegen, Trier and Vienna, Summer 2010
Dirk Morschett; Thomas Rudolph; Hanna Schramm-Klein; Bernhard Swoboda
Peter Schnedlitz (managing editor for Volume 24 Issue I)
VI Preface of the Editors
Contents
Interactive Web 2.0 Applications in the Multi-Channel Marketing for Retailers.................. 1
Dirk Möhlenbruch, David Elias Blunck and Falk Ritschel
How to Maintain a Process Perspective on Retail Internationalization: The IKEA Case ..... 27
Anna Jonsson
Trade Credit Periods in Retail Commerce for Products of Mass Consumption:An Application to Spanish Legislation.................................................................................. 51
Javier Oubiña, Jaime Romero and María Jesús Yagüe
Customer Satisfaction with Loyalty Card Programs in the Austrian Clothing Retail Sector- an Empirical Study of Performance Attributes Using Kano’s Theory ................................ 71
Eva Walter, Claudia Steyrer and Stefan Wiesel
Clustering Customer Contact Sequences - Results of a Customer Survey in Retailing........ 97
Sascha Steinmann and Günter Silberer
The In-Store Antecedents and Consequences of Perceived Shopping Valuefor Regularly Purchased Products ......................................................................................... 121
Wolfgang Weitzl and Robert Zniva
Strategic Differentiation in the Japanese Convenience Store Business.The Example of Lawson’s Format Variation.......................................................................... 149
Ari Huuhka, Nobutoshi Shimizu and Martti Laaksonen
Country Reports
Retailing in the United Kingdom - a Synopsis...................................................................... 173
Steve Burt, Leigh Sparks and Christoph Teller
The Danish Retail Market: Overview and Highlights ........................................................... 195
Jesper Aastrup, Mogens Bjerre, Niels Kornum and Herbert Kotzab
EUROPEAN
RETAIL
RESEARCHVol. 24, Issue I, 2010, pp. 1-222


Interactive Web 2.0 Applications in the Multi-Channel Marketingfor Retailers
Dirk Möhlenbruch, David Elias Blunck and Falk Ritschel
AbstractThis literature review recapitulates the state of the art knowledge about the characteristics ofWeb 2.0 instruments and deduces application options for multi-channel marketing by retailers.The different instruments of Web 2.0 and the theoretical foundations of multi-channel market-ing are introduced. The authors assign the specific Web 2.0 applications through the instrumen-tal areas of retailing by confronting their particular features and functions with the specificchances, risks, goals and the operational and strategic demands (needs) of multi-channel man-agement. This systematization gives retailers the chance to choose their instrumental assign-ments strategically, based on their specific goals in multi-channel marketing.
KeywordsRetailing, Multi-Channel Marketing, Web 2.0, Cross-Channel
Dirk Möhlenbruch (corresponding author)Department of Business Administration, Martin-Luther-University Halle-Wittenberg, Halle, Germany(Tel: ++49 345 5523391; E-mail: [email protected]).
David Elias BlunckInstitute for Innovation and Entrepreneurship, Martin-Luther-University Halle-Wittenberg, Halle,Germany.
Falk RitschelDepartment of Business Administration, Martin-Luther-University Halle-Wittenberg, Halle, Germany.
Received: September 3, 2009Revised: February 23, 2010Accepted: February 25, 2010
EUROPEAN
RETAIL
RESEARCHVol. 24, Issue I, 2010, pp. 1-26
1. Introduction
The discussion about Multi-Channel-Systems in retail business might not be new - but it
has gained momentum against the background of consolidations and mergers, the develop-
ment of information and communication technologies (ICT) and experiences of disillusion-
ment with pure e-commerce players (Dohmann et al. 2002; Barth et al. 2007). This is
additionally evidenced by the increasing number of academic publications and the gain in
importance of multi-channel distribution in retail-practice - where many pure e-players have
augmented their structure of distribution with alternative channels (Tang/Xing 2001; Schögel
et al. 2004).
Despite the lively discussions on the part of academic researchers and the growth of experience
in practice, there is still an unsatisfactorily low level of knowledge - which might be the reason
why companies often fail in the realization or achieve only suboptimal levels of channel inte-
gration - even though the domination of multi-channel companies in the B2C e-commerce sec-
tor (with the exception of a few companies, e.g. eBay or Amazon) implies a great potential for
success (Hudetz/Baal 2005; Emrich 2008). For this reason most authors seem to agree upon the
potential as well as the relevance of multi-channel distributors. Hudetz/Baal identify multi-
channel companies “a good starting base to get even more dominant in the future” (Hudetz/Baal
2005, p. 136). Emrich agrees that multi-channel strategies might become “crucial to survive”
(Emrich 2008, p. 1), and Ahlert/Hesse (2003) substantiate with empirical studies the preference
that customers have for multi-channel distributors.
The ability to establish, integrate and uplink different distribution and communication channels
becomes one of the main challenges in retail management. This applies especially against the
background of the enormous intensity of competition in this field. Even though there is an
undisputedly high impact of the internet on the buying decisions of consumers, many retail
companies use this important medium not as a strategically integrated interactive communica-
tion and customer-retention tool, but more like an encrypted business card (Silberer 2002). In
this context, Web 2.0 and its applications gain importance but are often disputed as controver-
sial. Neither Web 2.0 nor its applications can be limited to a single technology - in fact it should
be understood as new perceptions and uses of the internet, with a strong leaning towards inter-
action (Thackeray/Neiger 2009). While roles on the internet have been separated in the past
between the active content producers and passive content consumers, today the use of inter-
active instruments - like wikis, blogs, virtual communities and RSS feeds for example - allows
not only new business models in e-commerce but enables a close and interactive dialog between
companies and their relevant stakeholders (Kollmann/Häsel 2007).
Despite the already-mentioned range of scientific and practical-oriented specific literature
about the topics of Web 2.0 and multi-channel marketing and against the background of the
2 European Retail Research, Vol. 24, Issue I, pp. 1-26
importance of the online-channel, surprisingly little attention has been paid to the specific
potentials of Web 2.0 applications in multi-channel marketing in the retail business, and Web
2.0 is still in an experimental stage in practice (Marfleet 2008; Ailawadi et al. 2009). This arti-
cle therefore describes the necessary theoretical backgrounds of multi-channel marketing and
Web 2.0, displays the characteristics of the specific instruments, and confronts their particular
features and functions with the explicit chances, risks, goals and operational- as well as strate-
gic demands of multi-channel management to deduce a systemization of application fields of
Web 2.0 applications through the different instrumental areas of retailing. This gives retailers
the chance to choose their instrumental assignments strategically based on their specific goals
in multi-channel marketing.
2. Theoretical Background of Multi-Channel Retailing
The complexity and heterogeneity of retailing, combined with inconsistent market structures
(Zentes/Morschett 2005) are important reasons that a comprehensive characterization of the
market environment cannot be carried out in adequate dimensions. We will therefore limit the
description to the spurring factors with the highest influence on the general development in
retail business (Barth et al. 2007) and on Multi-Channel-Business in particular (Ahlert/Hesse
2003; Bachem 2004). Increasing mobility and the development of ICT (which, among other
things, leads to new marketing channels and increasing capacities in the back end) expand the
competitive situation in retail business to an additional geographical level (Purper 2007). The
intensity of competition increases the need for a consistent orientation toward customer require-
ments, market demarcation, and boosts accelerated tendencies towards consolidation processes
in reseller markets (Zboralski/Gemünden 2004; Weinberg/Purper 2006). Accordingly, the
changes in society’s values - which precede the changes in buying behavior - have a higher
impact on developments in the retail business. There has been a lively scientific discussion
about changes in consumer behavior for quite some time, but the dynamics as well as the
dimensions of those developments present themselves in a new quality (Foscht/Swoboda 2007).
While the debates about brand- and price-related behavior have been supplemented since the
early 1990s by terms like “hybrid customer”, “smart shopper”, “bargain shopper”, “variety
seeking” and “convenience orientation” is the phenomenon of “multi-optional consumers”
increasingly mentioned in modern marketing literature (Hurth 2002; Foscht/Swoboda 2007).
Those types of consumers follow different acting principles at once and change their behaviors
and group memberships as well, which results in multi-optional buying behavior and shifts
between different distribution channels during a single buying process (Wegener 2008; Ahlert/
Hesse 2003). Their differentiated needs are not limited to the actual transaction but range over
the whole buying process including pre- and post-buying phases (Möhlenbruch/Schmieder
2002). These developments have a great impact on multi-channel distribution and lead to the
Möhlenbruch, D.; Blunck, D.E.; Ritschel, F. 3
necessity of meeting the differentiated needs of consumers during the various phases of a buy-
ing process through the implementation of an integrated multi-channel system (Hurth 2002;
Kilcourse 2008; Kwon/Lennon 2009).
Even though multi-channel marketing is not a new phenomenon (Möhlenbruch/Schmieder
2002; Barth et al. 2007.) the scientific literature does not offer a standardized definition
(Schramm-Klein 2003; Hudetz/Baal 2005; Wirtz 2008). In fact there are a multitude of terms
and definitions dealing with sales and communications via several channels which appear sim-
ilar at a first glance, but often differ in meaning (Wirtz 2008). Multi-channel marketing of
retailers is defined in this paper as “market oriented management of retailers using a multitude
of parallel and integrated information, communication, and distribution channels” (Möhlen-
bruch/Schmieder 2004, p. 104). This includes the strategic planning and operational application
of the whole marketing-mix of retailers with the objective to develop new distribution channels
or to strengthen existing ones, respectively. While strategic retail management establishes new
potentials for success, operational retail management is geared to tap the full potential of exist-
ing chances for success and defines the operational instruments to serve as strategic pillars
(Ahlert 2002).
The integration of different channels with an otherwise homogeneous system allows retailers to
meet the multi-optional behavior of consumers and their differentiated needs during the respec-
tive phases of a buying process (Schramm-Klein 2003; Möhlenbruch/Schmieder 2004). There
are potentials for integrated multi-channel systems, especially during the initiation phase, for
upscale products and distance selling (Baal/Hudetz 2007). Additional customer acquisition,
retention and win-back potentials open up through the integration of distance channels, the
expansion of market areas and the chance to meet the channel-specific preferences of cus-
tomers (Schröder 2005). Furthermore, empirical studies prove a higher loyalty of consumers to
integrated Multi-Channel-Systems (compared to mono- or multiple-channel retailers) and high-
er turnover per customer and therefore invalidating the fear of channel cannibalization
(Ahlert/Hesse 2003; Baal/Hudetz 2004; Wegener 2008). According to these findings, multi-
channel retailing allows for increasing market share at the expense of competitors’ (Schramm-
Klein 2003; Schröder 2005). The combination of different channels can also build trust and
enlarge the perceived service competence. Additionally, the integration of innovative channels
can help to vitalize the brand image and demarcate markets (Wegener 2008). Last, but not least,
the potential to decrease costs in communication and market research through direct- and indi-
vidual customer approaches and an active navigation of interaction to the most efficient chan-
nel should be mentioned (Schröder 2005). On the other hand, channel conflicts and a lack of
channel flexibility are potential risks of multi-channel strategies (Kilcourse 2008). If synergetic
effects and goodwill transfer are seen as important goals of an integrative branding of market-
ing channels it is obvious that negative experiences can also have unwanted effects on the whole
4 European Retail Research, Vol. 24, Issue I, pp. 1-26
system (Hurth 2002). Imperfect channel integration can complicate communication with cus-
tomers and can lead to confusion in cases of incoherent goods and services, image positions,
levels of prices, and service quality in the respective channels (Möhlenbruch/Schmieder 2002;
Ahlert/Hesse 2003; Kreutzer 2008).
Integrative planning, monitoring and controlling of different channels and their differentiated
sale- and handling processes, combined with the necessary rearrangement of cross-channel
customer contacts, implies a high coordination effort and often leads to the limiting of integra-
tion efforts to standardized purchase transactions (Ahlert/Hesse 2003; Wegener 2008). Realiz-
ing the already mentioned potentials for success, however, requires increased effectiveness of
market cultivation as well as using efficiency- and synergy effects (Bachem 2004). While the
first is dependent on a consistent perception of the retail brand in all channels, integrated mer-
chandise planning, control systems and customer relationship management system are basic
prerequisites for the second (Hurth 2002; Böing et al. 2003). This requires a corresponding
infrastructure, cross-channel coordination of the marketing-mix, and a relocation of channel-
specific marketing budgets (Hansen/Madlberger 2007). The knowledge of customer needs and
their basic trends gains importance in the specific market environment of retailing (Möhlen-
bruch et al. 2007; Promondo 2007). Multi-channel retailers have to use all contact points with
their customers to gather relevant information concerning buying behavior and have to combine
this with a comprehensive and differentiated picture of consumers (Schröder 2005). In chapter
3 we will analyze the specific contributions of Web 2.0 applications to the already mentioned
requirements, tasks and goals of multi-channel marketing.
3. Foundations of Web 2.0
The internet and associated technologies are developing rapidly. Consequently, the portfolio of
technical resources for the effective and efficient ascertainment, archiving, processing, and
transmission of data, information and knowledge is continuously growing. Accordingly, the
electronic realization of business processes through electronic media has obtained more and
more economic relevance for an increasing number of vendors in the last years (Lihotzky
2003). Many of the technological changes are summarized under the term “Web 2.0”, which is
not yet precisely defined. Most of the attempts to define Web 2.0 go back to a definition of
O’Reilly, who understands the term more as an approach than a technology (O’Reilly 2005).
Even though there is no precise definition, most publications seem to agree in the characteriza-
tion of the central idea of Web 2.0: Internet users transform from passive consumers of mostly
static content to active, content producing and distributing participants (Kreutzer/Merkle 2008).
According to O’Reilly (2005), there are a number of other characteristic requirements for appli-
cations belonging to the term Web 2.0:
Möhlenbruch, D.; Blunck, D.E.; Ritschel, F. 5
- The application is net based; only a web browser is essential.
- The content is not static but is going to be dynamically generated. It will change depending
on the input of the user.
- There are possibilities for users to generate content by themselves.
- Role and authorization models enable the differentiation of who is enabled to view which
content and who is allowed to edit the information.
- Users own their data and are able to edit it by themselves. There are possibilities for personal-
ized content and layout.
- Users are able to comment on articles by other people and communicate among each other.
- A strong community feeling is going to develop between users.
Since economic and technical principles are as important for Web 2.0 applications as socio-
economic, psychological and legal aspects, it’s safe to say that the limitation of the phenomenon
Web 2.0 to specific instruments or technologies is not valid. In fact it is rather based on a modi-
fied attitude towards electronic media on the whole and the internet in particular (Kollmann/
Häsel 2007; Möhlenbruch et al. 2007). To discuss the specific potentials of Web 2.0 applications
for multi-channel marketing for retailers later on, it first seems necessary to take a closer look at
the paradigms and underlying motivational structures of internet users. Due to the dynamic
changes in electronic media the following explanations can make no claim to be complete.
Efficient search-engines, open interfaces and usability of web-based software gain in impor-
tance by enabling user self-service and orientation (Alby 2008; Kreutzer/Merkle 2008; Töpfer
et al. 2008). This technological development combined with growing user participation enable
new possibilities for personalization and individualization and therefore a consequent orienta-
tion on the differentiated consumer needs (Schenk 2007). Moreover, internet applications are
increasingly based on user-generated content and have to open themselves for participation
(O’Reilly 2005; Schenk 2007). At the same time Web 2.0 is changing the proportions between
individuality and collectivity, culminating in a virtual collective intelligence which is learning
with every new participator (Richard 2008). Additional benefits in terms of knowledge quality
improvement are generated through collaborative inspection, systematization and validation of
information on the internet (Kollmann/Häsel 2007). Those benefits increase, according to Met-
calfe’s Law, with the number of active internet users (network effects) which develop a sense of
community over the time (Möhlenbruch et al. 2008). Nevertheless, Web 2.0 applications have
to be understood as a part of a continuous development process which is not an expression of
defective planning but of inherent adaption flexibility (Kollmann/Häsel 2007). Simplicity and
lightweight user interfaces of net-based software applications have relatively low hardware
requirements for end-user devices and boost an increasing convergence of the internet, tele-
vision and mobile telephony (Kollmann/Häsel 2007). Open interfaces and technologies like
AJAX enable the combination of separated (knowledge) resources as well as the cross-linking
of interactive information and collaboration (O’Reilly 2005; Souders 2007).
6 European Retail Research, Vol. 24, Issue I, pp. 1-26
It has to be mentioned that user generated content and the joint development of open source
software create specific problems concerning copyrights. On the one hand it is essential to pro-
vide open licenses to benefit from the collective cooperation in communities but on the other
hand there are growing concerns of users about the (commercial) use of personalized data, con-
tent and applications (O’Reilly 2005). But it’s not enough to limit the view on new technologi-
cal options of participating users, in fact it’s necessary to take a closer look at the motivation of
users to participate and provide information and content (Schenk 2007). Self-expression and
image cultivation by publishing, for example, one’s own interests, opinions or achievements are
the driving factors for providing user generated content (Mühlenbeck/Skibicki 2008). This is
closely connected to a general talkativeness of some individual users and their desires for (vir-
tual) contacts. Needs can be satisfied through Web 2.0 in manifold ways (Sassenberg 2008).
Furthermore there are a lot of platforms like Second Life or Weblin which allow users a tem-
porarily escape from reality (escapism) and enable them to present themselves in a way they are
prevented from doing in real life (Kreutzer/Merkle 2008). Since the number of active partici-
pants in Web 2.0 is much lower in proportion to passive content consumers, and the quality of
additional benefits and network effects depends on the amount and quality of user-generated
content, provider and other business models should try to satisfy the commercial motives of
users in order to reward their content supply (Drüner et al. 2007). While searching for relevant
information during buying decisions reduces transaction costs, consumer-generated content
helps the social orientation and reduces the social risks of buying decisions. Moreover, there is
a strong bonding phenomenon inside social communities, even for passive users who often pro-
vide each other additional technical assistance for the use of products or services (Hennig-Thu-
rau 2005). The paradigms described above lead to a number of applications often linked to the
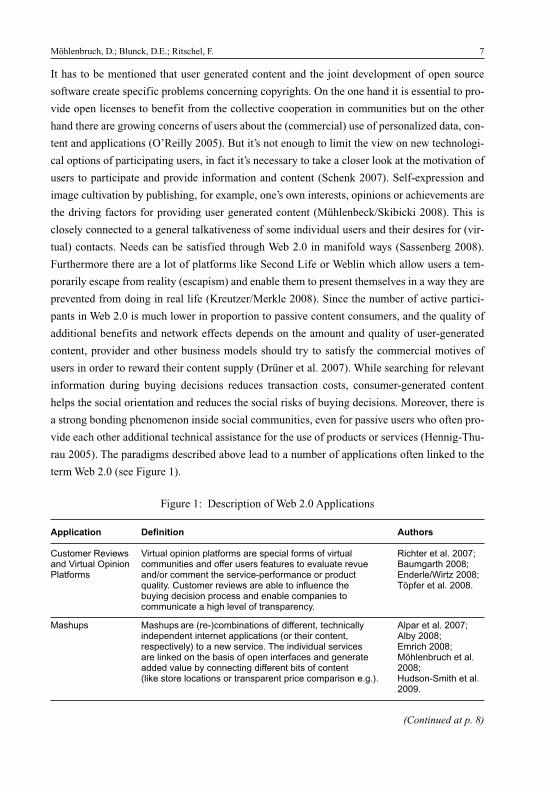
term Web 2.0 (see Figure 1).
Möhlenbruch, D.; Blunck, D.E.; Ritschel, F. 7
Figure 1: Description of Web 2.0 Applications
Application Definition Authors
Customer Reviews Virtual opinion platforms are special forms of virtual Richter et al. 2007;and Virtual Opinion communities and offer users features to evaluate revue Baumgarth 2008;Platforms and/or comment the service-performance or product Enderle/Wirtz 2008;
quality. Customer reviews are able to influence the Töpfer et al. 2008.buying decision process and enable companies tocommunicate a high level of transparency.
Mashups Mashups are (re-)combinations of different, technically Alpar et al. 2007; independent internet applications (or their content, Alby 2008; respectively) to a new service. The individual services Emrich 2008; are linked on the basis of open interfaces and generate Möhlenbruch et al. added value by connecting different bits of content 2008;(like store locations or transparent price comparison e.g.). Hudson-Smith et al.
2009.
(Continued at p. 8)
8 European Retail Research, Vol. 24, Issue I, pp. 1-26
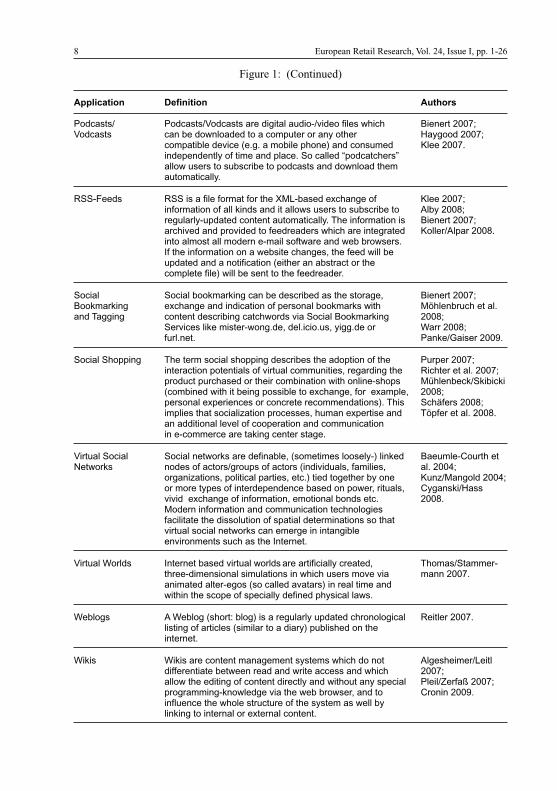
Figure 1: (Continued)
Application Definition Authors
Podcasts/ Podcasts/Vodcasts are digital audio-/video files which Bienert 2007;Vodcasts can be downloaded to a computer or any other Haygood 2007;
compatible device (e.g. a mobile phone) and consumed Klee 2007.independently of time and place. So called “podcatchers”allow users to subscribe to podcasts and download themautomatically.
RSS-Feeds RSS is a file format for the XML-based exchange of Klee 2007;information of all kinds and it allows users to subscribe to Alby 2008;regularly-updated content automatically. The information is Bienert 2007;archived and provided to feedreaders which are integrated Koller/Alpar 2008.into almost all modern e-mail software and web browsers.If the information on a website changes, the feed will beupdated and a notification (either an abstract or thecomplete file) will be sent to the feedreader.
Social Social bookmarking can be described as the storage, Bienert 2007; Bookmarking exchange and indication of personal bookmarks with Möhlenbruch et al. and Tagging content describing catchwords via Social Bookmarking 2008;
Services like mister-wong.de, del.icio.us, yigg.de or Warr 2008;furl.net. Panke/Gaiser 2009.
Social Shopping The term social shopping describes the adoption of the Purper 2007; interaction potentials of virtual communities, regarding the Richter et al. 2007;product purchased or their combination with online-shops Mühlenbeck/Skibicki(combined with it being possible to exchange, for example, 2008;personal experiences or concrete recommendations). This Schäfers 2008;implies that socialization processes, human expertise and Töpfer et al. 2008.an additional level of cooperation and communicationin e-commerce are taking center stage.
Virtual Social Social networks are definable, (sometimes loosely-) linked Baeumle-Courth etNetworks nodes of actors/groups of actors (individuals, families, al. 2004;
organizations, political parties, etc.) tied together by one Kunz/Mangold 2004;or more types of interdependence based on power, rituals, Cyganski/Hassvivid exchange of information, emotional bonds etc. 2008.Modern information and communication technologiesfacilitate the dissolution of spatial determinations so thatvirtual social networks can emerge in intangibleenvironments such as the Internet.
Virtual Worlds Internet based virtual worlds are artificially created, Thomas/Stammer-three-dimensional simulations in which users move via mann 2007.animated alter-egos (so called avatars) in real time andwithin the scope of specially defined physical laws.
Weblogs A Weblog (short: blog) is a regularly updated chronological Reitler 2007. listing of articles (similar to a diary) published on theinternet.
Wikis Wikis are content management systems which do not Algesheimer/Leitl differentiate between read and write access and which 2007;allow the editing of content directly and without any special Pleil/Zerfaß 2007; programming-knowledge via the web browser, and to Cronin 2009.influence the whole structure of the system as well bylinking to internal or external content.
4. Web 2.0 in Multi-Channel Retailing
Assuming a sustainable influence of Web 2.0 on consumer behavior, suppliers will have to meet
those developments (Graßmann 2004). The differentiation between strategic and operational
fields of Web 2.0 applications in multi-channel retailing, used to systemize the following state-
ments cannot always be mutually exclusive and exhaustive - a problem of demarcation that
Ahlert (2002), using the example of information in retail-management, illustrates that which
“do not per se have a strategic or an operational character”.
4.1. Strategic Potentials
As mentioned before, retailers find themselves in an increasingly dynamic and discontinuous
environment, a situation that requires and complicates long-term strategies at the same time. A
key responsibility of strategic planning is to secure existing potentials and to develop new ones
for success in the already mentioned areas of retail management (Ahlert/Kenning 2007).
4.1.1. Market Research
Marketing decisions require an adequate information background, especially in view of actual
and prospective buying behavior, its principles and variability (Bänsch 2002). A comprehensive
understanding of customer needs and preferences can lead to significant advantages in competi-
tion (Zboralski/Gemünden 2004). Accordingly, the collection of information about customers and
their behavior via interactive media gains importance for retailers (Möhlenbruch/Schmieder
2004). This applies especially for multi-channel retailers which, in the ideal case, manage to col-
lect information about their customers at every contact point (Schröder 2005; Emrich 2008).
Hence Web 2.0 instruments can be used as subjects of research (e.g. the exploration of virtual
communities in view of consumer behavior) and as platforms for research (e.g. investigation of
market acceptance of innovative products) (Kunz/Mangold 2004). User-generated content, espe-
cially, allows deep insights into customer requirements and gives access to information about
(potential) consumers (Drüner et al. 2007; Stampfl 2007). Systematic monitoring of blogs,
forums, tagging platforms or virtual communities delivers information about company-, product-
or brand-image, for example, and allows the researcher to detect social trends, changing lifestyle
concepts or hints about the general change in values (Drüner et al. 2007; Ammann/Bentele 2008).
In addition there are new approaches for the categorization of consumers in the context of cus-
tomer value analyses created through the monitoring of user-generated content in communities,
blogs or forums (Stampfl 2007). The collected data can be used to develop user-, consumption-
and preference-profiles or to identify lead users (Drüner et al. 2007). While the transfer of
industry driven lead-user concepts to consumer goods marketing is considered to be difficult
due to the multitude of potential customers and the wide range of goods and services, the mon-
Möhlenbruch, D.; Blunck, D.E.; Ritschel, F. 9
itoring of Web 2.0 creates new approaches to lead-user identification in the retail business
(Ernst et al. 2004). Once identified, relevant content of specific users has to be analyzed in view
of use- and object-knowledge, trend leadership and innovativeness. Similar potentials open up
for customer lifetime value analyses. Taking the social position of users in virtual communities
and their influence potentials on other members into account can lead to completely deviant
customer categorizations (compared to a limitation of the examination on the values of, for
example, sales taken place) (Stampfl 2007). Additionally Web 2.0 allows one to contact relevant
(groups of) customers directly after their identification because, unlike traditional market
research and futurology methods, it connects the information directly to its author (Drüner et al.
2007; Herstatt/Sander 2004). Further dialog can be used to gather additional information
regarding innovation processes, for example, or the (de)listing of products and services, how-
ever, the utilization of Web 2.0 instruments for market research creates specific difficulties as
well. First of all it has to be decided whether to choose a (passive) observation of blogs, commu-
nities etc., or an (active) dialog-oriented exploration (Herstatt/Sander 2004). An active
approach would be pointless without the previous identification of suitable interaction partners,
their approval, and the resources required for individual communication. Similar difficulties
result from the complex task of filtering the relevant information from the enormous multitude
of data. This is shown by Koller/Alpar (2008) in an analysis of selected blogs, where less than
0.5% of private posts dealt with companies, but those usually contained valuable information.
While manual filtering requires a lot of time and resources, automatic scanning methods are not
yet able to assure adequate data quality. Once identified, interesting blogs can be monitored rel-
atively resource-friendly via RSS feeds (Koller/Alpar 2008).
Problems in data quality are one of the major points of critique in online market research and have
to be taken into account in results evaluation (Emrich 2008). It has to be questioned whether or
not users of Web 2.0 applications can build representative samples for general analyses of con-
sumer behavior (Kunz/Mangold 2004). This gets even more important when explorations are lim-
ited to company-owned or topic-specific applications to ensure the exclusivity of the results or
the efficiency of the survey (Ernst et al. 2004). The sheer number of more than 60 million
weblogs with more than 1.2 million daily posts in 2007 (Drüner et al. 2007) demonstrates the
potentials for information as well as the difficulty in identifying relevant data. The results have to
be critically examined in view of representativeness as well. Therefore it does not seem to be
advisable to substitute traditional market research methods through the analysis of Web 2.0 appli-
cations. Rather, it is suggested to use their specific potential to get insights on trends or to include
consumers into innovation processes (Herstatt/Sander 2004; Drüner et al. 2007).
4.1.2. Communication
The integration of new media into consistent communication strategies comprehensive to all
channels is one of the main challenges of multi-channel marketing (Möhlenbruch/Schmieder
10 European Retail Research, Vol. 24, Issue I, pp. 1-26
2004). In this regard, the potentials of Web 2.0 range from the direct one-to-one dialog between
companies and their relevant stakeholders as well as internal knowledge transfer, up to the com-
munication between customers amongst each other (Bughin/Manyika 2007; Kreutzer 2008).
There are application fields for RSS feeds in communication policy which, for example, allow
one to build an innovative, customized push channel as well as for communities, whose mem-
bers can be provided with additional information (Möhlenbruch et al. 2008). The user-initiated
subscription of feeds and thereby indicated preferences can be used to customize the communi-
cation with an individual customer across all channels. Blogs and their functions for comment-
ing on posts and linking to other blogs provide a fast and wide platform for communication and
can be an adequate basis for viral marketing campaigns (Langner 2007; Emrich 2008). Such an
advertising message can be placed in forums, blogs or communities and spreads out without
any additional costs to the initiator (Mühlenbeck/Skibicki 2008). Humans in social relation-
ships show, according to the sociological concept of “homophily”, similarities regarding their
level of education, social status and their buying preferences, and spread information mainly to
interested people in their environment (Mangleburg et al. 2004; Stampfl 2007). User-initiated
downloads and RSS subscriptoins of pod- and videocasts reduce waste coverage and allow for
the efficient measuring of diffusion rates simply by counting the numbers of accesses and
downloads (Mühlenbeck/Skibicki 2008). Because the message is delivered by one’s own circle
of acquaintances, viral marketing reduces the defensive demeanor of consumers against classi-
cal advertising messages and is able to increase the probability of cognition (Emrich 2008;
Mühlenbeck/Skibicki 2008). Although viral marketing is not bound to specific media in princi-
ple, Web 2.0 enlarges the possibilities for spreading information with enormous speed and
improved efficiency and allows one to influence personal opinions in the buying process (Hein
2007; Schelske 2007). Additionally, the chance increases that topics from the blogosphere or
virtual communities are adopted into the classic media, because Web 2.0 applications are more
and more included into the research done by the classic media (Töpfer et al. 2008). Neverthe-
less, sufficient added value for multipliers, additional incentives and an appealing presentation
of the content remain substantial conditions for viral marketing (Langner 2007). Besides, a con-
tinuous monitoring is necessary to observe the spreading and to influence the discussion by
active participation in case of need (Schönefeld 2006) and it has to be mentioned that there are
varying channel- and product-specific effects (for example, online purchases are nearly twice
as often influenced by viral marketing as offline purchases) of viral marketing (Riegner 2007).
4.1.3. Harmonization and Integration of Marketing Channels
The integration of different marketing channels into a consistent system is an important area of
responsibility for multi-channel marketing. Extensive knowledge about customers and markets
are fundamental for avoiding channel conflicts (Emrich 2008). The specific potentials of differ-
ent Web 2.0 applications to generate information have been stated already, but blogs and cus-
Möhlenbruch, D.; Blunck, D.E.; Ritschel, F. 11
tomer diaries, especially, can help to identify critical incidents in view of channel integration
and should be mentioned again.
Against the background of the intangible elements of the retail business, the reliance of cus-
tomers towards a retail brand can be considered a key factor in retail-management
(Zentes/Morschett 2005). Because positive experiences in one marketing channel have effects
on the whole system of channels it can be assumed that the usage of Web 2.0 applications has
cross-channel positives. Those positives are especially based on a high credibility level of user-
generated content (Enderle/Wirtz 2008). In this regard, wikis, blogs and reviews, especially,
seem to be able to convey authenticity, reliability and transparency (Richter et al. 2007). To
meet the consumer’s expectations, particular care must be taken in regard to the safety of user-
specific information and to the non-restrictive publication of even negative opinions (Möhlen-
bruch et al. 2008; Schnieders 2008). At the same time, Web 2.0 applications can be used to sup-
port cross-channel marketing campaigns. Virtual worlds, for instance, could support real events
or product presentations in an interactive, 3-D environment (Thomas/Stammermann 2007).
4.1.4. Internal Communication and Knowledge Management
Web 2.0 applications also show great promise for internal communication in complex organiza-
tions facing dynamic environments (Warta 2007). As described before, this characterization
applies especially to multi-channel-retailers. Wikis and blogs for example are able to accelerate
communication and collaboration processes and can be cost-saving alternatives to commercial
knowledge management systems (Algesheimer/Leitl 2007; Drüner et al. 2007). Those instru-
ments are especially able to build location-independent communities of practice, to contribute
to organizational learning and to globalize company-specific knowledge in a decentralized
structure (Zboralski/Gemünden 2004; Schütt 2007).
Internal blogs can be used to announce product decisions and to discuss them with branch man-
agers or suppliers in order to include their field-specific knowledge into decision making. Staff
blogs on internal platforms allow employees to document their work, search problem-specific
information and contact persons or to identify best-practice alternatives inside the organization
(Algesheimer/Leitl 2007). In addition, the amount of internal waste coverage by unspecific e-
mail can be reduced through RSS feeds. Wikis could, too, by the construction of a company-
specific knowledge and information platform or they could serve as a continuous basis for
exchange and collaboration, training or further education (Oeltjen 2005; Bienert 2007; Warta
2007). Their main advantage is the objectification of subjective knowledge resources through
collective validation and improvement of existing information (Müller 2008). Since the neces-
sary software is usually open source, free of charge and easy to use, Web 2.0 instruments are
often more cost-effective than commercial applications (Algesheimer/Leitl 2007). Neverthe-
less, the lower number of potential users of internal wikis limits their growth speed and requires
12 European Retail Research, Vol. 24, Issue I, pp. 1-26
active promotion by the executives to secure a successful implementation. The necessary com-
mitment on the part of the management, however, can be limited because this approach towards
self organized communication and knowledge management defies direct control, makes expert
knowledge available corporation wide and flattens hierarchies (Warta 2007; Müller 2008). To
avoid the misuse of sensitive data, specific access rights for different staff levels and rigid user
administration have to be assured - which erects barriers and reduces the growth speed of inter-
nal wikis even more (Oeltjen 2005).
4.1.5. Acquisition of New Target Groups and Customer Retention Management
Against the background of the dynamic market environment of retail business, retail manage-
ment attaches high importance to the “acquisition of new target groups” and “customer reten-
tion management” objectives (Möhlenbruch/Schmieder 2004). The potential contributions of
Web 2.0 to meet those objectives are mainly based on the ability to enable interactive commu-
nication between retailers and (potential) customers as well as among customers themselves
(Drüner et al. 2007; Ammann/Bentele 2008; Kreutzer/Merkle 2008). This can be illustrated
with the example of a telecommunication company which was able to raise the speed of the
acquisition of new customers up by a factor of five by addressing community members having
contact with steady customers (Stampfl 2007). Web 2.0 is especially able to increase the level of
awareness of retail brands in young target groups with a high affinity for the internet (Wegener
2008; Thomas/Stammermann 2007). Based on the assumption that perceived interactivity of a
website goes along with a more positive brand- and company image and an increasing involve-
ment of users into the communicated content (Gerpott 2004; Lueg et al. 2006), it can be
assumed that there are positive effects of Web 2.0 on customer retention management. Besides
the use of communities (esp. company-owned communities) which are able to increase the den-
sity of communication, design of an interactive brand environment and expanding the customer
relationship on an emotional level; pod- and videocasts, RSS feeds or wikis can affect customer
retention in a positive way (Wirtz 2001; Kunz/Mangold 2004; Möhlenbruch et al. 2008). While
communities enable retailers to provide customers with additional and emotionally charged
information during the post-purchase phase (Klee 2007), wikis and their user generated content
can be used to replace FAQs and act as a first source consulted by customers in case of prob-
lems (Pleil/Zerfaß 2007). Furthermore, the cooperative buying processes in social shopping
enhance the tendency for cross- and re-buying, the recommendations of other community mem-
bers affect trust and customer loyalty, and the emerging social bonds create switching costs
(Hsieh et al. 2005; Möhlenbruch et al. 2008; Verhoef et al. 2009). Additionally, there are inter-
esting perspectives to identify constraining factors for successful customer retention manage-
ment via customer diaries or blogs, respectively. The chronological listing and the detailed
description of customer contacts allow for the identification of crucial experiences and to dis-
play them as whole chains of events. The systematic comparison of different customer diaries
Möhlenbruch, D.; Blunck, D.E.; Ritschel, F. 13
can provide an overall picture of the customer experience and become the basis for uncovering
drivers of enthusiasm and frustration (Bauer et al. 2008). Those findings can then be transferred
into strategic recommendations to optimize customer experiences. This field of application
gains importance against the background of the heretofore mentioned problems regarding the
integration of different marketing channels into an integrated multi-channel-system and multi-
channel-behavior.
Those positive effects of Web 2.0 instruments for customer retention management and the
acquisition of new target groups come along with the risk of negative expressions of opinions
and spill-over effects on other customers (Herstatt/Sander 2004). Furthermore, attempts at
manipulation of communities can be perceived as annoying by their members (Möhlenbruch et
al. 2008). Multi-channel retailers should also try moderate dosages of the interaction potentials
of Web 2.0 and to regard it as situational to avoid additional negative attitudes caused by cogni-
tive overload (Gerpott 2004). It is also disputable that retailers will always succeed with build-
ing their own virtual communities because their wide product ranges and heterogeneous target
groups reduce the chance to reach a critical mass of community members with equal interests.
To avoid this, thematic networks could be a solution.
4.2. Operational Potentials
Multi-channel marketing includes the operational planning, implementation and evaluation of
all demand-orientated instruments: those that contain merchandise, price and communication
(Barth et al. 2007).
4.2.1. Merchandise
The orientation by retailers on customer value gains importance because of the competitive
environment and high failure rates of market launches for consumer products (Ernst et al. 2004;
Zboralski/Gemünden 2004). There are interesting fields of application for Web 2.0 instruments
in view of the differentiation potentials of merchandise accruing from the analysis of user-gen-
erated content. On the one hand, Web 2.0 enables retailers to detect wishes, needs and trends
(for example, through passive monitoring of communities, blogs, social bookmarking plat-
forms), while on the other hand it allows them to directly integrate customers into product
(range) development processes (Schönefeld 2006; Schnieders 2008). A representative survey
about the buying behavior of Germans regarding distance selling verifies that consumers want
their needs to be taken into account and that they are willing to participate in innovation
processes (Promondo 2007). This would secure the consequent orientation towards customer
value and could contribute to cost efficiency, reduced development times and accelerated mar-
ket launches (Bartl et al. 2004; Algesheimer/Leitl 2007). It additionally communicates close-
14 European Retail Research, Vol. 24, Issue I, pp. 1-26
ness to customers and can therefore have a positive effect on company image and customer
acquisition (Herstatt/Sander 2004).
RSS feeds enable a customized information supply about product availability and additional
services and the information displayed about preferences can be used to optimize the product
line (Möhlenbruch et al. 2008). Accordingly, this can help to optimize goods in stock and gen-
erate cross-selling effects. The German multi-channel retailer “Tchibo” follows an interesting
approach to customer integration into its internal processes with the “Tchibo-Ideas” communi-
ty, www.tchibo-ideas.de, a platform where users can post interesting innovations and participate
in idea competitions. It is intended to check innovative ideas in view of technical feasibility and
to realize them in collaboration with the inventor. Even though Tchibo ideas has engendered no
successful product launch yet, the potentials in principle and the willingness to participate are
proven by the number of 4,500 registered members. But this approach requires the uncondition-
al clarification of patent and copyright issues and it seems to be necessary to offer added value
in monetary form or at least in form of detailed feedback to secure the long lasting participation
of users (Zboralski/Gemünden 2004). The level of openness in a community is a tightrope walk.
Free access opens a community to a wide range of target groups and enlarges the potential for
innovation but this allows access for competitors as well (Ernst et al. 2004). Additionally, the
inclusion of customers into innovation processes can encounter internal opposition which can
manifest itself in specific defense mechanisms of the organization against outside ideas (Bartl
et al. 2004). Furthermore, examples from industry areas hint that there is often not enough
innovation potential inside open communities to actually lead to new products (Herstatt/Sander
2004).
4.2.2. Pricing
The rising importance of electronic business has already had a high impact on price manage-
ment (Wirtz 2001). There are not only new options to orientate pricing more exactly according
to the individual’s willingness to pay, but new ways to realize differentiated prices for cus-
tomized goods and services as well (Weiber/Weber 2002). Insufficient knowledge about the
willingness to pay made such pricing strategies difficult to implement. Monitoring of blogs,
forums and virtual communities can enlarge the basis of information and can simplify such
pricing decisions (Möhlenbruch et al. 2008). Customer oriented pricing can affect the perceived
price-performance risk and helps (along with price transparency and price consultation) to
transfer it to price satisfaction, which strengthens customer loyalty and can result in competitive
advantages (Diller 2005). Following this line of argumentation, customer reviews and rating
functions can increase the perceived price transparency and lower price-performance risks. This
also applies to social shopping, where user-initiated price discussions and collective buying
activities opens up interesting application fields in price policy (Möhlenbruch et al. 2008).
Möhlenbruch, D.; Blunck, D.E.; Ritschel, F. 15
Nevertheless, passive monitoring in view of pricing can quickly become unprofitable because
companies and their pricing policies are seldom subjects of private blogs, forums or communi-
ties. Because value-added-services increase the perceived quality of buying experiences and
decrease price sensitivity, wikis and mashups can have positive effects in price policy, too, and
raise the probability of transfering website visitors into loyal customers (Panten 2005). Theoret-
ically, it is also possible to receive information about the willingness to pay via RSS feeds and
to inform customers about special offers and prices, but this contains the risk of directly inform-
ing competitors about one’s own actions as well. Research also shows that online-consumers are
less price sensitive provided there is non-price information available on brand, quality and prod-
uct features (Ailawadi et al. 2009).
4.2.3. Communication
The individual need of customers for guidance and advice depends on the breadth and depth of
the product mix and its complexity as well as on the necessity for explanations of the products
themselves (Madlberger 2004). This is the determining factor of the necessity for retailers to
have a counseling service. Research shows that the absence of social interaction is one of the
main reasons why many customers still avoid online shopping (Doolin et al. 2006; van Dolen et
al. 2007; Weathers et al. 2007). The quality of electronic counseling depends on the information
content and its didactic preparation, and therefore concerns web-design aspects and editorial
content creation as well. The ability of some Web 2.0 instruments to let users create content or
to embed third-party content proffers interesting fields of application for mashups, wikis, com-
munities and forums to shift retail functions (in this case counseling) over to the customers
themselves and therefore decreases costs. At the same time, retailers are able to reduce the per-
ceived high buying risks in online purchasing through the high levels of reliability and authen-
ticity shown by consumers to user-generated content (Laroche et al. 2005; Enderle/Wirtz 2008).
It must be mentioned though, that this comes with a loss of control for the retailer, especially
regarding statements made on third-party platforms (Hennig-Thurau 2005). Therefore, it seems
useful for companies to provide those functions on their own platforms in order to retain reac-
tivity and at least a limited amount of control in view of dissatisfied customers who expect
transparency, honesty and a satisfactory problem-solving orientation in cases of criticism
(Schnieders 2008). Those heretofore named fields of application for Web 2.0 in sales promotion
and advertising policy can be demonstrated with two examples: The German DIY-store “Horn-
bach” upgraded its website with discussion forums and podcasts and an extensive virtual
helpdesk where users could help each other (Michael/Rose 2008). Ikeafans.com is also an
example of an independent virtual community where members post decoration suggestions or
examples of use, describe their experiences with the furniture manufacturer or discuss the com-
pany and its policy in different forums. The presence of user generated content shows that com-
munities enable companies to get direct access to the wishes and needs of their potential cus-
16 European Retail Research, Vol. 24, Issue I, pp. 1-26
tomers and even get suggestions for example for visual merchandising or additional fields of
application. The “user-generated help” in cases of product-specific problems generates addi-
tional value for customers and therefore gains relevance in post-purchase marketing (Dellaro-
cas 2006; Enderle/Wirtz 2008; Schnieders 2008).
5. Conclusion and Implications
The previous chapters introduced several Web 2.0 instruments and analyzed their fields of
application in multi-channel marketing. The prevailing growth rates in the sector of Web 2.0
suggest that this is not just short-term hype, but rather a sustainable and strident evolution of the
information society, trending towards increasing levels of participation, information, and inte-
gration of internet users and an increasing influence of consumers on goods and services (Rieg-
ner 2007; Rölver/Alpar 2008). The version number in the term Web 2.0 already implies that this
is just an intermediate step in an ongoing development (Schnieders 2008). Even though some
instruments are currently only used by small user groups, it can be assumed that in the course of
the proceeding development of the internet and end-user devices there will be an ongoing diffu-
sion into all classes of population and age groups (Klee 2007). Even though this opens up inno-
vative perspectives for marketing, there is hardly any systematic utilization of potentials. This
might be the result of the dynamic and complex nature of the topic which contributes to the fact
that the innovation potentials of some instruments are widely accepted, but their whole range of
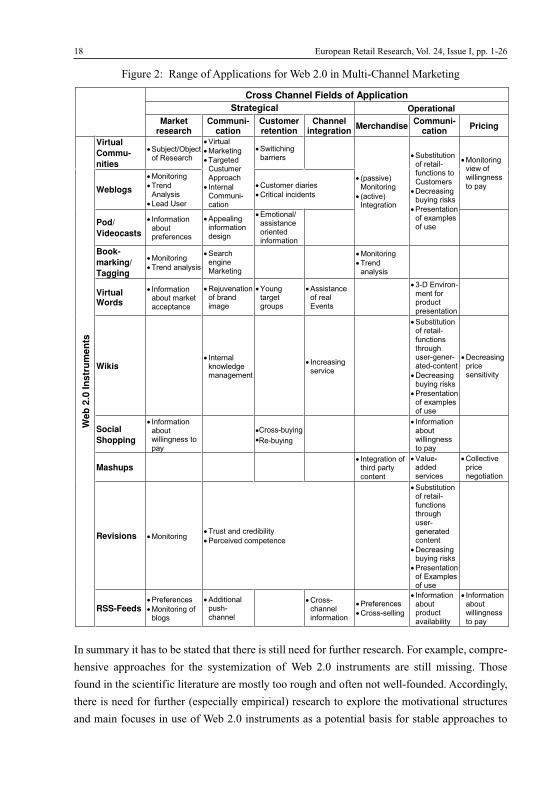
application fields is not yet identified. The following Figure 2 (see p. 18) shows the results of
this paper and categorizes the range of application fields for Web 2.0 instruments.
The potentials of Web 2.0 instruments accrue from the online channel and allow a manifold
strategic and operational cross-channel usage of their effects based on the interaction between
the different channels in integrated systems. It is therefore possible for multi-channel retailers
to create advantages in competition and increase the potentials for success with the addition of
this approach.
A general rating of the performance potentials of single instruments seems impossible against
the background of inhomogeneous target groups and the range of goods and services of multi-
channel retailers and will therefore be avoided. In fact it is advisable to give specific instru-
ments a thorough context sensitive check regarding the product range and the focused target
group. Although some instruments can be used as substitutes, a coordinated and differentiated
implementation of different Web 2.0 applications, in line with the market, can be considered
meaningful (Alpar et al. 2007; Enderle/Wirtz 2008). Their integration into aligned cross-media
communication strategies can even increase their potentials. Additionally, it seems to be appro-
priate to increase the positive effects of virtual communities for example by exclusive (live)
events for members.
Möhlenbruch, D.; Blunck, D.E.; Ritschel, F. 17
18 European Retail Research, Vol. 24, Issue I, pp. 1-26
Figure 2: Range of Applications for Web 2.0 in Multi-Channel Marketing
Cross Channel Fields of Application
Strategie Operational
Marketresearch
Communi-cation
Customerretention
Channelintegration
Merchandise Communi-
cationPricing
We
b 2
.0 In
str
um
en
ts
Virtual
Commu-
nities
Subject/Objectof Research
Virtual
Marketing
Targeted Custumer Approach
InternalCommuni-cation
Switichingbarriers
(passive)Monitoring
(active) Integration
Substitutionof retail-functions to Customers
Decreasingbuying risks
Presentation of examplesof use
Monitoringview of willingnessto payWeblogs
Monitoring
Trend Analysis
Lead User
Customer diaries
Critical incidents
Pod/
Videocasts
Informationaboutpreferences
Appealing informationdesign
Emotional/assistanceoriented information
Book-
marking/
Tagging
Monitoring
Trend analysis
SearchengineMarketing
Monitoring
Trend analysis
Virtual Words
Informationabout marketacceptance
Rejuvenation of brand image
Young targetgroups
Assistanceof real Events
3-D Environ-ment forproductpresentation
Wikis Internalknowledge management
Increasingservice
Substitutionof retail-functions through user-gener-ated-content
Decreasingbuying risks
Presentation of examplesof use
Decreasingprice sensitivity
Social
Shopping
Informationaboutwillingness topay
Crossbuying
Re-buying
Informationaboutwillingnessto pay
Mashups Integration ofthird partycontent
Value-added services
Collective price negotiation
Revisions Monitoring Trust and credibility
Perceived competence
Substitutionof retail-functions through user-generated content
Decreasingbuying risks
Presentation of Examples of use
RSS-Feeds Preferences
Monitoring ofblogs
Additionalpush-channel
Cross-channel information
Preferences
Cross-selling
Informationaboutproductavailability
Informationaboutwillingnessto pay
In summary it has to be stated that there is still need for further research. For example, compre-
hensive approaches for the systemization of Web 2.0 instruments are still missing. Those
found in the scientific literature are mostly too rough and often not well-founded. Accordingly,
there is need for further (especially empirical) research to explore the motivational structures
and main focuses in use of Web 2.0 instruments as a potential basis for stable approaches to
Strategical
Cross-buyingRe-buying

a systemization of Web 2.0. While some instruments like blogs are used quite frequently and
have already become an important part of corporate communications, other instruments (e.g.
virtual worlds and internal wikis) are still in the stage of development and their fields of
application in multi-channel marketing should be seen as a learning arena. In this regard,
there is a lack of empiric research, e.g. regarding the interrelationship between real and virtu-
al buying behaviors. This applies to market research with Web 2.0 applications and the trans-
fer of lead-user-concepts from the field of industrial goods to consumer goods as well. There
is also a special need for systems for the automatic filtering of relevant posts in forums or
communities (Ernst et al. 2004; Herstatt/Sander 2004). Further difficulties in the practical use
of the described Web 2.0 instruments result from the limited controllability and measurability
of their profit contribution. This applies especially because positive effects will most likely
only appear over time and can hardly be resolved into isolated activities. Because the general-
ly necessary critical mass of participants is often hard to attain and in view of the dynamic
of consumer behavior, the question arises that some instruments like Second Life or other
specific communities might not have enough lasting potential to legitimate long term invest-
ments.
Strategic manipulation by third parties is another risk resulting from handling user-generated
content, reviews and the anonymity of the internet. Dellarocas even models a user-anticipated
manipulation through the retailer in a theoretical game analysis (Dellarocas 2006). Following
these thoughts, companies would actually be forced to manipulate ratings and reviews to match
their anticipated level of manipulation. But this would imply the additional risk of a substantial
loss of image and trust in case of exposure (Enderle/Wirtz 2008). It should also be noted
that, besides of the effects of Web 2.0 on consumer behavior and especially on click behavior,
“traditional” factors like the perceived cost/performance ratio, the urgency of the fulfillment of
demands, the financial situation or buying comfort will not lose their importance (Gerpott
2004).
One of the major tasks of multi-channel marketing in regard to Web 2.0 is therefore to assess
the specific risks and potentials of the different channels and their instruments in view of target
groups and offered goods as well as services, and to derive strategic investment decisions on
that basis. It is essential to consider the resulting changes concerning the increasing transparen-
cy, hierarchical conflicts and the necessary adjustments of company structures and resources.
Capitalization of interaction potentials of the respective Web 2.0 instruments in the context of
multi-channel strategies requires the renunciation of traditional mass-communication and a
new approach towards the identification of target groups. Even though a prognosis as to the
effects of the development of the internet on retail business seems impossible against the back-
ground of its dynamic, it appears that a great deal of adaptability is required to face changes in
the environment for retailers in the era of Web 2.0.
Möhlenbruch, D.; Blunck, D.E.; Ritschel, F. 19
References
Ahlert, D. (2002): Handelsinformationssysteme als Basis des operativen und strategischenHandelsmanagement, in: Möhlenbruch, D.; Hartmann, M. (eds.): Der Handel im Informa-tionszeitalter, Wiesbaden, pp. 53-77.
Ahlert, D.; Hesse, J. (2003): Das Multikanalphänomen - viele Wege führen zum Kunden,in: Ahlert, D.; Hesse, J.; Juliens, J.; Smend, P. (eds.): Multikanalstrategien, Wiesbaden, pp.3-32.
Ahlert, D.; Kenning, P. (2007): Handelsmarketing. Grundlagen der marktorientierten Führungvon Handelsbetrieben, Berlin.
Ailawadi, K.L.; Beachamp, J.P.; Donthu, N.; Gauri, D.K.; Shankar, V. (2009): Communicationand Promotion Decisions in Retailing: A Review and Directions for Future Research, in:Journal of Retailing, Vol. 85, No. 1, pp. 42-55.
Alby, T. (2008): Web 2.0. Konzepte, Anwendungen, Technologien, 3rd ed., Munich.
Algesheimer, R.; Leitl, M. (2007): Unternehmen 2.0, in: Harvard Business Manager, Vol. 29,No. 6, pp. 88-98.
Alpar, P.; Blaschke, S.; Keßler, S. (2007): Web 2.0. Neue erfolgreiche Kommunikationsstrate-gien für kleine und mittlere Unternehmen, Wiesbaden.
Ammann, P.; Bentele, M. (2008): Mit Fallbeispielen den Erfolgsfaktoren des Web 2.0 auf derSpur. Wie Kommunikationsgrenzen im B2B-Geschäft dank neuer Anwendungen überwun-den werden, in: io new management, Vol. 77, No. 9, pp. 44-48.
Baal, S.v.; Hudetz, K. (2004): Online Handel. Kannibalisierung oder Mehrumsatz?, in: ScienceFactory, Vol. 6, No. 3, pp. 1-5.
Baal, S.v.; Hudetz, K. (2007): Dem Kunden auf allen Kanälen begegnen, in: Science Factory,Vol. 9, No. 2, pp. 12-16.
Bachem, C. (2004): Die Rolle von Portalen im Multichannel-Marketing, in: Gentsch, P.; Lee, S.(eds.): Praxishandbuch Portalmanagement, Wiesbaden, pp. 137-156.
Baeumle-Courth, P.; Nieland, S.; Schröder, H. (2004): Wirtschaftsinformatik, Munich.
Bänsch, A. (2002): Käuferverhalten, 9th ed., Munich.
Barth, K.; Hartmann, M.; Schröder, H. (2007): Betriebswirtschaftslehre des Handels, 6th ed.,Wiesbaden.
Bartl, M.; Ernst, H.; Füller, J. (2004): Community Based Innovation - eine Methode zur Ein-bindung von Online Communities in den Innovationsprozess, in: Herstatt, C.; Sander, J.G.(eds.): Produktentwicklung mit virtuellen Communities, Wiesbaden, pp. 141-168.
Bauer, F.; Bössow, O.; Motschmann, K. (2008): Online-Tagebücher: Dem Kundenerleben aufder Spur, in: Planung & Analyse, Vol. 35, No. 1, pp. 40-43.
Baumgarth, C. (2008): Markenpolitik. Markenwirkungen - Markenführung - Markencontrol-ling, 3rd ed., Wiesbaden.
Bienert, J. (2007): Web 2.0 - Die Demokratisierung des Internet, in: IM Information Manage-ment & Consulting, Vol. 22, No. 1, pp. 6-14.
Böing, C.; Jullens, J.; Schrader, M.F. (2003): Customer Relationship Management im Multi-kanalvertrieb, in: Ahlert, D.; Hesse, J.; Jullens, J.; Smend, P. (eds.): Multikanalstrategien,Wiesbaden, pp. 33-65.
20 European Retail Research, Vol. 24, Issue I, pp. 1-26
Bughin, J.; Manyika, J. (2007): How businesses are using Web 2.0: A McKinsey Global Survey,New York.
Cronin, J.J. (2009): Upgrading to Web 2.0: An Experiential Project to Build a Marketing Wiki,in: Journal of Marketing Education, Vol. 31, pp. 66-75.
Cyganski, P.; Hass, B.H. (2008): Potenziale sozialer Netzwerke für Unternehmen, in: Hass, B.;Walsh, G.; Kilian, T. (eds.): Web 2.0, Berlin, pp. 101-120.
Dellarocas, C. (2006): Strategic Manipulation of Internet Opinion Forums: Implications forConsumers and Firms, in: Management Science, Vol. 52, No. 10, pp. 1577-1593.
Diller, H. (2005): Preisethik im Marketing, in: Herrmann, H.; Voigt, K.-I. (eds.): Globalisierungund Ethik, Heidelberg, pp. 35-50.
Dohmann, H.; Fuchs; Khakzar, K. (2002) (eds.): Die Praxis des E-Business. Technische,betriebswirtschaftliche und rechtliche Aspekte, Braunschweig, Wiesbaden.
Dolen, W.M. van; Dabholkar, P.A.; Ruyter, K. de (2007): Satisfaction with Online CommercialGroup Chat: The Influence of Perceived Technology Attributes, Chat Group Characteristics,and Advisor Communication Style, in: Journal of Retailing, Vol. 83, No. 3, pp. 339-358.
Doolin, B.; Dillon, S.; Corner, J.L. (2006): Determinants of Online Purchasing Behaviour, in:Hunter, G.; Tan, F. (eds.): Advanced topics in global information management, Hershey PA.,Vol. 5, pp. 199–225.
Drüner, M.; Rattay, R.; Kröger, S. (2007): Web 2.0 - Schneller mehr wissen: Informationsvor-sprung durch Nutzung neuer Rückkanäle, in: IM Information Management & Consulting,Vol. 22, No. 1, pp. 35-42.
Emrich, C. (2008): Multi-Channel-Communications- und Marketing-Management, Wiesbaden.
Enderle, M.; Wirtz, B.W. (2008): Weitreichende Veränderungen, in: Absatzwirtschaft, Vol. 51,No. 1, pp. 36-39.
Ernst, H.; Soll, J.H.; Spann, M. (2004): Möglichkeiten der Lead-User-Identifikation in Online-Medien, in: Herstatt, C.; Sander, J.G. (eds.): Produktentwicklung mit virtuellen Communi-ties, Wiesbaden, pp. 121-140.
Foscht, T.; Swoboda, B. (2007): Käuferverhalten. Grundlagen - Perspektiven – Anwendungen,3rd ed., Wiesbaden.
Gerpott, T.J. (2004): Interaktivität von Websites und Konsumentenverhalten im Internet - Standder Forschung und Perspektiven, in: Wiedmann, K.-P.; Buxel, H.; Frenzel, T.; Walsh, G.(eds.): Konsumentenverhalten im Internet, Wiesbaden, pp. 57-97.
Graßmann, B. (2004): Erforschung des Konsumentenverhaltens als Baustein für die Ent-wicklung neuer Geschäfts- und Marketingstrategien bei T-Online, in: Wiedmann, K.-P.;Buxel, H.; Frenzel, T.; Walsh, G. (eds.): Konsumentenverhalten im Internet, Wiesbaden, pp.455-468.
Hansen, H.R.; Madlberger, M. (2007): Beziehungen zwischen dem Internet-Vertrieb und ande-ren Absatzwegen im Einzelhandel, in: Wirtz, B. (ed.): Handbuch Multi-Channel-Marketing,Wiesbaden, pp. 763-787.
Haygood, D.M. (2007): A Status Report on Podcast Advertising, in: Journal of AdvertisingResearch, Vol. 47, Nr. 4, pp. 518-523.
Hein, A. (2007): Web 2.0. Das müssen Sie wissen, Planegg.
Möhlenbruch, D.; Blunck, D.E.; Ritschel, F. 21

Hennig-Thurau, T. (2005): “Word-of-mouse”: Why consumers listen to each other on the inter-net, in: GfK (ed.): Yearbook of Marketing and Consumer Research, Vol. 3, Nürnberg/Berlin,pp. 37-58.
Herstatt, C.; Sander, J.G. (2004): Online-Kundeneinbindung in den frühen Innovationsphasen,in: Herstatt, C.; Sander, J.G. (eds.): Produktentwicklung mit virtuellen Communities, Wies-baden, pp. 99-119.
Hsieh, Y.-C.; Chiu, H.-C.; Chiang, M.-Y. (2005): Maintaining a committed online customer: Astudy across search-experience-credence products, in: Journal of Retailing, Vol. 81, No. 1,pp. 75-82.
Hudetz, K.; Baal, S.v. (2005): Multi-Channel-Effekte: Wechselwirkungen zwischen stationä-rem Geschäft und Internet, in: Hudetz, K. (ed.): E-Commerce im Handel, Gernsbach, pp.135-180.
Hudson-Smith, A.; Batty, M.; Crooks, A.; Milton, R. (2009): Mapping for the Masses: AccessingWeb 2.0 Through Crowdsourcing, in: Social Science Computer Review, Vol. 27, pp. 524-538.
Hurth, J. (2002): Multi Channel-Marketing und E-Commerce - Zwischen Aktionismus undMehrwert, in: Science Factory, Vol. 4, No. 1, pp. 7-16.
Kilcourse, B. (2008): Finding the Integrated Multi-Channel Retailer. Benchmark Study 2008,RSR Retail Systems Research (ed.), Miami.
Klee, A. (2007): Kommunikation für die Generation iPod, in: Science Factory, Vol. 9, No. 3, pp.1-6.
Koller, P.-J.; Alpar, P. (2008): Die Bedeutung privater Weblogs für das Issue-Management inUnternehmen, in: Alpar, P.; Blaschke, S. (eds.): Web 2.0 - Eine empirische Bestandsauf-nahme, Wiesbaden, pp. 17-52.
Kollmann, T.; Häsel, M. (2007): Trends und Technologien des Web 2.0 - Neue Chancen für dieNet Economy, in: Kollmann, T.; Häsel, M. (eds.): Web 2.0, Wiesbaden, pp. 1-14.
Kreutzer, R.T. (2008): Praxisorientiertes Marketing. Grundlagen, Instrumente, Fallbeispiele,2nd ed., Wiesbaden.
Kreutzer, R.T.; Merkle, W. (2008): Web 2.0 - Welche Potenziale gilt es zu heben?, in: Kreutzer,R. T.; Merkle, W. (eds.): Die neue Macht des Marketing, Wiesbaden, pp. 149-183.
Kunz, W.H.; Mangold, M. (2004): Hybride Communities als Treiber des Kundenwertes, in:Herstatt, C.; Sander, J.G. (eds.): Produktentwicklung mit virtuellen Communities, Wies-baden, pp. 69-98.
Kwon, W.-S.; Lennon, S.J. (2009): Reciprocal Effects Between Multichannel Retailers’ Offlineand Online Brand Images, in: Journal of Retailing, Vol. 85, No. 3, pp. 376-390.
Langner, S. (2007): Viral Marketing. Wie Sie Mundpropaganda gezielt auslösen und Gewinnbringend nutzen, 2nd ed., Wiesbaden.
Laroche, M.; Yang, Z.; McDougall, G.H.G.; Bergeron, J. (2005): Internet versus bricks-and-mortar retailers: An investigation into intangibility and its consequences, in: Journal ofRetailing, Vol. 81, No. 4, pp. 251-267.
Lihotzky, N. (2003): Kundenbindung im Internet. Maßnahmen und Erfolgswirksamkeit imBusiness-to-Consumer-Bereich, Witten/Herdecke.
22 European Retail Research, Vol. 24, Issue I, pp. 1-26

Lueg, J.E.; Ponder, N.; Beatty, S.E.; Capella, M.L. (2006): Teenagers’ use of alternative shop-ping channels: A consumer socialization perspective, in: Journal of Retailing, Vol. 82, No. 2,pp. 137-153.
Madlberger, M. (2004): Electronic Retailing. Marketinginstrumente und Marktforschung imInternet, Wien.
Mangleburg, T.F.; Doney, P.M.; Bristol, T. (2004): Shopping with friends and teens’ susceptibil-ity to peer influence, in: Journal of Retailing, Vol. 80, pp. 101-116.
Marfleet, J. (2008): Enterprise 2.0 - What’s your game plan? in: Business Information Review,Vol. 25, pp. 152-157.
Michael, C.; Rose, A. (2008): Onlinewerbung und Offlineleben, in: Schwarz, T. (ed.): LeitfadenOnline Marketing, 2nd ed., Waghäusel, pp. 86-90.
Möhlenbruch, D.; Dölling, S.; Ritschel, F. (2007): Neue interaktive Instrumente des Kunden-bindungsmanagement, in: Bauer, H.; Große-Leege, D.; Rösger, J. (eds.): Interactive Market-ing im Web 2.0+, Munich, pp. 197-214.
Möhlenbruch, D.; Dölling, S.; Ritschel, F. (2008): Web 2.0-Anwendungen im Kundenbindungs-management des M-Commerce, in: Bauer, H.; Dirks, T.; Bryant, M. (eds.): Erfolgsfaktorendes Mobile Marketing, Berlin, pp. 221-240.
Möhlenbruch, D.; Schmieder, U.-M. (2002): Mobile Marketing als Schlüsselgröße für Multi-channel-Commerce, in: Silberer, G.; Wohlfahrt, J.; Wilhelm, T. (eds.): Mobile Commerce,Wiesbaden, pp. 67-89.
Möhlenbruch, D.; Schmieder, U.-M. (2004): Multichannel-Kommunikation im Einzelhandel:Ausgewählte Ergebnisse einer empirischen Untersuchung, in: Bauer, H.; Huber, F. (eds.):Strategien und Trends im Handelsmanagement, Munich, pp. 101-119.
Mühlenbeck, F.; Skibicki, K. (2008): Community Marketing Management. Wie man Online-Communities im Internet-Zeitalter des Web 2.0 zum Erfolg führt, 2nd ed., Norderstedt.
Müller, C. (2008): Analyse sozialer Informationsräume zur Förderung des selbstorganisiertenWissensmanagements, in: Alpar, P.; Blaschke, S. (eds.): Web 2.0 - Eine empirische Bestands-aufnahme, Wiesbaden, pp. 157-181.
Oeltjen, W. (2005): Wiki und Weblog in der wissenschaftlichen Praxis, in: Ernst, S.; Warwas, J.;Kirsch-Auwärter, E. (eds.): Wissenstransform, Münster, pp. 139-147.
O’Reilly, T. (2005): What Is Web 2.0? Design Patterns and Business Models for the Next Gen-eration of Software, http://www.oreilly.de/artikel/web20.html, accessed December 28, 2008.
Panke, S.; Gaiser, B. (2009): ‘‘With My Head Up in the Clouds’’ - Using Social Tagging toOrganize Knowledge, in: Journal of Business and Technical Communication, Vol. 23, No.3, pp. 318-349.
Panten, G. (2005): Internet-Geschäftsmodell Virtuelle Community. Analyse zentraler Erfolgs-faktoren unter Verwendung des Partial-Least-Squares (PLS)-Ansatzes, Kiel.
Pleil, T.; Zerfaß, A. (2007): Internet und Social Software in der Unternehmenskommunikation,in: Piwinger, M. (ed.): Handbuch Unternehmenskommunikation, Wiesbaden, pp. 511-532.
Promondo (2007): Die Zukunft des Distanzhandels: Das Couching-Phänomen. Ergebnisse einerRepräsentativbefragung zum Kaufverhalten der Deutschen im Distanzhandel, PromondoUnternehmenskommunikation (ed.): Führt, http://www.quelle.com/de/versandhandelsmarkt/Couching_Studie.pdf, accessed December 28, 2008.
Möhlenbruch, D.; Blunck, D.E.; Ritschel, F. 23
Purper, G. (2007): Die Betriebsformen des Einzelhandels aus Konsumentenperspektive, Saar-brücken.
Reitler, Y. (2007): Web 2.0 - Sozio-technisches Phänomen oder Marketing-Hype?, in: Koll-mann, T.; Häsel, M. (eds.): Web 2.0, Wiesbaden, pp. 15–34.
Richard, B. (2008): Swarms und Task Force Communitys: Zur Re-Formierung des Kollektivenim Netz, in: Gross, F.v.; Marotzki, W.; Sander, U. (eds.): Internet - Bildung - Gemeinschaft,Wiesbaden, pp. 95-118.
Richter, A.; Joch, M.; Krisch, J. (2007): Social Commerce. Eine Analyse des Wandels imE-Commerce, Technischer Bericht Nr. 2007-3. Fakultät für Informatik, Universität derBundeswehr München (ed.), Munich.
Riegner, C. (2007): Word of Mouth on the Web: The Impact of Web 2.0 on Consumer PurchaseDecisions, in: Journal of Advertising Research, Vol. 47, No. 4, pp. 436-447.
Rölver, M.; Alpar, P. (2008): Social News, die neue Form der Nachrichtenverteilung?, in: Alpar, P.;Blaschke, S. (eds.): Web 2.0 - Eine empirische Bestandsaufnahme, Wiesbaden, pp. 295-330.
Sassenberg, K. (2008): Soziale Bindungen von Usern an Web 2.0 -Angebote, in: Hass, B.;Walsh, G.; Kilian, T. (eds.): Web 2.0, Berlin, pp. 57-72.
Schäfers, B. (2008): E-Commerce in der Otto Group am Beispiel des Social Shopping-Portals“smatch.com”, in: Töpfer, A. (ed.): Handbuch Kundenmanagement, Vol. 3, Berlin, Heidel-berg, pp. 677–684.
Schelske, A. (2007): Überallmarketing im Web 3.0, in: Absatzwirtschaft, Vol. 50, No. 11, pp.26-29.
Schenk, G. (2007): Individualisierung und Personalisierung - Kernprinzipien für Online-Geschäftsmodelle im Web 2.0, in: Kollmann, T.; Häsel, M. (eds.): Web 2.0, Wiesbaden, pp.35-52.
Schnieders, T. (2008): Otto - eShopping 2.0, in: Riekhof, H.-C. (ed.): Retail Business inDeutschland, 2nd ed., Wiesbaden, pp. 491-519.
Schögel, M.; Sauer, A.; Schmidt, I. (2004): Multichannel-Management – Vielfalt in der Distribu-tion, in: Merx, O.; Bachem, C. (eds.): Multichannel-Marketing-Handbuch, Berlin, pp. 1-27.
Schönefeld, F. (2006): Zweiter Frühling für E-Commerce, in: IM Information Management &Consulting, Vol. 21, No. 4, pp. 40-43.
Schramm-Klein, H. (2003): Multi-Channel-Retailing. Zwölf Grundsätze zur Gestaltung vonMulti-Channel-Systemen, in: Science Factory, Vol. 5, No. 3, pp. 10-14.
Schröder, H. (2005): Multichannel-Retailing. Marketing in Mehrkanalsystemen des Einzel-handels, Berlin.
Schütt, P. (2007): Web 2.0 und Social Software, in: IM - Fachzeitschrift für Information Ma-nagement & Consulting, Vol. 22, No. 1, pp. 15-18.
Silberer, G. (2002): Interaktive Kommunikationspolitik im Electronic Business, in: Weiber, R.(ed.): Handbuch Electronic Business, 2nd ed., Wiesbaden, pp. 709-731.
Souders, S. (2007): High performance web sites. Essential knowledge for frontend engineers[14 steps to faster-loading web sites], Beijing.
Souders, S.; Klicman, P. (2008): High Performance Web Sites: Essential Knowledge for Front-End Engineers, (German edition), Farnham.
24 European Retail Research, Vol. 24, Issue I, pp. 1-26
Stampfl, N. (2007): Sage mir, wen du kennst … Marketing mithilfe sozialer Netzwerke, in:Marketing Journal, Vol. 40, No. 4, pp. 30-33.
Thackeray, R.; Neiger, B.L. (2009): A Multidirectional Communication Model: Implicationsfor Social Marketing Practice, in: Health Promotion Practice, Vol. 10, pp. 171-175.
Tang, F.-F.; Xing, X. (2001): Will the growth of multi-channel retailing diminish the pricingefficiency of the web?, in: Journal of Retailing, Vol. 77, No. 3, pp. 319-333.
Thomas, W.; Stammermann, L. (2007): In-Game Advertising - Werbung in Computerspielen.Strategien und Konzepte, Wiesbaden.
Töpfer, A.; Silbermann, S.; William, R. (2008): Die Rolle des Web 2.0 im CRM, in: Töpfer, A.(ed.): Handbuch Kundenmanagement, 3rd ed., Berlin, pp. 651-675.
Verhoef, P.C.; Lemon, K.N.; Parasuraman, A.; Roggeveen, A.; Tsiros, M.; Schlesinger, L.A.(2009): Customer Experience Creation: Determinants, Dynamics and Management Strate-gies, in: Journal of Retailing, Vol. 85, No. 1, pp. 31-41.
Warr, W.A. (2008): Social software: fun and games, or business tools? in: Journal of Informa-tion Science, Vol. 34, pp. 591-604.
Warta, A. (2007): Wiki-Einführung in der Industrie. Herausforderungen und Chancen amBeispiel von Robert Bosch Diesel Systems, in: Dittler, U.; Kindt, M.; Schwarz, C. (eds.):Online-Communities als soziale Systeme, Münster, pp. 41-60.
Weathers, D.; Sharma, S.; Wood, S.L. (2007): Effects of online communication practices onconsumer perceptions of performance uncertainty for search and experience goods, in: Jour-nal of Retailing, Vol. 83, No. 4, pp. 393-401.
Wegener, M. (2008): Erfolg durch kundenorientiertes Multichannel-Management, in: Riekhof,H.-C. (ed.): Retail Business in Deutschland, 2nd ed., Wiesbaden, pp. 201-222.
Weiber, R.; Weber, M.R. (2002): Customer Relationship Marketing und Customer Lifetime Val-ue im Electronic Business, in: Weiber, R. (ed.): Handbuch Electronic Business, 2nd ed.,Wiesbaden, pp. 609-643.
Weinberg, P.; Purper, G. (2006): Ladengestaltung - Grundlagen und Konzepte, in: Zentes, J.(ed.): Handbuch Handel, Wiesbaden, pp. 657-670.
Wirtz, B.W. (2001): Electronic Business, 2nd ed., Wiesbaden.
Wirtz, B.W. (2008): Multi-Channel-Marketing. Grundlagen, Instrumente, Prozesse, Wiesbaden.
Zboralski, K.; Gemünden, H.G. (2004): Die Integration von Kunden in Communities of Prac-tice, in: Herstatt, C.; Sander, J.G. (eds.): Produktentwicklung mit virtuellen Communities,Wiesbaden, pp. 277-302.
Zentes, J.; Morschett, D. (2005): Retail Branding als strategische Markenpolitik des Handels,in: Esch, F.-R. (ed.): Moderne Markenführung, 4th ed., Wiesbaden, pp. 1139-1155.
Möhlenbruch, D.; Blunck, D.E.; Ritschel, F. 25

How to Maintain a Process Perspective on Retail Internationalization:The IKEA Case
Anna Jonsson
AbstractThe retail industry has witnessed fast international growth during the last couple of decades andvarious models and theories have been proposed for how to best explain the process and whysome firms succeed while others fail. Recently researchers have argued that not only do weneed more in-depth longitudinal case studies, and case studies from different sectors, but wealso need to understand the core activity of internationalization, namely the learning processesof how to manage the complex process of entering and operating in different markets. Whilemuch research has focused on market and marketing aspects of internationalization, organiza-tional aspects have received less attention. This article aims to fill that gap by focusing on theinternational home furnishings retail firm, IKEA, and their organizational routines for ensuringand managing a process perspective on their so-far-successful international expansion.
KeywordsRetail, Knowledge, IKEA, Internationalization, Organizational Routines
Acknowledgements: The author would like to thank the following: Handelsbanken’s researchfoundations, SSAAPS, SI, and HUR for funding this study; the staff of IKEA for their help andcontributions; Professor Steve Burt, Professor John Dawson, and her former supervisors Pro-fessor Ulf Elg, Associate Professor Kristina Eneroth and Professor Pervez Ghauri for interest-ing and valuable discussions in relation to retail internationalization and knowledge sharing.
Anna Jonsson (corresponding author)Lund University, School of Economics and Management, Department of Business Administration,P.O. Box 7080, Lund SE-220 07, Sweden(Tel: ++46 (0)46 222 36 48, E-mail: [email protected]).
Received: September 28, 2009Revised: March 4, 2010Accepted: March 15, 2010
EUROPEAN
RETAIL
RESEARCHVol. 24, Issue I, 2010, pp. 27-50
1. Introduction
The retailing industry has witnessed fast international expansion and many researchers have
sought explanations and new models for explaining the internationalization process and why
some firms succeed while others fail. Recently, Burt et al. (2008) presented a review of existing
models and theories for retail internationalization. It was stressed that when trying to simplify
and categorise, i.e. when trying to present yet another model for retail internationalization,
there is a risk of leaving out important variations in behaviour and outcomes. In their conclu-
sion they state that “retail internationalization is a process in which management learning is a
core activity” (Burt et al. 2008, p. 91). It is further argued that strategies cannot be linear and
static as the internationalization process is very complicated. In general, external market and
marketing aspects of internationalization are often stressed, while internal aspects focusing on
why organizations fail often receive less attention. In order to deepen our understanding of the
retail internationalization process it is crucial to comprehend how firms learn (if they do) from
their experiences of entering international markets. In order to be able to do so there is also a
need for an in-depth study of how an international retail firm learns from its experiences. This
is further supported by Burt et al. (2008, p. 91) who claim that
in order to make sense of strategic business practices and the outcomes which we tend tointerpret, we need more longitudinal and in-depth case histories and studies of many moreretailers from different sectors, countries and with different histories.
Retailing is more complex than and different from manufacturing in several aspects. For exam-
ple, in terms of its strategic objectives, its responsiveness to local culture, the dispersed nature
of operations and the large extent of network activities with many consumers and suppliers (e.g.
Dawson 2000, 2007; Elg 2003; Helfferich et al. 1997; McGoldrick 2002). Retailers offer an
intricate mix of products and services and in order to meet the consumers’ varying and chang-
ing needs and wants requires effective research procedures in order to understand cultural dif-
ferences that will influence buying behavior. Consequently, an international retailer needs to
operate on three organizational levels: a global corporate level; a national market level respon-
sible for stores in the specific market; and at a third level, each individual store (Elg 2005).
Moreover, retailing is interesting, as the industry has witnessed fast international expansion and
the retailer’s role has shifted from being a sales agent to a production agent for the consumer
(Dawson 2007); and some of the world’s largest firms are retail firms (Kumar 2005). This sup-
ports the argument that we need more and better in-depth studies of the process rather than stat-
ic, market and marketing related, explanations. Many retailers, such as IKEA, have evolved
from small domestic and local stores to large retail chains providing them with a basis upon
which they then later chose to develop abroad (Helfferich et al. 1997). The retailers’ power has
increased dramatically as they have grown into international, global, multinational and transna-
tional retailers. It is argued that various IT solutions have provided the opportunity to acquire
and share information and knowledge across borders. Still, publications on the impact and im-
28 European Retail Research, Vol. 24, Issue I, pp. 27-50
portance of how knowledge is created and shared in the retail internationalization context are
rather scarce (e.g. Palmer/Quinn 2005). The subsequent aim of this article is to develop our
understanding of organizational routines on how to manage the internationalization process by
focusing on an in-depth case study of how knowledge is shared within an international retail
firm.
In the following section recent research on retail internationalization as well as theories of
knowledge sharing will be discussed. The empirical case study of IKEA is then presented with
a focus on their internationalization process and the IKEA organizational structure. A discus-
sion of organizational routines about how IKEA manages its internationalization process is then
presented. Some general conclusions and implications for future research and management are
also presented.
2. Retail Internationalization
During the last two decades, research on international retailing has developed from empirical
observations toward more conceptually grounded models and frameworks (Alexander/Myers
2000). While some of these conceptual frameworks have sought integration with or inspiration
from the more general international business or marketing literature, others have sought to
develop these without drawing from general theories. Picot-Coupey (2006, p. 218) notes that
most research focusing on factors for entry mode choice are not grounded on theoretical frame-
works but rather on empirical findings. Burt et al. (2008) further notes that many of the pro-
posed models are too simplified and do not offer reasonable explanations for the complex
process that retail internationalization is characterised for. Research on retail internationaliza-
tion may be classified into three themes (Evans et al. 2000; Jackson/Sparks 2005). One theme
concerns the geographical spread of international activity. The second concerns motives for
internationalization. The third theme regards the selection of entry modes. Other themes have
been on retail internationalization and corporate culture, and management style and its implica-
tions for organizational learning. These other themes are argued to be examples of research
searching for a wider and deeper understanding of the internationalization process. However, as
it will be discussed further, researchers on retail internationalization have not fully explored the
research on, for example, organizational learning and knowledge management, but rather have
developed their own concepts derived from empirical studies (Palmer/Quinn 2005).
Picot-Coupey (2006) stresses, as does Evans et al. (2000), that research on retail international-
ization should benefit from more theoretically grounded approaches and that researchers have
so far neglected coherent theoretical frameworks. Doherty (1999), too, criticizes research on
retail internationalization for focusing on descriptive and empirical studies. It is further noted
that few others have focused on market entry strategy. By drawing on internalization theory,
Jonsson, A. 29
agency theory and information asymmetry, she develops a framework for explaining this
process. Doherty represents those researchers who argue that there are many deficiencies in the
existing research on retail internationalization, due mainly to the ignorance of other research
streams and for being mainly derived by models from empirical studies. This is partly in con-
flict with Burt et al.’s (2008) argument that there is a need for more detailed, in-depth studies
trying to explain the process rather than trying to simplify and codify it. Alexander and Myers
(2000, p. 349) argue that too much attention has been paid to the process and too little to “the
consideration of such developments within the broader framework of conceptual thought on
international business”. Still and what might be contradictory is that Alexander and Myers
(2000) are among those researchers reluctant to draw on general internationalization research.
Although Dawson (e.g. 2007) is reluctant and hesitates to adopt general research models to
retail internationalization, it is stressed that research on organizational learning should be able
to contribute to the retail literature. It has also been stressed by, for example, Doherty (1999),
Dawson (2000, 2003) and Palmer and Quinn (2005). This research acknowledges both strands
by offering both an in-depth case study and by drawing on existing research focusing on knowl-
edge sharing within the MNC as will be further outlined below.
Another type of criticism, i.e. separate from the criticism of loosely theoretically grounded
studies, relates to the discussion of the importance of taking a process perspective on interna-
tionalization. Dawson (2003) argues that questions about why, where and how retailers enter
new markets have been in focus but that there is still much to develop. There is a need for more
process-oriented research about retail internationalization. Most research on retail internation-
alization has focused on episodes of internationalization rather than on the processes of market
entry and internationalization (e.g. Jackson/Sparks 2005). As also noted by Picot-Coupey
(2006, 2007) researchers have focused on the entry mode choices but not on the choice of fur-
ther expansion and what might influence those choices. The argument put forward in this article
is that market entries should be viewed as part of the internationalization process. Jackson and
Sparks (2005) argue that research about retail internationalization needs to focus much more
on the implications and impact of “how” and “why” questions regarding retail internationaliza-
tion. The “how” is very much linked to the question of how knowledge is shared within the
retail organization when expanding and entering new markets. But before reviewing literature
on organizational routines as to how knowledge is shared across borders a few words need to be
said, in order to contribute to a better understanding of retail internationalization, about the con-
text of international retailing.
2.1. Retail Internationalization – a Different Context?
Retail internationalization is viewed by retail researchers as a field of research separate from
general research on internationalization and international business. Why do researchers on
30 European Retail Research, Vol. 24, Issue I, pp. 27-50
retail internationalization claim that retail is different from general internationalization research
and therefore should be viewed in a special context? This is an important question, sometimes
neglected in the academic debate, to pose in order to underline the argument that we need more
in-depth studies on the process of retail internationalization. Some of the arguments provided
are that retailing is more complex and different from manufacturing in several aspects; for
example, in terms of strategic objectives, its responsiveness to local culture, the dispersed
nature of operations, the large number of products and services offered, and the large extent of
network activities with many consumers and suppliers (e.g. Dawson 2000, 2007; Elg 2003;
Helfferich et al. 1997; McGoldrick 2002). Furthermore, it is argued that retailers offer a com-
plex mix of products and services in order to meet the consumers’ varying and changing needs
and wants. Another difference is the high cost and risk of setting up operations abroad com-
pared to straightforward goods exports. Many of these explanations relate to market and mar-
keting aspects of internationalization. However, it is possible that because of the peculiarities
with retailing; i.e., its close contact with the end-consumer and local suppliers, researchers have
tended to focus on these aspects. It is also possible that although there are differences from a
marketing perspective there may be similarities from an organization perspective, so that
although there are different marketing challenges between retail and manufacturing firms, there
may be organizational similarities for handling these challenges, i.e., in terms of how to share
knowledge. As noted by (Birkinshaw 2005) the service sector is characterized for competing
not on manufacturing assets but on the collective capabilities of their employees. It is therefore
surprising that there is a dearth of research focusing on the organizational aspects of retail inter-
nationalization. Because of the lack of research on intra-organizational processes in the litera-
ture on retail internationalization there is a need for investigating this issue further (e.g. Burt et
al. 2003). It is possible that a process lens focusing on routines regarding how to share knowl-
edge illustrates that there are more similarities between industries than the episodic perspective
has suggested so far.
Within the international retailing literature there are a number of different views as to whether
or not it is possible to adopt general theories about internationalization to retailing. When some
researchers argue that it is not possible or that it should be avoided, (e.g. Alexander/Meyers
2000; Dawson 2007) some argue that it is possible (Sternquist 1997), and some argue that it is
possible as long as they are adapted to better fit a retail context (Vida/Fairhurst 1998; Vida et al.
2000) [1]. Dawson (1994) argues that it may be possible to borrow some concepts from interna-
tionalization theory but that it is unlikely to apply them directly to the retail industry because
their structure, process and behavior are different from those of manufacturing firms. These
conflicting views stress the need for additional research. Dawson (2007) underscores that, at the
very least, researchers should be aware of these differences. Still, and despite these views, gen-
eral research should be able to learn from a study in a retail context because of the complexity
that stems from retail operations in different markets.
Jonsson, A. 31
It is interesting to note that researchers of general internationalization make no claims of differ-
ences between general research on internationalization and retail internationalization, whereas
retail researchers do. Researchers focusing on internationalization in general have not paid much
attention to retail firms (Dawson 2007). As pointed out by Doherty (1999, p. 396), it is surpris-
ing that the general internationalization literature virtually ignores international retailing.
Researchers should look beyond the traditional international marketing studies for new andinteresting perspectives.
The complexity that international retailers face should be interesting to study. The lack of re-
search within the general internationalization and international business field that focuses on
retail internationalization opens up many research opportunities. In relation to this study which
focuses particularly on the retail industry, the following argument by Walczak (2005, p. 330)
stresses the importance of studying knowledge sharing across borders within a retail firm.
The worldwide economy has shifted from industrial manufacturing, product oriented econ-omy to one based on knowledge and service, where the principle commodity is informationor knowledge.
Furthermore, as noted by Foss (2002, p. 11),
tasks and activities in the knowledge economy need to be coordinated in a manner that isvery different from the management of traditional manufacturing activities, with profoundimplications for the authority relation and the international organization and boundaries offirms.
2.2. Knowledge and Learning in the Retail Internationalization ProcessLiterature
Researchers focusing on retail internationalization have expressed the possible contribution of
theories on knowledge and learning to a better understanding of the process perspective on
retail internationalization (e.g. Doherty 1999; Dawson 2003, 2007; Palmer/Quinn 2005; Palmer
2005). Palmer and Quinn (2005) note that researchers have implicitly discussed issues of
knowledge and learning but not in relation to research. A few examples of research studies,
implicitly discussing issues related to knowledge sharing in international retailing, are briefly
discussed in the following paragraph. The ambition is to underscore the importance of putting
knowledge sharing in retail internationalization into a theoretical context, i.e. in relation to
existing research focusing explicitly on knowledge sharing. Palmer (2005) notes that focusing
more explicitly on knowledge and learning may increase the understanding of retailers’ interna-
tionalization processes and at the same time provide an opportunity to reinterpret and re-evalu-
ate existing research. However, as argued in this article it is also important to understand that
knowledge and learning have been discussed by researchers within different fields and to go
beyond knowledge management.
32 European Retail Research, Vol. 24, Issue I, pp. 27-50
There are many examples of research that could be linked to the topic of knowledge sharing in
retail internationalization. Burt and Mavrommatis (2006) focus for example on the internation-
al transfer of store image. Here, the term “standardization”, although not explained, is some-
times used interchangeably with replication a concept within research on knowledge sharing of
organizational routines (Winter/Szulanski 2001). However, the focus is not on how this image is
transferred but rather on what and whether or not the store image is standardized. Another
example is the study by Currah and Wrigley (2004) on transnational retailers. Drawing on find-
ings by Dawson (1994) that it is extremely difficult for retailers to protect knowledge (because
of its open nature) or store and retail offerings, Wrigley and Currah (2006) note that transna-
tional retailers need to pay attention to trying to achieve embeddedness. The authors analyze
and contextualize the geographies of organizational learning and adaptation among those
transnational retail corporations. The competitive advantage of transnational retail corporations
lies in the ability to adapt retail formats to different and changing consumer landscapes. How-
ever, much of their discussions relate to contextualizing international retailers as transnational
corporations rather than on how knowledge is shared within the organization, and on how that
influences the internationalization process. Another study which more explicitly focuses on
knowledge sharing, although not in relation to existing research on the retail internationaliza-
tion process, is the study by Hurt and Hurt (2005). They discuss the transfer of managerial prac-
tices and work routines by food retailers from France to Poland. From empirical studies, it was
found that the French management had problems in transferring or reproducing their business
model with the behavioural model of the Polish recruits. This is an interesting case, focusing the
problems of transferring French managerial practices and work routines to Polish store manage-
ment and floor personnel. However, as noted by Burt et al. (2008) there is a need for research on
retail internationalization in different sectors. Focusing on IKEA, a member of the home fur-
nishing retailing sector, should therefore contribute to a better understanding of the retail inter-
nationalization process.
Recently, Palmer and Quinn (2005) presented a framework for international retail learning.
Drawing on research on organizational learning and on retail internationalization that implicit-
ly focus on learning aspects, Palmer and Quinn (2005) present 16 research propositions for an
increased understanding of retail internationalization learning. When outlining the propositions
related to the first group, i.e. dimensions of international retail experiences, Palmer and Quinn
(2005) stress the importance of incorporating both internal and external circumstances when
focusing on what retailers can learn from their international experiences. In a subsequent arti-
cle, Palmer (2005) analyzes Tesco’s experiences from international retailing, focusing on the
dimensions of international retail experiences. The focus is on explaining what retailers can
learn from their international experiences, derived from interviews with retail managers. From
the discussion, it is clear that the lessons learned emphasize both internal and external circum-
stances although these do not necessarily have to be distinguished. Furthermore, Palmer and
Jonsson, A. 33
Quinn (2005) propose that researchers need to investigate the “degree of learning” and the
“locus of learning diffusion”. The degree of learning relates to how knowledge is absorbed by
the organization; that is, the ability to adopt and adhere to acquired knowledge. The locus of
learning diffusion relates to how knowledge is coordinated, diffused and embedded within the
organization. Furthermore, it is suggested that the ability to diffuse knowledge is related to
the level of international experience. In a subsequent article, Palmer (2005) focuses on what
mangers at Tesco learned from their international experiences. However, it is not shown how
knowledge is developed nor how it is shared and it is questionable whether Palmer (2005)
focuses on knowledge or just information. Still, the work by both Palmer (2005) and Palmer
and Quinn (2005) illustrates the importance of investigating knowledge sharing in retail inter-
nationalization by adopting research on, in this case, organizational learning. It is noted that
because knowledge is such a complicated concept there are many wins with looking into
research explicitly focused on knowledge sharing.
3. Knowledge Sharing Across National Borders
Although research on retail internationalization has only recently recognized the importance of
knowledge, general research on internationalization has for a long time acknowledged the
importance of transferring knowledge from HQ to subsidiaries. Foss (2006, p. 6) argues that
the theory of MNC has some lead-time with respect to understanding how knowledge andorganizations connect, particularly relative to the economics of organization.
However, as Foss and Pedersen (2002, p. 50) argue,
focus on knowledge has traditionally been a (static) matter of explaining the existence of theMNC by focusing on failures in markets for knowledge rather than on (dynamically) stress-ing the MNCs distinct capabilities of realizing competitive advantages through managingknowledge flows.
As pointed out by Ambos et al. (2006) the role of HQ as the source for knowledge is changing
and subsidiaries have grown to become important providers of knowledge necessary to stay
competitive in the increasingly global and competitive environment. As noted by Holm and
Sharma (2006), knowledge is no longer created in only one market, rather simultaneously in a
number of markets. The traditional hierarchically structured HQ-subsidiary relation has been
replaced by a more responsive structure; for example, “heterarchical” (Hedlund 1986), “multi-
focal” (Prahald/Doz 1987) or “transnational” (Bartlett/Ghoshal 1989) that can meet different
“demands of innovation and knowledge creation in a dynamic global economy” (Nohira/
Ghoshal 1997, p. 3). The differentiated MNC literature has become increasingly mainstream
and challenges the traditional transaction cost theories to focus more on issues related to knowl-
edge sharing (e.g. Nohira/Ghoshal 1997; Frost/Zhou 2005). As pointed out by Ambos et al.
34 European Retail Research, Vol. 24, Issue I, pp. 27-50
(2006, p. 295) the transnational solution adheres to the view of the firm as a “knowledge inte-
grating institution” (Kogut/Zander 1993), where the MNC is a result of the ability to integrate,
combine and create new knowledge within it. When adopting the view of the MNC as a transna-
tional corporation, subsidiaries become “strategic partners” (Bartlett/Ghoshal 1989, p. 102) and
it is important to recognize that within the MNC knowledge may originate from subsidiaries as
well and thus take different flows. Ambos et al. (2006, p. 294) address the question as to what
drives the benefits that headquarters can gain from learning from subsidiaries. It is argued that
changes in both the subsidiary’s context and its capabilities to process knowledge drive the effi-
ciency of the knowledge integrating MNC. Ambos et al. (2006, p. 296) further discuss forward,
reverse and lateral knowledge flows within MNCs. Forward knowledge flows refer to knowl-
edge from HQ to subsidiaries, reverse knowledge flows refer to knowledge from subsidiaries to
HQ and lateral knowledge flows refer to knowledge flows between subsidiaries. There is also an
expressed need within the general internationalization and MNC literature to develop our
understanding for how an organization manages knowledge flows and the micro perspective of
how the individual co-worker is motivated to contribute to share and benefit from knowledge
flows within the organization (e.g. Felin/Foss 2005).
3.1. Organizational Routines for Knowledge Sharing
Research on knowledge sharing stems from different fields such as technology and innovation,
strategic management, organizational learning and knowledge management, stressing different
factors for what might make or break knowledge sharing (e.g. Dierkes et al. 2001; Easterby-
Smith/Lyles 2003). The manifold suggestions may be categorized into different groups. One
suggestion is to focus on knowledge or cognitive issues (e.g. tacitness, absorptive capacity,
causal ambiguity and cognitive variety), organizational context (e.g. structure, intra-organiza-
tional integration and training) and institutional forces (e.g. individual and group motivation,
and norms and values) for knowledge sharing (Ciabuschi 2005; Kalling/Styhre 2003). Most of
the empirical work on knowledge sharing, and especially research focusing on IT systems as a
means of knowledge sharing, strongly emphasizes knowledge issues as explanatory factors
whereas organizational context and, in particular, institutional forces are more rarely addressed.
However, in order to fully understand the impact of knowledge sharing it is necessary not only
to investigate the role of IT systems but also routines and work methods in order to capture
more tacit pieces of knowledge. It therefore becomes even more important to understand the
organizational context and institutional forces. Recently, researchers have stressed the need for
more research on organizational context and institutional forces to reach a better understanding
of what enables or hinders knowledge sharing (e.g. Ciabuschi 2005; Gertler 2003, Gupta/
Govindarajan 2000; Kalling/Styhre 2003; Kane et al. 2005; Tsai 2000; Walczak 2005). This is
especially important when considering how organizational routines for managing a process like
retail internationalization develop. Organizational context and institutional forces seem to be
Jonsson, A. 35
especially evident in research focusing on knowledge sharing within MNCs (i.e. in the general
internationalization and international business literature). It is likely that knowledge factors
alone are unable to explain the complexity of knowledge sharing within MNCs. The need
for more research on organizational routines is stressed by Heimeriks and Duysters (2007, pp.
26-27) who argue that
[…] few studies have been able to explain how experience can be translated into a capability[and that] little empirical evidence exists with respect to how firms can best distribute andinstitutionalize organizational knowledge. More precisely the mechanisms that allow forknowledge transfer which can enhance adoption of new practices have hardly been analyzed.
4. Method
This research is based on a case study. In order to develop an understanding of the process per-
spective on retail internationalization process it is important to delve deeply in order to gain an
understanding of this phenomenon (Tsoukas 1989; Yin 2003). The main reason for choosing a
case study is when the aim is to search for new insights, findings and interpretations rather than
to test certain hypotheses (Merriam 1998). This research adheres to Dyer and Wilkins (1991,
p. 617) notion of case studies, namely that the researcher’s ambition should be to tell good sto-
ries rather than striving to create good constructs
the classic case study approach has been extremely powerful because these authors havedescribed general phenomenon so well that others have little difficulty seeing the same phe-nomenon in their own experience and research. We turn to the classics because they are goodstories, not because they are merely clear statements of a construct.
It is important to offer rich descriptions in order to be able to offer alternative aspects on how to
develop our understanding of the retail internationalization process. This was also further sup-
ported recently by the argument in Burt et al. (2008).
IKEA is an interesting case to study. It is the biggest global retail furniture company with an-
nual sales of almost 20 bn EUR in 2008. So far most in-depth case studies, as well as other
studies, have focused on international food retailers. IKEA was founded by Ingvar Kamprad in
1943 and is today owned by a foundation, the Stitching INGKA Foundation. During the last 40
years IKEA has grown from being a small Swedish family-owned company to the world’s
largest home furniture retailer with 283 stores in 36 countries, of which the IKEA Group owns
262 stores in 24 countries, employing 127,800 people. In 2009 the IKEA Group plans to open
26 new stores in 13 different countries. IKEA has witnessed a fast international expansion dur-
ing the last five to six years, the fastest expansion in IKEA history [2]. IKEA’s strategy is to
expand, both organically [3] and through franchising, with a standardized business model and
concept offering one standardized product range. IKEA was to look and be perceived as exact-
ly the same, no matter whether you visit a store in Älmhult in Sweden or Tokyo in Japan.
36 European Retail Research, Vol. 24, Issue I, pp. 27-50

The empirical data was mainly gathered through in-depth semi-structured interviews about the
international expansion of IKEA and knowledge sharing. In total, 70 interviews were carried
out with IKEA between 2003 and the present. Interviews were conducted at market level in
Russia (23), China (11) and Japan (17). Although not all of them were used for this specific
article they all provide an interesting and necessary background to understand IKEA’s replica-
tion strategy for internationalization and how knowledge is shared across national borders. In
addition to the interviews at market level, 19 were conducted at the global Service office in
Sweden as well as with IKEA of Sweden and Trading & Distribution and IKEA Inter Services
AB. These interviews focused on IKEA’s internationalization approach, strategic orientation,
culture and values as well as strategies for knowledge sharing. In each country, interviews were
carried out with employees from different parts of the organization, encompassing managers at
the national service office and store managers as well as a number of employees responsible for
certain product categories in the store. The interviews started with open and inductive questions
about IKEA’s international expansion. As the interviews progressed, the questions gradually
became more structured, inquiring more about routines for knowledge sharing within IKEA.
All the interviews lasted between 90 and 180 minutes. Participant observation looking for ways
in which knowledge is shared in the day-to-day work was also carried out. The observation in an
IKEA store in Tokyo, Funabashi, Japan [4], took place over a period of five days in December
2006. And for three days participant observation was used when a Business Area (BA) Manag-
er (and part of the time) her co-workers were followed and observed in their daily work. In addi-
tion, secondary sources such as corporate material, documents and manuals, as well as books
and magazines about IKEA’s history and business ideas were collected (Merriam 1998). The
empirical findings were compared with the theoretical framework, according to Yin’s (2003)
pattern-matching method of analysis.
5. IKEA’s International Expansion
In order to understand IKEA and its internationalization process it is important to establish a
starting point as to how the business idea and the IKEA concept have evolved over time and
even more so regarding how IKEA has learned from experience. The exploration of the busi-
ness model is expressed by IKEA in the following manner [5]:
The IKEA concept has evolved over more than 50 years as a result of serious opportunitiesand experiences, both large and small in many different areas. The result today is a strong,tried and tested concept, which has proved that it is possible to combine global businessideas with local business opportunities.
The IKEA business idea is to offer “a wide range of well-designed, functional home furnishing
products at prices so low that as many people as possible will be able to afford them” [6], and in
order to do so it is expressed that it is important to find solutions that are both innovative and
Jonsson, A. 37
cost-efficient. Thus as will be discussed further, organizational routines on how to work for
IKEA are actually embedded in the business idea.
In the following section the reader is introduced to the “IKEA-world” by discussing how IKEA
has evolved into a global home furnishing retailer and how IKEA is structured. More specifi-
cally the discussion will underline arguments as to how IKEA manages to maintain a process
perspective on their internationalization process, i.e. using standardised solutions while at the
same time constantly searching for new opportunities and better solutions through successful
knowledge sharing by focusing on their organizational routines. In the subsequent section links
to the theoretical discussion about retail internationalization and knowledge sharing will be
made.
5.1. The International Expansion of IKEA
In the following paragraphs the international expansion of IKEA is summarized, structured
according to a time-line where critical events are discussed and serve as explanations for how
experiences and lessons learned have influenced the ongoing internationalization process.
IKEA started its international journey in 1965 by entering the Norwegian market. Six years lat-
er IKEA entered the Danish market. In 1973 Ingvar Kamprad decided that it was time to go
even further away from Älmhult. The first store outside Scandinavia opened in 1973 outside
Zurich, Switzerland. The international expansion was a direct consequence of saturated growth
and an ambitious idea that larger volumes could enable IKEA to lower prices and therefore
become more competitive. The process and that decision is described by one manager (Salzer
1994, pp. 59-60) who said,
have you heard about how we started abroad? By then we had entered Norway, but that wasby mistake, you know… a kind of consultant who had duped us to buy some building lot.And then they pondered, which market is the most conservative when it comes to furniture?Well, it’s Switzerland. So they took the train to Switzerland. Well it was Janne [Jan Aulin]and Kamprad. And they stood outside the shops that sold modern furniture in Switzerland,you know, and they stood there and they asked the people who stopped and looked in thewindows. […] And when they had been standing there for half a day they were assured thatthere were enough people who liked that kind of furniture but that it was too expensive, sothere must be a market, they thought, and then they went back to Sweden. And so we boughta building and started the first store in Switzerland. … And it’s continued like that.
The initial process of entering new markets can be described as a trial and error process. It was
during the 1960s and 1970s that IKEA learned the “basic techniques” for entering foreign mar-
kets. IKEA acquired the necessary learning in order to enter new markets more rapidly during
the 1980s–1990s (Torekull 2003, p. 175). During this period IKEA opened so-called “test
stores” in city centers. However, this decision was later changed to open up bigger stores on city
outskirts with good infrastructure instead, and to make all IKEA stores similar; that is, to paint
38 European Retail Research, Vol. 24, Issue I, pp. 27-50
them blue and yellow. Over time it has become even more important to standardize the store
format and there is nowadays a minimum size for new stores, thus securing the possibility for
bigger volume. Standardized marketing solutions enable IKEA to focus more on the organiza-
tional aspects, i.e. the organizational routines on how to support the internationalization
process.
During the initial phase of IKEA’s internationalization process there was a special team respon-
sible for entering new markets. The expansion team normally moved into a new market, set up
the first store, and then left for another market. This phase can be described as the exploration
phase, as IKEA explored the techniques for setting up new IKEA stores in new markets. The
expansion team had a great entrepreneurial spirit and was very enthusiastic. However, their role
was not always appreciated as they left once the store had opened and the store manager was left
behind with problems. During this period there was a saying about “the action group fool Hum-
lan [the bee]” meaning that the signals sent from HQ (by that time Humlebaeck in Denmark)
would not always be followed (Torekull 2003).
In 1979 a project called “Kraft 80” was initiated. There was an increasing concern that IKEA
had grown too fast and the project was a reaction to the risk of “losing the heart” (Salzer 1994,
p. 66). A few drawbacks made IKEA realize that conceptualization was important and that
IKEA could benefit from a more conceptualized business, i.e. from replicating their business
when entering new markets. The “IKEA Way”, an internal document, is one result of those
efforts where guidelines for replicating IKEA are clearly stated. Inter IKEA Sytems B.V
describe the IKEA Way as consisting of: the IKEA culture (the common platform); the IKEA
concept (the framework for turning the business idea into reality); and the organization,
processes methods, policies, guidelines and supporting systems that are all necessary to achieve
the business idea. However, many of these ideas had existed since the beginning of the 1970s
but had not been documented. A manager at Inter IKEA Systems B.V stressed that the ideas and
the concept were already clear but there was a greater need, as a consequence of the growing
company, to conceptualize and document them.
The second phase of IKEA’s internationalization can be characterized as exploiting a business
mode. IKEA sent out the “expansion group” to set up new stores in new countries before mov-
ing on to the next country. Standardized marketing solutions were in focus for reasons of cost-
savings. Format stores were developed and the blue and yellow stores were “planted” in new
cities and new markets. The reason why IKEA stores are standardized; that is, painted in blue
and yellow and having a standardized layout, is to save costs on building the IKEA stores. How-
ever, IKEA later realized that by standardizing certain solutions they could spend more time on
finding the right organizational routines for running and managing IKEA according to the
IKEA way. This is a rather new insight and characterizes what can be described as a third phase,
or the current phase, of IKEA’s internationalization process.
Jonsson, A. 39
During the last five to seven years there have been almost 100 store openings in 19 different
markets, of which three are new markets. During these years IKEA has witnessed the fastest
international expansion ever in its history. This phase can be described as a phase of both explo-
ration and exploitation, i.e. where small adjustments and improvements are made to the
concept. In order to survive a competitive environment it is important to be innovative, and
this can only be achieved through both exploration and exploitation. In an internal document,
“The future is filled with opportunities” (Salzer 1994, p. 61), it is clearly stated that IKEA will
continue to grow and furnish the world and in order to do so it is important to be able to both
explore and exploit.
Today you will find IKEA all over the world and IKEA’s size will give rise to new problems,problems that will be solved in the same unconventional way that IKEA has always solvedits problems. IKEA will never be completely finished. Life will feed IKEA with newproblems. Problems that create new ideas and new solutions. Solutions that will changeIKEA.
5.2. The IKEA Organization
IKEA is not just IKEA. IKEA consists of many different organizations with different responsi-
bilities but with the common goal of satisfying the IKEA customer. The background to the cur-
rent organization structure stems from the many challenges with the international expansion of
the 1970s and 1980s and the efforts of conceptualizing IKEA. The present ownership structure
was developed during the exploration phase and IKEA was given away to the INGKA Stitching
foundation. In the beginning of the 1970s Ingvar Kamprad had already started to think about the
time after his death and what would then happen to IKEA. There was a need to conceptualize in
order to protect the organization from external interests and hostile takeovers as well as a way of
solving the problem of high taxes in Sweden. In 1976 the “Furniture Dealer’s Testament” was
written, an internal document explaining the IKEA concept, norms and values that are and have
been important for the internationalization process. This document has become a key document
for IKEA. For Ingvar Kamprad [7] himself “maintaining a strong IKEA culture is one of the
most crucial factors behind the continued success of the IKEA concept”. In 1996, 20 years after
“A furniture Dealer’s Testament”, Ingvar Kamprad wrote what is known as the “IKEA values”. It
is stressed that the IKEA values are part of the work environment at IKEA and from the perspec-
tive of knowledge sharing across borders it is interesting that through the IKEA work environ-
ment “you’ll be able to contribute to the development of others”. This clearly emphasizes that
knowledge sharing between “co-workers”, as they are called, is important. The IKEA values are
part of the Human Resource Idea and through these values new IKEA co-workers are recruited.
From the perspective of knowledge sharing these values represent an important factor for knowl-
edge sharing, i.e. focusing on institutional forces or what motivates people to share knowledge
(e.g. Kalling/Styhre 2003). IKEA describes the recruitment process [8] by saying,
40 European Retail Research, Vol. 24, Issue I, pp. 27-50
Our goal is to employ co-workers who understand and embrace our core values and who willreflect and reinforce those. We want to recruit the candidates most suited for work life atIKEA, based on value set and attitude, in addition to skills and experience. We can supportthe recruitment process by working through the words of our core values using effectivequestioning techniques.
In the middle of the 1980s IKEA was restructured and the “three legs”, the IKEA Group (“the
blue group”), Inter IKEA Systems (“the red group”) and IKANO (“the green group”) were cre-
ated. It is claimed that the major reason for this organizational structure is that Ingvar Kamprad
wanted IKEA to be structured in such a way that the IKEA concept would not get lost and that
IKEA would be able to continue to grow. In Torekull’s (2003) book about IKEA the organiza-
tion is described as being controlled by both the “hand” and the “spirit” and that Ingvar Kam-
prad personifies this idea. The “hand” controls the physical ownership such as in the stores,
whereas the “spirit” controls the IKEA concept. In the middle of this there is Älmhult in Små-
land, where it all started. Ingvar Kamprad notes (Torekull 2003, p. 199) [9],
the IKEA spirit emanates from those lessons we learnt during the first pioneer years in thiscountryside. Both as a smålänning and as a rational thinker I defend the idea that Älmhult isour heart, our spiritual home.
In order to understand the IKEA concept it is important to comprehend the whole pipeline; i.e.
Retail, Distribution and Range. To be able to offer IKEA to the customers, the IKEA stores; i.e.
IKEA Retailing, needs to be supported by Distribution; Purchasing; Industry group (Swed-
wood); IKEA of Sweden (IoS), responsible for developing the range; and various expert and
supporting functions including, e.g. IKEA IT and IKEA Communications. Inter IKEA Systems
gives IoS the assignment of developing the IKEA range so that the IKEA concept is main-
tained. All other parts of IKEA operate on the local level. Concerning the relationship between
IKEA Retail, IoS and IKEA Inter Systems, one manager describes the relationship between the
organizations thus:
We do our job but we are totally dependent on each other. We kind of live in a symbiosis.
The organizational structure of the IKEA Group is a matrix. It is important to understand the
matrix especially in order to understand how knowledge is shared within IKEA. Each country
has a Service Office (SO). The SO will support the stores in that market. In each store there is a
store manager and department managers for HR, Sales, Restaurant, etc. Under the Sales depart-
ment there are managers responsible for different product areas. Then in the Service office there
is an overall Sales manager, overall HR etc. In relation to factors for knowledge sharing, organ-
ization structure is important (e.g. Kalling/Styhre 2003) in order to understand how knowledge
flows within the firm. The matrix organization and ideas about a shared vision reminds one of
the ideas about the transnational solution (Bartlett/Ghoshal 1989), where knowledge takes mul-
tiple paths as it flows between levels and markets.
Jonsson, A. 41
The people of IKEA are vital for its growth including its expansion into international markets.
As one manager at IoS expressed it,
I can see that IKEA as a company is very much driven by development. We talk aboutgrowth. And I used to say that, we need growth, we need to grow as a company. But then weneed growing people. In some sense it starts with recruitment, to have people that really seethe challenge in this not to be stable and secure but willing to take risks, willing to exposethemselves. […] And in that sense it is motivation and maybe it is hard to relate to that,because we can see that people, at least the people that we want to stay with us, they take thechallenge and they want to grow as the best reward. And I think that is why we don’t need togive a lot of salary, and a lot of other compensation benefits because we don’t promise that.We promise that we will grow and expand with you.
It is significant for one group of IKEA employees that they stay with the company for many
years. In an internal brochure [10] it is expressed as “Masses of jobs for masses of people in
masses of places”. The average employee or “co-worker” (the title IKEA uses for their employ-
ees) at IKEA has worked for many years and has tried many different positions at both the
strategic and the operational levels in the IKEA-world. “Many years” normally means 15-30
years. One IKEA co-worker described it as “part of the natural development of the organiza-
tion”. The typical career path within IKEA is to try new positions within IKEA (i.e. the differ-
ent organizations forming IKEA) in order to get broad knowledge about IKEA and to under-
stand the whole pipeline. CEO Anders Dahlvig (Kling/Goteman 2003, p. 37) argues,
what is fundamentally important for us is for people to work well together across functionsbecause they have to understand our pipeline. We have always been good at knowing certainparts, but now more of a pipeline-oriented understanding is required.
However, it is not just that people move around from one position and country to another. On
IKEA’s Intranet [11] rules for expatriates are to be found, where it is stressed that knowledge
sharing is important.
People who move across borders and learn different parts of IKEA gain an insight into dif-ferent cultures and expand their network. People who move across functions learn new anddifferent skills. This gives them an opportunity to contribute more to both the daily work anddevelopment of the company.
There are of course also a number of co-workers who remain for only a few years. These are
people who usually work only part-time in the stores. The employee turnover is a huge chal-
lenge which can vary considerably between different countries. In some stores in the US, the
turnover can be up to 70% whereas in Italy, for example, it can be no more than 3%. In terms of
knowledge sharing, it is the group of part-time co-workers that is a real challenge for IKEA;
how to motivate these people to learn and also to share their experiences. Therefore, IKEA puts
a lot of emphasis on IKEA values when recruiting new co-workers. A “climate check” is made
every year when an internal survey called the “Voice” is sent to IKEA co-workers where the
IKEA culture is mirrored in the questions. Many of these questions are related to motivational
or institutional factors for knowledge sharing within the organization.
42 European Retail Research, Vol. 24, Issue I, pp. 27-50
5.3. Routines for Knowledge Sharing within IKEA
In order to be able to replicate IKEA the IKEA way in new markets and to prevent IKEA from
turning into a German or a Russian IKEA there are different methods for sharing knowledge
across national and intra-organizational borders. The organization responsible for the IKEA
concept and for securing its replication all over the world is Inter IKEA Systems B.V. The
“commercial review” is an internal tool used for measuring how the IKEA concept is followed
in other countries and in various functions. The purpose with the commercial review is both to
control adherence to the concept and to acquire new business opportunities and new “best prac-
tices”. Best practices explored from the review process are then published on the Intranet or in
the manuals provided by Inter IKEA Systems B.V. As one manager describes the process:
To conceptualize is very much about documenting and making the concept accessible allover the world.
Best practices are thus explored and exploited in the IKEA-world. Best practices are spread
both through manuals and via the Intranet, through what is called a Toolbox. In an ad in the
internal newspaper IKEA Ideas it is written that the
IKEA toolbox is a digital concept communication system from Inter IKEA Sytems BVwhere information about IKEA retailing know-how and tools to use within the IKEA con-cept […] Take a look in the IKEA tool box and see how you can use it to improve your skills.And save time and money [12].
The Intranet is considered an important tool for sharing knowledge about best practices. How-
ever, depending on ones position within the organization it is regarded as more or less impor-
tant. Part-time co-workers working on the shop floor do not have much time or easy access to
the Intranet. Different solutions, such as installing computers in the staff canteen, can provide
the means for all co-workers to explore the Intranet and learn more about IKEA. The IKEA
Group is responsible for the organic growth of IKEA and thus for securing that these best prac-
tices and “proven solutions” are followed. However, part of the IKEA concept is to question and
seek new solutions, to explore new opportunities. There is an organizational structure for guid-
ing co-workers in new countries in their search for new solutions at the same time as they
adhere to the IKEA concept.
From the interviews it is obvious that knowledge sharing is central to IKEA’s expansion and for
securing the IKEA way of doing business. Part of IKEA’s strategy when entering new markets
is to send out expatriates to share their knowledge about IKEA. This solution is an example of
organizational factors explaining knowledge sharing (e.g. Kalling/Styhre 2003). One HR man-
ager expresses it this way:
When the expatriates leave it is necessary that it has grown under the tree because otherwisewe will have a huge problem … . […] So that you really work with transferring your knowl-edge, to really share with others. You can’t sit in a corner with all your knowledge and giveorders without sharing - then there will be a vacuum when you leave.
Jonsson, A. 43
Expatriates and existing co-workers are responsible for sharing this knowledge with new co-
workers. Having a “buddy”, an experienced IKEA employee, is one solution for IKEA to edu-
cate new employees in the IKEA way of doing business and to share their knowledge about
IKEA. In each country there is one IKEA store functioning as a learning centre for new IKEA
stores managed by that country’s Service office. In this learning centre new co-workers are
trained according the IKEA principles. When entering a new market, and if a learning centre is
not yet in place, employees are sent to other markets in order to learn about IKEA. This is
applied both for co-workers working at the Service office and for co-workers and department
heads working in the store. In addition, expatriates are not only employed for the purpose of
entering a new market and to set up the business but also to train local employees according to
the IKEA way. Having a foundation and long-term strategies enables the organization to work
with knowledge sharing at all levels, ensuring that everybody can identify with the IKEA con-
cept. In the HR idea it is explicitly stated that,
as an IKEA employee you are willing to share your knowledge and experience with allIKEA employees (IKEA HR Idea).As an IKEA co-worker you continually learn from your own and other’s experiences, whichenable you to solve and complete your own tasks (IKEA HR Idea).
6. Concluding Discussion
This article has taken an intra-organizational perspective on the retail internationalization
process, by focusing on organizational routines and specifically on knowledge sharing in order
to better understand how to manage and maintain a process perspective on retail international-
ization. Because of the lack of research on knowledge sharing in the context of retail interna-
tionalization, this present study provides an opportunity to reinterpret and re-evaluate existing
research on retail internationalization.
The case study of IKEA illustrates how knowledge is shared within the IKEA-world. Focusing
on organizational routines for supporting multiple knowledge flows across national and intra-
organizational levels. The dynamic capability of IKEA to manage the internationalization
process according to “IKEA way” is a result of what has been learnt from the international
expansion. As IKEA learns from challenges met in new markets, best practices are spread to
IKEA worldwide. There are a number of routines and mechanisms for sharing knowledge and
supporting the international expansion of IKEA. These have developed over time and as a con-
sequence of experiential knowledge. Knowledge sharing has become increasingly important as
an enabler for the expansion of IKEA. Knowledge sharing was often mentioned as part of the
IKEA culture, which is important to understand as it explains the institutional forces driving
knowledge sharing across borders. Knowledge sharing within the IKEA world is also support-
ed by a matrix organization, ensuring multiple knowledge flows throughout the organization.
44 European Retail Research, Vol. 24, Issue I, pp. 27-50
The central organization, in this case both the IKEA Group and Inter IKEA Systems, also plays
an important and coordinating role in terms of both securing that experiential knowledge is
acquired from different markets and that the replicating formula is kept viable; i.e., where
adjustments are made in accordance to gained experiences, and shared and followed within the
IKEA-world. The method for how knowledge is shared within IKEA corresponds with recent
research stressing the importance of acknowledging the organizational context and institutional
forces (e.g. Ciabuschi 2005; Kalling/Styhre 2003). This view also corresponds with the ideas
about the transnational corporation as first introduced by Bartlett and Ghoshal (1989). An inter-
esting link to this discussion is the argument by Özomer/Gençtürk (2003) that, when taking a
transnational view, it becomes clear that it is also necessary to incorporate reasoning on how
experiences gained in one market will influence the ongoing replication process, and on how
knowledge flows across national borders.
In relation to the contribution to research, this study contributes to the expressed need for devel-
oping our understanding of the process perspective of retail internationalization and where
management learning is a core activity (Burt et al. 2008). By focusing on how knowledge is
shared within an international retail firm this study also contributes to research that has
expressed the need for a deeper understanding for knowledge and learning in the retail interna-
tionalization process (e.g. Dawson 2007; Doherty 1999; Palmer/Quinn 2005). There is also a
need to incorporate and benefit from existing research and move away from a focus on only
descriptive or empirical studies (Picot-Coupey 2006). By linking existing research on knowl-
edge sharing, and illustrating that knowledge and learning are complex concepts spanning dif-
ferent research fields, this research aims to meet that criticism. This study also contributes to
general internationalization and MNC research seeking more details on how experience can be
translated into a capability and how firms can best distribute and institutionalize organizational
knowledge (Heimeriks/Duysters 2007).
In terms of implications for managers this study has focused on the organizational routines sup-
porting the retail internationalization process. The IKEA case clearly illustrates the importance
of always being open to learning from experiences, good and bad, in order to be innovative and
cost efficient; i.e. to understand and take a process perspective. A part of the IKEA business
idea stresses that it is essential to always search for new opportunities and better solutions.
Organizational routines must embrace continuous learning in order to employ such a pattern.
From the IKEA case it is clear that HR plays an important role in building and nurturing a
strong corporate culture supporting organizational routines such as those for knowledge shar-
ing. Drawing on the insights of this in-depth case study it is clear that managers will have to pay
more attention to how knowledge is shared in order to facilitate international expansion. For
international firms this has to do with the challenges of entering new markets, and at the same
time maintaining growth and gaining market share in existing markets. Market entries must be
Jonsson, A. 45
supported but the ongoing activities in existing markets must also be recognized and supported.
Thus it is crucial to understand the process perspective of the retail internationalization process.
Not only is knowledge sharing important from a cost-efficiency perspective, but also from an
innovation perspective when new opportunities or lessons learned are explored and then
exploited throughout the organization. When focusing on factors for knowledge sharing it was
illustrated that when knowledge sharing has become part of the corporate culture and work rou-
tines, less effort has to be put into steering knowledge flows.
Notes
[1] For an overview of research on retail internationalization that has drawn from generalinternationalization.
[2] Figures from August 2009 (http://www.ikea-group.ikea.com, accessed August 30, 2009).
[3] All IKEA stores are franchise operations that have been granted their franchise licenses byInter IKEA Systems B.V. When referring to organic growth it is expressed that this is runby means of internal franchising as the IKEA concept and brand is owned and controlledby Inter IKEA Systems B.V.
[4] In July 2002, the IKEA Group established IKEA Japan KK. IKEA opened its first store inTokyo, Funabashi in April 2006. The second store also placed in Tokyo, Kohoku opened inSeptember 2006. The entrance is described as the biggest Greenfield foreign investmentever made in Japan. Initially, IKEA plans to launch eight to twelve outlets, with the firststores in Tokyo. In a longer perspective IKEA plans to open 46 stores in Japan.
[5] “Inter IKEA Systems B.V - The owner and franchisor of the IKEA Concept”, Inter IKEASystems B.V. 2002: 8.
[6] “The IKEA Symbols - leadership by example”, Inter IKEA Systems B.V. 2001: 10.
[7] http://www.ikea.com/ms/en_GB/about_ikea/timeline/full_story.html, accessed May 11, 2007.
[8] “Recruitment through our values”. Inter IKEA Systems.
[9] My translation.
[10] “IKEA - We’re looking for more enthusiasts to help us prove that nothing is impossible”,Inter IKEA Systems B.V. 2006. http://www.ikea-group.ikea.com, accessed August 30, 2009.
[11] “Mobility - working abroad with IKEA”, IKEA Intranet, 2006-01-11.
[12] Ad in IKEA ideas 3.03. Inter IKEA Systems B.V.
References
Alexander, N.; Myers, H. (2000): The retail internationalization process, in: International Mar-keting Review, Vol. 17, No. 4, pp. 334-353.
Ambos, T.C.; Ambos, B.; Schlegelmilch, B.B. (2006): Learning from foreign subsidiaries: Anempirical investigation of headquarters’ benefits from reverse knowledge transfers, in: Inter-national Business Review, Vol. 15, No. 3, pp. 294-312.
46 European Retail Research, Vol. 24, Issue I, pp. 27-50

Bartlett, C.A.; Ghoshal, S. (1989): Managing across borders – the transnational solution, Har-vard Business School Press, Boston, Massachusetts.
Birkinshaw, J. (2005): Knowledge movs, in: Business Strategy Review, Vol. 16, No. 4, pp.38-41.
Burt, S.; Davies, K.; Dawson, J.; Sparks, L. (2008): Categorizing patterns and processes inretail grocery internationalisation, in: Journal of Retailing and Consumer Services, Vol. 15,No. 2, pp. 78-92.
Burt, S.; Mavrommatis (2006): The international transfer of store brand image, in: The Interna-tional Review of Retail, Distribution and Consumer Research, special issue, Vol. 16, No. 4,pp. 395-413.
Ciabuschi, F. (2005): On IT systems and knowledge sharing in MNCs: A lesson from SiemensAG, in: Knowledge management research & practice, Vol. 3, pp. 87-96.
Currah, A.; Wrigley, N. (2004): Networks of organizational learning and adaptation in retailTNCs, in: Global Networks, Vol. 4, No. 1, pp. 1-23.
Dawson, J. (1994) The internationalization of retailing operations, in: Journal of MarketingManagement, Vol. 10, pp. 267-268.
Dawson, J. (2000): Retailing at century end: some challenges for management and research, in:International Review of Retail, Distribution and Consumer Research, Vol. 10, No. 2, pp.119-148.
Dawson, J. (2003): Towards a model of the impacts of retail internationalisation, in: Dawson, J.;Mukoyama, M.; Choi, S.C.; Larke, R. (eds.): The internationalization of retailing in Asia,London.
Dawson, J.A. (2007): Scoping and conceptualising retailer internationalisation, in: Journal ofEconomic Geography, Vol. 7, pp. 373-397.
Dierkes, M.; Berthoin Antal, A.; Child, J.; Nonaka, I. (2001): Handbook of organizational learn-ing and knowledge, Oxford.
Doherty, A.M. (1999): Explaining international retailers’ market entry mode strategy: internal-isation theory, agency theory and the importance of information asymmetry, in: Internation-al Review of Retail, Distribution and Consumer Research, Vol. 9, No. 4, pp. 379-402.
Dyer, J.W.G.B.; Wilkins, A.L. (1991): Better stories, not better constructs, to generate bettertheory: A rejoinder to Eisenhardt, in: Academy of Management Review, Vol. 16, No 3,pp. 613-619.
Easterby-Smith, M.; Lyles, M.L. (2003): The Blackwell handbook of organizational learningand knowledge management, Malden, Mass. [u. a.].
Elg, U. (2003): Retail market orientation: A preliminary framework, in: International Journal ofRetail and Distribution Management, Vol. 31, No. 2, pp. 107-117.
Elg, U. (2005): A comparative study of retail market orientation in three European countries,Conference paper presented at the EAERCD conference in Lund, Sweden.
Evans, J.; Treadgold, A.; Mavondo, F.T. (2000): Psychic distance and the performance of inter-national retailers - A suggested theoretical framework, in: International Marketing Review,Vol. 17, No. 4-5, pp. 373-391.
Felin, T.; Foss, N.J. (2005): Strategic organization: a field in search of micro-foundations, in:Strategic Organization, Vol. 3, No. 4, pp. 441-455.
Jonsson, A. 47
Foss, N. (2002): ‘Coase vs Hayek’: Economic organization and the knowledge economy, in:International Journal of the Economics of Business, Vol. 9, No. 1, pp. 9-35.
Foss, N.J. (2006): Knowledge and organization in the theory of the multinational corporation:Some foundational issues, in: Journal of Management & Governance, Vol. 10, No. 1,pp. 3-20.
Foss, N.; Pedersen, T. (2002): Transferring knowledge in MNCs - The role of sources of sub-sidiary knowledge and organizational context, in: Journal of International Management, Vol.8, No. 1, pp. 49-67.
Frost, C.; Zhou, T. (2005): R&D co-practice and ‘reverse’ knowledge integration in multina-tional firms, in: Journal of International Business Studies, Vol. 36, No. 6, pp. 676-687.
Gertler, M.S. (2003): Tacit knowledge and economic geography of context, or the indefinabletacitness of being (there), in: Journal or Economic Geography, Vol. 3, pp. 75-99.
Gupta, A.K.; Govindarajan, V. (2000): Knowledge flows within multinational corporations, in:Strategic Management Journal, Vol. 21, No. 4, pp. 473-496.
Hedlund, G. (1986): The hypermodern MNC - A heterarchy?, in: Human Resource Manage-ment, Vol. 25, No. 1, pp. 9-36.
Heimeriks, K.G.; Duysters, G. (2007): Alliance capability as a mediator between experienceand alliance performance: An empirical investigation into the alliance capability develop-ment process, in: The Journal of Management Studies, Vol. 44, No. 1, pp. 25-49.
Holm, U.; Sharma, D. (2006): Subsidiary marketing knowledge and strategic development ofthe multinational corporation, in: Journal of International Management, Vol. 12, No. 1,pp. 47-66.
Helfferich, E.; Hinfelaar, M.; Kasper, H. (1997): Towards a clear terminology on internationalretailing, in: The International Review of Retail, Distribution and Consumer Research, Vol.7, No. 3, pp. 287-307.
Hurt, M.; Hurt, S. (2005): Transfer of managerial practice by French food retailers to operationsin Poland, in: The Academy of Management Executive, Vol. 19, No. 2, pp. 36-49.
IKEA HR Idea. Inter IKEA Systems B.V.
Jackson, P.; Sparks, L. (2005): Retail internationalization: Marks and Spencer in Hong Kong,in: International Journal of Retail & Distribution Management, Vol. 33, No. 10, pp. 766-783.
Kalling, T.; Styhre, A. (2003): Knowledge sharing in organizations, Malmö.
Kane, A.A.; Argote, L.; Levine, J.M. (2005): Knowledge transfer between groups via personnelrotation: Effects of social identity and knowledge quality, in: Organizational Behavior andHuman Decision Processes, Vol. 96, No. 1, pp. 56-71.
Kling, K.; Goteman, I. (2003): IKEA CEO Anders Dahlvig on international growth and IKEA’sunique corporate culture and brand identity Interview by Katarina Kling and Ingela Gote-man, in: Academy of Management Executive, Vol. 17, No. 1, pp. 31-37.
Kogut, B.; Zander, U. (1993): Knowledge of the firm and the evolutionary theory of the multina-tional corporation, in: Journal of International Business Studies, Vol. 24, No. 4, pp. 625-646.
Kumar, N. (2005): The global retail challenge, in: Business Strategy Review, Vol. 16, No. 1, pp.4-13.
48 European Retail Research, Vol. 24, Issue I, pp. 27-50
McGoldrick, P.J. (2002): Retail marketing. Berkshire.
Merriam, S. (1998): Qualitative research and case study applications in education, San Francisco.
Nohira, N.; Ghoshal, S. (1997): The differentiated network. San Francisco.
Özomer, A.; Gençtürk, E. (2003): A resource-based mode of market learning in the subsidiary:the capabilities of exploration and exploitation, in: Journal of International Marketing, Vol.11, No. 3, pp. 1-29.
Palmer, M. (2005): Retail multinational learning: a case study of Tesco, in: International Jour-nal of Retail & Distribution Management, Vol. 33, No. 1, pp. 23-48.
Palmer, M.; Quinn, B. (2005): An exploratory framework for analyzing international retaillearning, in: International Review of Retail, Distribution and ConsumerResearch, Vol. 69,No. 1, pp. 27-52.
Picot-Coupey, K. (2006): Determinants of international retail operation mode choice: Towardsa conceptual framework based on evidence from French specialised retail chains, in: TheInternational Review of Retail, Distribution and Consumer Research, Vol. 16, No. 2, pp.215-237.
Picot-Coupey, K. (2007): Examining retailers’ expansion mode choice in foreign markets: In-sights from/into internationalisation theories. Conference paper presented at the EAERCDconference in Saarbrucken, Germany.
Salzer, M. (1994): Identity across borders: a study in the “IKEA-world”. Linköping studies inmanagement and economics, No. 27, Linköping.
Sternquist, B. (1997): International expansion of US retailers, in: International Journal of Retailand Distribution Management, Vol. 25, No. 8-9, pp. 262-269.
Torekull, B. (2003): Historien om IKEA: Ingvar Kamprad berättar för Bertil Torekull, Stock-holm.
Tsai, W. (2000): Social capital, strategic relatedness and the formation of intraorganisationallinkages, in: Strategic Management Journal, Vol. 21, No. 9, pp. 925-939.
Tsoukas, H. (1989): The validity of idiographic research explanations, in: Academy of Manage-ment Review, Vol. 14, No. 4, pp. 551-561.
Vida, I.; Fairhurst, A. (1998): International expansion of retail firms: A theoretical approachfor future investigations, in: Journal of Retailing and Consumer Services, Vol. 5, No. 3,pp. 143-151.
Vida, I.; Fairhurst, A.; Reardon, J. (2000): Determinants of international retail involvement:the case of large U.S. retail chains, in: Journal of International Marketing, Vol. 8, No. 4, pp.37-61.
Walczak, S. (2005): Organizational knowledge management structure, in: The Learning Orga-nization, Vol. 12, No. 4, pp. 330-339.
Winter, S.G.; Szulanski, G. (2001): Replication as strategy, in: Organization Science, Vol. 12,No. 6, pp. 730-743.
Wrigley, N.; Currah, A. (2006): Globalizing retail and the ‘new e-conomy’: The organizationalchallenge of e-commerce for the retail TNCs, in: Geoforum, Vol. 37, No. 3, pp. 340-351.
Yin, R.K. (2003): Case study research : design and methods, 3rd ed., Thousand Oaks.
Jonsson, A. 49

Trade Credit Periods in Retail Commerce for Productsof Mass Consumption: An Application to Spanish Legislation
Javier Oubiña, Jaime Romero and María Jesús Yagüe
AbstractTrade credit periods from providers constitute a key indicator of the market power of large retailgroups in distribution channels. The current study uses a database of financial statements ofretail and production firms to demonstrate that the legal measures established at the Europeanlevel in general, and specifically in Spain, to fight delinquency in commercial operations arehaving an appreciable effect on reducing payment periods for retail firms. On the other hand, ananalysis of trade credit periods at the level of manufacturers enables us to confirm that manu-facturers also postpone a substantial part of their payment to their respective suppliers of rawmaterials. Finally, we propose an explanatory model for trade credit periods in retail firms that,once contrasted, enables us to conclude that the explanations for trade credit periods should befound in the market power, efficiency and level of indebtedness of the retail firms.
KeywordsTrade Credit, Payment Period, Manufacturer-Retailer Relationship, Market Power, DistributionChannel
Acknowledgements: This study received support from project ECO2008-00488 of the SpanishMinistry of Science and Innovation and from the agreement signed between the SECRETARYOF STATE OF TOURISM AND COMMERCE of the Ministry of Tourism and Commerce andthe Autonoma University of Madrid to analyze the trade credit periods in retail commerce forproducts of mass consumption.
Javier Oubiña (corresponding author)Departamento de Financiación e Investigación Comercial, Universidad Autónoma de Madrid, Madrid,Spain(Tel: ++34 914973551; E-mail: [email protected]).
Jaime RomeroDepartamento de Financiación e Investigación Comercial, Universidad Autónoma de Madrid, Madrid,Spain.
María Jesús YagüeDepartamento de Financiación e Investigación Comercial, Universidad Autónoma de Madrid, Madrid,Spain.
Received: August 31, 2009Revised: January 31, 2010Accepted: February 1, 2010
EUROPEAN
RETAIL
RESEARCHVol. 24, Issue I, 2010, pp. 51-70
1. Introduction and Objectives
“Commercial credit”, that is, credit that firms provide amongst themselves, is the first form of
extended credit that appears as society develops. For example, the manufacturer who provides
the distributor with specific merchandise enables him or her to defer payment until the distrib-
utor has resold the merchandise and received payment from the end consumers (Petersen/Rajan
1997; Alfaro 2005). At present, this is one of the most problematic issues of manufacturer-
distributor relations, as it is one of the key elements demonstrating the market power of large
retail groups in distribution channels (Cruz et al. 1997; Sheu/Hu 2009).
The concern shown by the main associations and groups that represent European manufacturers
indicates the importance of this topic, as do the legal initiatives that government bodies in each
of the European Union member countries have undertaken. The European Economic and Social
Committee takes this market power approach when it makes the claim that long-term payments
often stem from the abuse of a dominant position and that reducing payment deadlines must be
an economic policy objective (EESC 1998; Iglesias et al. 2007). In Spain, specifically, Law
3/2004 of December 29, which went into effect January 1, 2005, introduces legal regulations to
limit the excessive use of this kind of commercial practice.
This article is a practice and conceptually based article that will use a series of simple research
methodologies to answer the main questions that should be considered in the study of trade
credit periods granted by providers in the distribution channels. The main objective is to con-
firm the effect of European governments’ legislative measures to combat excessive numbers of
days of trade credit in commercial operations. We will take as our reference the impact of the
Spanish law cited above, which establishes measures to fight delinquency in commercial oper-
ations. The law fixes maximum limits for trade credit periods at 30 days for fresh or perishable
products and 60 days for canned goods and non-food mass consumption goods.
A full study of trade credit periods in the value chain of mass consumption products requires
complementing information on retail firms’ deferrals of payment with data on the number of
days that manufacturers of products of mass consumption in turn postpone paying their raw
materials suppliers. In this way, we hope to identify the proportion of the financing cost of the
commercialization process that each agent in the channel assumes until the products are in the
hands of the end consumers. The second goal of this study is thus to quantify the manufactur-
ers’ deferments to their respective providers.
Finally, we cannot conclude this study without addressing the causes for trade credit periods
among retail firms. We therefore propose an explanatory model based on the main theoretical
focuses that have been contrasted empirically in different economic contexts. In the model, we
incorporate different independent variables that reflect financial, competitive, and marketing
arguments to explain the differences in entrepreneurial behavior observed among the main
52 European Retail Research, Vol. 24, Issue I, pp. 51-70
firms in the sector. The information on these variables comes fundamentally from the structure
of their results accounts and balance sheets. We attempt to identify the main factors and their
effect on the different periods of trade credit that retail firms establish in their commercial
transactions with their providers.
Thus, in this study we apply a twofold methodology. On the one hand we provide a descriptive
analysis of the evolution of trade credit periods for both manufacturers and retailers. On the oth-
er hand we develop a regression model that aims to identify the drivers of trade credit period
length.
2. Literature Review
Distribution in Europe has undergone an especially intense and rapid process of modernization,
changing in three decades from a distribution-based model of traditional commerce to the
implementation of modern hypermarket and supermarket chains. This consolidation of mass
distribution involved considerable increases in concentration levels in the retail step of distribu-
tion channels (Casares/Rebollo 2004).
The first efforts to systematize knowledge of the distribution channels were based on the analy-
sis of the functions to be performed by commercial distribution (Alderson 1954) and analysis of
the efficiency of their execution (Bucklin 1965). This “economicist” perspective was followed
by considerations of the distribution channel’s socio-political aspects (Stern/Reve 1980). This
second perspective considered that issues related to market environment and connections
between firms in the commercial process have components and repercussions that go beyond
the strictly economic aspects of commercial transactions. However, “socio-political” and “eco-
nomic” aspects are without doubt closely related to each other, as the exercise of market power
by the party with a strong negotiating position is revealed in a series of economic concessions
granted in one form or another by the party in a weaker position.
Specifically, one of the most common ways that large retail groups show market power in dis-
tribution channels is the achievement of longer payment periods, through which these retail
groups carry out a financial leveraging strategy to take advantage of the “cash flow” generated.
If applied without proper financial analysis, this dynamic can considerably increase the risk of
insolvency and ultimately the firm’s vulnerability if the guarantees that the financing itself pro-
vides decrease substantially.
In the debate on trade credit periods from producers to distributors, it is usually argued that pay-
ment periods cannot be classified as “correct” or “excessive” when they emerge from the rules
of the market itself. According to this view, agreements between the parties should determine
the contract conditions, one of which is payment period. The principle of freedom of contract
Oubiña, J.; Romero, J.; Yagüe, M.J. 53
cannot be considered to have absolute validity, but only to be valid within a specific kind of
environment. The principle of mercantile relations states that payment should be made when the
transacted product is delivered, while admitting the possibility that the parties negotiate pay-
ment deferrals by mutual agreement in recognition of the need to finance the existing merchan-
dise for the duration of the commercialization process.
It is on this basis that the contracting parties establish the relation that leads to sharing respon-
sibility for financing during the “maturation period” of the goods based on the average time of
sale of each product in the different phases of the commercialization process. If the payment
period exceeds the time of commercialization, it seems clear that this “denaturalizes” the eco-
nomic foundation of the trade credit period. The credit can then be seen either as a strictly
financial credit (at low cost) not motivated by the buying and selling of products, or as an
“excessive” deferral outside common commercial practice.
In Spanish markets, these “commercial practices” have traditionally been the well-known prac-
tices of cash payment at 30, 60 or 90 days, depending on the kind of product. The principle of
freedom of contract thus has a basis in the commercial practices that serve as common, tacit
pre-agreements whenever they appropriately include the different product maturation periods.
In principle, we can thus consider “excessive” a payment period that goes beyond these com-
mon commercial practices.
Based on the BACH database (Bank for the Accounts of Companies Harmonized) developed by
the Commission of the European Communities and distributed by the Second Directorate Gen-
eral of the European Commission, Román (2000) argues that during the 1990s, Spanish retail
commerce experienced a considerable difference between the period of payment to providers
and the customers’ payment. At the same time, there was a greater laxness in payment periods
in large firms relative to small and medium-sized enterprises. His results show that during this
period Spain was, after Italy, the European country with the longest trade credit periods from
providers, with periods considerably higher than in countries like France, Austria or Belgium.
The patterns reported by Román (2000) are still valid (see Figure 1). Mediterranean countries,
such as Italy, Portugal and Spain, have longer trade credit periods (around 80 days) than coun-
tries in Central Europe such as Austria, Germany, Finland and Belgium (around 40 days). This
is partly due to differences in the legal environment of these nations. The regulations in Central
Europe, which arise from Germanic Law, state that owning a good requires having previously
paid for it. This has encouraged low non-payment rates and the acceptance of low trade credit
periods. In contrast, the regulations in Mediterranean countries which come from Roman Law
don’t require prepayment in order to transfer the property of a good. This has provoked a per-
missive attitude towards non-payment and the incorporation of trade credit periods as an impor-
tant element in negotiations.
54 European Retail Research, Vol. 24, Issue I, pp. 51-70
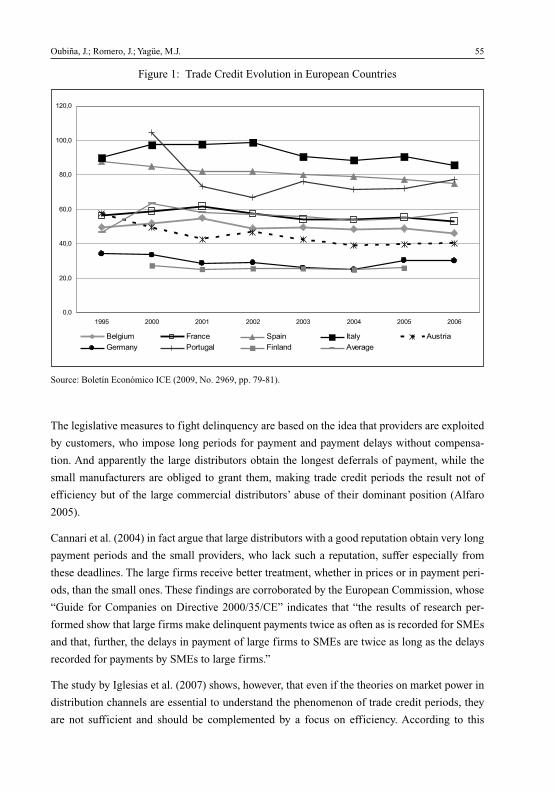
The legislative measures to fight delinquency are based on the idea that providers are exploited
by customers, who impose long periods for payment and payment delays without compensa-
tion. And apparently the large distributors obtain the longest deferrals of payment, while the
small manufacturers are obliged to grant them, making trade credit periods the result not of
efficiency but of the large commercial distributors’ abuse of their dominant position (Alfaro
2005).
Cannari et al. (2004) in fact argue that large distributors with a good reputation obtain very long
payment periods and the small providers, who lack such a reputation, suffer especially from
these deadlines. The large firms receive better treatment, whether in prices or in payment peri-
ods, than the small ones. These findings are corroborated by the European Commission, whose
“Guide for Companies on Directive 2000/35/CE” indicates that “the results of research per-
formed show that large firms make delinquent payments twice as often as is recorded for SMEs
and that, further, the delays in payment of large firms to SMEs are twice as long as the delays
recorded for payments by SMEs to large firms.”
The study by Iglesias et al. (2007) shows, however, that even if the theories on market power in
distribution channels are essential to understand the phenomenon of trade credit periods, they
are not sufficient and should be complemented by a focus on efficiency. According to this
Oubiña, J.; Romero, J.; Yagüe, M.J. 55
Figure 1: Trade Credit Evolution in European Countries
���
����
����
����
����
�����
�����
� ���� ���� ���� ���� ���� ��� ����
� ����� ����� ����� ����� �������
� ����� !������ ������" �# ���
Source: Boletín Económico ICE (2009, No. 2969, pp. 79-81).
study’s findings, some retailers use commercial credit as an instrument of protection against
potential opportunistic behavior on the part of the provider. Likewise, distributors who invest in
the provider’s brand image tend to obtain more commercial credit. Finally, distributors with
high degrees of flexibility benefit from financial efficiency without having to have a strong
negotiating position.
Cruz et al. (1997) argue that the greater the degree of entrepreneurial growth experienced by the
retail company, the greater the financing needs. We can thus expect that those retail organiza-
tions which are growing rapidly will focus their negotiating strategy on achieving longer trade
credit periods. The goal is to find ways to finance their assets without explicit cost, ways that
complement traditional sources of financing.
In addition to their own resources, retail firms can turn to essentially two kinds of outside
financing, one of these short- and the other long-term. In the case of retail businesses, the short-
term source is constituted fundamentally by financing from trade credits from providers, while
the second involves using creditors or credit entities that grant a financing period of longer than
one year. It is clear that the firms with a smaller proportion of long-term outside financing will
tend to turn more to commercial creditors in the short term.
3. Methodology: Database and Variables
To achieve the first goal proposed, we analyze the evolution of trade credit periods granted to
retail firms by providers in recent years. By doing this, we hope to verify and quantify the effect
of Law 3/2004, of December 29, which establishes measures to combat delinquency in com-
mercial operations. As three years have passed since the law went into effect, we have a long
enough time to make a sufficiently realistic and reliable evaluation of the influence of Law
3/2004 on trade credit periods from providers to retail firms.
The sample of retail firms to be studied is formed of retail organizations belonging to non-spe-
cialized commerce (Group 521 of the NCEA - National Classification of Economic Activities).
Our study focuses on the sector of products of mass consumption (primarily, fresh and canned
foods, personal hygiene and home cleaning products).
The study performed is based on analysis of the financial statements of these retail firms (prof-
it and loss accounts and balance sheets). The information comes from CABSA [1] (Centre for
Analysis of Balances), a firm that specializes in the creation and management of economic and
financial databases included in the financial statements of firms in Spain. Further, this study
includes complementary information provided by the DGPC (Directorate General for Commer-
cial Policy of the Ministry of Industry, Tourism and Commerce).
56 European Retail Research, Vol. 24, Issue I, pp. 51-70
We hope to achieve a fundamentally descriptive analysis whose keystone is the definition and
quantification of the concept of the trade credit period from providers under study. The indica-
tor for evaluation is “the number of days that firms on average postpone or defer payment to
their providers.” Taking two of the items included in the financial statements of the retail firms,
we construct a variable of trade credit period from providers (TCP) using formula (1), the for-
mula usually employed in studies of commercial credit:
TCP = Commercial creditors * 360/Sales costs (1)
Where:Commercial creditors are the items so-named included under the rubric of short-term creditorsof the liability of the balance,360 is the number of days in the year and,Sales costs: the item in the profit and loss statement.
The ratio above is used to calculate the trade credit period from providers for each individual
firm. The aggregate indicator, the object of interest in our study, is calculated by the weighted
sum of the individual ratios of trade credit periods for the billing percentage that each firm’s
sales represent with respect to the total sales in the sample analyzed.
The time period of the study includes the maximum number of years for which we have full
information on the sample analyzed, 1999-2007. The time period 1999-2007 represents a suffi-
ciently long period of time to observe the basic trend of trade credit periods from providers in
recent years and the effect of the legal measure introduced during this period to regulate com-
mercial delinquency.
The common sample is constituted of 99 retail firms for which we have complete information
from 1999-2007. We thus hope to minimize the presence of bias from the incorporation into the
study of factors not controlled for, such as variation in the number and characteristics of the
firms analyzed at different moments in time. In this way, differences in the results obtained can-
not be attributed in any case to changes in the sample. According to AC Nielsen the sales vol-
ume of the five largest retailers of consumer goods in Spain represent a market share of more
than a 60% in 2007. The 99 companies of our sample represent 38.97% of retail firms with
more than 49 employees and 83.52% of sales volume in Spain, thus ensuring that the sample is
representative.
Further, we establish a classification based on size, using business turnover as a variable to
measure size. We establish two groups of firms distinguished by whether their turnover in the
last year analyzed, 2007, is less than 300 million EUR (SMEs) or greater than or equal to that
figure (large firms). This segmentation of the sample seeks to confirm whether or not there are
significant differences in trade credit periods by providers between both groups that might be
attributable to differences in entrepreneurial size.
Oubiña, J.; Romero, J.; Yagüe, M.J. 57
The second goal of this study is to complement the study of the evolution of trade credit periods
for retail firms with a corresponding study of the evolution of trade credit periods by the manu-
facturers who supply those firms with products in order to identify what proportion of the cost of
financing the commercialization process each agent in the channel assumes for the products of
mass consumption before they reach the end consumer. The starting assumption of this analysis
is that the financial burden is distributed or shared among the members of the commercialization
channel. Contrary to this assumption, the manufacturers usually complain that they are victims
who bear exclusively the entire cost of financing the commercial process of these products.
The analysis is applied to a common sample of 319 producing firms belonging to the Grocery
and Beverage Industry (Group 15 of the NCEA), which includes the following subsectors:
Meat, Fish, Fruits and Vegetables, Greases and Oils, Dairy Products, Milled Products, Pet Food,
Other Grocery Products` and finally, Beverages. See Table 1. The economic-financial informa-
tion of the financial statements comes from the SABI database [2].
The study performed consists of analyzing the evolution of trade credit periods granted to
providers by the manufacturing firms belonging to the subsectors indicated since 2005, the year
in which Law 3/2004 against delinquency in commercial operations went into effect. To facili-
tate comparison, the TCP was calculated using the indicator applied to retail firms and Formula
(1).
58 European Retail Research, Vol. 24, Issue I, pp. 51-70
Table 1: Sample Characteristics of Manufacturers
���� ����� ��� ������������� ��������
��� ��������� ��� ��
��� ����������� ��
��� ��������� ���������� ��
��� ������ ��� ��� �
��� !���"�����#�� ��
�� $����� ����#�� �
��% ��� ���� ��
��� &���� �����" ����#�� %
��� '�������� ��
�� ����� ���������� �!��"��#��$� �� %�&
Source: Elaborated using information from SABI.
To create the aggregate indicator we weighted the trade credit period of the individual firms by
the percentage of each firm’s sales as compared with the total sales of the group considered.
The third goal of this study is to propose an explanatory model of trade credit periods granted
by providers.
To achieve this, we design a “cross-sectional” model applied to the last year, 2007, for which we
have the information necessary to calculate both the variable to be explained and the variables
representing the factors that influence the size of the TCP. Although the results obtained refer to
2007, we expect the significant factors explaining the phenomenon in one year to have a greater
temporal validity, as financial and commercial decision-makers do not modify their decision
rules with respect to the TCP in the short term.
The model’s construction is based on the theoretical focuses that have been the subject of rigor-
ous empirical contrast in different economic contexts (Cruz et al. 1997; Ng et al. 1999). Our
model incorporates different independent variables that reflect the competitive, financial and
marketing arguments supporting the factors that may potentially explain differences in entre-
preneurial behavior observed between the main firms in the sector.
Specifically, we see that the retail distributor’s market power acts as a key determinant of the
TCP. Schiller (2003), building on industrial organization models by Bain (1956) and Scherer
(1980) and the notion of extended rivalry by Porter (1979), proposes that market power refers to
the ability of a firm to alter the market price of goods or services without the fear of losing cus-
tomers to rival firms. This market power is often seen in the firm’s competitive position in terms
of market share or participation (Rhoades 1985), which translates into greater dependence on
manufacturers, who negotiate with these market-powerful retailers and are obligated to grant
them longer payment periods.
Another important indicator of market power is the gross margin [3] of the retail firm,
defined as the difference between the sales figures and the sales costs. This indicator has been
typically used as a proxy variable of market power in Industrial Economics. The relationship
between gross margins and market power is supported by classical models of imperfect oli-
gopolistic competition (Waterson 1980; Armstrong/Porter 2007). The purchase conditions are
affected by incentives in the form of discounts and rappels on the tariff prices established,
which exercise a decisive influence in increasing the gross margin. As these discounts are
usually associated with amounts purchased, they should be more substantial for larger retail
firms.
Efficiency is another of the important explanatory factors of TCP, as improvements in efficien-
cy should imply fewer financing needs and thus lower payment periods. A commonly used indi-
cator of efficiency is rotation, defined as the relation between sales and assets, or economic
profitability of assets, also understood as return on investment.
In contrast, we expect that financing needs will be greater if the retail company experiences a
higher degree of entrepreneurial growth. The indicators for measuring growth correspond to the
inter-annual rates of variation in activity, in terms both of assets and of sales.
Oubiña, J.; Romero, J.; Yagüe, M.J. 59
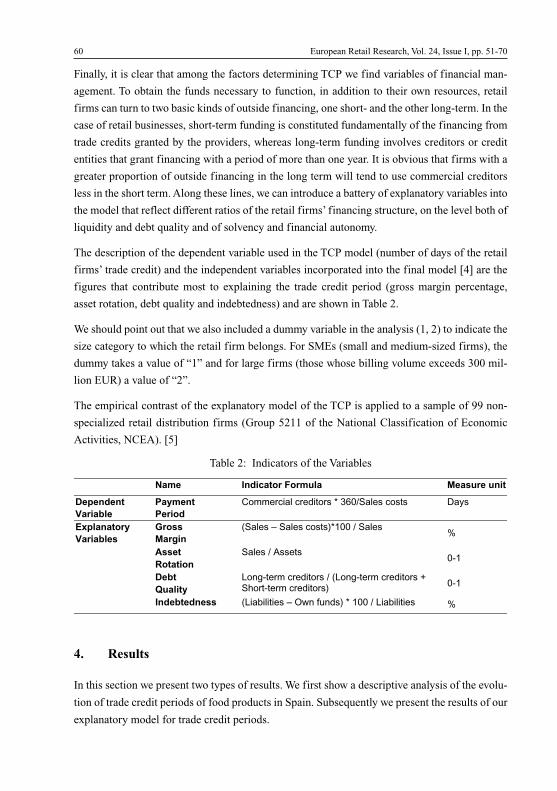
Finally, it is clear that among the factors determining TCP we find variables of financial man-
agement. To obtain the funds necessary to function, in addition to their own resources, retail
firms can turn to two basic kinds of outside financing, one short- and the other long-term. In the
case of retail businesses, short-term funding is constituted fundamentally of the financing from
trade credits granted by the providers, whereas long-term funding involves creditors or credit
entities that grant financing with a period of more than one year. It is obvious that firms with a
greater proportion of outside financing in the long term will tend to use commercial creditors
less in the short term. Along these lines, we can introduce a battery of explanatory variables into
the model that reflect different ratios of the retail firms’ financing structure, on the level both of
liquidity and debt quality and of solvency and financial autonomy.
The description of the dependent variable used in the TCP model (number of days of the retail
firms’ trade credit) and the independent variables incorporated into the final model [4] are the
figures that contribute most to explaining the trade credit period (gross margin percentage,
asset rotation, debt quality and indebtedness) and are shown in Table 2.
We should point out that we also included a dummy variable in the analysis (1, 2) to indicate the
size category to which the retail firm belongs. For SMEs (small and medium-sized firms), the
dummy takes a value of “1” and for large firms (those whose billing volume exceeds 300 mil-
lion EUR) a value of “2”.
The empirical contrast of the explanatory model of the TCP is applied to a sample of 99 non-
specialized retail distribution firms (Group 5211 of the National Classification of Economic
Activities, NCEA). [5]
60 European Retail Research, Vol. 24, Issue I, pp. 51-70
Table 2: Indicators of the Variables
Name Indicator Formula Measure unit
DependentVariable
PaymentPeriod
Commercial creditors * 360/Sales costs Days
GrossMargin
(Sales – Sales costs)*100 / Sales%
AssetRotation
Sales / Assets0-1
DebtQuality
Long-term creditors / (Long-term creditors +Short-term creditors) 0-1
ExplanatoryVariables
Indebtedness (Liabilities – Own funds) * 100 / Liabilities %
4. Results
In this section we present two types of results. We first show a descriptive analysis of the evolu-
tion of trade credit periods of food products in Spain. Subsequently we present the results of our
explanatory model for trade credit periods.
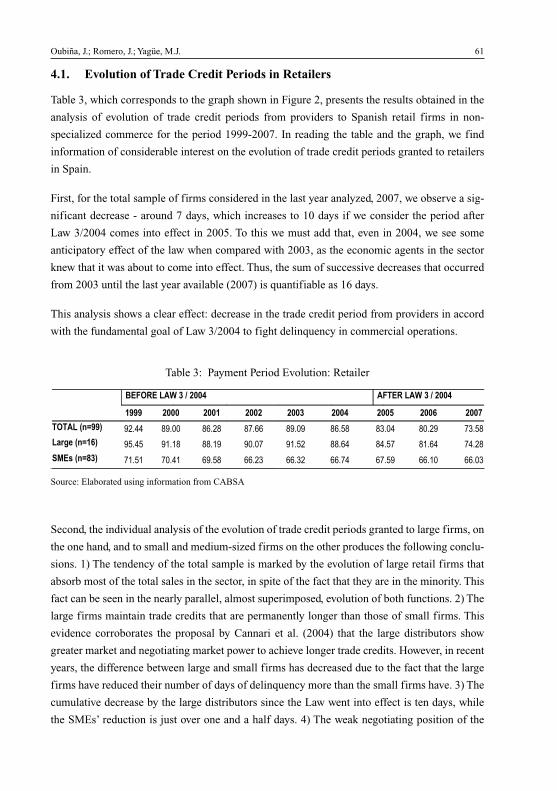
4.1. Evolution of Trade Credit Periods in Retailers
Table 3, which corresponds to the graph shown in Figure 2, presents the results obtained in the
analysis of evolution of trade credit periods from providers to Spanish retail firms in non-
specialized commerce for the period 1999-2007. In reading the table and the graph, we find
information of considerable interest on the evolution of trade credit periods granted to retailers
in Spain.
First, for the total sample of firms considered in the last year analyzed, 2007, we observe a sig-
nificant decrease - around 7 days, which increases to 10 days if we consider the period after
Law 3/2004 comes into effect in 2005. To this we must add that, even in 2004, we see some
anticipatory effect of the law when compared with 2003, as the economic agents in the sector
knew that it was about to come into effect. Thus, the sum of successive decreases that occurred
from 2003 until the last year available (2007) is quantifiable as 16 days.
This analysis shows a clear effect: decrease in the trade credit period from providers in accord
with the fundamental goal of Law 3/2004 to fight delinquency in commercial operations.
Oubiña, J.; Romero, J.; Yagüe, M.J. 61
Table 3: Payment Period Evolution: Retailer
������������� ��� ���� � ��� ���
���� ��� ��� �� ��� ��� ��� ��� ���
���� ������ ����� ����� ����� ���� ����� ���� ����� ����� ���
����� ������ ��� ����� ����� ���� ���� ����� ��� ����� ����
��� ����!�� ��� ���� ���� ����� ����� ���� ��� ����� �����
Source: Elaborated using information from CABSA
Second, the individual analysis of the evolution of trade credit periods granted to large firms, on
the one hand, and to small and medium-sized firms on the other produces the following conclu-
sions. 1) The tendency of the total sample is marked by the evolution of large retail firms that
absorb most of the total sales in the sector, in spite of the fact that they are in the minority. This
fact can be seen in the nearly parallel, almost superimposed, evolution of both functions. 2) The
large firms maintain trade credits that are permanently longer than those of small firms. This
evidence corroborates the proposal by Cannari et al. (2004) that the large distributors show
greater market and negotiating market power to achieve longer trade credits. However, in recent
years, the difference between large and small firms has decreased due to the fact that the large
firms have reduced their number of days of delinquency more than the small firms have. 3) The
cumulative decrease by the large distributors since the Law went into effect is ten days, while
the SMEs’ reduction is just over one and a half days. 4) The weak negotiating position of the
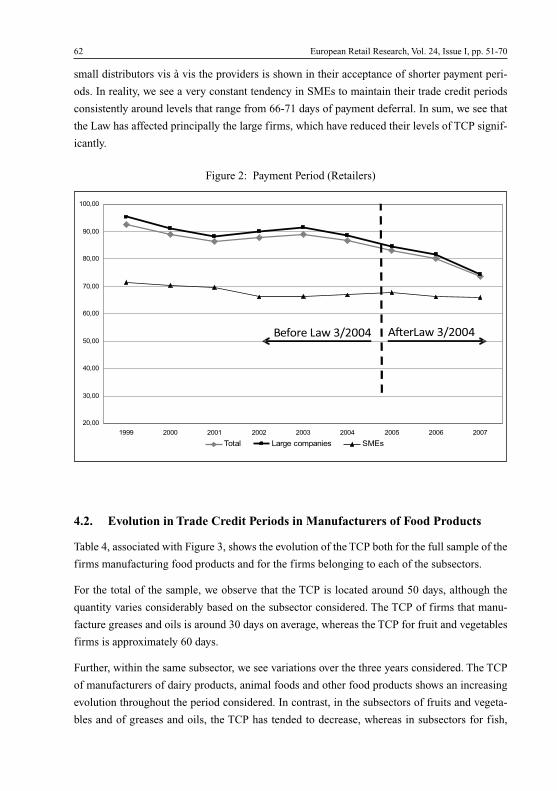
small distributors vis à vis the providers is shown in their acceptance of shorter payment peri-
ods. In reality, we see a very constant tendency in SMEs to maintain their trade credit periods
consistently around levels that range from 66-71 days of payment deferral. In sum, we see that
the Law has affected principally the large firms, which have reduced their levels of TCP signif-
icantly.
62 European Retail Research, Vol. 24, Issue I, pp. 51-70
Figure 2: Payment Period (Retailers)
�����
�����
�����
�����
�����
����
����
�����
������
���� ���� ���� ���� ���� ���� ���� ���� ���
���� ��������������� ����
������ �� �� � ���������� �
4.2. Evolution in Trade Credit Periods in Manufacturers of Food Products
Table 4, associated with Figure 3, shows the evolution of the TCP both for the full sample of the
firms manufacturing food products and for the firms belonging to each of the subsectors.
For the total of the sample, we observe that the TCP is located around 50 days, although the
quantity varies considerably based on the subsector considered. The TCP of firms that manu-
facture greases and oils is around 30 days on average, whereas the TCP for fruit and vegetables
firms is approximately 60 days.
Further, within the same subsector, we see variations over the three years considered. The TCP
of manufacturers of dairy products, animal foods and other food products shows an increasing
evolution throughout the period considered. In contrast, in the subsectors of fruits and vegeta-
bles and of greases and oils, the TCP has tended to decrease, whereas in subsectors for fish,
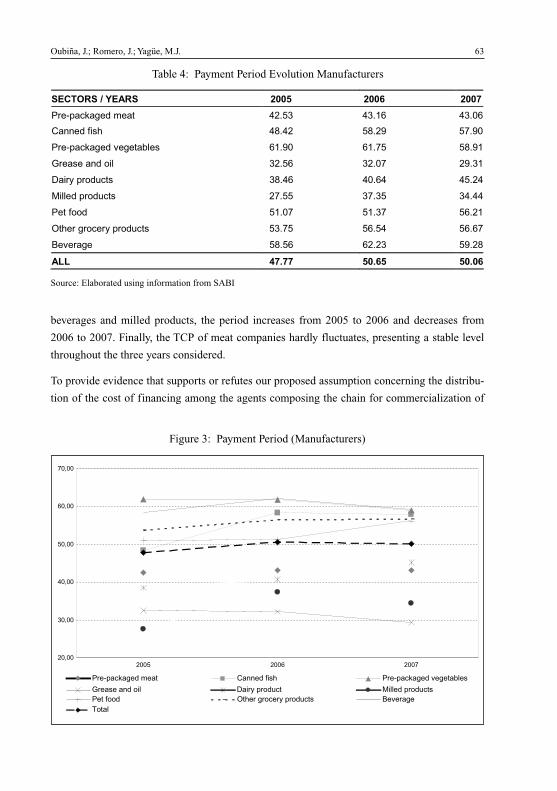
beverages and milled products, the period increases from 2005 to 2006 and decreases from
2006 to 2007. Finally, the TCP of meat companies hardly fluctuates, presenting a stable level
throughout the three years considered.
To provide evidence that supports or refutes our proposed assumption concerning the distribu-
tion of the cost of financing among the agents composing the chain for commercialization of
Oubiña, J.; Romero, J.; Yagüe, M.J. 63
Table 4: Payment Period Evolution Manufacturers
������� ����� � � � � � �
���������� ��� ����� ����� �����
������ ���� ����� ����� �����
���������� ��� � !�� ����� ����� �����
"����� ���#$�! ����� ����� �����
%���& ��$�'� � ����� ����� �����
(�!!�� ��$�'� � ����� ����� �����
�� �$$� ����� ����� �����
) ���#�$���&#��$�'� � ����� ����� �����
*������ ����� ����� �����
��� ����� � ��� � � �
Source: Elaborated using information from SABI
Figure 3: Payment Period (Manufacturers)
�����
�����
�����
�����
�����
����
���� ���� ���
�� ������������� ����������� �� �������������������
����������!�� "���#���!�$�� %��������!�$���
����!!� &���� ��!���# ��!�$��� '�������
(!���
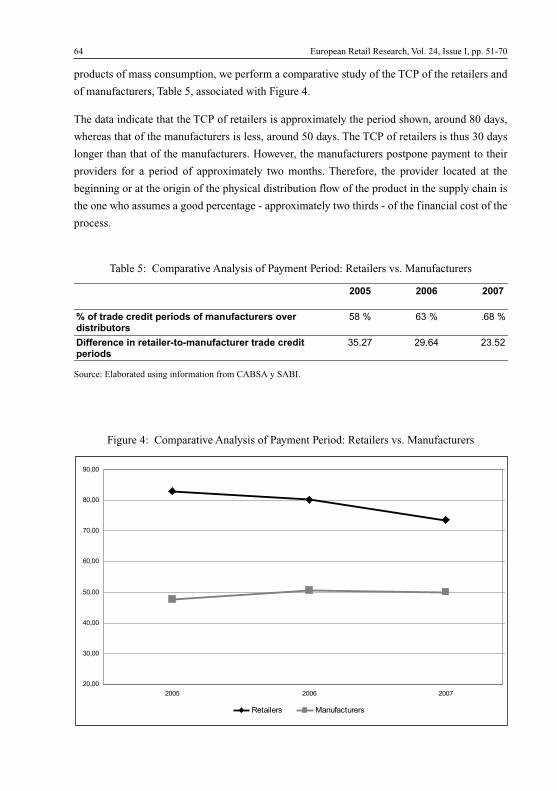
products of mass consumption, we perform a comparative study of the TCP of the retailers and
of manufacturers, Table 5, associated with Figure 4.
The data indicate that the TCP of retailers is approximately the period shown, around 80 days,
whereas that of the manufacturers is less, around 50 days. The TCP of retailers is thus 30 days
longer than that of the manufacturers. However, the manufacturers postpone payment to their
providers for a period of approximately two months. Therefore, the provider located at the
beginning or at the origin of the physical distribution flow of the product in the supply chain is
the one who assumes a good percentage - approximately two thirds - of the financial cost of the
process.
64 European Retail Research, Vol. 24, Issue I, pp. 51-70
Table 5: Comparative Analysis of Payment Period: Retailers vs. Manufacturers
Figure 4: Comparative Analysis of Payment Period: Retailers vs. Manufacturers
2005 2006 2007
% of trade credit periods of manufacturers overdistributors
58 % 63 % .68 %
Difference in retailer-to-manufacturer trade creditperiods
35.27 29.64 23.52
Source: Elaborated using information from CABSA y SABI.
�����
�����
�����
�����
�����
����
����
�����
���� ���� ���
� ���� �� ���������� ��
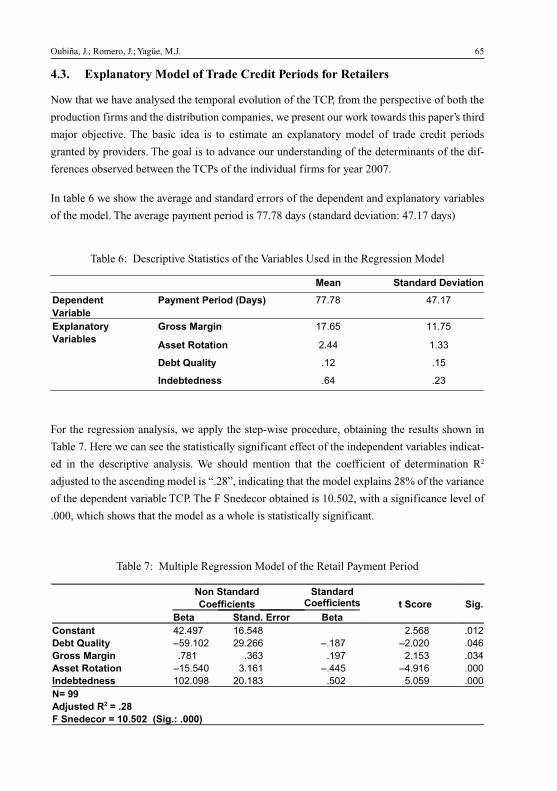
4.3. Explanatory Model of Trade Credit Periods for Retailers
Now that we have analysed the temporal evolution of the TCP, from the perspective of both the
production firms and the distribution companies, we present our work towards this paper’s third
major objective. The basic idea is to estimate an explanatory model of trade credit periods
granted by providers. The goal is to advance our understanding of the determinants of the dif-
ferences observed between the TCPs of the individual firms for year 2007.
In table 6 we show the average and standard errors of the dependent and explanatory variables
of the model. The average payment period is 77.78 days (standard deviation: 47.17 days)
Oubiña, J.; Romero, J.; Yagüe, M.J. 65
Table 6: Descriptive Statistics of the Variables Used in the Regression Model
Mean Standard Deviation
DependentVariable
Payment Period (Days) 77.78 47.17
Gross Margin 17.65 11.75
Asset Rotation 2.44 1.33
Debt Quality .12 .15
ExplanatoryVariables
Indebtedness .64 .23
Table 7: Multiple Regression Model of the Retail Payment Period
���������
��� �������
�������� ������� ������ ����
���� �������� ����
�������� ������ ���� ��� ����
������������ ������ ������ ���� ������ ����
���� ����� ��� � � ���� ��� �� �
����� �������� ����� ���� ���� ������ ����
���������� ������ ���� ��� ��� ����
� �!!
�"���� �#� ��#$
% ������ &'�('# �)����* �'''+
For the regression analysis, we apply the step-wise procedure, obtaining the results shown in
Table 7. Here we can see the statistically significant effect of the independent variables indicat-
ed in the descriptive analysis. We should mention that the coefficient of determination R2
adjusted to the ascending model is “.28”, indicating that the model explains 28% of the variance
of the dependent variable TCP. The F Snedecor obtained is 10.502, with a significance level of
.000, which shows that the model as a whole is statistically significant.
The results show that, in agreement with the hypotheses derived from our theoretical review,
retail firms’ market power and their degree of efficiency show a statistically significant influ-
ence on trade credit periods granted by providers. Indeed, the results show that the retailers with
efficient asset management measured as the quotient of sales volume over total assets (both
fixed and current) postpone payment to manufacturers less, whereas a lower level of rotation
means that the retailers must resort to greater financial leveraging to compensate for the mini-
mal productivity of their assets.
In contrast, the retailers who have greater market power, expressed in higher gross margins due
to their negotiating market power, achieve longer deferrals. And the debt quality measured as
the relation between long-term creditors and total outside funds (both long- and short-term)
helps those firms with more long-term financing not to have to resort to the financing granted
by commercial creditors in the short term.
The results show that the fundamental explanatory factor of trade credit periods granted by
providers, as well as the above-mentioned efficiency evaluated in terms of rotation, is based on
the financial policy of the retail firms, specifically in their indebtedness policy. The degree of
indebtedness was measured through the relation between outside funds and liabilities. That
indebtedness takes a positive sign in the model shows that firms with fewer of their own
resources which are therefore in greater need of outside funding achieve this funding, among
other formulas, through the financing included in trade credit granted by providers.
4.5. Managerial Implications
Some managerial implications arise from our analyses, particularly for retailers and manufac-
turers of consumer goods. First, companies do not negotiate trade credit periods without taking
into account their financial situation. By contrast, even having the same profitability and/or
growth objectives, the importance of trade credit periods of retailers varies according to their
efficiency and market power. Thus, retailers with a high monopolistic power will probably con-
sider enlarging trade credit periods as a way of reaching their objectives. On the other hand, an
efficient retailer - with a business model based upon high rotation rates - will prefer reducing its
supplying costs in exchange for accepting shorter trade credit periods. Similarly, retailers with
a different financial structure will have a different attitude toward the employment of trade
credit periods as a financial instrument.
As a consequence, retailers that use trade credit periods for obtaining financial resources at a
low cost as an alternative to long term indebtedness in order to pay for the growth of their fixed
assets are assuming a high level of risk.
66 European Retail Research, Vol. 24, Issue I, pp. 51-70
Manufacturers that need to sell their products through large retail chains (due to their size or
other economic reasons) must foresee that they are going to be obligated to accept very long
trade credit periods. They must find mechanisms to compensate for the financial cost of these
credit periods. These mechanisms include: 1) increasing their prices (adequate for owners of
strong brands), 2) neutralize the increase in financial costs by lowering manufacturing costs
(appropriate for cost leader companies, usually very large firms) or 3) increase trade credit peri-
ods for their inputs suppliers. Similarly, manufacturers should deeply analyse the economic
efficiency and the liabilities of the retailers they have to negotiate with, in order to check
whether the distributors really need to postpone payments.
Finally, our study also provides some insights for policy makers. In particular, our analysis
makes clear that the identification of the links between the financial structure of retailers and
their competitive patterns are very strong. Policy makers must take into account these links in
order to set off control systems that allow anticipating when companies might stop paying their
debts.
6. Conclusions, Limitations and Future Lines of Research
Performing this study has enabled us to confirm that the legislative measures to combat delin-
quency in commercial operations have been having a considerable and continuous effect since
the law went into effect in 2005. This effect began as an anticipated influence in 2004, produc-
ing a decrease in the trade credit period as compared to 2003. The credit continued to decrease
in the first two years that the law was in effect (2005 and 2006), with a marked downward trend
in the length of trade credit from providers to retail firms. This trend has been confirmed and
consolidated in the last available set of statistics from 2007, the year in which the reduction of
days that these firms postponed their payments was especially significant.
The results obtained also show that larger retail firms always have longer trade credits than
small firms in the period analyzed. This difference in the deferral between large and small-to-
medium sized firms may be attributed in principle to the negotiating market power that larger
distribution companies have in their transactions with production firms.
On the other hand, the analysis performed of the TCP enables us to confirm that the average
length of trade credit period from providers varies considerably based on the subsector consid-
ered. Therefore, we observe that not only do distributors delay payment to manufacturers, but
manufacturers also defer payment to a lesser but not insignificant extent (especially in some
subsectors) to their providers of raw materials. These initial agents in the value chain assume to
a large extent, and in many cases the greatest part, of the financing cost for the production and
commercialization process of the products of mass consumption.
Oubiña, J.; Romero, J.; Yagüe, M.J. 67
To this we must add that, while the trade credit period of retail firms has declined consistently
in recent years, the same trend does not occur in the case of manufacturing companies, which
have tended to experience moderate growth or even remain stable in the last period.
If we look for explanations for the extent of the trade credit period granted by providers, we find
the cause to lie fundamentally in the strength of the negotiating position that comes with market
power as well as in the firm’s capability to manage their retail business efficiently. Indeed, the
regression analysis shows that the retail firms which defer payment most are those with the
highest gross margins and the greatest asset rotation.
This shows that the market-powerful retailers demonstrate their influence by, among other
ways, obtaining longer trade credit periods. This enables them to easily reorganize and improve
their profit and loss statements through effective management of the greater level of cash flow
that they enjoy. On the other hand, there is less financial need in firms that manage their retail
businesses efficiently, thereby decreasing the days of trade credit granted by providers.
Although important, these two explanatory factors have less influence on the TCP than the two
financial ratios: degree of indebtedness and debt quality. The former shows that the most
indebted retail firms defer their payments longer, as part of this debt comes precisely from the
short-term debt contracted with the commercial creditors. The second ratio shows that retail
firms which obtain better long-term financing, associated with a better quality of debt contract-
ed, do not have as great a need for the financing granted by their providers of goods.
We must take into account that this study has a general and descriptive focus, as it is based on
data from the profit and loss statements of the retail firms. This limitation in the sources of
information has prevented us from incorporating into the analysis a series of explanatory fac-
tors used in other studies mentioned in the literature review as conditioners of the period of
commercial credit. These are variables such as the length of the manufacturer-distributor rela-
tionship, the provider’s control over variables of its product marketing at the point of sale, by
belonging to a purchase centre, and opportunistic behavior by the provider. In a future study, it
would be interesting to obtain and introduce this set of variables.
It would also be interesting to develop an explanatory model of trade credit periods for manu-
facturers. This would allow testing whether the drivers of trade credit periods are the same as
for retailers, thus generalizing our model’s results. Not reaching similar results would indicate
that the model should be adapted to each type of company.
In any case, the debate over whether the legal regulation of trade credit periods is appropriate
remains unresolved. It is perhaps important to remember that the key to combating delinquency
lies not only in the passing of laws but also, as Brachfield (2006) indicates, in improving Span-
ish and European retail firms’ payment behavior through an ethical code that ensures self-regu-
lation of payment periods.
68 European Retail Research, Vol. 24, Issue I, pp. 51-70
Notes
[1] The authors wish to thank CABSA (Central de Análisis de Balances) for its collaboration inproviding without restrictions the information on the financial statements of the firms weanalyzed.
[2] Free access to SABI is available through the web server of Autonoma University of MadridLibrary.
[3] Gross margin can be considered as the operational variable of the theoretical conceptunderlying in Lerner’s index, which is an indicator of monopolistic power.
[4] This explanatory analysis was performed using Minimum Least squares in stages until wedetermined the indicators that best explained the differences in the TCPs observed.
[5] These 99 firms were obtained after filtering out cases that were either missing data forsome variables or that include observati ons that they are not strictly retail firms.
References
Alderson, W. (1954): Factors governing the development of marketing channels, in: Mallen, B.(ed.): The Marketing Channels: a conceptual viewpoint, New York.
Alfaro, J. (2005): La nueva regulación del crédito comercial: una lectura crítica de la Directivay de ley contra la morosidad, in: Revista para el análisis del Derecho, No. 3, July, pp. 2-26.
Armstrong, M.; Porter, R. (2007): Handbook of Industrial Organization Series, Vol. 3, NorthHolland.
Bain, J. (1956): Barriers to New Competition, Cambridge, MA.
Brachfield, P. J. (2006): El aplazamiento de pago como fuente de financiación. Quince princip-ios de buen comportamiento, in: Estrategia Financiera, January, XXII (224), pp. 24-29.
Bucklin, L. P. (1965): Postponement, speculation and the structure of distribution channels, in:Journal of Marketing Research, Vol. 2, February, pp. 26-32.
Cannari, L.; Chiri, S.; Omiccioli, M. (2004): Condizioni di credito comerciale e differenziazionedella clientela, documento de trabajo, Banca de Italia, no. 495, http:// www.repec.org,accessed December, 2004.
Casares, J.; Rebollo, A. (2004): Distribución Comercial, Madrid.
Cruz, I.; Fernández, A.; Rebollo A. (1997): Estrategia de aplazamiento de pago en las empresasespañolas de distribución de alimentación. Perspectivas del Sistema Financiero. Monographon “Actividades financieras en la distribución comercial”, in: Perspectivas del SistemaFinanciero No. 57, pp. 45-57.
EESC European Economic and Social Committee (1998). Opinion of the economic and socialcommittee on the ‘Proposal for a European parliament and council directive combating latepayment in commercial transactions’, in: Official Journal of the European Communities(28.12.98), C407/50-55.
Iglesias, V.; Vázquez, R.; Rodríguez del Bosque, I. (2007): Intra-brand differences in paymentperiods in marketing channels, in: International Journal of Research in Marketing, Vol. 24,No. 1, pp. 49-63.
Oubiña, J.; Romero, J.; Yagüe, M.J. 69
Ng, C. K.; Smith, J. K.; Smith, R. L. (1999): Evidence on the determinants of credit terms usedin interfirm trade, in: Journal of Finance, Vol. 54, No. 3, pp. 1019-1029.
Petersen, M. A.; Rajan R. G. (1997): Trade credit: theories and evidence, in: Review of Finan-cial Studies, Vol. 10, No. 3, pp. 661-691.
Porter, M. E. (1979): How competitive forces shape strategy, in: Harvard Business Review,Vol. 57, No. 2, pp. 127-136.
Rhoades, S. A. (1985): Market share as a source of market market power: implications andsome evidence, in: Journal of Economics & Business, Vol. 37, No. 4, pp. 343-364.
Román, M. V. (2000): Situación del aplazamiento de pago en España: un análisis comparativoen el ámbito europeo, in: Boletín ICE Económico: Información Comercial Española,No. 2645, pp. 25-34.
Scherer, F. M. (1980): Industrial Market Structure and Economic Performance, Chicago.
Sheu, J. B.; Hu T. L. (2009): Channel market power, commitment and performance towardsustainable channel relationship, in: Industrial Marketing Management, Vol. 38, No. 1,pp. 17-31.
Schiller, B. (2003): The Economy Today, 9th ed., New York.
Stern, L. W.; Reve. T. (1980): Distribution channels as political economies: a framework forcomparative analysis, in: Journal of Marketing, Vol. 44, No. 3, pp. 52-64.
Waterson, M. (1980): Price-cost margins and successive market market power, in: QuarterlyJournal of Economics, Vol. 94, No. 1, pp. 135-150.
70 European Retail Research, Vol. 24, Issue I, pp. 51-70
Customer Satisfaction with Loyalty Card Programsin the Austrian Clothing Retail Sector -an Empirical Study of Performance Attributes Using Kano’s Theory
Eva Walter, Claudia Steyrer and Stefan Wiesel
AbstractThe popularity of relationship marketing has increasingly grown in the past couple of decades.Retailers recognize that satisfying and retaining consumers by building relationships is one ofthe most sustainable competitive advantages. Although the use of loyalty cards is popular inretailing, a lot of customer loyalty programs are virtually interchangeable, lacking in attractive-ness and differentiation. Therefore, it is important to identify the determinants of customer sat-isfaction relating to these programs. Does aiming for customer satisfaction mean understandingand anticipating what customers want from a loyalty card program? A Kano model of customersatisfaction is investigated; and “attractive”, “must-be”, “one-dimensional” and “indifferent”requirements are identified based on a sample of 300 customers.
KeywordsCustomer Satisfaction, Loyalty Card Programs, Kano Theory
Eva Walter (corresponding author)Department of Marketing, Institute for Retailing and Marketing, WU Vienna University of Economicsand Business, Vienna, Austria(Tel: +43 1 31336 4622; E-mail: [email protected]).
Claudia SteyrerDepartment of Marketing, Institute for Retailing and Marketing, WU Vienna University of Economicsand Business, Vienna, Austria.
Stefan WieselDepartment of Marketing, Institute for Retailing and Marketing, WU Vienna University of Economicsand Business, Vienna, Austria.
Received: December 4, 2009Revised: April 22, 2010Accepted: April 26, 2010
EUROPEAN
RETAIL
RESEARCHVol. 24, Issue I, 2010, pp. 71-96

1. Introduction
Around the world retail competition in consumer markets continues to intensify and retailers as
well as marketers are seeking strategies for maintaining both the interest and loyalty of their
customers. Therefore, relationship marketing has grown in popularity during the past decades
and the implementation of relationship marketing programs is steadily increasing (Noble/
Phillips 2004, p. 290). Today, retailers recognize that satisfying and retaining consumers by
using relationship building activities is one of the most promising forms of sustainable compet-
itive advantage. Although loyalty cannot be taken as a direct proxy for profitability, numerous
theoretical and empirical studies have found that customers generate increasingly more profits
for each year they buy from and continue to trust the company (Meffert 2008, p. 160; Noble/
Philips 2004, p. 290; Reinartz/Kumar 2000, p. 28).
In retail practice it is very common to use card-based programs for loyalty enhancement strate-
gies. Such programs involve the issuance of specially coded cards or other special scanner-read-
able cards, which can then be used at the checkout with the objective of increasing customer
propensity. The customer can derive several benefits from the usage of loyalty cards like per-
centage/price reductions, special offers, gift-packaging-service, their own parking area or addi-
tional information (Allaway et al. 2006, p. 1318). After growing by 25 to 30 percent a year
during the 1990s, loyalty cards are now commonplace in European retailing. In some markets,
the penetration has approached saturation, while in others it is still advancing at a steady pace
(Ziliani/Bellini 2004, p. 282f.). In Austria, loyalty card programs are among to the most popu-
lar relationship-building activities (Seebacher 2007, p. 78).
Nonetheless, a lot of customer loyalty card programs are virtually interchangeable and con-
sumers do not use them (Hoffmann/Naß 2007, p. 6). There are many different reasons why con-
sumers do not want to engage in a relationship with the retailer. Often consumers do not feel
that the benefits offered by retailers are sufficient or of interest for them (Noble/Philips 2004,
p. 300). Furthermore, there is also a lack of attractiveness and differentiation (Tomczak et al.
2008, p. 325).
Consequently, it is important to identify the determinants of customer satisfaction with loyalty
programs to offer suitable benefits to the customers. Aiming for customer satisfaction means
understanding and anticipating what customers want from a loyalty card program, which per-
formance attributes generate positive response and have the ability to surprise the customer.
Which benefits can be offered to obtain a high level of customer satisfaction, which features
have a disproportional influence on satisfaction, and which attributes are essential to the cus-
tomer? Based on the Kano model of customer satisfaction, the purpose of this study is to ana-
lyze different performance attributes and to identify the most influencing factors on customer
satisfaction.
72 European Retail Research, Vol. 24, Issue I, pp. 71-96
The remainder of this paper is organized into four parts. The following section (section 2) pro-
vides a literature review and the description of the Kano model of customer satisfaction. In the
third section the conceptual framework and the derived hypotheses are reported. The fourth
presents the construction of the Kano questionnaire, the empirical study and the steps of data
analysis. Finally, the results are discussed and we explore limitations and some implications for
future research.
2. Theoretical Background
In modern management theory, customer satisfaction is considered one of the most important
drivers of long-term business success. This shift in strategic thinking is based on the assumption
that customer satisfaction is one of the most powerful indicators for a company’s future, as a
high level of customer satisfaction leads to a high level of customer loyalty. Numerous theoret-
ical and empirical studies discuss the positive effects of customer satisfaction (Bolton 1998;
Homburg/Bucerius 2006, p. 93; Mittal/Kamakura 2001). Albeit nonlinear, higher satisfaction
nevertheless increases customer loyalty and ensures a lasting cash flow. Satisfied customers
are, furthermore, less price sensitive and more inclined to spend more on tried and tested prod-
ucts (Homburg et al. 2005, p. 94; Yu/Dean 2001, p. 247). Stable business relations have other
advantages: the positive image reduces the costs of attracting new customers, and the high
level of customer loyalty lowers transaction costs for existing customers (Matzler et al. 2009a,
p. 9). As a consequence, practitioners need to understand how satisfaction is engendered, how it
can be influenced, which features have a more than proportional influence on satisfaction and
which attributes are an absolute must in the eyes of the customer.
So far, the literature on customer satisfaction is characterized by the predominance of one-
dimensional models (Anderson/Mittal 2000, p. 108). The best known framework for satisfac-
tion studies is probably the expectation disconfirmation paradigm. It proposes that customers
maintain a standard of reference to which they compare perceived performance. Satisfaction
results if performance is higher than expected; dissatisfaction results if it is lower (Homburg/
Stock-Homburg 2008, p. 19; Foscht/Swoboda 2005, p. 209). In this case, only the overall cus-
tomer satisfaction with the total product or service performance is considered (Bartikowski
2002, p. 16). But the identification of the determinants of customer satisfaction is a central con-
cern for both marketing research and practitioners. It is important to know which service attrib-
utes add value and increase satisfaction, which of them merely fulfill minimum requirements
and minimize dissatisfaction, and which do both. Consider the following examples: a clean
restaurant engenders no satisfaction, but a dirty restaurant strongly attracts negative feelings;
receiving a free drink in a restaurant is pleasantly surprising, but there is no reason for dissatis-
faction if it is not delivered for free. In cases such as these, variant attributes may result in cus-
Walter, E.; Steyrer, C.; Wiesel, S. 73
tomer satisfaction or dissatisfaction or evoke no feeling from the consumer (Bartikowski/Llosa
2004, p. 68). This is the core concept of the Kano model.
The earliest concept for a two-dimensional model was proposed by Frederick Herzberg
(Herzberg et al. 1959). The motivator-hygiene theory or the two-factor theory of work intro-
duces a distinction between satisfaction and dissatisfaction. The theory posits that the factors
causing job dissatisfaction are different from the factors causing job satisfaction (Matzler et al.
2004, p. 1182; Tontini 2000, p. 728). Inspired by Herzberg’s theory in behavioural science,
Kano et al. (1984) developed the “Theory of Attractive Quality”. The theory of attractive quali-
ty is useful to better understand different aspects of how the customer evaluates a product or
service (Löfgren/Wittell 2007, p. 56; Nilsson-Witell/Fundin 2005, p. 152). To understand the
role of quality attributes, Kano et al. (1984) present a model that evaluates patterns of quality
based on customers’ satisfaction with specific quality attributes and their degree of sufficiency.
The theory explains how the relationship between the degree of sufficiency and customer satis-
faction with a quality attribute is different for different kinds of attributes. For some attributes
this relationship is positive asymmetrically, positive linearly, negative asymmetrically, non-exis-
tent or negative linearly (Ting/Chen 2002, p. 548). Depending on the nature of this relationship,
product and service attributes are distributed amongst five categories of perceived quality:
“must-be elements”, “one-dimensional elements”, “attractive elements”, “indifferent elements”
and “reverse elements” (Löfgren/Wittell 2005, p. 62). If must-be requirements are not fulfilled,
the customer will be dissatisfied, but their fulfillment will not increase satisfaction, as these
requirements are taken for granted. So, fulfilling these requirements will only lead to a state
where the consumer is not dissatisfied. Contrary to the must-be requirements, a high level of
fulfillment of one-dimensional requirements will lead to a high level of consumer satisfaction.
Attractive requirements have the most influence on satisfaction. Those requirements are neither
explicitly expressed nor expected by the consumer (Sauerwein 1999, p. 416).
Kano’s model of customer satisfaction connects the ideas of the theory of attractive quality with
the acceptations of the expectation disconfirmation paradigm. According to Kano’s model of
attractive quality, satisfaction with a quality attribute is the result of an evaluation of objective
and subjective qualities. Transferring this acceptation to the expectation disconfirmation para-
digm, customer satisfaction then is the result of an evaluation of the standard of reference to the
perceived performance (Hölzing 2008, p. 85). Figure 1 shows the nature of this relationship.
Consequently performance attributes are classified into the following five categories (Matzler
et al. 2009b, p. 322f.; Homburg/Stock-Homburg 2008, p. 33f.; Matzler et al. 2004, p. 1183f.):
- Must-be requirements: are minimum requirements that cause dissatisfaction if not fulfilled
but do not lead to customer satisfaction if fulfilled or exceeded. Negative performance on
these attributes has a greater impact on overall satisfaction than positive performance. The
74 European Retail Research, Vol. 24, Issue I, pp. 71-96
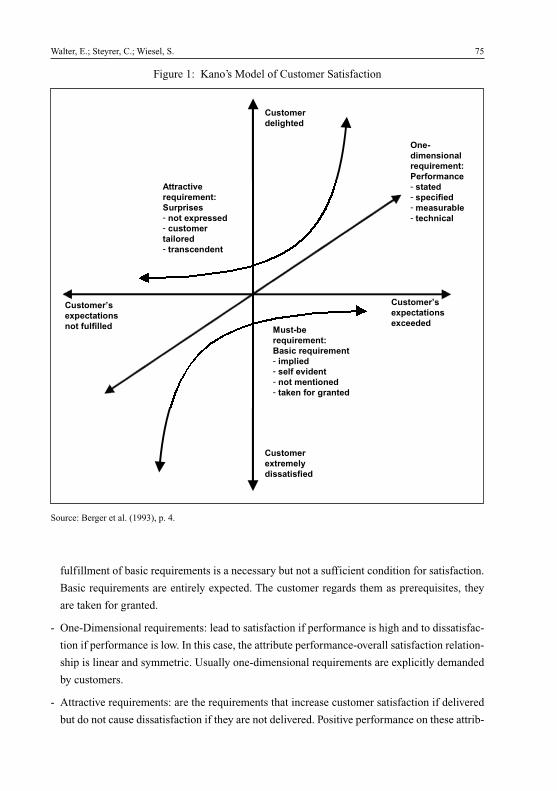
fulfillment of basic requirements is a necessary but not a sufficient condition for satisfaction.
Basic requirements are entirely expected. The customer regards them as prerequisites, they
are taken for granted.
- One-Dimensional requirements: lead to satisfaction if performance is high and to dissatisfac-
tion if performance is low. In this case, the attribute performance-overall satisfaction relation-
ship is linear and symmetric. Usually one-dimensional requirements are explicitly demanded
by customers.
- Attractive requirements: are the requirements that increase customer satisfaction if delivered
but do not cause dissatisfaction if they are not delivered. Positive performance on these attrib-
Walter, E.; Steyrer, C.; Wiesel, S. 75
�������
��� ���
���������
����������
��������������������� ��������
������� ����������
����
����������
����������
���������� ������ ��������� ���������� ���������
�������
����������
����������������������� �������������������������� ��!������ ����
�������"�
������������
������
�������
�������#
����������
�������"�
������������
��� ��������
Figure 1: Kano’s Model of Customer Satisfaction
Source: Berger et al. (1993), p. 4.
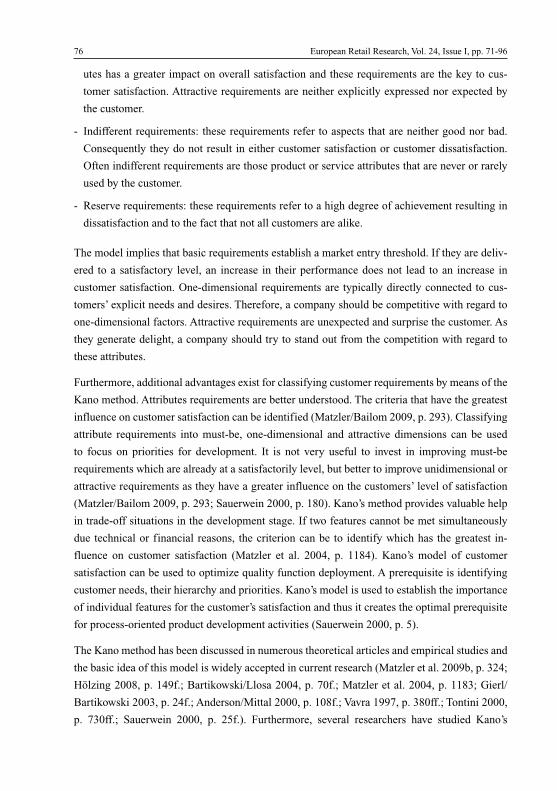
utes has a greater impact on overall satisfaction and these requirements are the key to cus-
tomer satisfaction. Attractive requirements are neither explicitly expressed nor expected by
the customer.
- Indifferent requirements: these requirements refer to aspects that are neither good nor bad.
Consequently they do not result in either customer satisfaction or customer dissatisfaction.
Often indifferent requirements are those product or service attributes that are never or rarely
used by the customer.
- Reserve requirements: these requirements refer to a high degree of achievement resulting in
dissatisfaction and to the fact that not all customers are alike.
The model implies that basic requirements establish a market entry threshold. If they are deliv-
ered to a satisfactory level, an increase in their performance does not lead to an increase in
customer satisfaction. One-dimensional requirements are typically directly connected to cus-
tomers’ explicit needs and desires. Therefore, a company should be competitive with regard to
one-dimensional factors. Attractive requirements are unexpected and surprise the customer. As
they generate delight, a company should try to stand out from the competition with regard to
these attributes.
Furthermore, additional advantages exist for classifying customer requirements by means of the
Kano method. Attributes requirements are better understood. The criteria that have the greatest
influence on customer satisfaction can be identified (Matzler/Bailom 2009, p. 293). Classifying
attribute requirements into must-be, one-dimensional and attractive dimensions can be used
to focus on priorities for development. It is not very useful to invest in improving must-be
requirements which are already at a satisfactorily level, but better to improve unidimensional or
attractive requirements as they have a greater influence on the customers’ level of satisfaction
(Matzler/Bailom 2009, p. 293; Sauerwein 2000, p. 180). Kano’s method provides valuable help
in trade-off situations in the development stage. If two features cannot be met simultaneously
due technical or financial reasons, the criterion can be to identify which has the greatest in-
fluence on customer satisfaction (Matzler et al. 2004, p. 1184). Kano’s model of customer
satisfaction can be used to optimize quality function deployment. A prerequisite is identifying
customer needs, their hierarchy and priorities. Kano’s model is used to establish the importance
of individual features for the customer’s satisfaction and thus it creates the optimal prerequisite
for process-oriented product development activities (Sauerwein 2000, p. 5).
The Kano method has been discussed in numerous theoretical articles and empirical studies and
the basic idea of this model is widely accepted in current research (Matzler et al. 2009b, p. 324;
Hölzing 2008, p. 149f.; Bartikowski/Llosa 2004, p. 70f.; Matzler et al. 2004, p. 1183; Gierl/
Bartikowski 2003, p. 24f.; Anderson/Mittal 2000, p. 108f.; Vavra 1997, p. 380ff.; Tontini 2000,
p. 730ff.; Sauerwein 2000, p. 25f.). Furthermore, several researchers have studied Kano’s
76 European Retail Research, Vol. 24, Issue I, pp. 71-96
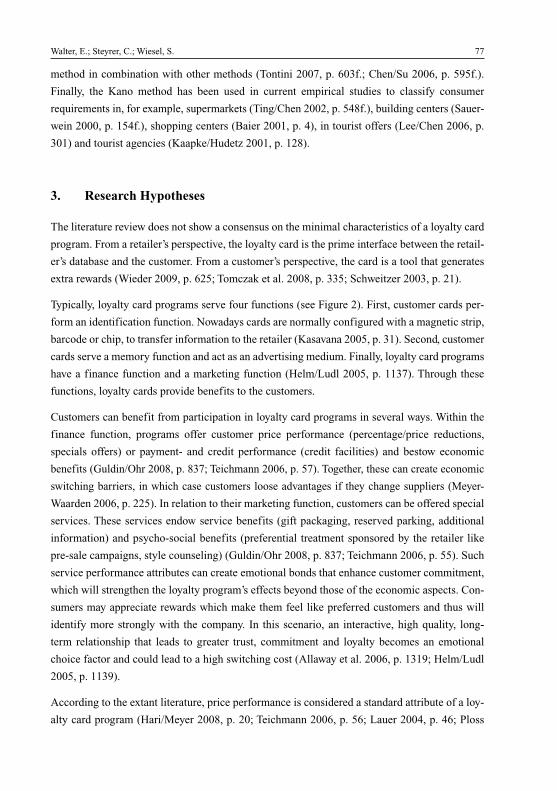
method in combination with other methods (Tontini 2007, p. 603f.; Chen/Su 2006, p. 595f.).
Finally, the Kano method has been used in current empirical studies to classify consumer
requirements in, for example, supermarkets (Ting/Chen 2002, p. 548f.), building centers (Sauer-
wein 2000, p. 154f.), shopping centers (Baier 2001, p. 4), in tourist offers (Lee/Chen 2006, p.
301) and tourist agencies (Kaapke/Hudetz 2001, p. 128).
3. Research Hypotheses
The literature review does not show a consensus on the minimal characteristics of a loyalty card
program. From a retailer’s perspective, the loyalty card is the prime interface between the retail-
er’s database and the customer. From a customer’s perspective, the card is a tool that generates
extra rewards (Wieder 2009, p. 625; Tomczak et al. 2008, p. 335; Schweitzer 2003, p. 21).
Typically, loyalty card programs serve four functions (see Figure 2). First, customer cards per-
form an identification function. Nowadays cards are normally configured with a magnetic strip,
barcode or chip, to transfer information to the retailer (Kasavana 2005, p. 31). Second, customer
cards serve a memory function and act as an advertising medium. Finally, loyalty card programs
have a finance function and a marketing function (Helm/Ludl 2005, p. 1137). Through these
functions, loyalty cards provide benefits to the customers.
Customers can benefit from participation in loyalty card programs in several ways. Within the
finance function, programs offer customer price performance (percentage/price reductions,
specials offers) or payment- and credit performance (credit facilities) and bestow economic
benefits (Guldin/Ohr 2008, p. 837; Teichmann 2006, p. 57). Together, these can create economic
switching barriers, in which case customers loose advantages if they change suppliers (Meyer-
Waarden 2006, p. 225). In relation to their marketing function, customers can be offered special
services. These services endow service benefits (gift packaging, reserved parking, additional
information) and psycho-social benefits (preferential treatment sponsored by the retailer like
pre-sale campaigns, style counseling) (Guldin/Ohr 2008, p. 837; Teichmann 2006, p. 55). Such
service performance attributes can create emotional bonds that enhance customer commitment,
which will strengthen the loyalty program’s effects beyond those of the economic aspects. Con-
sumers may appreciate rewards which make them feel like preferred customers and thus will
identify more strongly with the company. In this scenario, an interactive, high quality, long-
term relationship that leads to greater trust, commitment and loyalty becomes an emotional
choice factor and could lead to a high switching cost (Allaway et al. 2006, p. 1319; Helm/Ludl
2005, p. 1139).
According to the extant literature, price performance is considered a standard attribute of a loy-
alty card program (Hari/Meyer 2008, p. 20; Teichmann 2006, p. 56; Lauer 2004, p. 46; Ploss
Walter, E.; Steyrer, C.; Wiesel, S. 77
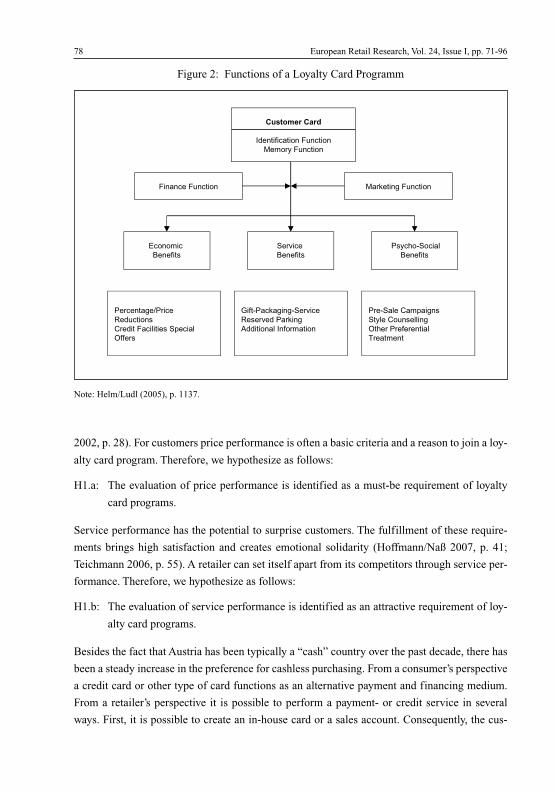
2002, p. 28). For customers price performance is often a basic criteria and a reason to join a loy-
alty card program. Therefore, we hypothesize as follows:
H1.a: The evaluation of price performance is identified as a must-be requirement of loyalty
card programs.
Service performance has the potential to surprise customers. The fulfillment of these require-
ments brings high satisfaction and creates emotional solidarity (Hoffmann/Naß 2007, p. 41;
Teichmann 2006, p. 55). A retailer can set itself apart from its competitors through service per-
formance. Therefore, we hypothesize as follows:
H1.b: The evaluation of service performance is identified as an attractive requirement of loy-
alty card programs.
Besides the fact that Austria has been typically a “cash” country over the past decade, there has
been a steady increase in the preference for cashless purchasing. From a consumer’s perspective
a credit card or other type of card functions as an alternative payment and financing medium.
From a retailer’s perspective it is possible to perform a payment- or credit service in several
ways. First, it is possible to create an in-house card or a sales account. Consequently, the cus-
78 European Retail Research, Vol. 24, Issue I, pp. 71-96
����������
������������ � �����
������ � �����
������� ����� ���������� �����
������
��������
������
��������
�����������
��������
�������������
��� �����
����� �������� �!���
"�����
#�����������������
���������������
$�������������������
�������� �!����
����� � ��������
"���� �����������
%�������
Figure 2: Functions of a Loyalty Card Programm
Note: Helm/Ludl (2005), p. 1137.
tomer has an additional payment card. These non-cash payment facilities are often character-
ized by high abstraction levels, and loss of subjective control over expenditures (Penz et al.
2004, p. 771; Schweizer 2003, p. 23). Second, it is possible to cooperate with a debit card com-
pany (Maestro) or a credit card company (Visa, MasterCard) to create a versatile usable card.
These facilities have the benefit that they are easy to handle and increase convenience. Also,
control over expenditures could be increased (Teichmann 2006, p. 61). In Austria, such loyalty
programs are not very popular. Hence it would be interesting to find out how these services
influence customer satisfaction and we hypothesize as follows:
H1.c: The evaluation of in-house payment- and credit service is identified as an indifferent
requirement of loyalty card programs.
H1.d: The evaluation of general payment- and credit functions is identified as an attractive
requirement of loyalty card programs.
For better customer satisfaction and less customer dissatisfaction, a company has to make the
effort to offer attractive product or service elements in new services as well as eliminate possi-
ble defects in must-be elements. Because the judgment of an attractive element or a must-be
element is highly personal, it is important to designate segments. Segmentation, the notion that
nearly any market can be divided up into variety of different behavioural, demographic, or psy-
chographic groups with potentially very different reactions to marketing stimuli, is a central
concern for marketing researchers and practitioners (Chen/Su 2006, p. 598f.; Baier 2002, p. 5).
Having now established the background that the Kano model demonstrates that performance
attributes can be transformed into terms of requirements, one can then take demographic vari-
ables such as age, gender, etc. or behavioural variables to create different market segments and
develop services with attractive requirements for these respective customer groups (Hölzing
2008, p. 87f.). Therefore, we propose as follows:
H2.a: There are no differences between men and women in the evaluation of performance
attributes within loyalty card programs.
H2.b: There are differences between credit cardholders and customers without any credit card
in the evaluation of loyalty cards with payment and/or credit functions.
Kano’s theory predicts that product and service attributes are dynamic in that, over time, an
attribute will change from being indifferent, to attractive, to one-dimensional, and finally into a
must-be (Hölzing 2008, p. 61). According to Kano product and service attributes do follow this
lifecycle. When introduced to a market, often an attribute may not be very interesting to cus-
tomers - they feel indifferent towards the new attribute. In the growth phase of a market, an
attribute might gain the ability to make customers feel satisfied, but still neutral if the service
does not include this attribute. However, customers who have used the attribute will frequently
be strongly dissatisfied if it later disappears. After frequent usage, the perception of the attrib-
Walter, E.; Steyrer, C.; Wiesel, S. 79
ute changes to one-dimensional, and over time to must-be (Nilsson-Witell/Fundin 2005, p.
153f., Sauerwein 2000, p. 20). Therefore, we hypothesize as follows:
H3: There is a difference between loyalty cardholders and customers without loyalty cards in
the evaluation of performance attributes within loyalty card programs.
The literature review shows that customers in retail fashion are poised for testing new functions
in loyalty card programs (Pohlmann 2003, p. 161; Ritter 2002, p. 54). So it is important to find
out if there is an acceptance for a payment- or credit function and which factors influence the
use of such cards. Actually, little is known about the factors that influence consumers’ use of
store cards. According to Lee and Kwon (2002, p. 241) the usage is related to a number of vari-
ables, including the use of payment cards, income and education. In Austria, preference for
cashless payments increases with higher income and education (Mooslechner et al. 2006, p.
134). Therefore, we propose:
H4.a: Education has positive affects on the usage of cards with payment and/or credit func-
tions.
H4.b: Income has positive affects on the usage of cards with payment and/or credit functions.
H4.c: The more loyalty cards a customer has, the more likely the consumer will want to use
loyalty cards with payment and/or credit functions.
Nowadays, most customer loyalty card programs are virtually interchangeable. They lack in
attractiveness and differentiation. A retailer has to offer an additional incentive to make its card
competitive and attractive (Hoffmann/Naß 2007, p. 6). According to Ferguson (2006, p. 374) a
payment- and credit service should be an integral part of the loyalty strategy and can effective-
ly differentiate the loyalty card. Finally, an integral payment- and credit service can positively
affect customer satisfaction with the loyalty program. In line with these findings we hypothe-
size as follows:
H5: Loyalty cards with payment and credit functions positively affect consumer satisfaction
with the loyalty card.
The hypotheses formulated will be subjected to an empirical review in the following chapter.
4. Empirical Study and Methodology
4.1. Kano Questionnaire
The Kano model brings a different perspective to the analysis of product or service attributes
because it takes into consideration the asymmetrical and non-linear relationship between per-
formance and satisfaction.
80 European Retail Research, Vol. 24, Issue I, pp. 71-96
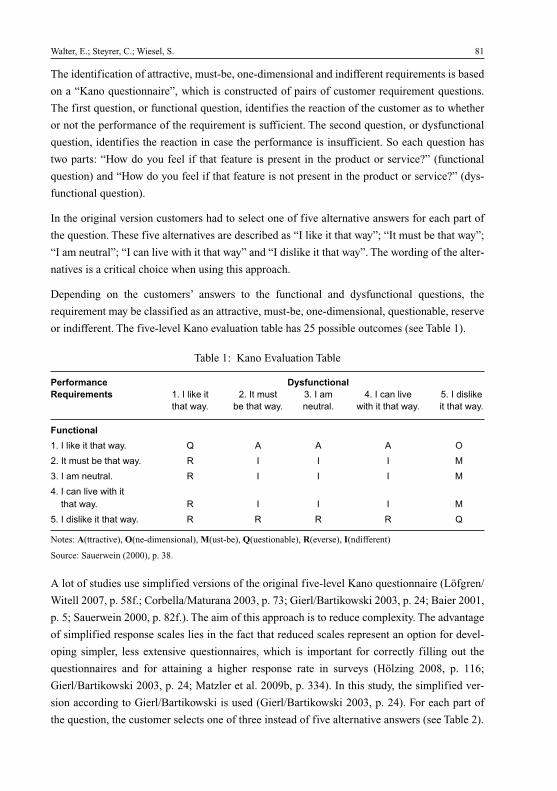
The identification of attractive, must-be, one-dimensional and indifferent requirements is based
on a “Kano questionnaire”, which is constructed of pairs of customer requirement questions.
The first question, or functional question, identifies the reaction of the customer as to whether
or not the performance of the requirement is sufficient. The second question, or dysfunctional
question, identifies the reaction in case the performance is insufficient. So each question has
two parts: “How do you feel if that feature is present in the product or service?” (functional
question) and “How do you feel if that feature is not present in the product or service?” (dys-
functional question).
In the original version customers had to select one of five alternative answers for each part of
the question. These five alternatives are described as “I like it that way”; “It must be that way”;
“I am neutral”; “I can live with it that way” and “I dislike it that way”. The wording of the alter-
natives is a critical choice when using this approach.
Depending on the customers’ answers to the functional and dysfunctional questions, the
requirement may be classified as an attractive, must-be, one-dimensional, questionable, reserve
or indifferent. The five-level Kano evaluation table has 25 possible outcomes (see Table 1).
Walter, E.; Steyrer, C.; Wiesel, S. 81
Table 1: Kano Evaluation Table
Performance DysfunctionalRequirements 1. I like it 2. It must 3. I am 4. I can live 5. I dislike
that way. be that way. neutral. with it that way. it that way.
Functional
1. I like it that way. Q A A A O
2. It must be that way. R I I I M
3. I am neutral. R I I I M
4. I can live with itthat way. R I I I M
5. I dislike it that way. R R R R Q
Notes: A(ttractive), O(ne-dimensional), M(ust-be), Q(uestionable), R(everse), I(ndifferent)
Source: Sauerwein (2000), p. 38.
A lot of studies use simplified versions of the original five-level Kano questionnaire (Löfgren/
Witell 2007, p. 58f.; Corbella/Maturana 2003, p. 73; Gierl/Bartikowski 2003, p. 24; Baier 2001,
p. 5; Sauerwein 2000, p. 82f.). The aim of this approach is to reduce complexity. The advantage
of simplified response scales lies in the fact that reduced scales represent an option for devel-
oping simpler, less extensive questionnaires, which is important for correctly filling out the
questionnaires and for attaining a higher response rate in surveys (Hölzing 2008, p. 116;
Gierl/Bartikowski 2003, p. 24; Matzler et al. 2009b, p. 334). In this study, the simplified ver-
sion according to Gierl/Bartikowski is used (Gierl/Bartikowski 2003, p. 24). For each part of
the question, the customer selects one of three instead of five alternative answers (see Table 2).
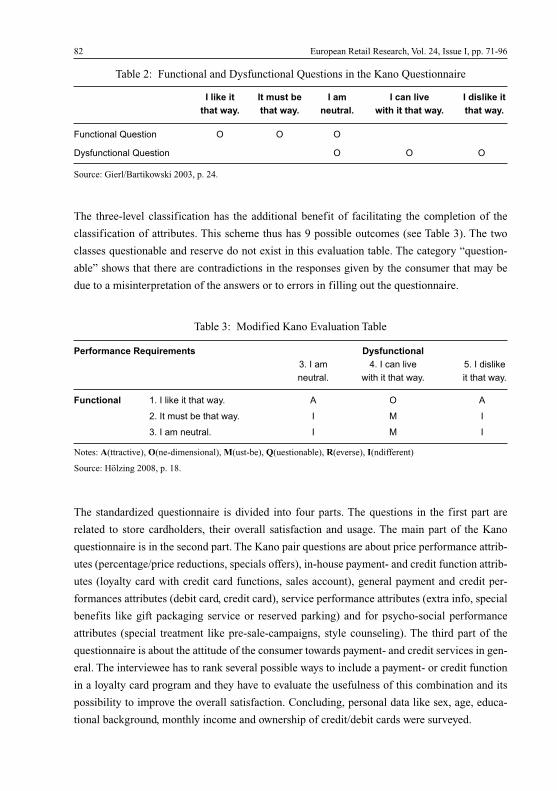
82 European Retail Research, Vol. 24, Issue I, pp. 71-96
Table 3: Modified Kano Evaluation Table
Performance Requirements Dysfunctional
3. I am 4. I can live 5. I dislike
neutral. with it that way. it that way.
Functional 1. I like it that way. A O A
2. It must be that way. I M I
3. I am neutral. I M I
Notes: A(ttractive), O(ne-dimensional), M(ust-be), Q(uestionable), R(everse), I(ndifferent)
Source: Hölzing 2008, p. 18.
Table 2: Functional and Dysfunctional Questions in the Kano Questionnaire
I like it It must be I am I can live I dislike it
that way. that way. neutral. with it that way. that way.
Functional Question O O O
Dysfunctional Question O O O
Source: Gierl/Bartikowski 2003, p. 24.
The three-level classification has the additional benefit of facilitating the completion of the
classification of attributes. This scheme thus has 9 possible outcomes (see Table 3). The two
classes questionable and reserve do not exist in this evaluation table. The category “question-
able” shows that there are contradictions in the responses given by the consumer that may be
due to a misinterpretation of the answers or to errors in filling out the questionnaire.
The standardized questionnaire is divided into four parts. The questions in the first part are
related to store cardholders, their overall satisfaction and usage. The main part of the Kano
questionnaire is in the second part. The Kano pair questions are about price performance attrib-
utes (percentage/price reductions, specials offers), in-house payment- and credit function attrib-
utes (loyalty card with credit card functions, sales account), general payment and credit per-
formances attributes (debit card, credit card), service performance attributes (extra info, special
benefits like gift packaging service or reserved parking) and for psycho-social performance
attributes (special treatment like pre-sale-campaigns, style counseling). The third part of the
questionnaire is about the attitude of the consumer towards payment- and credit services in gen-
eral. The interviewee has to rank several possible ways to include a payment- or credit function
in a loyalty card program and they have to evaluate the usefulness of this combination and its
possibility to improve the overall satisfaction. Concluding, personal data like sex, age, educa-
tional background, monthly income and ownership of credit/debit cards were surveyed.
4.2. Field Study
Since the business environment of the fashion sector is constantly changing, the development
and implementation of effective and successful marketing strategies are particularly important
in the retail clothing sector (Moore/Fairhurst 2003, p. 386; Meffert 2008, p. 159; Müller-Hage-
dorn 2006, p. 35; KMPG 2006, p. 58; Liebmann/Zentes 2008, p. 170). Therefore, the empirical
study underlying this research was conducted in the main fashion shopping streets of Vienna
using personal interviews based on a standardized questionnaire containing mainly closed
questions. The experience has shown that standardized, oral interviews are the most suitable
method for Kano surveys. A standardized questionnaire is advantageous in that it reduces the
interviewer’s influence and usually increases the return rate (Hölzing 2008, p. 119f.; Sauerwein
2000, p. 39).
In selecting the main shopping streets several aspects were taken into consideration. There are
many fashion stores located on these streets and, as the interviews were done shortly after a pur-
chase, the customer was still in the shopping situation when they were asked to do the interview.
Also, the loyalty card, if available, was used a short while ago at the point of sale. The data was
collected within a period of one month. To improve data quality, the survey was carried out on
the four main shopping streets of Vienna (Mariahilfer Straße, Kärtner Straße, Landstraße and
Favoritenstraße) using a convenience sample of 300 shoppers.
70.3% of the respondents were female, and 29.7% were male. The reason for this relation may
be that women are more interested in fashion shopping and are therefore overrepresented on
shopping streets (Größe-Bölting 2005, p. 104). The survey distinguishes five age categories
(see Table 4).
Walter, E.; Steyrer, C.; Wiesel, S. 83
Table 4: Age and income
Age Sample Income Sample
20 to 29 years of age 63 (21%) less than 1,000 Euros 37%
30 to 39 years of age 82 (27%) 1,000 to 2,000 Euros 45%
40 to 49 years of age 63 (21%) more than 2,000 Euros 9.3%
50 to 59 years of age 61 (20%) n/a 8.7%
over 60 years of age 31 (10%)
Most respondents have a vocational education or apprenticeship (40.7%), 36.3% have a gener-
al qualification for university entrance and 14% have a university degree. 6% have only com-
pulsory education. 98% own a debit card and 37% have a credit card. About 1% of the sample
has a co-branded payment card. 192 respondents (64%) have a loyalty card from a fashion
retailer.
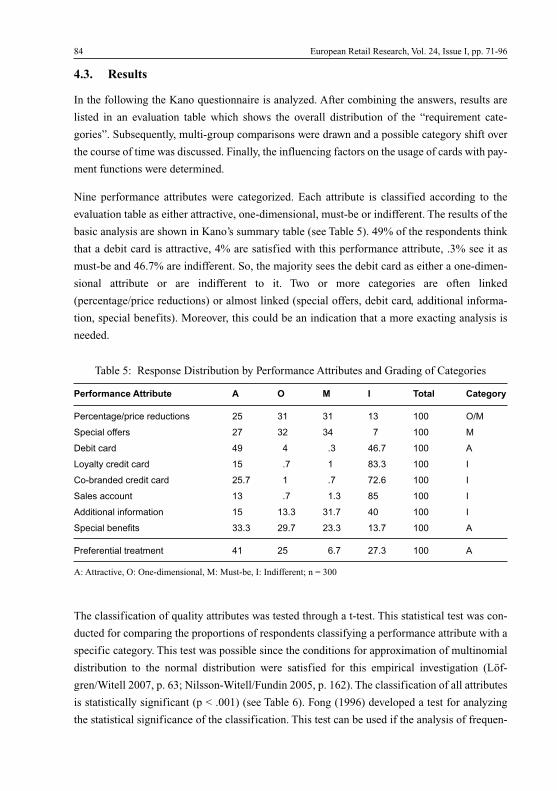
4.3. Results
In the following the Kano questionnaire is analyzed. After combining the answers, results are
listed in an evaluation table which shows the overall distribution of the “requirement cate-
gories”. Subsequently, multi-group comparisons were drawn and a possible category shift over
the course of time was discussed. Finally, the influencing factors on the usage of cards with pay-
ment functions were determined.
Nine performance attributes were categorized. Each attribute is classified according to the
evaluation table as either attractive, one-dimensional, must-be or indifferent. The results of the
basic analysis are shown in Kano’s summary table (see Table 5). 49% of the respondents think
that a debit card is attractive, 4% are satisfied with this performance attribute, .3% see it as
must-be and 46.7% are indifferent. So, the majority sees the debit card as either a one-dimen-
sional attribute or are indifferent to it. Two or more categories are often linked
(percentage/price reductions) or almost linked (special offers, debit card, additional informa-
tion, special benefits). Moreover, this could be an indication that a more exacting analysis is
needed.
84 European Retail Research, Vol. 24, Issue I, pp. 71-96
Table 5: Response Distribution by Performance Attributes and Grading of Categories
Performance Attribute A O M I Total Category
Percentage/price reductions 25 31 31 13 100 O/M
Special offers 27 32 34 7 100 M
Debit card 49 4 .3 46.7 100 A
Loyalty credit card 15 .7 1 83.3 100 I
Co-branded credit card 25.7 1 .7 72.6 100 I
Sales account 13 .7 1.3 85 100 I
Additional information 15 13.3 31.7 40 100 I
Special benefits 33.3 29.7 23.3 13.7 100 A
Preferential treatment 41 25 6.7 27.3 100 A
A: Attractive, O: One-dimensional, M: Must-be, I: Indifferent; n = 300
The classification of quality attributes was tested through a t-test. This statistical test was con-
ducted for comparing the proportions of respondents classifying a performance attribute with a
specific category. This test was possible since the conditions for approximation of multinomial
distribution to the normal distribution were satisfied for this empirical investigation (Löf-
gren/Witell 2007, p. 63; Nilsson-Witell/Fundin 2005, p. 162). The classification of all attributes
is statistically significant (p < .001) (see Table 6). Fong (1996) developed a test for analyzing
the statistical significance of the classification. This test can be used if the analysis of frequen-
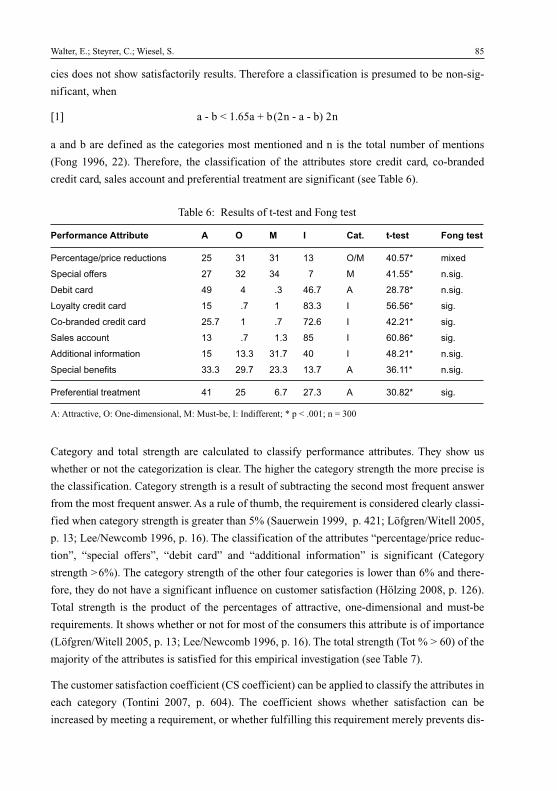
cies does not show satisfactorily results. Therefore a classification is presumed to be non-sig-
nificant, when
[1] a - b < 1.65a + b(2n - a - b) 2n
a and b are defined as the categories most mentioned and n is the total number of mentions
(Fong 1996, 22). Therefore, the classification of the attributes store credit card, co-branded
credit card, sales account and preferential treatment are significant (see Table 6).
Walter, E.; Steyrer, C.; Wiesel, S. 85
Table 6: Results of t-test and Fong test
Performance Attribute A O M I Cat. t-test Fong test
Percentage/price reductions 25 31 31 13 O/M 40.57* mixed
Special offers 27 32 34 7 M 41.55* n.sig.
Debit card 49 4 .3 46.7 A 28.78* n.sig.
Loyalty credit card 15 .7 1 83.3 I 56.56* sig.
Co-branded credit card 25.7 1 .7 72.6 I 42.21* sig.
Sales account 13 .7 1.3 85 I 60.86* sig.
Additional information 15 13.3 31.7 40 I 48.21* n.sig.
Special benefits 33.3 29.7 23.3 13.7 A 36.11* n.sig.
Preferential treatment 41 25 6.7 27.3 A 30.82* sig.
A: Attractive, O: One-dimensional, M: Must-be, I: Indifferent; * p < .001; n = 300
Category and total strength are calculated to classify performance attributes. They show us
whether or not the categorization is clear. The higher the category strength the more precise is
the classification. Category strength is a result of subtracting the second most frequent answer
from the most frequent answer. As a rule of thumb, the requirement is considered clearly classi-
fied when category strength is greater than 5% (Sauerwein 1999, p. 421; Löfgren/Witell 2005,
p. 13; Lee/Newcomb 1996, p. 16). The classification of the attributes “percentage/price reduc-
tion”, “special offers”, “debit card” and “additional information” is significant (Category
strength >6%). The category strength of the other four categories is lower than 6% and there-
fore, they do not have a significant influence on customer satisfaction (Hölzing 2008, p. 126).
Total strength is the product of the percentages of attractive, one-dimensional and must-be
requirements. It shows whether or not for most of the consumers this attribute is of importance
(Löfgren/Witell 2005, p. 13; Lee/Newcomb 1996, p. 16). The total strength (Tot % > 60) of the
majority of the attributes is satisfied for this empirical investigation (see Table 7).
The customer satisfaction coefficient (CS coefficient) can be applied to classify the attributes in
each category (Tontini 2007, p. 604). The coefficient shows whether satisfaction can be
increased by meeting a requirement, or whether fulfilling this requirement merely prevents dis-
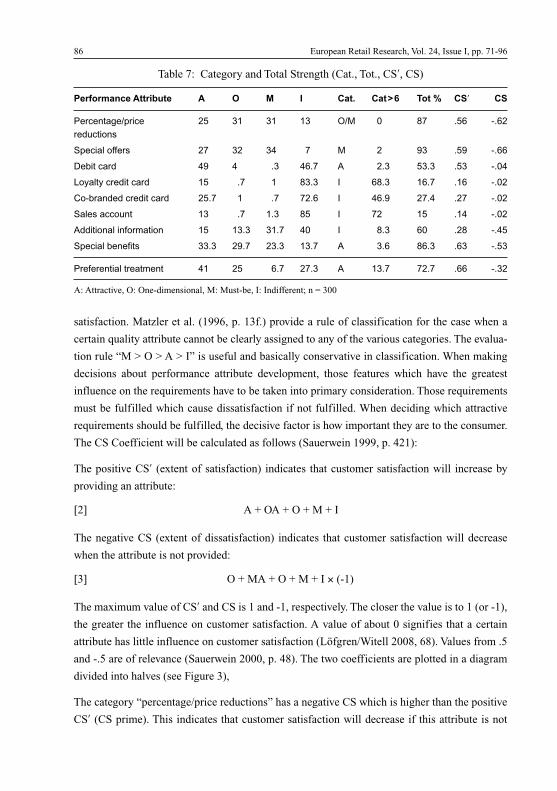
satisfaction. Matzler et al. (1996, p. 13f.) provide a rule of classification for the case when a
certain quality attribute cannot be clearly assigned to any of the various categories. The evalua-
tion rule “M > O > A > I” is useful and basically conservative in classification. When making
decisions about performance attribute development, those features which have the greatest
influence on the requirements have to be taken into primary consideration. Those requirements
must be fulfilled which cause dissatisfaction if not fulfilled. When deciding which attractive
requirements should be fulfilled, the decisive factor is how important they are to the consumer.
The CS Coefficient will be calculated as follows (Sauerwein 1999, p. 421):
The positive CS� (extent of satisfaction) indicates that customer satisfaction will increase by
providing an attribute:
[2] A + OA + O + M + I
The negative CS (extent of dissatisfaction) indicates that customer satisfaction will decrease
when the attribute is not provided:
[3] O + MA + O + M + I × (-1)
The maximum value of CS� and CS is 1 and -1, respectively. The closer the value is to 1 (or -1),
the greater the influence on customer satisfaction. A value of about 0 signifies that a certain
attribute has little influence on customer satisfaction (Löfgren/Witell 2008, 68). Values from .5
and -.5 are of relevance (Sauerwein 2000, p. 48). The two coefficients are plotted in a diagram
divided into halves (see Figure 3),
The category “percentage/price reductions” has a negative CS which is higher than the positive
CS� (CS prime). This indicates that customer satisfaction will decrease if this attribute is not
86 European Retail Research, Vol. 24, Issue I, pp. 71-96
Table 7: Category and Total Strength (Cat., Tot., CS�, CS)
Performance Attribute A O M I Cat. Cat>6 Tot % CS� CS
Percentage/price 25 31 31 13 O/M 0 87 .56 -.62
reductions
Special offers 27 32 34 7 M 2 93 .59 -.66
Debit card 49 4 .3 46.7 A 2.3 53.3 .53 -.04
Loyalty credit card 15 .7 1 83.3 I 68.3 16.7 .16 -.02
Co-branded credit card 25.7 1 .7 72.6 I 46.9 27.4 .27 -.02
Sales account 13 .7 1.3 85 I 72 15 .14 -.02
Additional information 15 13.3 31.7 40 I 8.3 60 .28 -.45
Special benefits 33.3 29.7 23.3 13.7 A 3.6 86.3 .63 -.53
Preferential treatment 41 25 6.7 27.3 A 13.7 72.7 .66 -.32
A: Attractive, O: One-dimensional, M: Must-be, I: Indifferent; n = 300
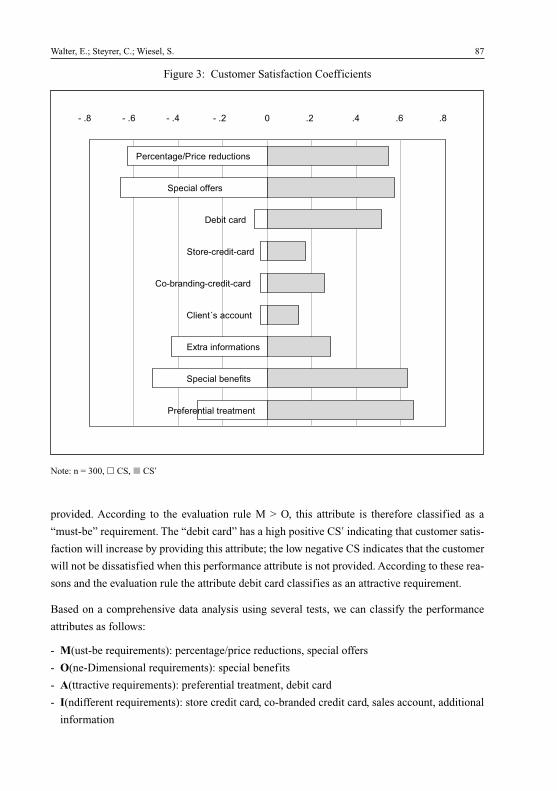
provided. According to the evaluation rule M > O, this attribute is therefore classified as a
“must-be” requirement. The “debit card” has a high positive CS� indicating that customer satis-
faction will increase by providing this attribute; the low negative CS indicates that the customer
will not be dissatisfied when this performance attribute is not provided. According to these rea-
sons and the evaluation rule the attribute debit card classifies as an attractive requirement.
Based on a comprehensive data analysis using several tests, we can classify the performance
attributes as follows:
- M(ust-be requirements): percentage/price reductions, special offers
- O(ne-Dimensional requirements): special benefits
- A(ttractive requirements): preferential treatment, debit card
- I(ndifferent requirements): store credit card, co-branded credit card, sales account, additional
information
Walter, E.; Steyrer, C.; Wiesel, S. 87
Figure 3: Customer Satisfaction Coefficients
� .� ����� .�� ��� .� � .� � .� .� .� .�
�� ������� ������� �
������������
���� ����
���������������
������ �� ������������
��� ��� ����� �
�!����� ���"���� �
������ � ����
��� ���������" �
Note: n = 300, � CS, � CS�
This results support hypothesis 1 (H1.a to H1.d).
The next step is to make clusters and search for possible category shifts over the course of time.
According to Chen/Su (2006, p. 602f.) an ANOVA can be applied to investigate group effects.
Customers were divided into groups (male/female, credit cardholder/non-credit cardholder,
store cardholder/non-store cardholder). Then the results of the questionnaire items for each
group were listed in a separate Kano table, which shows the performance attributes in terms of
attractive, one-dimensional, must-be and indifferent requirements. To be able to test the differ-
ences between groups, a variable was created where customer perceptions of the performance
attributes were gathered and arranged as: indifferent (1), attractive (2), one-dimensional (3) and
must-be (4) (Nilsson-Wittell/Fundin 2005, p. 161f.). Consequently, this customer perception
variable is the dependent variable and the group variables like gender, credit card and store card
ownership are the independent variables.
The hypothesis that there are no differences in the evaluation of performance attributes between
men and women was tested using ANOVA. There are significant differences in the classifica-
tion of two performance attributes: “additional information” (F = 11.38, p = .001) and “prefer-
ential treatment” (F = 34.98, p = .000). So, hypothesis 2.a is rejected.
With hypothesis 2.b we postulate differences between credit cardholders and customers without
credit cards in the evaluation of cards with payment and credit functions. This hypothesis was
tested by applying ANOVA. We did find significant differences in the classification of the per-
formance attributes “Loyalty card with credit card functions” (F = 4.46; p = .035) and “co-
branded credit card” (F = 65.18, p = .000). This result supports hypothesis 2.b.
Performance attributes seem to be dynamic over time, which means that an attribute can change
from being indifferent, to attractive, to one-dimensional, and finally to a must-be item. The
hypothesis is tested by applying an ANOVA. The requirements percentage/price reductions
(F = 12.48, p = .001), special offers (F = 31.04, p = .000) and preferential treatment (F = 15.88,
p = .000) are significantly different between the groups of respondents with and without loyal-
ty cards. This result supports hypothesis 3.
Income (x2 = 46.57, p = .000; r = .27, p = .000; n = 300) correlates with the intention to use
a loyalty card with payment and/or credit functions. With higher income the intention to use
the card increases. Hence, hypothesis 4.a is confirmed. Education (x2 = 19.39, p = .01; r = .11,
p = .08; n = 274) also correlates with the intention to use a loyalty card with payment and/or
credit functions but only with a significance level of � = .10. Therefore, hypothesis 4.b is reject-
ed. The total amount of loyalty cards owned by a customer (x2 = 31.57, p = .14; r = .05, p = .38;
n = 300) does not correlate with the intention to use loyalty cards with payment and/or credit
functions. Therefore, hypotheses 4.c is rejected.
88 European Retail Research, Vol. 24, Issue I, pp. 71-96
Loyalty cards with payment and credit functions do have influence on consumer overall satis-
faction. With 4% of respondents satisfaction will definitely increase, with 17% it is likely to
increase and 24% say that satisfaction may increase. From this it follows that there is potential
for a loyalty card with payment and/or credit functions, but the result does not support hypo-
thesis 5. Hence, hypothesis 5 is rejected.
5. Discussion and Implications
The further development of loyalty card programs is an important and vital part of relationship
marketing, especially for the Austrian retail fashion market. But nowadays, a lot of store card
programs are virtually interchangeable. They are lacking in attractiveness and differentiation.
Only loyalty card programs that distinguish a retailer from its competitors can increase cus-
tomer retention and lifetime duration. Therefore, loyalty card programs should offer integral
systems of marketing actions and economic, psychological and sociological rewards. The
results of our study have several important implications for researchers and managers. Further-
more they offer another perspective and identify influencing factors of consumer satisfaction
using Kano’s method.
Price performance attributes (percentage/price reductions, specials offers) could be classified
as “must-be requirements”. Therefore, price performance attributes are important for a loyalty
card program. If these requirements are not fulfilled, the customer will be dissatisfied. As the
customer takes those requirements for granted, their fulfillment will not increase overall satis-
faction. Fulfilling the must-be requirements will only lead to a state of being not dissatisfied.
The customer takes them for granted and therefore does not explicitly demand them. From a
retailer’s perspective, it is important to know that if price performance attributes are offered at a
satisfactory level, an increase in their performance does not lead to an increase in customer sat-
isfaction. But if they are not fulfilled, the customer will not be interested in the card program at
all.
Service performance attributes (special benefits like a gift packaging service or reserved
parking) could be classified as “one-dimensional requirements”. With regard to these require-
ments customer satisfaction is proportional to the level of fulfillment. The higher the level of
fulfillment, the higher the customer’s satisfaction will be, and vice versa. These service per-
formance attributes are usually explicitly demanded by the customer, and consequently it is
important to integrate such features into a loyalty card program. From a retailer’s perspective,
it is important to be competitive with regard to one-dimensional requirements. Furthermore,
service performance attributes can create emotional attachments that enhance a customer’s
commitment.
Walter, E.; Steyrer, C.; Wiesel, S. 89
Psycho-social performance attributes (preferential treatment like pre-sale campaigns and style
counseling) could be classified as “attractive requirements”. These requirements are the crite-
ria, which have the greatest influence on the level of satisfaction for the customer. Psycho-
social performance attributes enhance customers’ perceived value. Consumers appreciate
rewards and it makes them feel like preferred customers and they will identify more with a
store. They are neither explicitly expressed nor expected by the customer. From a retailer’s per-
spective these performance attributes create a wide range of possibilities for differentiation, in
contrast to interchangeable price and service performance attributes.
In general, must-be, one-dimensional and attractive requirements differ in the utility expecta-
tions of different customer segments. An ANOVA was applied to identify the effect of gender
on the performance attributes’ classification. For men the performance attributes “preferential
treatment” and “additional information” are classified as indifferent requirements, while
women classify these attributes as attractive requirements. These performance attributes appear
more important to women because of their higher interest in fashion shopping (Größe-Bölting
2005, p. 104). Furthermore, the difference is strengthened by the fact that “preferential treat-
ment” services are particularly oriented to female needs. By understanding the different effects
on customer satisfaction from different types of performance attributes, companies can develop
more appropriate marketing strategies to increase customer satisfaction. According to Aßmann
et al. (2008, p. 76) increasing their individualization will become more important.
Kano’s theory presumes that successful performance attributes follow a specific life cycle and
change over time. The present study has shown that for respondents without loyalty cards, price
and service attributes are attractive requirements; while for loyalty cardholders they are must-be
and/or one-dimensional requirements. Psycho-social performance attributes are classified as
attractive requirements from store cardholders, while for the other group these are indifferent
requirements. Our results imply that price and service attributes are able to change from being
indifferent to attractive, to one-dimensional, and finally to must-be. From this point of view, a
loyal card program has to be enhanced continuously. Features need to be contemporary and
should satisfy customers’ demands. Furthermore, it is important to create attractive price
requirements to acquire new customers for the card program, as for respondents without loyal-
ty cards their features are attractive requirements.
With a focus on payment and credit attributes the present study shows that Austrian customers
prefer general solutions. Only the performance attribute “debit card” is classified as an attrac-
tive requirement. Consequently, this feature can increase customer satisfaction if delivered, but
does not cause dissatisfaction if it is not delivered. The result is strengthened by the fact that a
co-branded debit card has the benefit that the customers do not need another plastic card what
is seen as an increase in handling and convenience. Also, the control over expenditures can be
90 European Retail Research, Vol. 24, Issue I, pp. 71-96
improved. Furthermore, credit cardholders identify co-branded credit card as attractive require-
ments. According to Aßmann and Werg (2008, p. 75) customers want to have fewer cards and
for this reason “all-in-one-solutions” including payment functions will become more important.
The disadvantage of this trend is that the store brand disappears from customers’ wallets. Being
in the customers’ relevance set should be the aim of the relationship marketing, not only being
in the wallet. The usage of such cards is related to a number of variables. The empirical study
shows that education positively affects the intention to use cards with payment and credit func-
tions, while income and ownership of a loyalty card does not.
It is of important relevance for marketing researchers and practitioners to know which perform-
ance attributes add value and increase satisfaction and which of them merely fulfill minimum
requirements and minimize dissatisfaction. In this context, Kano’s method can help to explore
requirements that must be fulfilled to be competitive, and which are seen as attractive by the
customer and so increase satisfaction. Hence, the present study identifies important require-
ments for loyalty card programs.
Although our study leads to some precious insights on the benefits of loyalty cards which
include payment and credit functions, there are some limitations that need to be discussed. First,
due to the convenience sample, the generalizability of our study is limited. Secondly, we only
examined the fashion sector in Austria and it would be worthwhile to investigate whether our
findings differ over various other industries and/or countries to enable explicit comparisons.
Finally, the model does not enable us to evaluate the importance of the different requirements,
which would be important for deriving marketing activities. Future research should try to elim-
inate these issues to provide more generalizable and useful results.
References
Allaway, A.W.; Gooner, R.M.; Berkowitz, D.; Davis, L. (2006): Deriving and exploring behav-ior segments within a retail loyalty card program. In: European Journal of Marketing, Vol.40, No. 11/12, pp. 1317-1339.
Anderson, E.W.; Mittal, V. (2003): Strengthening the Satisfaction-Profit Chain, in: Journal ofService Research, Vol. 3, No. 2, pp. 107-120.
Aßmann, J.; Werg, J. (2008): Kundenkartenprogramme im Customer Relationship Management(CRM). Einsatzmöglichkeiten und Erfolgsfaktoren von Kundenkarten aus Unternehmens-sicht, Institute of Electronic Business (Hrsg.) vertreten durch Schildhauer Thomas, Göttin-gen: BusinessVillage.
Baier, G. (2001): Attraktivitätskriterien kleiner Shopping Center - Ergebnisse einer empirischenUntersuchung auf Basis des modifizierten Kano-Modells, WWDP 37. Chemnitz 2001.
Bartikowski, B. (2002): Kundenzufriedenheit: Verfahren zur Messung der Indifferenzzone,Köln: Josef Eul Verlag GembH.
Walter, E.; Steyrer, C.; Wiesel, S. 91
Bartikowski, B.; Llosa, S. (2004): Customer Satisfaction Measurement: Comparing Four Meth-ods of Attribute Categorizations, in: The Service Industries Journal, Vol. 24, No. 4, pp. 67-82.
Berger, C.; Blauth, R.; Boger, D.; Bolster, C.; Burchill, G.; DuMouchel, W.; Pouliot, F.; Richter,R.; Rubinoff, A.; Shen, D.; Timko, M.; Walden, D. (1993): Kano’s Methods for Understand-ing Customer-defined Quality, in: Center for Quality Management Journal, Vol. 4, pp. 3-36.
Bolton, R.N. (1998): A Dynamic Model of the Duration of the Customer’s Relationship with aContinuous Service Provider: The Role of Satisfaction, in: Marketing Science, Vol. 17, pp.45-65.
Chen, Y.-H.; Su, C.-T. (2006): A Kano-CKM Model for Customer Knowledge Discovery, in:Total Quality Management, Vol. 17, No. 5, pp. 589-608.
Corbella, A.J.; Maturana, S.D. (2003): Citzen’s Role in Health Services: Satisfaction Behavior:Kano’s Model, Part 1 & 2, in: Quality Management in Health Care, Vol. 12, No. 1, pp. 64-80.
Ferguson, R. (2006): Using private label credit cards al a loyalty tool, in: Journal of ConsumerMarketing, Vol. 23, No. 7, pp. 374-378.
Fong, D. (1996): Using the Self-Stated Importance Questionnaire to interpret Kano Question-naire Results, in: Center For Quality of Management Journal, Vol. 5, No. 3, pp. 21-23.
Foscht, T.; Swoboda, B. (2005): Käuferverhalten. Grundlagen, Perspektiven, Anwendungen,2nd ed., Wiesbaden: Gabler.
Gierl, H.; Bartikowski, B. (2003): Ermittlung von Satisfier, Dissatisfier und Criticals in derZufriedenheitsforschung, in: Der Markt, Vol. 42, No. 164, pp. 14-34.
Größe-Bölting, K. (2005): Management der Betriebstypenmarkentreue. Konzeptualisierung,Operationalisierung und Gestaltungsempfehlungen für den Bekleidungseinzelhandel, Wies-baden: Deutscher Universitäts-Verlag.
Guldin, A.; Ohr, D. (2008): Kundenbindungsmanagement im Bekleidungshandel, in: Bruhn, M.(eds.): Handbuch Kundenbindungsmanagement: Strategien und Instrumente für ein erfolg-reiches CRM, 6th ed., Wiesbaden: Gabler, pp. 815-841.
Hari, J.; Meyer, A. (2008): Kunden binden: Kundenkarten funktionieren - oder doch nicht? in:Marketing & Kommunikation, Vol. 20, p. 20.
Herzberg, F.; Mausner, B.; Synderman, B.B. (1959): The Motivation to Work, 2nd Edition,New York: John Wiley & Sons.
Helm, R.; Ludl, M. (2005): Kundenkarten und ihre Wirkung als Kundenbindungsinstrument,in: Zeitschrift für Betriebswirtschaft, Vol. 12, pp. 1131-1163.
Hoffmann, A.; Naß, S.; Schurk, V. (2007): Schwieriges Bindemittel, in: Absatzwirtschaft –Zeitschrift für Marketing, No. 06, pp. 28-31.
Hölzing, J.A. (2008): Die Kano-Theorie der Kundenzufriedenheitsmessung. Eine theoretischeund empirische Überprüfung. Wiesbaden: Gabler.
Homburg, C.; Bucerius, M. (2006): Kundenzufriedenheit als Managementherausforderung, in:Schnedlitz, P.; Buber, R.; Reutterer, T.; Schuh, A.; Teller, C. (eds.): Innovationen in Marke-ting und Handel, Wien: Linde Verlag, pp. 92-116.
Homburg, C.; Koschate, N.; Hoyer, W.D. (2005): Do Satisfied Customer Really Pay More? AStudy of the Relationship Between Customer Satisfaction and Willingness to Pay, in: Jour-nal of Marketing, Vol. 69, No. 2, pp. 84-96.
92 European Retail Research, Vol. 24, Issue I, pp. 71-96
Homburg, C.; Stock-Homburg, R. (2008): Theoretische Perspektiven zur Kundenzufriedenheit,in: Homburg C. (ed.): Kundenzufriedenheit, Konzepte-Methoden-Erfahrungen, 7th ed.,Wiesbaden: Gabler, pp. 17-52.
Kaapke, A.; Hudez, K. (2001): Der Einsatz des Kano-Modells zur Ermittlung von Indikatorender Kundenzufriedenheit – dargestellt am Beispiel der Anforderungen von Senioren anReisebüros, in: Müller-Hagedorn, L. (ed.): Kundenbindung im Handel. 2nd ed., Frankfurt amMain: Deutscher Fachverlag, pp. 179-191.
Kano, N.; Seraku N.; Takahashi F.; Tsuji S. (1984): Attractive quality and must-be quality, in:Hinshitsu: The Journal of the Japanese Society for Quality Control, (April), pp. 39-48.
Kasavana, M.L. (2005): Rising consumer preference for dashless purchasing creates newopportunities, in: Automatic Merchandiser, Vol. 47, No. 4, pp. 26-35.
KPMG (2006): Trends im Handel 2010. Online im Internet: http—www.kpmg.de-library-pdf_060331_Trends_im_Handel_2010_de.pdf, accesed on December 12, 2006.
Lauer, T. (2004): Bonusprogramme: Rabattsysteme für Kunden erfolgreich gestalten; Berlin:Springer.
Lee, J.; Kwon, K.-N. (2002): Consumers’ Use of Credit Cards: Store Credit Card Usage as anAlternative Payment and Financing Medium, in: The Journal of Consumer Affairs, Vol. 36,No. 2, pp. 239-262.
Lee, M.C.; Newcomb, J. (1996): Applying the Kano Methodology in Managing NASA’sScience Research Program, in: Center For Quality of Management Journal, Vol. 5, No. 3, pp.13-20.
Lee, Y.-H.; Chen, T.-L. (2006): A Kano Two-dimensional Model in Taiwan’s hot Spring HotelsService Quality Evaluations, in: Journal of American Academy of Business, Cambridge,Vol. 8, No. 2, pp. 301-306.
Liebmann, H.-P.; Zentes, J.; Swoboda, B. (2008): Handelsmanagement, 2nd ed., München: Vahlen.
Löfgren, M.; Witell, L. (2005): Kano’s Theory of Attractive Quality and Packaging, in: TheQuality Management Journal, Vol. 12, No. 3, pp. 7-20.
Löfgren, M.; Witell, L. (2007): Classification of quality attributes, in: Managing Service Qual-ity, Vol. 17, No. 1, pp. 54-73.
Matzler, K.; Bailom, F. (2009): Messung von Kundenzufriedenheit, in Hinterhuber, H.; Matzler,K. (eds.): Kundenorientierte Unternehmensführung: Kundenorientierung, Kundenzufrieden-heit, Kundenbindung, 6th ed., Wiesbaden: Gabler, pp. 267-298.
Matzler, K.; Fuchs, M.; Schubert, A.K. (2004): Employee Satisfaction. Does Kano’s ModelApply? in: Total Quality Management, Vol. 15, No. 9-10, pp. 1179-1198.
Matzler, K.; Hinterhuber H.H. (1998): How to make product development projects more suc-cessful by intefrating Kano’s model of customer satisfaction into quality function deploy-ment, in: Technovation, Vol. 18, No. 1, pp. 25-38.
Matzler, K.; Hinterhuber H.H.; Bailom, F.; Sauerwein, E. (1996): How to delight our customers,in: Journal of Product & Brand Management, Vol. 5, No. 2, pp. 6-18.
Matzler, K.; Stahl, H.K.; Hinterhuber, H.H. (2009a): Die Customer-Based View der Unterneh-mung, in: Hinterhuber; Matzler (Hrsg.): Kundenorientierte Unternehmensführung: Kunden-orientierung, Kundenzufriedenheit, Kundenbindung, 6th ed., Wiesbaden: Gabler, pp. 3-32.
Walter, E.; Steyrer, C.; Wiesel, S. 93
Matzler, K.; Sauerwein, E.; Stark, C. (2009b): Methoden zur Identifikation von Basis-, Leis-tungs- und Begeisterungsfaktoren, in: Hinterhuber; Matzler (Hrsg.): Kundenorientierte Unter-nehmensführung: Kundenorientierung, Kundenzufriedenheit, Kundenbindung, 6th ed., Wies-baden: Gabler, pp. 319-344.
Meffert, H. (2008): Kundenbindung als Element moderner Wettbewerbsstrategien, in: Bruhn, M.(ed.): Handbuch Kundenbindungsmanagement: Strategien und Instrumente für ein erfolg-reiches CRM, 6th ed., Wiesbaden: Gabler, pp. 157-180.
Meyer-Waarden, L. (2007): The effects of loyalty programs on customer lifetime duration andshare of wallet, in: Journal of Retailing, Vol. 83, No. 2, pp. 223-236.
Mittal, V.; Wagner, K. (2001): Satisfaction, Repurchase Intent, and Repurchase Behavior:Investigating the Moderating Effects of Customer Characteristics, in: Journal of MarketingResearch, Vol. 38, pp. 131-142.
Moore, M.; Fairhurst, A. (2003): Marketing capabilities and firm performance in fashion retail-ing, in: Journal of Fashion Marketing and Management, Vol. 7, No. 4, pp. 386-397.
Mooslechner, P.; Stix, H.; Wagner, K. (2006): Wie wird in Österreich bezahlt? Ergebnisse einerUntersuchung zur Struktur der Zahlungsmittelverwendung privater Haushalte im Kontextder geldpolitischen Analyse, in: Berichte und Studien, OeNB, Vol. 2, pp. 120-145.
Müller-Hagedorn, L. (2006): Innovationen im Handel. Zur Entwicklung der Handelswissen-schaften, in: Schnedlitz, P.; Buber, R.; Reutterer, T.; Schuh, A.; Teller, C. (eds.): Innovatio-nen in Marketing und Handel, Wien: Linde Verlag, pp. 35-46.
Nilsson-Witell, L.; Fundin, A. (2005): Dynamics of service attributes: a test of Kano’s theory ofattractive quality, in: International Journal of Service Industry Management, Vol. 16, No. 2,pp. 152-168.
Noble, S.M.; Phillips, J. (2004): Relationship hindrance: why would consumers not want a rela-tionship with a retailer?, in: Journal of Retailing, Vol. 80, No. 4, pp. 289-303.
Penz, E.; Meier-Pesti, K.; Kirchler, E. (2004): „It’s practical, but no more controllable“: Socialrepresentations of the electronic purse in Austria, in: Journal of Economic Psychology, Vol.25, pp. 771-787.
Ploss, D. (2002): Kundenbindung: Kundenkarten sind im Kommen, in: acquisa, Vol. 6, pp. 28-30.
Pohlmann, J. (2003): Coupon-Marketing. Kunden finden und binden mit Rabatten. Kunden-karten. Bonuspunkte. Spargutscheine. Frankfurt am Main: Redline Wirtschaft.
Reinartz, W.J.; Kumar, V. (2000): On the Profitability of Long-Life Customers in a Noncontrac-tual Setting: An Empirical Investigation and Implications for Marketing, in: Journal of Mar-keting, Vol. 64, No. 4, pp. 17-35.
Ritter, N. (2002): Kleine Karte, große Wirkung. Marktpotenzial von Kartensystemen; Handels-journal, No. 8, pp. 54-55.
Sauerwein, E. (1999): “Experiences with the reliability and validity of the Kano-method: com-parison to alternate forms of classification of product requirements”. Paper presented atTransactions of the 11th Symposium on QFD, QFD Institute, Novi, MI, 12-18 June.
Sauerwein, E. (2000): Das Kano-Modell der Kundenzufriedenheit - Reliabilität und Validitäteiner Methode zur Klassifizierung von Produkteigenschaften; Wiesbaden: Gabler.
Schweitzer, S. (2003): Kundenkarten und Kundenclubs. Grundlagen, Konzepte, Düsseldorf:VDM-Verl. Müller.
94 European Retail Research, Vol. 24, Issue I, pp. 71-96
Seebacher, R. (2007): Nicht ohne meine Karte, in: Bestseller, No. 4, pp. 78-80.
Teichmann, J. (2006): Kundenkarten. Ausweg aus den Preiskämpfen des Einzelhandels, Mar-burg: Tectum Verlag.
Ting, S.-C.; Chen, C.-N. (2002): The asymmetrical and non-linear effects of store quality attrib-utes on customer satisfaction, in: Total Quality Management, Vol. 13, No. 4, pp. 547-569.
Tomczak, T.; Reinecke, S.; Dittrich, S. (2008): Kundenbindung durch Kundenkarten und -clubs,in: Bruhn, M. (ed.): Handbuch Kundenbindungsmanagement: Strategien und Instrumentefür ein erfolgreiches CRM, 6th ed., Wiesbaden: Gabler, pp. 325-345.
Tontini, G. (2007): Integrating the Kano Model and QFD für Designing New Products, in: TotalQuality Management, Vol. 18, No. 6, pp. 99-612..
Vavra, T.G. (1997): Improving Your Measurement of customer satisfaction, a guide to creating,conducting, analyzing, and reporting customer satisfaction measurement programs; Mil-waukee, Wis.: ASQ Quality Press.
Wieder, M. (2009): Kundenbindungsinstrumente im Handel – Erfolgspotentiale und Umsetzungs-voraussetzungen, in: Hinterhuber, H.; Matzler, K. (eds.): Kundenorientierte Unternehmens-führung: Kundenorientierung, Kundenzufriedenheit, Kundenbindung, 6. Auflage, Wies-baden: Gabler, pp. 621-637.
Yu, Y.-T.; Dean, A. (2001): The Contribution of emotional satisfaction to consumer loyalty, in:International Journal of Service Industry Management, Vol. 12, No. 3, pp. 234-250.
Ziliani, C.; Bellini, S. (2004): From loyalty cards to micro-marketing strategies: Where isEurope’s retail industry heading? in: Journal of Targeting, Measurement and Analysis forMarketing, Vol. 12, No. 3, pp. 281-289.
Walter, E.; Steyrer, C.; Wiesel, S. 95

Clustering Customer Contact Sequences -Results of a Customer Survey in Retailing
Sascha Steinmann and Günter Silberer
AbstractWe used a sequence alignment method to cluster customers (N = 132) of a branch of a Germanconsumer electronics retailer according to the sequence of the customers’ contacts with its dif-ferent marketing channels (e.g. store, homepage, newspaper advertising) during the whole pur-chase process. In doing so, we obtained three clusters in a short sequences and a long sequencessegment. Results reveal differences in the customers’ behaviour concerning the customer con-tacts and their functions in the whole purchase process, as well as between the identified cus-tomer segments. Customer segmentation based upon demographic or psychographic variableswould not have been able to enrich knowledge of the customers in this manner.
KeywordsCustomer Contact, Contact Sequence, Sequence Analysis, Customer Segmentation
Sascha Steinmann (corresponding author)Institute of Marketing and Retailing, Department of Business Administration, University of Göttingen,Göttingen, Germany(Tel: +49 551 39 7409; E-Mail: [email protected]).
Günter Silberer Institute of Marketing and Retailing, Department of Business Administration, University of Göttingen,Göttingen, Germany.
Received: August 31, 2009Revised: March 14, 2010Accepted: March 15, 2010
EUROPEAN
RETAIL
RESEARCHVol. 24, Issue I, 2010, pp. 97-120
1. Introduction
Knowledge of ones customers is a strategic success factor for any retailer or service provider.
The fundamental elements for the attainment of customer knowledge are the customer contacts
at the different marketing and distribution channels of the retailer’s multi channel marketing
(Payne/Frow 2005). Not only are the number, kind and function of the customer contacts rele-
vant to this but also the sequence of those contacts during all phases of the purchase process.
Contact sequences have been practically ignored in previous practice-oriented and scientific
research projects, especially any to consider the problems of collecting, connecting and analyz-
ing the relevant data from the different marketing and distribution channels to present a single,
unified view of customers (Payne/Frow 2004). However, it can be assumed that customer con-
tact sequences are of great relevance to retail marketing. For example, it can be expected that
different customer contact sequences are accompanied by different product purchases and that
different customers have different contact sequences according to their individual channel
behaviour. Knowledge of these connections facilitates the purposeful control of customer con-
tacts by the retailer and thus extends his/her commercial possibilities to communicate and inter-
act with customers within the bounds of retail marketing. Furthermore, such sequences provide
important insights into potential cross-channel synergies (Verhoef/Neslin/Vroomen 2007).
Therefore, they also facilitate crucial information for monitoring marketing strategy. Hence,
analyzing sequences of customer contacts could provide crucial insights to the retailer into cus-
tomer behaviour in the multi channel marketing and distribution system, as well as their needs
and preferences over time, as their use has become routine in the purchase process (Ran-
gaswamy/Bruggen 2005). Therefore, this article contributes to the body of literature by address-
ing how customer contact sequences can be measured and analyzed. This initial study on cus-
tomer contacts and contact sequences in retailing is also essential to show that such contact
sequences can form the basis for customer segmentation.
2. Literature Review and Conceptual Background
2.1. Customer Contact Points and Customer Contacts in Retail
It is increasingly common for firms to employ online distribution channels alongside their
offline distribution channels and further marketing channels and to rely on these complex com-
binations as sources of competitive advantage to better serve their customers’ needs and prefer-
ences (Geyskens/Gielens/Dekimpe 2002). In such environments, many customers have become
multi-channel users. Contacts between the firm and themselves are realized at different contact
points (e.g. store, agency, homepage) in different phases of the purchase process. Therefore,
there are many opportunities to establish contacts between a supplier and its customers in the
different process stages.
98 European Retail Research, Vol. 24, Issue I, pp. 97-120

In retailing, we can differentiate pre-purchase, purchase and post-purchase phases. Further-
more, we can distinguish the variety of contact points (personal, semi-personal and impersonal
contacts) (Silberer/Steinmann/Mau 2007). Payne and Frow (2004) define these categories of
customer contacts as a continuum of forms ranging from the physical to the virtual. According
to Daft and Lengel (1984) customer contacts can be distinguished by the relative richness of
information they provide, from the leanest to the richest. Richness is determined by the medi-
um’s capacity for immediate feedback, multiple cues and senses involved, language variety, and
personalization (Rice 1992). Thus, face-to-face contacts will be the richest contact point, fol-
lowed by telephone contacts, electronic mail and websites; then to different kinds of traditional
marketing measures, like contacts with newspaper or radio advertising.
Customers’ price expectations, the product group, and convenience are regarded as determi-
nants for channel choice (Fox/Montgomery/Lodish 2004). Balasubramian et al. (2005) state
that the goals a customer tries to achieve (e.g. economic goals, self-affirmation, socialization
etc.) during his or her shopping experience affect channel choice. Other factors are the distance
a customer lives from a store (Thomas/Sullivan 2005) or other situational variables, e.g. time of
day and presence or absence of others (Belk 1974; Nicholson/Clarke/Blakemore 2002), switch-
ing costs and risk aversion (Dholakia/Zhao/Dholakia 2005), as well as customer demographics
(Kumar/Venkatesan 2005).
Goff, Bellenger and Stojack (1997) as well as van Dolen et al. (2002) show that contacts
between a customer and the sales staff could enhance customer satisfaction with the retailer.
The results of Bove and Robertson (2005) show the impact of such contacts on customer com-
plaints. Raghubir (2004) demonstrates that in the pre-purchase phase a customer contact with
coupons could have positive effects on the evaluation of product quality and purchase intention.
Further research shows that contacts with retailer advertising has an impact on store traffic and
sales volume (Gijsbrechts/Campo/Goossens 2003), and on patronage intention as well (Day/
Stafford 1997). The findings of Silberer and Mau (2006) show that customer contacts after the
purchase, the advice given, and the price level of the retailer also affect customer satisfaction.
This is only a brief overview regarding past and current research, but the studies mentioned
above are representative of many others published on the effects of customer contacts. The
results show that a single contact between a customer and a retailer can affect customer satisfac-
tion and purchase behaviour.
2.2. Functions and Importance of Customer Contacts
Every customer contact fulfills different functions in the various process phases. Consequently
speech, sales, and service functions can be distinguished (Simons/Bouwman 2004). Therefore,
the functions of customer contacts in different channels range from accessing general and selec-
tive information regarding the desired product or service, price comparisons and purchasing; up
Steinmann, S.; Silberer, G. 99

to using different kinds of customer services, to advisory and complaint activities as well.
Hence, during the contact, not only is purchasing a product of relevance to the customer, but so
are information and communication prior to, during and after the purchase (Wallace/Giese/
Johnson 2004). In the process, according to the media-richness theory (Daft/Lengel 1984), cus-
tomers will subsequently find it easier to establish contact with a supplier in a way that best fits
their needs. This requires the respective channels and their combination to be capable of fulfill-
ing customer needs and preferences concerning the desired functionality in these different
process phases.
According to Payne, Bettman and Johnson’s (1993) concept of adaptive decision making, a cus-
tomer shifts between the pre-purchase to the purchase phase, and from an attribute-based search
to an alternatives-based search, as she/he progresses in the decision making process. Thus, cus-
tomers become less focused on information gathering and more focused on comparing the alter-
natives they have decided to consider. In the case of technically advanced products like notebook
computers, these alternatives are complex bundles of attributes and benefits that a customer will
need to process. In cases where many relevant aspects of the decision cannot be controlled, cus-
tomers seek some kind of help in their decision making, and hence customers are more likely to
realize personal contacts with the sales staff. Furthermore, they will use the desired benefit as
the basis to evaluate the characteristics of the different contact points in the purchase process
(Frambach/Roest/Krishnan 2007). However, there are channel related differences in fulfilling
customers’ needs and preferences across the purchase process, including richness of information
presented (Daft/Lengel 1984) and accessibility or convenience (Ward 2001). For example, on
the internet products cannot be physically examined, which leads to less product information
than in the case of brick-and-mortar stores (Venkatesan/Kumar/Ravishankar 2007). Therefore,
the internet is often considered to be risky for purchasing (Alba et al. 1997). Conversely, offline
channels are characterized by, among other things, richer information on the product (Venkate-
san/Kumar/Ravishankar 2007). The results of Verhoef, Neslin and Vroomen (2007) show that
customers can benefit from channel related differences within the purchase process by using
channels according to their individual channel characteristics (see also Silberer/Steinmann/Mau
2007) because channels differ not only in their functionality but also in their inability to fulfill
individual customer needs to the same extent across the different process phases (Balasubrami-
an/Raghunathan/Mahajan 2005). Hence, the initiation and handling of purchasing processes can
occur in different channels according to the individual channel’s behaviour.
Concerning the purchase of a notebook, we can expect personal contacts in offline channels to
be more likely than semi-personal or impersonal contacts because personal advisors are in the
best position to help the customer identify and explain important aspects in the pre-purchase
and purchase phases. Because of the limited functionality of the mainly impersonal contacts in
online channels compared to the face-to-face contacts of offline channels, many customers
commonly use the internet only as an information source in the purchase process. In the case of
100 European Retail Research, Vol. 24, Issue I, pp. 97-120
complex products or services especially, customers have come to categorize it in their minds as
an important information source, not as just a shopping resource (Balasubramian/Raghunathan/
Mahajan 2005; Verhoef/Neslin/Vroomen 2007).
2.3. Customer Segmentation
For our study, research regarding different approaches to customer segmentation is of particular
interest. Ruiz, Chebat and Hansen (2004); Sinha and Uniyal (2005); and Ganesh, Reynolds and
Luckett (2007) provide an overview of a large number of empirical studies on this topic. The
procedure for the formation of customer segments can thus be divided into two different
approaches; with demographic variables (e.g. age and gender) on the one hand, and on the oth-
er psychographic variables (e.g. motives or attitudes) are drawn upon for the segmentation. By
doing so, the constituted customer groups reveal who is buying in the stores investigated and
why. The customer’s actual buying behaviour during and after the purchase, however, is hardly
taken into account; i.e. how the customers inform themselves prior to purchase, how the pur-
chase is carried out in the store, and how the relationship between the retailer and the customer
is organized after the purchase.
Only a few studies take behaviour of the customers into account. Kim and Park (1997) classified
the customers of food stores by the frequency of their visits; i.e. related to a certain period, not to
a particular product purchase. They found “random shoppers” and “routine shoppers”. Bloch,
Ridgway and Davidson (1994); Ruiz, Chebat and Hansen (2004), and Sinha and Uniyal (2005) as
well, used behaviour during a shopping trip, i.e. related to a visit in one store or shopping mall; as
a basis to form customer segments. When Bloch, Ridgway and Davidson (1994); and Ruiz,
Chebat, and Hansen (2004) asked shoppers about their behaviours, each identified four different
segments in this way - Bloch/Ridgway/Davidson 1994: “Mall Enthusiasts”, “Traditionalists”,
“Grazers” and “Minimalists”; Ruiz/Chebat/Hansen 2004: “Recreational shoppers”, “Full experi-
ence shoppers”, “Browsers” and “Mission shoppers”. Sinha and Uniyal (2005) observed behav-
iour and derived six customer segments: “Choice optimiser”, “Pre-Mediated”, “Economising”,
“Seeking support”, “Low information seekers” and “Recreational”. Although they had partially
different results in the end, these studies show the usefulness of customer segmentation based on
customer behaviour. There are, however, two essential aspects not taken into account. First, the
specified studies only inspect behaviour in the store or mall. It should be expected that different
behaviour in the store also reflects different behaviour prior the purchase and after the purchase.
The results of Sinha and Uniyal (2000) speak well for this assumption. According to this study
experienced customers act more systematically in the store and are in less need of information,
which had to be a reflection of their behaviour prior to purchase. The second aspect deals with the
variables used in the segmentation analysis. To consider only the behaviour in one specific chan-
nel leads to neglect of other contacts between shoppers and the retailer. But, as was shown by the
studies mentioned before, such contacts are important influencing factors in customer behaviour.
Steinmann, S.; Silberer, G. 101
2.4. Customer Contact Sequences
According to Hägerstrand (1970) customer behaviour can be viewed as a sequence of inter-
dependent actions over time. However, customer behaviour in the studies mentioned is most-
ly treated as a chain of independent activities. Thus, the sequential order and obvious relations
of the activities are often neglected. Therefore, Abbott’s (1995, p. 94) statement that, in social
science “we assume intercase independence even while our theories focus on interaction” is
also largely true for marketing research concerning the segmentation of customers with
regard to their individual behaviour across the purchase process. Therefore, in the aforemen-
tioned approaches important aspects reflecting the customer’s behaviour are not addressed.
By tracking behaviour across channels, firms can improve their understanding of their cus-
tomers’ decision-making and develop a basis for creating strong relationships and improving
retention (Dholakia/Zhao/Dholakia 2005). The actual behaviour of the customers over a peri-
od of time is taken into account in the customer segmentation process through the use of cus-
tomer contact sequences. This facilitates a differentiation of the customers which is not possi-
ble on the basis of demographic or psychographic variables. Such insights are an important
confirmation as to the usefulness of customer segmentation regarding the customer contact
sequence.
The sequential behaviour of the customers throughout the purchase process and through differ-
ent channels has barely been taken into account in the formation of segments. For marketing
purposes, Larson/Bradlow/Fader (2005) for example used a sequence-analytical clustering
approach to evaluate the shopping behaviour in a supermarket for the foundation of customer
segments. Bargemann/Joh/Timmermans (2002) analysed the vacation histories of tourists to
develop a typology of vacation behaviour of Dutch customers with a specific sequence align-
ment method. Hay/Wets/Vanhoof (2003) used a sequence analytical approach to mining web
usage to cluster website visitors according to their navigation patterns. Segmentation of this
kind can give a retailer or service provider important insights into the requirements, preferences
and behaviour of the customers over a period of time.
3. Empirical Study: Customer Segmentation Basedupon Customer Contact Sequences
3.1. Measures
The aim of our segmentation process is to identify powerful customer clusters which are very
similar with regard to their individual behaviour. We investigated customer contacts (e.g. adver-
tising, retailers’ homepage, store etc.) their functions (general and selective information, price
comparison, purchase, advisory and complaining) and importance to the customers as well as
102 European Retail Research, Vol. 24, Issue I, pp. 97-120
the sequence of the customer contact regarding three different phases of the purchase process
- pre-purchase, purchase, and post-purchase - with a branch of a German consumer electronics
retailer. The importance of the customer contacts was ranked on a six-point rating scale ranging
from 1 = entirely unimportant to 6 = very important. To ensure the accurate recording of cus-
tomer contacts and their function and importance in all process phases, only those customers
who had actually purchased a product in one store in the 6 months prior to the study that they
could remember well were recruited.
Customer contacts and contact sequences were recorded in personal interviews based upon a
structured questionnaire. To support the recollection of events dated far back in time a process
was chosen patterend from cognitive psychology (Ericsson/Simon 1980; Anderson 1995). The
questionnaire leads the customer through her/his memories step by step - starting with events
that are most accessible because they are the closest in time to the interview (the post-purchase
phase) - up to those situations that are initially difficult to remember without any support
because they date further back (the purchase and pre-purchase phases). If instead the customer
had been asked first for contacts made prior to the purchase, he/she would have had to recall
those events dated furthest away - an attempt in which he/she might not succeed. In contrast
the events and contacts after the purchase are most clearly recalled - they date back the shortest
period. The first questions were therefore directed to events in the post-purchase phase. Closely
connected with events after purchase are those situations in memory that lie temporally prior,
i.e. during the purchase. If the customer remembers the post-purchase phase, events during the
purchase will be more present. In the second place therefore the customer contacts during the
purchase phase were surveyed. Pursuing the same strategy, customer contacts of the pre-pur-
chase phase were recorded in a third step. The final questionnaire also covered possible determi-
nants (previous customer experience with the retailer, price category, product category, internet
usage, and demographic variables) as well as final variables (customer satisfaction, intention of
recommendation, intention of repeat purchase, trust, and perceived risk) and the sequence of
customer contacts, their functions and importance across the whole purchase process.
3.2. Procedure
A total of N = 132 customers of the retailer took part in the survey. The customers were
approached at the central entrance and exit of the store while they were leaving. In cases where
they were interested in participating in the interview, it was clarified as to whether they could
remember a purchase within the last six months. Every participant obtained non-alcoholic
drinks, chocolates, and other incentives. In the sample, women had a representation of 49.2%.
The average age of those interviewed was M = 31.3 (SD = 12.2) years. About one third (32.3%)
of the customers bought PC hardware and software as well as IT-accessories, electrical appli-
ances and accessories were purchased by 22% of the people in our sample. Other frequently
purchased product categories were sound carriers and DVDs (13.6%), office supplies and
Steinmann, S.; Silberer, G. 103
telecommunication (11.4%), consumer electronics (10.6%) as well as digital cameras (6%).
With regard to the price category of the products bought, 53% of the customers in our sample
spent no more than 50 Euros. Slightly over one third (34.1%) in our sample spent up to 500
Euros and 12.9% of the customers paid more than 500 Euros.
4. Results: Customer Contacts, Contact Sequences and Sequence Clusters
4.1. Customer Contacts
Considering all three phases every customer in our sample visited the store at least once in the
purchase process for purchasing. The store was also the most important contact point according
to the customers (M = 5.17; SD = 1.02) and was, besides the purchase function, frequently used
for obtaining general information concerning the different supplies of the retailer (42.4%) and
select information on the products in the evoked set (23.5%) as well as for price comparison
(15.2%). In general, taking all phases of the purchase process into consideration the customer
contacts at different contact points mostly had the function of providing general information
(86.4%) and for price comparison (86.4%). Other often used functions were for selective infor-
mation (76.6%) and advisory functions (94.4%).
Besides this, other frequently realized customer contacts in the whole purchase process are the
personal contacts with the sales staff (64.4%), especially in the purchase phase which were most-
ly realized for selective information (63.5%) and general information (18.8%). Surprisingly, these
contacts were of significantly lower importance to the customers (M = 5.00; SD = 1.06) compared
to those with the store (t = -2.53; p < .05). Concerning contacts with different kinds of the retail-
ers’ advertising in all phases of the purchase process, the customers mostly realized contacts with
newspaper advertising (59.1%), TV-advertising (42.4%) and advertising at the point-of-sale
(39.4%). Regarding the advertising contacts, newspaper advertising was most important to the
customers (M = 4.61; SD = 1.15) and was mainly used for general information (42.3%) as well as
for price comparison (28.2%). The realized contacts with the retailer’s homepage (22%) mostly
had the function of providing general information (35.7%) and for price comparison (28.6%).
These contacts were of significantly lower importance compared to the realized contacts (15.2%)
with other websites (Homepage: M = 2.75, SD = .97; other websites: M = 4.73, SD = .98; t = 3.14;
p < .05). The contacts with other websites mostly had the function of providing selective informa-
tion concerning the products in the evoked set (47.6%) as well as for price comparisons (23.8%).
One could therefore assume that the perceived functionality of the retailer’s homepage is much
lower as compared to that of other websites. Slightly more than one fourth (25.4%) of the cus-
tomers realized contacts with the service staff of the retailer. The service staff was mostly contact-
ed in the post-purchase phase for advise and complaints (97.1%). As expected, these contacts
were of high importance to the customer (M = 1.59; SD = .86).
104 European Retail Research, Vol. 24, Issue I, pp. 97-120
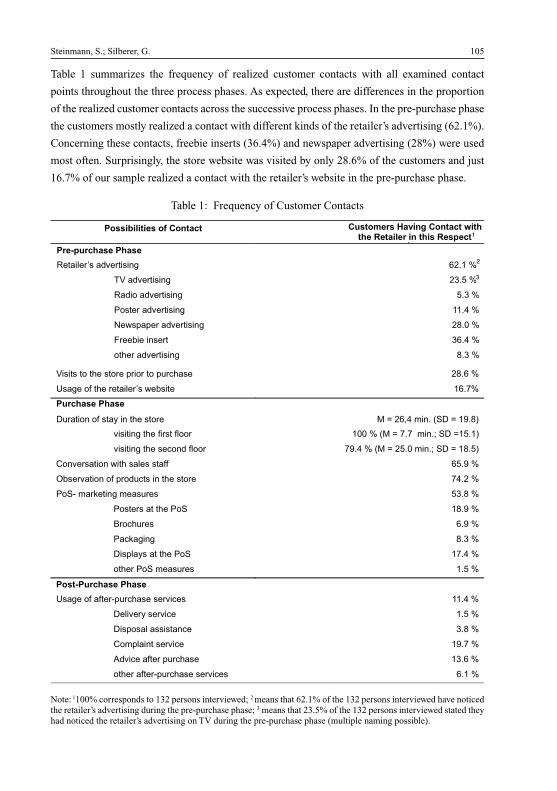
Table 1 summarizes the frequency of realized customer contacts with all examined contact
points throughout the three process phases. As expected, there are differences in the proportion
of the realized customer contacts across the successive process phases. In the pre-purchase phase
the customers mostly realized a contact with different kinds of the retailer’s advertising (62.1%).
Concerning these contacts, freebie inserts (36.4%) and newspaper advertising (28%) were used
most often. Surprisingly, the store website was visited by only 28.6% of the customers and just
16.7% of our sample realized a contact with the retailer’s website in the pre-purchase phase.
Steinmann, S.; Silberer, G. 105
Note: 1100% corresponds to 132 persons interviewed; 2 means that 62.1% of the 132 persons interviewed have noticedthe retailer’s advertising during the pre-purchase phase; 3 means that 23.5% of the 132 persons interviewed stated theyhad noticed the retailer’s advertising on TV during the pre-purchase phase (multiple naming possible).
������������ � ���� �� �������� � ��������� ������������� ������ ���� �����
�������� ���� �
����������� ������� ���� ��
�� �� ������� �������
�������� ������� ��� �
�������� ������� ������
��� � ����� ������� �!�" �
#������ ����� ������
��$�� �� ������� !����
������ ����� ������� ����� ��� ���� �
����������������� ����� �����
������� ����
���������� �������������� !���"#�$����%&��!��'��(
)�������������������� �** ��% !���� $���+�&� !�,��(
)������������ ��-����� �'�#���% !��,�*�$���+ &��!����,(
.��)����������� ���� ����� �,�'��
/��)�����������-� �� ��������� �#�� �
0�&1�$�2�����$���� ,3����
0���� ������0�& ���' �
4� ��� ��'��
0� 2����� ��3��
�������� �� ���0�& ���#��
����0�& $���� ��, �
����������� ����
�����������1�� �����)� � ���#��
���)� �)� ��, �
����������������� 3����
.�$������ �)� �'�� �
5-)� ������ ��� �3����
�������1�� �����)� � �����
�������� �� ������������ ����������� ��� � �� � ��������
Table 1: Frequency of Customer Contacts
1
2
3
During the purchase phase 65.9% of the customers contacted the sales staff for general and
selective information on the desired product as well as for price comparison and consulting. But
nearly three fourths of them (74.2%) also compared the products by themselves. Stated contact
with different kinds of marketing measures at the point-of-sale is surprisingly high (53.8%).
Contacts in the post-purchase phase were considerably low (11.4%). The contacts in this phase
were mostly realized for complaints as well as for advice after the purchase.
4.2. Contact Sequences
In addition to the analysis of individual customer contacts in the various phases of the purchas-
ing process, we can also determine the sequence of the customer contacts using the available
data, namely the sequence of the customer contacts with the different contact points regarding
all phases of the purchase process. First, it is noticeable that the number of customer contacts
with the retailer is very heterogeneous amongst the customers (a min. of 1 contact to a max. of
20 contacts).
In all, it appears that contact with the sales staff was sought most frequently following contact
with the store (76 times). The sequence newspaper advertising and store was entered 50 times.
Other contact sequences which appeared frequently were store and PoS marketing measures, as
well as sales staff and service staff (22 times each). As expected, in consideration of three suc-
cessive customer contacts, the combination of store, sales staff and service staff (17 times) and
the combination of newspaper advertising, store and sales staff (14 times) were named the most
frequently.
To get deeper insights of the customers’ behaviour across all phases of the purchase process we
calculated the proportion of a realized customer contact as a relative size (basis = sequence
length) in relation to all realized contacts of a customer contact sequence. As expected, the
results show that the contacts with the store had the highest proportion in a customer contact
sequence when realized (39.9%), followed by contacts with newspaper advertising and freebie
inserts (38.4%). In this context, contacts with the sales staff had a proportion of 22.7% and the
retailer’s homepage was used in only 13.9% of customer contact sequences realized.
4.3. Sequence Alignment and Sequence Clustering
The Sequence Alignment Method (SAM) was originally developed in molecular biology to
compare DNA or protein sequences (Sankoff/Kruskal 1983; Abbott 1995). The idea of the
SAM is to equalize two different sequences with regard to the operations of insertion, deletion
and substitution. Mostly the weight of 1.0 is assigned to the operations of insertion and deletion,
and for substitutions the sum of the consecutive operations of deletion and insertion (Gusfield
1997; Joh et al. 2002). Usually there are different ways to transfer one sequence to another with
106 European Retail Research, Vol. 24, Issue I, pp. 97-120
the aforementioned operations, therefore the minimal sum of the weighted operations - the
Levenshtein distance (Levenshtein 1966) - is commonly used as a similarity measure for the
sequences considered.
Within the scope of this study, the customer contact sequence clusters are identified using
the aforementioned Levenshtein distance and the Ward-Method. The advantage of being able
to compare customer contact sequences which are different in length can be, under certain con-
ditions, a disadvantage of the Levenshtein distance. If the distance between two sequences
which differ greatly in length is determined, the result is essentially influenced by the different
number of contacts and the associated operations. The information contained in the sequences
is ignored to a large extent. To avoid such distortions in the segmentation, the whole sample
(N = 132), which is very heterogeneous with regard to the length of the customer contact
sequences (min(length) = 1 to max (length) = 20), was dichotomized with a median split (MD =
5). Consequently, we obtained a segment with “short sequences” (� 5 contacts; n1
= 72) and
a segment with “long sequences” (> 5 contacts; n2
= 60). The customer clusters were then inves-
tigated with the customer contact sequences as constituent variables within both segments
by way of a cluster analysis (Ward-Method) and using the Levenshtein distance. The results
of our cluster analysis show that the differentiation into three clusters in the “short sequences”
segment and four clusters in the “long sequences” segment proved to be the optimal cluster
solution.
A glance at the results of the cluster analyses in both segments shows that only 6 people
comprise a cluster in the “long sequences” segment. A further cluster analysis using the single-
linkage-method supports the assumption that the members of this cluster are possible outliers.
Consequently, these customers are not considered for further analyses.
4.3.1. Description of the Identified Clusters Using Constituent Variables
In order to describe the clusters, the active variables that have entered the cluster analysis are
cited. The clusters identified in both segments are therefore described using the customer con-
tact sequences (centroids) typical for them (see Table 2). For each cluster in both segments the
cited centroid corresponds to a surveyed customer contact sequence.
The typical representative of the first cluster from the “short sequences” segment realized only
one contact, i.e. with the “store”. The people in cluster 2 are more likely to have had their first
contact with the “store”, where their interest was aroused by an item (the offer) and they decid-
ed to make a purchase following consultation with the “sales staff ”. The customer’s attention in
cluster 3 is drawn to the retailer and a particular product through “newspaper advertising”, and
then they go into the store and purchase the desired product after consultation with the “sales
staff ”.
Steinmann, S.; Silberer, G. 107

The customers in cluster 1 of the “long sequences” segment sought further information on the
internet after the initial contact with “newspaper advertising”, went into the “store” and spoke
to the “sales staff ” to find out more about the short-listed products. A purchase had not
occurred at this stage. Only after an additional visit to the “store”, combined with a consultation
with the “sales staff ”, was the decision made to buy. The centroids of clusters 2 and 3 differ less
significantly. Both were attracted to the retailer or a particular product by “TV advertising” and
“newspaper advertising” and then found their way into the “store”. While the customers in clus-
ter 2 may have sought consultation with the “sales staff ” and then decided their purchase intent,
the representatives from cluster 3 returned to the “store”, found out more through consultation
with the “sales staff ” and eventually decided to make a purchase. We may assume from the con-
tacts with the “service staff ” in both clusters that the purchased product may have been defec-
tive or support was necessary after purchase due to operational problems.
The initial contact between retailer and customer is particularly significant for the development
of their relationship in the purchasing process. Consequently, we also examined the distribution
of the initial customer contacts over the customer contact points in addition to the centroids: the
majority of the customers from cluster 1 (86.2%) in the “short sequences” segment had the ini-
tial contact with the “store” or “PoS advertising”. None of the customers from this cluster indi-
cated “newspaper advertising” or “PoS advertising” as their initial contact. While the majority
of the customers (83.3%) from cluster 2 entered the “store” as the initial contact, “newspaper
advertising” is the first contact for most customers in cluster 3 (72.0%). None of the customers
from this cluster indicated “newspaper advertising” or “PoS advertising” as their initial contact.
All differences are significant during a chi-square test (p < .05).
In the “long sequences” segment, the most common initial contacts in cluster 1 proved to be
“newspaper advertising” (33.3%) and the “store” (25.0%). In cluster 2, the initial contact above
all took place with “TV advertising” (50.0%) or “newspaper advertising” (33.3%). The same
initial contacts, “TV advertising” and “newspaper advertising”, can also be identified in cluster
108 European Retail Research, Vol. 24, Issue I, pp. 97-120
������� ��� �� �����
�������� ����� �� �� ��
������� � -����� �� �� �������������
������� � -����� �� ��������� �������������� ��� ����� �����
��������� ��������
������� -����� �� ��������������������� ���������� �������� �� ��
����������� � �� �������������
������� � -����� �� �� ��������������������������������� �� ��
������ ����� �������� ����� � �������������
��������� ����� �� ������������������������������������� ��
��� �� ����������� � ������������
Table 2: Description of the Clusters by Centroid Sequences

3. However, the share of the initial contacts with “TV advertising” was 70.6% in this case and
29.4% for that of “newspaper advertising”.
4.3.2. Description of the Clusters Using Descriptive Variables
For the description of the cluster solutions within the different segments, selected descriptive
variables, such as the overall number of contacts and individual contacts at various customer
contact points (e.g. newspaper advertising, store, sales staff, service staff etc.) are also referred
to here in the different phases of the purchase intent process which differentiate the clusters.
In order to gain an impression of the quantitive meaning of a contact point within a contact
sequence, the contact frequency for every contact point for every person was calculated as a
relative size (basis = sequence length). The medium proportions of the contact frequency per
contact point were then formed in relation to the sequence clusters. The comparison for the
clusters in the “short sequences” segment shows extremely significant differences in the case of
contacts with the “store” (cluster 1: 76.7%; cluster 2: 46.7%; cluster 3: 31.1%; p < .001) and
“sales staff ” (cluster 1: 33.3%; cluster 2: 42.7%; cluster 3: 25.0%; p < .001), and a tendency
towards significant differences in the contacts with the “service staff ” (cluster 1: .0%; cluster 2:
28.6%; cluster 3: 21.0%; p < .1). In the clusters in the “long sequences” segment, significant
differences in the contacts with the “store” (cluster 1: 27.6%; cluster 2: 20.7%; cluster 3:
22.4%; p < .05) and “sales staff ” (cluster 1: 20.8%; cluster 2: 16.4%; cluster 3: 12.3%; p < .05),
and a tendency towards significant differences with the “service staff ” (cluster 1: .0%; cluster
2: 24.8%; cluster 3: 12.3%; p < .1) were also observed. However, these were also observed in
the case of “posters in town” (cluster 1: 17.2%; cluster 2: 13.1%; cluster 3: 11.6%; p < .1).
The functions of the different customer contacts provide important findings regarding the inten-
tion for the contacts during the overall purchase intent process. For the clusters in the “short
sequences” segment, the results did not show any significant differences between them with
regard to the functions “general information”, “price comparison” and “possibility of pur-
chase”. A tendency of significant differences was observed for the function “overview of short-
listed products” (cluster 1: 12.5%; cluster 2: 17.1%; cluster 3: 24.4%; p < .1) and significant
differences for “advice after purchase” (cluster 1: .0%; cluster 2: 5.3%; cluster 1: 3.7%;
p < .05).
With regard to the functions of the customer contacts, the cluster solution of the “long
sequences” segment demonstrated an extremely significant difference in the function “support
after purchase” (cluster 1: .5%; cluster 2: 5.3%; cluster 3: 8.7%; p < .001).
The results in Table 3 describe the clusters of the “short sequences” segment by way of contact-
related variables in the different phases of the purchasing process. The customers in cluster 3
had considerably more contact with the retailer’s advertising in the pre-purchase phase, espe-
Steinmann, S.; Silberer, G. 109
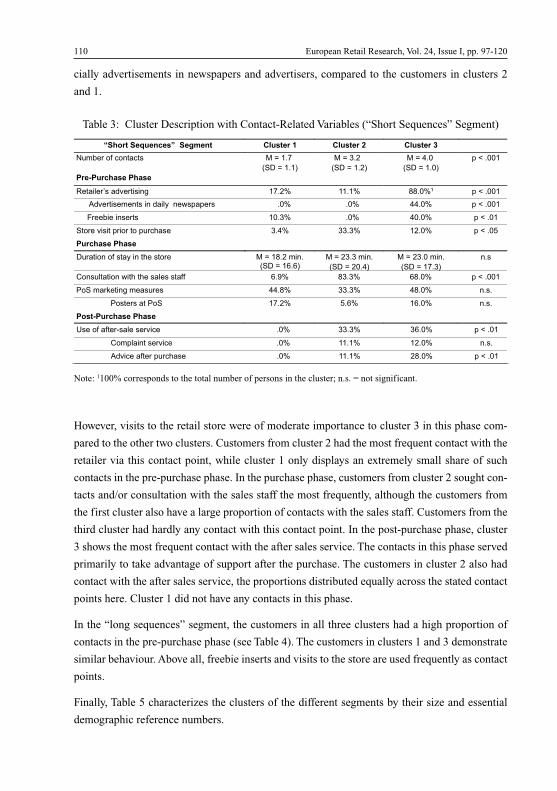
cially advertisements in newspapers and advertisers, compared to the customers in clusters 2
and 1.
110 European Retail Research, Vol. 24, Issue I, pp. 97-120
���������� ��������� ������ � �������� ��������
���������� �� � �������
��� � ����
� � ����
����������
� � ����
��� � ����
��������
������ ��������
�� � !��"� �#$�� � �% ����& ����& ''��&� ��������
(#$�� ����� �� ��#� !) ��*������� ���& ��& ����& � � ����
+���� � ���� � ����& ��& ����& � � ���
� �� $ � �� �� �����,��� ���& ����& ����& ������-
��� ��������
���� ���� �)� �� ,��� �� �����'���� ���������.�.�
���������� ��
�����������
���������� ��
�����������
���
/���! � ��* ,� ,����!���� � .�0& '���& .'��& ��������
1�����2� �%��������� ���'& ����& �'��& ����
1� ����� �1� ����& -�.& �.��& ����
�������� ��������
3�� �� ��4��!�����$ �� ����& ����& �.��& � �����
/��!� � ����$ �� ����& ����& ����& ����
(#$ ���� �� ����,��� ����& ����& �'��& � �����
Table 3: Cluster Description with Contact-Related Variables (“Short Sequences” Segment)
Note: 1100% corresponds to the total number of persons in the cluster; n.s. = not significant.
However, visits to the retail store were of moderate importance to cluster 3 in this phase com-
pared to the other two clusters. Customers from cluster 2 had the most frequent contact with the
retailer via this contact point, while cluster 1 only displays an extremely small share of such
contacts in the pre-purchase phase. In the purchase phase, customers from cluster 2 sought con-
tacts and/or consultation with the sales staff the most frequently, although the customers from
the first cluster also have a large proportion of contacts with the sales staff. Customers from the
third cluster had hardly any contact with this contact point. In the post-purchase phase, cluster
3 shows the most frequent contact with the after sales service. The contacts in this phase served
primarily to take advantage of support after the purchase. The customers in cluster 2 also had
contact with the after sales service, the proportions distributed equally across the stated contact
points here. Cluster 1 did not have any contacts in this phase.
In the “long sequences” segment, the customers in all three clusters had a high proportion of
contacts in the pre-purchase phase (see Table 4). The customers in clusters 1 and 3 demonstrate
similar behaviour. Above all, freebie inserts and visits to the store are used frequently as contact
points.
Finally, Table 5 characterizes the clusters of the different segments by their size and essential
demographic reference numbers.
1
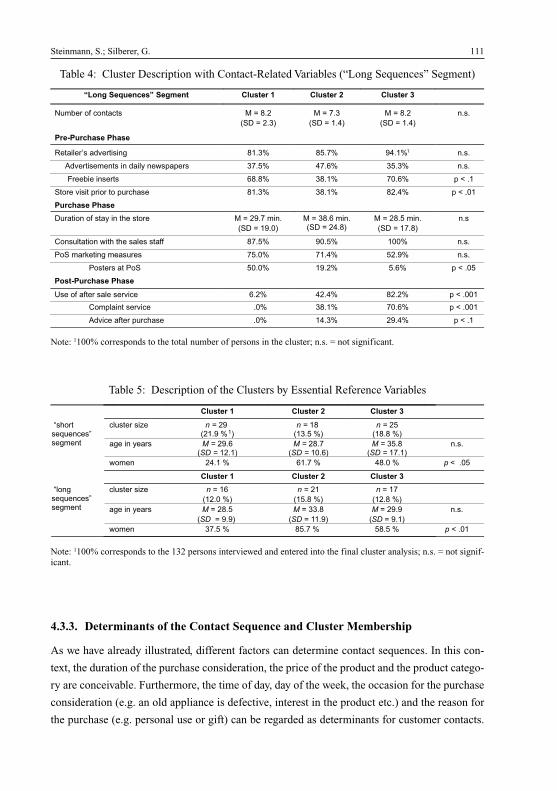
4.3.3. Determinants of the Contact Sequence and Cluster Membership
As we have already illustrated, different factors can determine contact sequences. In this con-
text, the duration of the purchase consideration, the price of the product and the product catego-
ry are conceivable. Furthermore, the time of day, day of the week, the occasion for the purchase
consideration (e.g. an old appliance is defective, interest in the product etc.) and the reason for
the purchase (e.g. personal use or gift) can be regarded as determinants for customer contacts.
Steinmann, S.; Silberer, G. 111
���������� ������� ��� �� � ��� ���� ��� ����
������� �� �� � � � ���
����������
�������
����������
�������
����������
����
��������� ����
�� ����� ���!"�� ����# ����$ �%��$ &���$� ����
'!"�� ������ �����!���(���)�*�*��� ���%$ ���+$ �%��$ ����
�,������������ � +���$ ����$ �-�+$ * .���
� �� "��� *���� �*���/��� ����$ ����$ ����$ *�.��-�
������ ���
���� ��� � �(���� /� � �� � � �&�������
�������&�-�
� � ���+�����������������
� � ���%�����
�����������
���
0���� � ���)� /� /������� � � ���%$ &-�%$ �--$ ����
1�����2� ��#��������� �%�-$ ����$ %��&$ ����
1� ��� � �1� %-�-$ �&��$ %�+$ *�.��-%
�� �������� ����
3�� �� ������� ���"��� +��$ ����$ ����$ * . �--�
0�*���� ���"��� �-$ ����$ �-�+$ * . �--�
'!"����� �� *���/��� ��-$ ����$ �&��$ *�.���
Table 4: Cluster Description with Contact-Related Variables (“Long Sequences” Segment)
������� �������� ������� �
���������� �������
��������� �����������������
��������������
��������������
���������� ������� ��� � �����
�������!��� � �"� �
���������������!���
����
#��� �$���� ��!�� $��" � ��%���"�
������� �������� ������� �
��������� �������
��������� ��&��
����"���
��&���
��������
��&��!
��������
���������� ��&�����
��� & ����
��&�����
��� &������
��&�����
����&�����
����
#��� �!���� ���!��� ������ ��%��"�
Table 5: Description of the Clusters by Essential Reference Variables
Note: 1100% corresponds to the 132 persons interviewed and entered into the final cluster analysis; n.s. = not signif-icant.
Note: 1100% corresponds to the total number of persons in the cluster; n.s. = not significant.
1
1
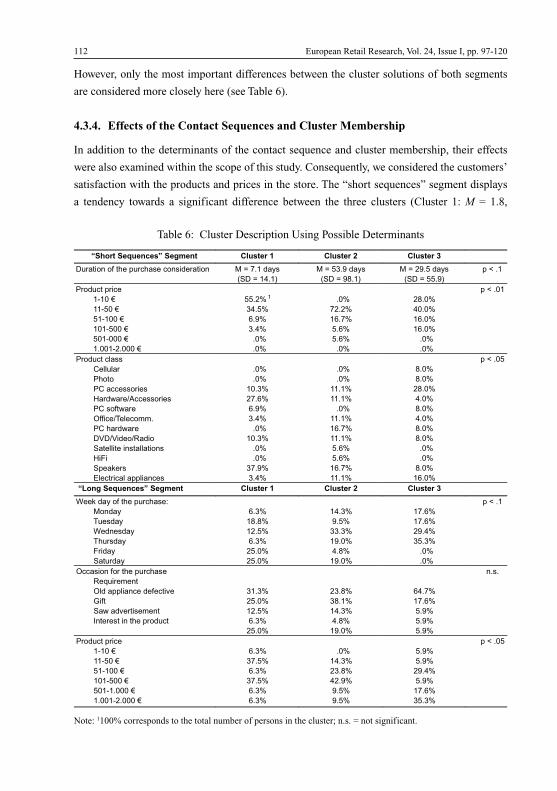
However, only the most important differences between the cluster solutions of both segments
are considered more closely here (see Table 6).
4.3.4. Effects of the Contact Sequences and Cluster Membership
In addition to the determinants of the contact sequence and cluster membership, their effects
were also examined within the scope of this study. Consequently, we considered the customers’
satisfaction with the products and prices in the store. The “short sequences” segment displays
a tendency towards a significant difference between the three clusters (Cluster 1: M = 1.8,
112 European Retail Research, Vol. 24, Issue I, pp. 97-120
Note: 1100% corresponds to the total number of persons in the cluster; n.s. = not significant.
���������� �������� �������� �������� ��������
����������� ������� ����� ����� � � �������
���������
� � ��������
���������
�� �������
���������
� !��
"����������
�#�$ %
��#�$ %
��#�$$%
�$�#�$$%
�$�#$$$%
�.$$�# .$$$%
��� &�
����&
'��&
���&
�$&
�$&
�$&
� � &
�'��&
��'&
��'&
�$&
��$&
�$�$&
�'�$&
�'�$&
�$&
�$&
� !�$�
"�������(���
) ((�(��
"����
")��� ����� �
*���+�� ,-�� ����� �
")����+��
.���� ,/ ( ��00�
") ����+��
�1�,1�� �,2����
��� ((�� ����((�����
*�3�
�� �4 ��
5( ������(���(��� �
�$&
�$&
�$��&
��'&
'��&
���&
�$&
�$��&
�$&
�$&
����&
���&
�$&
�$&
����&
����&
�$&
����&
�'��&
����&
��'&
��'&
�'��&
����&
��$&
��$&
��$&
��$&
��$&
��$&
��$&
��$&
�$&
�$&
��$&
�'�$&
� !�$�
��������� �� ����� �������� �������� ��������
6 4��� ���� ������� 7
�����
/� ����
6 � ����
/�������
3�����
��������
'��&
����&
� ��&
'��&
��$&
��$&
����&
���&
����&
���$&
���&
���$&
���'&
���'&
���&
����&
�$&
�$&
� !��
.��������� �� �������
2 8��� 0 �
.(� ���(��� � � ���9
:���
��+��9 ���� 0 �
;� � ����� �������
����&
��$&
� ��&
'��&
��$&
���&
����&
����&
���&
���$&
'���&
���'&
���&
���&
���&
���
"����������
�-�$ %
��-�$ %��-�$$ %
�$�-�$$ %�$�-�.$$$ %
�.$$�- .$$$ %
'��&
����&
'��&
����&
'��&
'��&
�$&
����&
���&
� ��&
���&
���&
���&
���&
���&
���&
���'&
����&
� !�$�
Table 6: Cluster Description Using Possible Determinants
1
SD = .6; Cluster 2: M = 2.4, SD = 1.4; Cluster 3: M = 1.9, SD = .7; p < .1). The customers from
the second cluster were less satisfied than those of the other clusters. No significant differences
could be detected for the “long sequences” segment (Cluster 1: M = 1.7, SD = .8; Cluster 2:
M = 2.0, SD = 1.2; Cluster 3: M = 2.0, SD = .7; n.s.).
4.3.5. Characterization of the Sequence Clusters
In observing the differences of all results, each cluster of both segments can be classed with a
name - even though that is, admittedly simplified: customers of the first cluster of the “short
sequences” segment could be characterized as “spontaneous purchasers” in view of their very
low number of contacts (see Table 3), preferred product category and high proportion of prod-
uct purchases at a low price (see Table 6); the second cluster as “browsers”, as the customers of
this cluster already sought contact in the shop in the pre-purchase phase and also stayed in the
store the longest during the purchase phase (see Table 3).
In view of their high proportion of contacts with offers in newspaper advertising in the pre-
purchase phase, the customers in the third cluster can be referred to as “offer purchasers” (see
Table 3).
The first cluster of the “long sequences” segment could be named “young technophiles”, these
customers distinguish themselves above all through their interest in the various products of the
electronics market. In this cluster, “interest in the product” was stated the most frequently as the
occasion for the purchase consideration (see Table 6). The customers in cluster 2 stated “old
appliance defective” as the most frequent occasion for the purchase consideration and are there-
fore classified as “repeat purchasers” (see Table 6). The customers in the third cluster can be
classed as “fastidious purchasers”. They have the highest proportion of purchases from the upper
price segments. Furthermore, a higher proportion of contacts with the service staff and com-
plaints service in the post-purchase phase is also characteristic of these customers (see Table 4).
4.4. Discriminatory Power of Contact Sequences
We used binary logistic regression on the segment level and discriminant analysis on the cluster
level in each segment to test our proposition that the segment (short sequences vs. long
sequences segment) and cluster membership can be satisfactorily explained and predicted by
the sequencing of customer contacts.
With regard to the differences in the number of realized contacts as well as of the realized cus-
tomer contact point on the segment and on the cluster level, we used the number of the ten most
frequently realized substrings consisting of two consecutive customer contacts as independent
variables in the first binary logistic regression model with the segment membership as depend-
Steinmann, S.; Silberer, G. 113
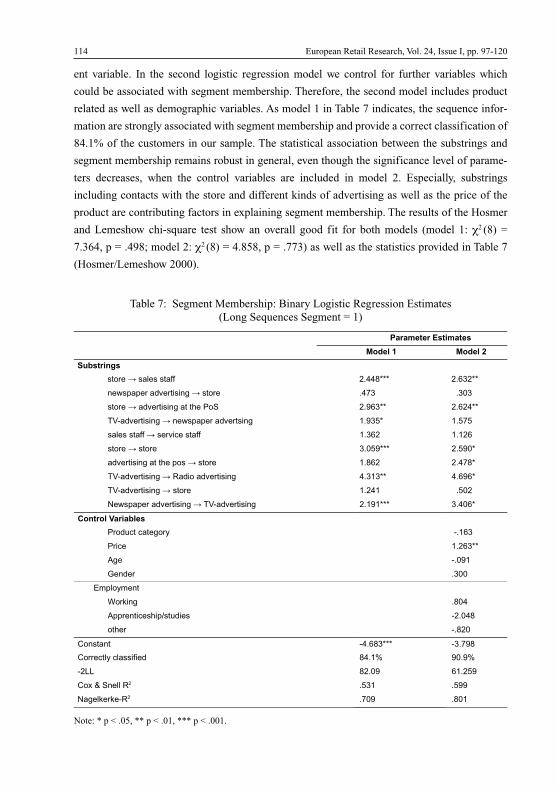
ent variable. In the second logistic regression model we control for further variables which
could be associated with segment membership. Therefore, the second model includes product
related as well as demographic variables. As model 1 in Table 7 indicates, the sequence infor-
mation are strongly associated with segment membership and provide a correct classification of
84.1% of the customers in our sample. The statistical association between the substrings and
segment membership remains robust in general, even though the significance level of parame-
ters decreases, when the control variables are included in model 2. Especially, substrings
including contacts with the store and different kinds of advertising as well as the price of the
product are contributing factors in explaining segment membership. The results of the Hosmer
and Lemeshow chi-square test show an overall good fit for both models (model 1: �2 (8) =
7.364, p = .498; model 2: �2 (8) = 4.858, p = .773) as well as the statistics provided in Table 7
(Hosmer/Lemeshow 2000).
114 European Retail Research, Vol. 24, Issue I, pp. 97-120
����������������
� ��� � �� ��� �
��������
����� ����� ���� � ������ � �����
������������������� ������� ��� � ���
����� � �������������������� � ����� � �����
!"������������������������������� # ��$� # $�$
��� ���� �������%� ���� # ��� # #��
������� ����� � �$���� � $���
�������������������� � ����� # ��� � ����
!"������������ &��� ���������� � �#��� � ����
!"���������� � ����� # ��# � $��
'������� ������������ !"���������� � #�#��� � ����
� ��� � ��������
����(%� %�����) �" #��
���%� # �����
*�� " ��#
+����� ���
,-��)-���
.��/��� ���
*�������%�����0��(���� "�.���
����� " ���
1������ "� ������ "�.���
1����%�) %������� �� #2 �� �2
"�33 �� �� �# �$�
1�4 5 ����&� $�# $��
'��/��/�"&� ��� ��#
Table 7: Segment Membership: Binary Logistic Regression Estimates (Long Sequences Segment = 1)
Note: * p < .05, ** p < .01, *** p < .001.
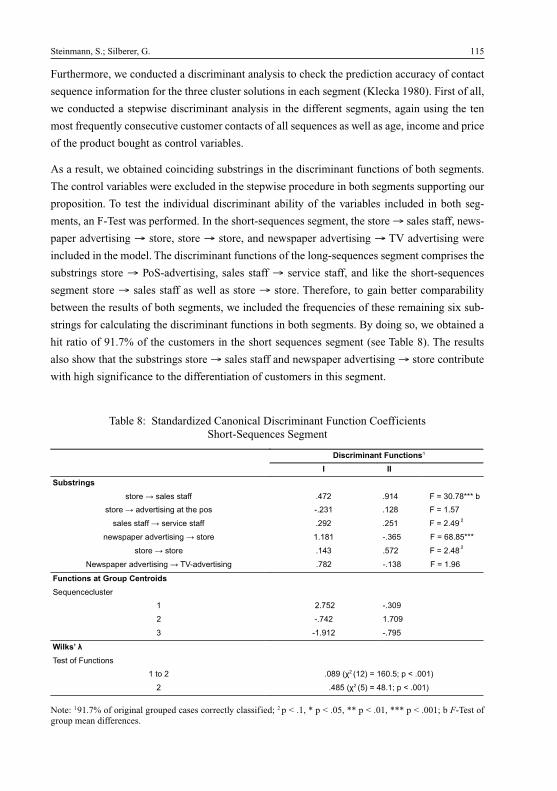
Furthermore, we conducted a discriminant analysis to check the prediction accuracy of contact
sequence information for the three cluster solutions in each segment (Klecka 1980). First of all,
we conducted a stepwise discriminant analysis in the different segments, again using the ten
most frequently consecutive customer contacts of all sequences as well as age, income and price
of the product bought as control variables.
As a result, we obtained coinciding substrings in the discriminant functions of both segments.
The control variables were excluded in the stepwise procedure in both segments supporting our
proposition. To test the individual discriminant ability of the variables included in both seg-
ments, an F-Test was performed. In the short-sequences segment, the store � sales staff, news-
paper advertising � store, store � store, and newspaper advertising � TV advertising were
included in the model. The discriminant functions of the long-sequences segment comprises the
substrings store � PoS-advertising, sales staff � service staff, and like the short-sequences
segment store � sales staff as well as store � store. Therefore, to gain better comparability
between the results of both segments, we included the frequencies of these remaining six sub-
strings for calculating the discriminant functions in both segments. By doing so, we obtained a
hit ratio of 91.7% of the customers in the short sequences segment (see Table 8). The results
also show that the substrings store � sales staff and newspaper advertising � store contribute
with high significance to the differentiation of customers in this segment.
Steinmann, S.; Silberer, G. 115
������������ ������
� ����
� �������
����� ����� ���� � �� ��� ��� ����������
���������������������������� ���� ���� ��� ��!�
����������������"� ���� ���� ��!� ��� �� �#$%
��&����� ������������������ ����� ��'!�� ��� '���!���
������������� �� � �!�� ��� �� �#$%
(�&����� �������������$) ���������� ���� ���� ��� ���'
� ����������� ����������
*�+,��"�",����
� ���!� ����
� �� � �����
� ����� ���!
������ �
$������ �,�"�����
������ �����#-��#��%����'��!.���/ ����%
� � �!�#-��#!% � ���. � /�����%
Table 8: Standardized Canonical Discriminant Function Coefficients Short-Sequences Segment
Note: 191.7% of original grouped cases correctly classified; 2 p < .1, * p < .05, ** p < .01, *** p < .001; b F-Test ofgroup mean differences.
1
i2
i2
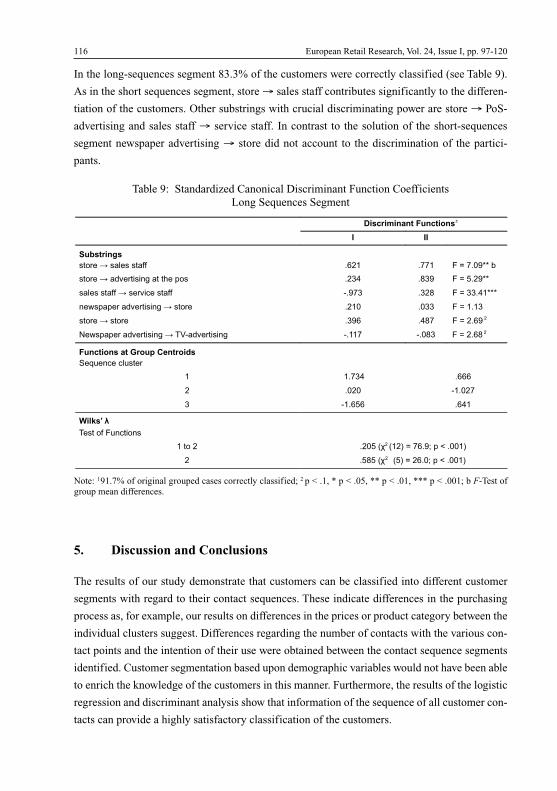
In the long-sequences segment 83.3% of the customers were correctly classified (see Table 9).
As in the short sequences segment, store � sales staff contributes significantly to the differen-
tiation of the customers. Other substrings with crucial discriminating power are store � PoS-
advertising and sales staff � service staff. In contrast to the solution of the short-sequences
segment newspaper advertising � store did not account to the discrimination of the partici-
pants.
116 European Retail Research, Vol. 24, Issue I, pp. 97-120
������������ ������
� ��
� �������
����� ���������� � �� ���� ������������
���������������������������� ���� � �� � � !�����
����������������"� ���� #���� ��� ������������
��$���������������� ������� ���� ���� ��������
����� ������� ��� �� � ������ �%&'
(�$����� ���������� � &)#���������� #���� #�� � ������ %&'
� ������ ���� ����������
*�+,��"� ",����
� ����� �
� ���� #�����
� #�� ! � ��
��������
&��������,�"�����
� ���� ���!�%-��%��'���� ��. � /�����'
� �! !�%-�� %!' � � ��.���/�����'
Table 9: Standardized Canonical Discriminant Function CoefficientsLong Sequences Segment
Note: 191.7% of original grouped cases correctly classified; 2 p < .1, * p < .05, ** p < .01, *** p < .001; b F-Test ofgroup mean differences.
5. Discussion and Conclusions
The results of our study demonstrate that customers can be classified into different customer
segments with regard to their contact sequences. These indicate differences in the purchasing
process as, for example, our results on differences in the prices or product category between the
individual clusters suggest. Differences regarding the number of contacts with the various con-
tact points and the intention of their use were obtained between the contact sequence segments
identified. Customer segmentation based upon demographic variables would not have been able
to enrich the knowledge of the customers in this manner. Furthermore, the results of the logistic
regression and discriminant analysis show that information of the sequence of all customer con-
tacts can provide a highly satisfactory classification of the customers.
1
i2
i2
This information puts the retailer in a position to adapt the established individual customer con-
tact points to the different customer segments and to guide customers via contacts in the pur-
chase process. Knowledge of these segments lets the retailer anticipate further contacts and
offer suitable measures. If the retailer pursues a particular strategy with regard to the sequence
of contacts, these results provide information on the proportion of customers who behave
accordingly. By tracking customer behaviour across channels, firms can improve their under-
standing of their customers’ decision making and improve retention. This customer-centric
approach (Reinartz/Krafft/Hoyer 2004) will also contribute to systematic and proactive coordi-
nation of the relationship in the whole purchase process. Furthermore, the contact sequences
could also provide crucial insights into potential existing cross-channel synergies. Regarding
the significance of individual contacts, a carefully directed reflection of individual contact
points is also advisable, which includes its functionality and importance to the customers
(Simons/Bouwman 2004; Steinmann/Silberer 2009). In doing so, the supplier would among
other things have to investigate which contacts exert which influence on the customers and how
the customer contacts, as well as their functions, can be controlled by retailers as well as serv-
ice providers. Furthermore, the results show how the contact points differ in their function and
importance to the customers across the purchase process. This knowledge as well as the knowl-
edge of the effects of customer contacts will in any case contribute to an approach towards the
optimal multi-channel mix and also to an effective and efficient CRM. Hereby the retailer could
increase customer satisfaction as well as gain profitable and long-term customer relationships.
There are also important implications for marketing science as individual customer contacts
or parts of the purchasing process have been explained primarily through partial theories in
previous research (e.g. Schoenbachler/Gordon 2002; Steinfield/Bouwman/Adelaar 2002; Bala-
subramian/Raghunathan/Mahajan 2005; Kumar/Venkatesan 2005). However, the differences
identified in the sequences of customer contacts cannot be explained with such approaches. A
comprehensive theory is necessary which ideally integrates all the individual phenomena from
the three purchasing phases and can explain differences between the customers by their contact
sequences. Besides this, our results also imply the application of methods, e.g. Markov-Models,
for predicting customer behaviour based on contact sequences. Concerning our clustering
approach the usage of other cluster algorithms is conceivable. In this context the application of
a medoid clustering method (e.g. k-medoid) would be a suitable alternative to the approach
used, especially when the centroid sequences identified are not observed in the survey (Kauf-
man/Rousseeuw 1987; Larson/Bradlow/Fader 2005). In addition, with regard to the relatively
small sample size the application of nonparametric statistics would be a suitable alternative for
testing the significance of group differences, since they are more robust for smaller sample
sizes (Horowitz 2009). Furthermore, we only analyzed customer contacts and contact
sequences in one branch with one retailer, so there is a lot of research in other branches with
other retailers or service providers necessary to generalize our findings.
Steinmann, S.; Silberer, G. 117
References
Abbott, A. (1995): Sequence Analysis: New methods for old ideas, in: Annual Review of Soci-ology, Vol. 21, No. 2, pp. 93-113.
Alba, J.; Lynch, J.; Weitz, B.; Janiszewski, C.; Lutz, R.; Sawyer, A.; Woods, S. (1997): Inter-active Home Shopping: Consumer, Retailer, and Manufacturer Incentives to Participate inElectronic Marketplaces, in: Journal of Marketing, Vol. 51, No. 3, pp. 38-53.
Anderson, J.R. (1995): Cognitive psychology and its implications, New York: Freeman.
Balasubramian, S.; Raghunathan, R.; Mahajan, V. (2005): Consumers in a multichannel envi-ronment: Product utility, process utility, and channel choice, in: Journal of Interactive Mar-keting, Vol. 19, No. 2, pp. 12-30.
Belk, R.W. (1974): Application and analysis of the behaviour: differential inventory for assess-ing situational effects in consumer behaviour, in: Ward, S.; Wright, P. (eds.): Advances inConsumer Research, Vol. 1, Urbana: Association of Consumer Research.
Bhatnagar, A.; Ghose, S. (2004): Online information search termination patterns across productcategories and consumer demographics, in: Journal of Retailing, Vol. 80, No. 3, pp. 221-228.
Bloch, P.H.; Ridgway, N.M.; Davidson, S.A. (1994): The Shopping Mall as Consumer Habitat,in: Journal of Retailing, Vol. 70, No. 11, pp. 23-42.
Bove, L.L.; Roberston, N.L. (2005): Exploring the role of relationship variables in predictingcustomer voice to a service worker, in: Journal of Retailing and Customer Services, Vol. 12,No. 2, pp. 83-97.
Daft, R.L.; Lengel, R.H. (1984): Information richness: a new approach to managerial behaviourand organizational design, in: Cummings, L.L.; Staw, B.M. (eds.): Research in organization-al behaviour 6, Homewood, IL: JAI Press, pp. 191-233.
Day, E.; Stafford, M.R. (1997): Age-related cues in retail services advertising: their effects onyounger consumers, in: Journal of Retailing, Vol. 73, No. 2, pp. 211-233.
Dholakia, R.R.; Zhao, M.; Dholakia, N. (2005): Multichannel Retailing: A Case Study of EarlyExperiences, in: Journal of Interactive Marketing, Vol. 19, No. 2, pp. 63-74.
Ericsson, K.A.: Simon, H.A. (1980): Verbal reports as data, in: Psychological Review, Vol. 87,pp. 215-251.
Fishbein, M.; Ajzen, I. (1975): Belief, attitude, intention, and behaviour: An introduction totheory and research, Reading, MA: Addison-Wesley.
Fox, E.J.; Montgomery, A.L.; Lodish, L.M. (2004): Consumer Shopping and Spending acrossRetail Formats, in: The Journal of Business, Vol. 77, No. 2, pp. 25-60.
Frambach R.T.; Roest, H.C.A.; Krishnan, T.V. (2007): The Impact of Consumer Internet Expe-rience on Channel Preference and Usage Intentions across the different stages of the buyingprocess, in: Journal of Interactive Marketing, Vol. 21, No. 2, pp. 26-41.
Ganesh, J.; Reynolds, K.E.; Luckett, M.G. (2007): Retail patronage behaviour and shoppertypologies: a replication and extension using a multi-format, multi-method approach, in:Journal of the Academy of Marketing Science, Vol. 35, No. 3, pp. 369-381.
Geyskens, I.; Gielens, K.; Dekimpe, M.G. (2002): The Market Valuation of Internet ChannelAuditions, in: Journal of Marketing, Vol. 66, No. 2, pp. 102-119.
118 European Retail Research, Vol. 24, Issue I, pp. 97-120
Gijsbrechts, E.; Campo, K.; Goossens, T. (2003): The impact of store flyers on store traffic andstore sales: a geo-marketing approach, in: Journal of Retailing, Vol. 79, No. 1, pp. 1-6.
Goff, B.G.; Bole, J. S.; Bellenger, D.N.; Stojack, C. (1997): The influence of salesperson sellingbehaviour on customer satisfaction with products, in: Journal of Retailing, Vol. 73, No. 2,pp. 171-183.
Gusfield, D. (1997): Algorithms on Strings, Trees and Sequences: Computer Science and Com-putational Biology, Cambridge.
Hägerstrand, T. (1970): What about people in regional science?, in: Papers of the Regional Sci-ence Association, Vol. 24, No. 1, pp. 7-21.
Hay, B.; Wets, G.; Vanhoof, K. (2004): Mining navigation patterns using a sequence alignmentmethod, in: Knowledge and Information Systems, Vol. 6, London, pp. 150-163.
Hosmer, D.W.; Lemeshow, S. (2000): Applied Logistic Regression, 2nd ed., New York.
Horowitz, J.L. (2009): Semiparametric and nonparametric methods in econometrics, Berlin.
Joh, C.H.; Arentze, T.A.; Hofman, F.; Timmermans, H.J.P. (2002): Activity pattern similarity:A multidimensional sequence alignment method, in: Transportation Research B, Vol. 36,No. 5, pp. 385-483.
Kim, B.-D.; Park, K. (1997): Studying Patterns of Consumer’s Grocery Shopping Trip, in: Jour-nal of Retailing, Vol. 73, No. 4, pp. 501-517.
Klecka, W.R. (1980): Discriminant Analysis, in: Series: Quantitative Applications in the SocialSciences, London.
Kaufman, J.; Rousseeuw, P.J. (1987): Clustering by means of medoids, in: Dodge, Y. (ed.)Statistical Data Analysis based on the L1 Norm, Amsterdam, pp. 405-416.
Kumar, V.; Venkatesan, R. (2005): Who are the multichannel shoppers and how do they per-form?: Correlates of multichannel shopping behaviour, in: Journal of Interactive Marketing,Vol. 19, No. 2, pp. 44-62.
Larson, J.S.; Bradlow, E.T.; Fader, P.S. (2005): An exploratory look at supermarket shoppingpaths, in: International Journal of research in Marketing, Vol. 22, No. 4, pp. 395-414.
Levenshtein, V.I. (1966): Binary codes capable of correcting deletions, insertions, and reversals,in: Soviet Physics Doklady, Vol. 10, No. 8, pp. 707-710.
Nicholson, M.; Clarke, I.; and Blakemore, M. (2002): ‘One brand three ways to shop’: situa-tional variables and multichannel consumer behaviour, in: International Review of Retail,Distribution and Consumer Research, Vol. 12, No. 2, pp. 131-148.
Payne, J.W.; Bettman, J.R.; Johnson, E.J. (1993): The Adaptive Decision Maker, Cambridge.
Payne, A.; Frow, P. (2004): The role of multichannel Integration in customer relationship man-agement, in: Industrial Marketing Management, Vol. 33 , pp. 527-538.
Payne, A.; Frow, P. (2005): A Strategic Framework for Customer Relationship Management, in:Journal of Marketing, Vol. 69, No. 4, pp. 167-176
Raghubir, P. (2004): Free gift with purchase: Promoting or discounting the brand?, in: Journalof Consumer Psychology, Vol. 14, No. 1 & 2, pp. 181-186.
Rangaswamy, A.; van Bruggen, G.H. (2005): Opportunities and challenges in multichannelmarketing: an introduction to the special issue, in: Journal of Interactive Marketing, Vol. 19,No. 2, pp. 5-11.
Steinmann, S.; Silberer, G. 119
Reinartz, W.; Krafft, M.; Hoyer, W.D. (2004): The Customer Relationship Management Process:Its Measurement and Impact on Performance, in: Journal of Marketing Research, Vol. 41,No. 3, pp. 293-305.
Rice, R.E. (1992): Task analyzability, use of new media, and effectiveness: A multi-site explo-ration of media richness, in: Organization Science, Vol. 3, pp. 475-500.
Ruiz, J.-P.; Chebat, J.-C.; Hansen, P. (2004): Another trip to the mall: a segmentation study ofcustomers based on their activities, in: Journal of Retailing and Consumer Services, Vol. 11,pp. 333-350.
Sankoff, D.; Kruskal, J.B. (1983): Time Warps, String Edits, and Macromolecules: The Theoryand Practice of Sequence Comparison, Reading: Mass.
Schoenbachler, D.D.; Gordon, G.L. (2002): Multi-channel shopping: understanding what driveschannel choice, in: Journal of Consumer Marketing, Vol. 19, No. 1, pp. 42-53.
Simons, L.P.A.; Bouwman, H. (2004): Designing a channel mix, in: International Journal ofInternet Marketing and Advertising, Vol. 1, No. 3, pp. 229-250.
Sinha, P.K.; Uniyal, D.P. (2005): Using observational research for behavioural segmentation ofshoppers, in: Journal of Retailing and Consumer Services, Vol. 12, pp. 35-48.
Silberer, G.; Mau, G. (2006): Customer Contacts and Contact Segments in Retail: Results of aCustomer Survey, From Small Firms to Multinationals, in: Salavrakos, I.-D. (ed.): Industri-al, Entrepreneurial, Managerial, Financial, Fiscal, Transaction Cost and Consumer Perspec-tives in the Era of Globalisation, Athens, pp. 497-508.
Silberer, G.; Steinmann, S.; Mau, G. (2007): Clustering Customer Contact Sequences in Retail-ing, in: Zentes, J.; Morschett, D.; Schramm-Klein, H. (eds.): Conference Proceedings of the14th International Conference on Research in the Distributive Trades 2007, pp. 1531-1554.
Steinfield, C.; Bouwman, H.; Adelaar, T. (2002): The Dynamics of Click-and-Mortar Electron-ic Commerce: Opportunities and Management Strategies, in: International Journal of Elec-tronic Commerce, Vol. 7, No. 1, pp. 93-119.
Steinmann, S.; Silberer, G. (2009): Classifying Customers with Multidimensional CustomerContact Sequences, in: McGill, A.; Shavitt, S. (eds.): Advances in Consumer Research, Vol.36, Association for Consumer Research, Duluth, pp. 515-522.
Thomas, J.S.; Sullivan, U.Y. (2005): Managing Marketing Communications with MultichannelCustomers, in: Journal of Marketing, Vol. 69, No. 4, pp. 239-251.
van Dolen, W.; Lemmink, J.; de Ruyter, K.; de Jong, A. (2002): Customer-sales employeeencounters: a dyadic perspective, in: Journal of Retailing, Vol. 78, No. 4, pp. 265-280.
Venkatesan, R.; Kumar, V.; Ravishankar, N. (2007): Multichannel Shopping: Causes and Con-sequences, in: Journal of Marketing, Vol. 71, No. 2, pp. 114-132.
Verhoef, P.C.; Neslin, S.C.; Vroomen, B. (2007): Multichannel Customer Management: Under-standing the research-shopper phenomenon, in: International Journal of Research in Mar-keting, Vol. 24, pp. 129-148.
Wallace, D.W.; Giese, J.L.; Johnson, J.L.; (2004): Customer retailer loyalty in the context ofmultiple channel strategies, in: Journal of Retailing, Vol. 80, No. 4, pp. 249-263.
Ward, M.R. (2001): Will Online Shopping Compete More with Traditional Retailing or OnlineShopping?, in: Netnomics: Electronic Research and Electronic Networking, Vol. 3, No. 2,pp. 103-117.
120 European Retail Research, Vol. 24, Issue I, pp. 97-120
The In-Store Antecedents and Consequencesof Perceived Shopping Value for Regularly Purchased Products
Wolfgang Weitzl and Robert Zniva
AbstractThe study contributes to the knowledge of the complex relationships between store image,shopping value, and key retail outcomes. For the first time, a holistic approach is presented toidentify key in-store image characteristics and their influences on both hedonic and utilitarianshopping value, as well as to investigate the consequences of perceived shopping value on cus-tomer satisfaction and store loyalty. A quantitative survey was conducted and 342 grocery storecustomers of a major Austrian retail chain were interviewed. Results show that the two shop-ping value dimensions (hedonic and utilitarian) are influenced by various store image charac-teristics. Moreover, the study provides evidence that a positive relationship between shoppingvalue and store loyalty exists. This link, however, is fully mediated by customer satisfaction.The impact of the utilitarian shopping value on customer satisfaction was found to be strongerthan the impact of its hedonic counterpart.
KeywordsStore Image, Store Environment, Shopping Value, Customer Satisfaction, Store Loyalty
Mag. Wolfgang Weitzl (corresponding author)Department of Marketing, University of Vienna, Vienna, Austria(Tel: ++43 1 4277 38018; E-mail: [email protected]).
Mag. Robert ZnivaDepartment of Marketing, University of Vienna, Vienna, Austria.
Received: January 31, 2010Revised: March 29, 2010Accepted: April 10, 2010
EUROPEAN
RETAIL
RESEARCHVol. 24, Issue I, 2010, pp. 121-148
1. Introduction
Recently, modern retailing faces several dynamic trends that influence a firm’s success sub-
stantially and that furthermore affect the ways of doing business in the 21st century. Modern
food retailing is effected by developments in the retailing environment characterized by
increasingly competitive markets. As a result grocery stores are all regarded as similar in the
eye of the consumer (Wakefield/Baker 1998). Product offers and also prices assimilate all
across the marketplace with the result that neither can be seen as a source of competitive
advantage (Groeppel/Bloch 1990). Contemporary retailers, however, still focus on traditional
marketing tools, although recent research shows that consumers’ store loyalty and time spent
shopping has decreased over the years (Reynolds/Ganesh/Luckett 2002). Grocery retailers are
therefore forced to find a new basis for generating an advantageous market position (Zineldin
2006).
The shopping experience itself has become a fertile opportunity for market differentiation. The
aim is to generate an inimitable image which is deeply rooted in the mind of the consumer and
has the ability to distinguish the retail offering from the competitors’ (Baker/Levy/Grewal
1992). Among the advantages offered by a preferably perceived shopping experience is the
store’s capability to elude direct price comparisons, especially in the context of routinely pur-
chased products (e.g. groceries) (Groeppel 1997).
Referring to the practical relevance of the shopping experience, in the center of academic
discourse (e.g. Pine/Gilmore 1999; Annamma/Sherry 2003; Prahalad/Ramaswamy 2004;
Bäckström/Johansson 2006) a growing body of literature is reflecting the importance of the
consumption experience at the POS where shopping preferences lie. Therefore, a considerable
proportion of this research string focuses on the emotional side of the shopping experience, fol-
lowing on the early contributions of Kotler (1973) as well as Donovan and Rossiter (1982,
1994). Numerous approaches were successful in directly relating various in-store characteris-
tics to the individual shopper’s emotional responses to them during the shopping activity (see
Turley and Milliman (2000) for a comprehensive review). This may be an interesting but per-
haps insufficient approach to gain insight into shopping behaviors emphasizing routinely pur-
chased products like groceries. Recent research provides evidence that shoppers are not only
influenced by emotions, but can also be assumed to be more rational when making patronage
decisions, especially in the long run (e.g. O’Curry/Strahilevitz 2001). Therefore, cognitive
reactions must also be considered when evaluating consumer behavior in this context. In order
to respect both of these psychological aspects of shopping, other research attempts took a dif-
ferent route and succeeded in applying marketing’s central concept of value to the shopping
experience (e.g. Babin/Darden/Griffin 1994; Babin/Darden 1995; Carpenter/Moore 2005).
Nevertheless, in the shopping experience evaluation the role of value perceptions is still
122 European Retail Research, Vol. 24, Issue I, pp. 121-148
obscure. Existing literature reveals a twofold research gap: (1) in previous research less effort is
dedicated to analyzing the unique store characteristics that affect value evaluations in specific
shopping contexts like regular purchasing of consumer goods (Aubert-Gamet/Cova 1999; Cot-
tet/Lichtlé/Plichon 2006); and (2) only a few studies attempt to link different dimensions of
shopping value to a comprehensive group of retail outcomes like customer satisfaction and
store loyalty, leaving an insufficient empirical basis (see Jones et al. (2006) and Carpenter
(2008) for exceptions).
The present study addresses these research gaps by extending our knowledge of the relationship
between store image, shopping value, customer satisfaction and store loyalty to the highly com-
petitive grocery sector. For the first time, a holistic approach is presented to identify key in-
store image characteristics and their influence on both hedonic (emotional) and utilitarian
(rational) shopping value. Furthermore, we investigate consequences of the perceived shopping
value upon customer satisfaction and loyalty intentions and behavior. In line with this research
purpose, the following research question is proposed:
RQ: Which store image characteristics can be regarded as antecedents of perceived
shopping value and how does this value perception impact customer satisfaction and
store loyalty?
The subsequent sections of this article are structured as follows: First, we discuss the shop-
ping value concept and its dimensions. Secondly, we briefly outline store environment as an
integral component of store image and an antecedent of perceived shopping value. Thirdly,
customer satisfaction and store loyalty are introduced as consequences of perceived shopping
value. Thereafter, we describe the research design, methodology, and the approach that we
adopted. After presenting our results and evaluating our framework, we conclude with a dis-
cussion.
2. Literature Review and Hypotheses
Figure 1 shows the proposed conceptual framework. The model focuses on the shopping expe-
rience and its relationship to its in-store antecedents and consequences. To be more precise, it is
proposed that two different forms of shopping value are inherent in the overall shopping expe-
rience. Both of these value dimensions serve as the key constructs of the model. The following
section sheds light on these latent variables before the paper further discusses their relationship
with the store environment as an integral part of the store image. The framework furthermore
proposes that both shopping values have an impact on customer satisfaction and store loyalty as
key shopping outcomes.
Weitzl, W.; Zniva, R. 123
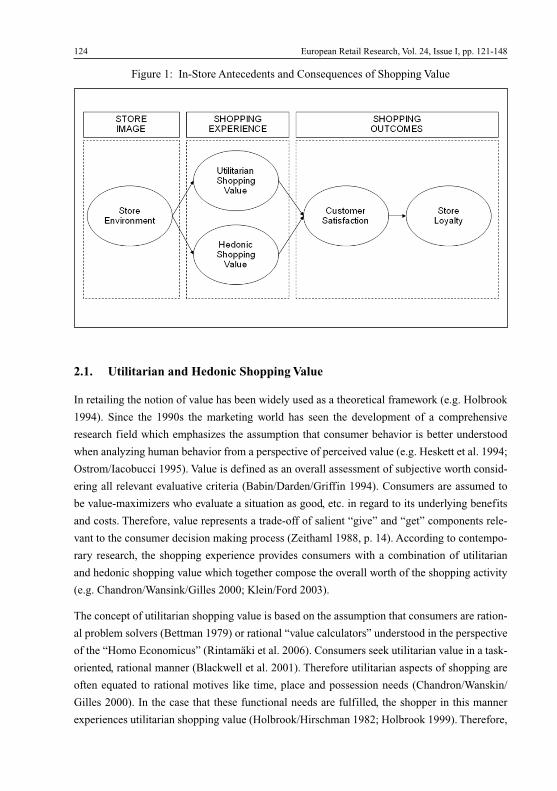
2.1. Utilitarian and Hedonic Shopping Value
In retailing the notion of value has been widely used as a theoretical framework (e.g. Holbrook
1994). Since the 1990s the marketing world has seen the development of a comprehensive
research field which emphasizes the assumption that consumer behavior is better understood
when analyzing human behavior from a perspective of perceived value (e.g. Heskett et al. 1994;
Ostrom/Iacobucci 1995). Value is defined as an overall assessment of subjective worth consid-
ering all relevant evaluative criteria (Babin/Darden/Griffin 1994). Consumers are assumed to
be value-maximizers who evaluate a situation as good, etc. in regard to its underlying benefits
and costs. Therefore, value represents a trade-off of salient “give” and “get” components rele-
vant to the consumer decision making process (Zeithaml 1988, p. 14). According to contempo-
rary research, the shopping experience provides consumers with a combination of utilitarian
and hedonic shopping value which together compose the overall worth of the shopping activity
(e.g. Chandron/Wansink/Gilles 2000; Klein/Ford 2003).
The concept of utilitarian shopping value is based on the assumption that consumers are ration-
al problem solvers (Bettman 1979) or rational “value calculators” understood in the perspective
of the “Homo Economicus” (Rintamäki et al. 2006). Consumers seek utilitarian value in a task-
oriented, rational manner (Blackwell et al. 2001). Therefore utilitarian aspects of shopping are
often equated to rational motives like time, place and possession needs (Chandron/Wanskin/
Gilles 2000). In the case that these functional needs are fulfilled, the shopper in this manner
experiences utilitarian shopping value (Holbrook/Hirschman 1982; Holbrook 1999). Therefore,
124 European Retail Research, Vol. 24, Issue I, pp. 121-148
Figure 1: In-Store Antecedents and Consequences of Shopping Value
in line with this argumentation, utilitarian shopping value can be defined as an overall assess-
ment (i.e. judgment) of functional benefits and sacrifices of a consumer’s shopping experience
(Overby/Lee 2006).
In contrast, hedonic shopping value represents a shopping experience’s emotional and psycho-
logical worth (e.g. Babin/Darden/Griffin 1994; Roy 1994; Wakefield/Baker 1998). Hereby,
hedonic shopping is often regarded as a positive experience in which consumers receive emo-
tional gratification during their shopping experience along with feelings of satisfaction.
Sources of hedonic shopping value include the joy and/or excitement of shopping, and the
escape from everyday activities provided by the shopping experience itself (e.g. Bloch/Richins
1983; Fischer/Arnold 1990; Sherry 1990; Carpenter/Moore 2005). Hedonic value is therefore
defined as an overall assessment (i.e. judgment) of the experiential benefits and sacrifices of
the shopping experience (Overby/Lee 2006). A shopping activity is evaluated on success factors
which are essentially aesthetic in nature. Therefore, hedonic shopping value is regarded as
being more abstract, personal and subjective than utilitarian shopping value (Holbrook/Hirsch-
man 1982).
Several researchers have demonstrated that both utilitarian and hedonic value can be provided
by the retailer during the shopping experience (e.g. Belk 1979; Fischer/Arnold 1990; Sherry
1990). For example, a shopper might be successful at finding the commodity that stimulated the
shopping trip by consulting friendly store personnel. Utilitarian value would then be derived
from the consumer’s success at quickly finding the product needed, and hedonic value would be
created by the social interaction with the friendly store personnel. Thompson et al. (1990) pro-
pose that utilitarian and hedonic shopping values coexist among shoppers, but one motivation-
al dimension often tends to dominate the other. The authors suggest that the shopper’s personal
characteristics and the shopping situation itself primarily determine the relative influence of the
motives for the consumer’s internal responses and overt behavior.
2.2. Store Image as an Antecedent of Shopping Value
2.2.1. Store Image
Since Martineau’s (1958) classic article emphasizing the idea that stores project a “personality”
to their shoppers, store image is seen as a valuable predictor of consumer behavior and store
performance (e.g. Arons 1961; Lessig 1973; Doyle/Fenwick 1974-75; Bellenger et al. 1976;
Stanley/Sewall 1976; Nevin/Houston 1980; Malhotra 1983; Sirgy/Samli 1985; Osman 1993;
Bloemer/DeRuyter 1998; Grewal/Monroe/Krishnan 1998). In literature, the dominant attitudinal
perspective treats store image as the result of a multi-attribute model (e.g. Bloemer/Oederker-
Schröder 2002). The diversity and multi-dimensionality of store image is impressively shown
by the work of Kunkel and Berry (1968) who reveal that the image of a store is composed of
Weitzl, W.; Zniva, R. 125

43 individual image dimensions. Jones (1999) distinguishes two dimensions of store image:
(1) customer factors - store attributes that cannot be controlled by the retailer and are more
closely related to the personal characteristics of the consumer, and (2) retailer factors - variables
that are directly related to the “four Ps of Marketing” (Raajpoot et al. 2008) which
can be controlled by the retailer. Since only the latter provides a potential basis for direct
managerial implications, this article focuses on the retail environment as a key element of
retailer-controllable factors. Based on previous research (e.g. Baker 1986; Sullivan/Savitt 1997;
Wakefield/Baker 1998; Bäckström/Johansson 2006) in-store environmental elements can be
classified as follows: (1) atmospheric (physical) cues; (2) social cues; and (3) merchandise
(assortment) cues.
(Ad 1) Atmospheric cues: Hoffmann and Turley (2002) argue that atmospheric cues are com-
posed of both tangible and intangible elements. Literature (e.g. Baker 1986; Sullivan/Savitt
1997; Baker et al. 2002) suggests that three dimensions of atmospheric cues exist: (1a) Store
design - This includes all sensually perceivable aspects of the physical store environment
(Scheuch 2001). Design factors cover the overall style that is largely expressed through the inte-
rior architecture of the store as well as other factors like interior decoration (e.g. flooring, car-
peting, wall composition, paint, wall paper, ceiling composition, furniture, racks and cases)
(Turley/Milliman 2000). (1b) Store layout - This atmospheric element describes the way in
which furnishings and equipment are arranged within the store, the size and shape of these
items, and the relationships that exist between them. Layout factors include elements like
the width of aisles, space design and allocation, placement of merchandise, grouping of mer-
chandise, work station placement, placement of equipment and department locations (Turley/
Milliman 2000). (1c) Store ambience - This dimension is commonly used to describe the more
intangible aspects of a retail environment. Ambient factors include elements such as music
(Milliman 1982; Areni/Kim 1993; Hui/Dubé/Chebat 1997; Yalch/Spangenberg 2000), odor
(Spangenberg/Crowley/Henderson 1996), colour (Bellizzini et al. 1983; Bellizzini/Hite 1992;
Baker et al. 2002) and lighting (Butler/Biner 1987).
(Ad 2) Social cues: The social dimension of a store is composed of all interactions (i.e. physi-
cal and emotional) that shoppers have with other members of society (Sullivan/Adcock 2002).
According to Baker (1986) social factors include the number, type and behavior of sales per-
sonnel and other customers within the store. (2a) Store personnel - Malhotra (1983) identified
service provided by store personnel as one of several salient characteristics of a store. The qual-
ity of interaction between a store’s personnel and its customers is seen as an important aspect of
shopping (Baker et al. 2002). Shoppers evaluate this store characteristic by assessing their per-
ceptions of how well they are being treated and how well they are receiving prompt and person-
al attention (Huddleston/Whipple/VanAuken 2004). (2b) Clientele - Tauber (1972) notes that
the marketplace has traditionally been a center of social activity. Rubenstein and Shaver (1980)
126 European Retail Research, Vol. 24, Issue I, pp. 121-148
as well as Westbrook and Black (1985) posit that some shoppers require social support while
shopping to reduce feelings of boredom and loneliness.
(Ad 3) Merchandise cues: A third category of crucial importance for the perception of
store image is a retail store’s merchandise (Lindquist 1974-75; Niven/Houston 1980). Product
assortment is defined as the number of different items in a purchase category (Levy/Weitz
1995). A strong merchandise mix provides shoppers with a wider choice of goods and therefore
enhances a store’s ability to fulfill the shoppers’ needs and wants (Golledge et al. 1966; Hanson
1980).
2.2.2. Relationship Between Store Image and Utilitarian Shopping Value
Prior research suggests that shoppers’ perceptions of monetary as well as non-monetary (psy-
chological) shopping costs can be influenced by the physical retail environment, and therefore
these elements of the store image are seen as being capable of improving utilitarian shopping
value (e.g. Ingene 1984; May 1989; Sherman/Mathur/Smith 1997). For example, store charac-
teristics like prestigious and appealing physical store attributes can compensate for the sacrifice
of time and effort (May 1989). Research on individual store design elements has shown that, for
example, product displays can facilitate the efficiency of the shopping activity by enhancing
utilitarian value through ease of information attainment, price comparison and shopping con-
venience (e.g. Chevalier 1975; Wilkinson/Mason/Paksoy 1982; Gagnon/Osterhaus 1985). Cot-
tet et al. (2006) provides additional evidence that utilitarian shopping value can be derived from
an easy access to information and products. Smith and Burns (1996) found an impact of store
layout on the perception of merchandise and value-for-money. Yalch and Spangenberg (1990)
demonstrate that the kind of music played can influence the time perceptions of the consumer.
In a similar way, music that is perceived favorably by the consumer may influence shopper eval-
uations of the time spent shopping (Baker et al. 2002) and therefore should reduce consumers’
perceptions of the non-monetary shopping costs (Chebat/Filiatrault 1993; Hui et al. 1997). Sim-
ilar results were presented for other ambience factors such as in-store colour which has been
found to impact feelings, store and merchandise images (e.g. product quality), as well as time
spent in store (Bellizzini et al. 1983; Bellizzini/Hite 1992). Based on the previous research we
propose:
H 1.1: Store design cues will positively influence utilitarian shopping value.
H 1.2: Store layout cues will positively influence utilitarian shopping value.
H 1.3: Store ambience cues will positively influence utilitarian shopping value.
Like physical cues, the presence and appearance of store personnel in a retail setting can be
regarded as tangible signals (i.e. cues) of in-store service quality (Parasuraman et al. 1988).
Weitzl, W.; Zniva, R. 127
Research provides evidence that the interaction between employees and customers affects con-
sumers’ assessments of the shopping experience (Hartline/Ferrell 1996). Store personnel affect
customer attitudes as well as satisfaction with a store’s offering (Grewal/Sharma 1991; Sharma
1997). Furthermore, store personnel have an important role for customized services because
they represent cues for the assessment of overall service quality (Ang/Leong/Lim 1997). Utili-
tarian shoppers, especially may regard service offerings that improve the efficiency of their
shopping activity as beneficial. Following previous research, we consequently suppose that:
H 1.4: Store personnel cues will positively influence utilitarian shopping value.
The importance of merchandise assortment for utilitarian value perceptions of the shopping
experience is recognized by Eastwick and Feinberg (1999) who state that the utilitarian value of
assortment seeking refers to the value a shopper derives from being exposed to a variety of mer-
chandise. A large variety of merchandise provides the shopper with a large number of comple-
mentary and/or substitutable goods and services. This offers the consumer the opportunity to
optimize his/her time, place and possession needs which are elementary utilitarian motives for
shopping. A large product variety minimizes the perceived costs (e.g. effort) associated with the
shopping experience (Huff 1962; Golledge et al. 1966; Hanson 1980). Because of this reason-
ing the following hypothesis is proposed:
H 1.5: Merchandise assortment will positively influence utilitarian shopping value.
2.2.3. Relationship Between Store Image and Hedonic Shopping Value
Consumers often shop for the appreciation of an experience. Hedonic shopping value is more
subjective and personal because it reflects the emotional worth of a shopping activity
(Babin/Darden/Griffin 1994). This perspective regards shopping as “fun” (Griffin et al. 2000),
rather than as a “task” (e.g. Batra/Ahtola 1991; Babin/Darden/Griffin 1994). Prior research
suggests that hedonic shopping value can be achieved, at least partly, through the store’s envi-
ronmental characteristics (e.g. Cottet/Lichtlé/Plichon 2006). Environmental psychologists
(e.g. Mehrabian/Russell 1974) and their marketing followers demonstrate that spatial environ-
ments can evoke pleasurable emotions and that these psychological reactions influence store
shoppers’ approach and/or avoidance behaviour (e.g. Donovan/Rossiter 1982, 1994; Babin/Dar-
den 1995; Wakefield and Baker 1998; Baker, Levy et al. 1992). Various researchers have
emphasized that some shoppers may derive pleasure and arousal from the sensory aspects of the
retail environment, such as sights, sounds, and smells (e.g. Hirsch 1995; Mitchell et al. 1995;
Bone/Ellen 1999; Eroglu/Machleit/Davis 2005). For example, Wakefield and Baker (1998)
argue that one of the most important roles of the shopping environment is to stimulate excite-
ment by its design and atmospherics. On the basis of this evidence, the following hypotheses are
proposed:
128 European Retail Research, Vol. 24, Issue I, pp. 121-148
H 2.1: Store design cues will positively influence hedonic shopping value.
H 2.2: Store layout cues will positively influence hedonic shopping value.
H 2.3: Store ambience cues will positively influence hedonic shopping value.
Tauber (1972) states that many shoppers visit a store to gain social experiences outside the
home. People like to shop in environments which they perceive as socially pleasant. Neverthe-
less, there are also negative effects of the presence of other customers within the store. For
example, if shoppers perceive a crowded layout, feelings of stress are experienced leading to
mental discomfort (Harrell et al. 1980; Hui/Bateson 1990, 1991). In crowded conditions, indi-
viduals experience higher levels of hostility and increased anxiety (Zeedyk-Ryan/Smith 1983)
and other negative emotions (Machleit/Eroglu/Mantel 2000; Eroglu/Machleit/Davis 2005).
Research provides evidence that crowding has a negative impact on shopping pleasure (Hui/
Bateson 1991). Therefore it is hypothesized that:
H 2.4: Store personnel cues will positively influence hedonic shopping value.
H 2.5: Clientele cues will positively influence hedonic shopping value.
An early study by Rich and Portins (1964) demonstrate that a large proportion of shoppers
derive their pleasure from shopping by seeing new items and getting new ideas. Strolling
through the store and browsing the merchandise offered provides shoppers with gratification
and pleasure as consumers can vicariously buy desirable products (Hirschman 1981). Addition-
ally, a great product selection provides the shopper with valuable information about the latest
products, fashions and trends. All these aspects can be regarded as central hedonic shopping
motives (Tauber 1972). Therefore, we expect assortment to be a vital aspect in the creation of
shopping enjoyment and hedonic value. We assert that:
H 2.6: Merchandise assortment will positively influence hedonic shopping value.
2.3. Consequences of Shopping Value
2.3.1. Customer Satisfaction and its Relationship to Perceived Shopping Value
Customer satisfaction can be regarded as one of the central concepts in the marketing literature
(e.g. Erevelles/Clark 1992; Oliver 1997). Nevertheless, a lack of consensus regarding an ade-
quate definition of consumer satisfaction is notable. In literature different types of satisfaction
conceptualizations can be identified. Generally, two approaches can be distinguished: One
stream of literature describes customer satisfaction as a process (Hunt 1977; Oliver 1981; For-
nell 1992), whereas the other perceives the construct as an outcome resulting from consumption
Weitzl, W.; Zniva, R. 129
(shopping) experience. The first position underlines the importance of an evaluation process
which emphasizes the confirmation-disconfirmation paradigm (Oliver/DeSarbo 1988). There-
fore customer satisfaction can be defined as “the consumer’s response to the evaluation of
the perceived discrepancy between prior expectations (or some other norm of performance) and
the actual performance of the product as perceived after its consumption” (Tse/Wilton 1988,
p. 204). According to the second position, customer satisfaction can be seen as a state of fulfill-
ment which is directly connected with reinforcement as well as arousal (Bloemer/Odekerken-
Schröder 2002). Furthermore, definitions of customer satisfaction are widely influenced by
context and differ depending on whether scholars evaluate consumers’ satisfaction against a
product (Churchill/Surprenant 1982; Swan et al. 1981), a consumption experience (Bearden/
Teel 1983; Fisk/Young 1985; Oliver 1980), or a purchase decision experience (Westbrook
1978). In line with Bloemer and De Ruyter (1998) the authors define customer satisfaction as
the outcome of a subjective evaluation in which the chosen alternative (the store) meets or
exceeds expectations.
Early research on the influence of shopping value on customer satisfaction shows a positive
impact of hedonic and utilitarian shopping value on satisfaction (Babin/Darden/Griffin 1994).
Patterson and Spreng (1997) stressed that the effect of perceived value on repurchase intentions
is completely mediated through customer satisfaction. Following Mano and Oliver (1993) cus-
tomer satisfaction can stem from the performance of a useful function or from intrinsically
pleasing properties, providing evidence for a direct relationship between perceived utilitarian
shopping value, hedonic shopping value, and customer satisfaction. Furthermore, those shop-
ping decisions or shopping situations which foster justification and rationality of choices espe-
cially are more likely to see their utilitarian aspects emphasized (Tversky/Sattah/Slovic 1988).
Thus grocery shopping can be regarded as a facet of a functional (and less hedonic) consump-
tion experience which especially demands a justification of store choice from the shopper. On
the basis of this evidence, the following hypotheses are proposed:
H 3.1: Utilitarian shopping value will positively influence customer satisfaction.
H 3.2: Hedonic shopping value will positively influence customer satisfaction.
H 3.3: Utilitarian shopping value will have a stronger influence on customer satisfaction
than hedonic shopping value.
2.3.2. Store Loyalty and its Relationship to Customer Satisfaction
Today, the retention of loyal customers is regarded as the key to profitability (Christopher/
Payne/Ballantyne 1991) and as a valuable asset in highly competitive markets (Srivastava/Sher-
vani/Fahey 1998). Oliver (1999) declares that store loyalty can be regarded as the most relevant
130 European Retail Research, Vol. 24, Issue I, pp. 121-148
determinant of retail marketing success and store longevity. Recent grocery retailing studies
have shown that loyal shoppers allocate proportionally more of their budget to their “first
choice store” compared to other customers, and they also spend more on groceries per se than
their fellow shoppers (Knox/Denison 2000). According to East et al. (1995) loyal supermarket
customers spend on average 32% more than other customers. Therefore, loyal shoppers repre-
sent the most profitable core of grocery store customers (East et al. 1994). Investments in the
establishment of long-term customer relationships find favor across many industries, particu-
larly in industries where customers face low switching costs because they are not locked in by a
contract (Shapiro/Vivian 2000). This is especially true for the retailing industry. According to
Huddleston et al. (2004) food retailers have to create and maintain a loyal customer base in
order to survive in today’s competitive markets.
Research on store loyalty has emphasized different approaches to conceptualize and measure
loyalty. The majority of studies prefer the behavioural approach, which defines loyalty as a ten-
dency of consumers to purchase repetitively in a certain period of time. Store loyalty is hereby
measured by purchase ratios, repetitive purchase behaviour or purchase frequency (Bustos-
Reyes/Gaonzález-Benito 2008). However, an important distinction involves the difference
between attitudinal loyalty and repeat purchase behaviour (Jacoby/Kyner 1973). The key refer-
ent of distinction is that attitudinal store loyalty involves a psychological commitment and con-
stitutes a personal preference to the retailer, whereas repeat purchase behaviour does not neces-
sarily involve a psychological commitment (Carpenter 2008). Various authors have therefore
accented the importance of considering both behavioural and attitudinal aspects of loyalty and
describe store loyalty as the favorable attitude and repetitive purchase behaviour of consumers
(e.g. Pritchard et al. 1992; Dick/Basu 1994). In line with Bloemer and De Ruyter (1998, p. 500)
the study at hand defines store loyalty as “… the biased (i.e. non-random) behavioural response
(i.e. revisit or repurchase), expressed over time by some decision making unit with respect to
one store out of a set of [stores], which is a function of psychological (decision making and
evaluative) processes resulting in brand [or store] commitment”. Store loyalty is therefore
expressed as an attitude and overt behaviour. “Customer commitment”, understood as “the
pledging or binding of an individual to his/her store choice” (Bloemer/De Ruyter 1998, p. 500),
is in this context a necessity of “true” store loyalty.
Research demonstrates a positive link between satisfaction and loyalty (e.g. Oliver 1980;
Cronin/Taylor 1992; Fornell 1992; Macintosh/Lockshin 1997; Reynolds/Beatty 1999; Reynolds/
Arnold 2000; Jones et al. 2006; Carpenter 2008). For example, Fornell et al. (1996) as well as
Anderson et al. (2004) point out that customer loyalty is determined to a large extent by cus-
tomer satisfaction. Satisfaction influences purchase intentions and positive word-of-mouth
which are both regarded as indicators of store loyalty (Boulding et al. 1993; Taylor/Baker 1994;
Zins 2001). In line with these findings, Cronin et al. (2000) state that a satisfied consumer tends
Weitzl, W.; Zniva, R. 131
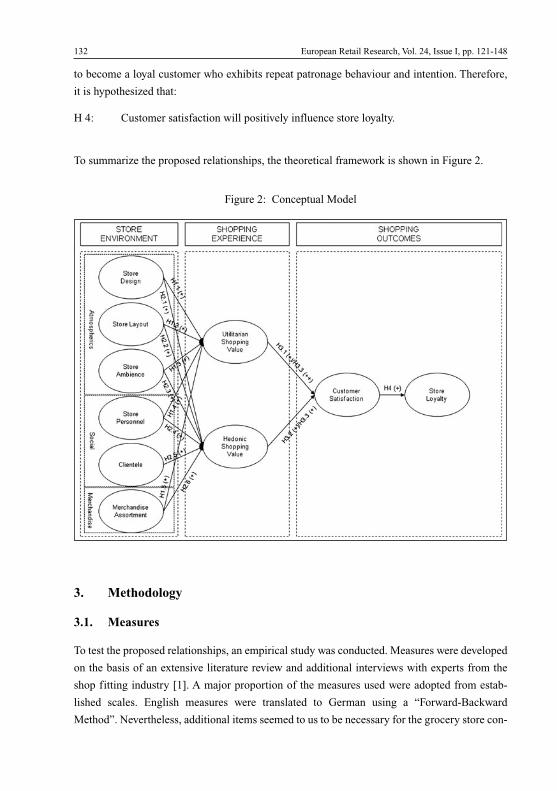
to become a loyal customer who exhibits repeat patronage behaviour and intention. Therefore,
it is hypothesized that:
H 4: Customer satisfaction will positively influence store loyalty.
To summarize the proposed relationships, the theoretical framework is shown in Figure 2.
132 European Retail Research, Vol. 24, Issue I, pp. 121-148
Figure 2: Conceptual Model
3. Methodology
3.1. Measures
To test the proposed relationships, an empirical study was conducted. Measures were developed
on the basis of an extensive literature review and additional interviews with experts from the
shop fitting industry [1]. A major proportion of the measures used were adopted from estab-
lished scales. English measures were translated to German using a “Forward-Backward
Method”. Nevertheless, additional items seemed to us to be necessary for the grocery store con-
text. Therefore, additional measures were incorporated which resulted from a rigid and iterative
scale development process (Churchill/Iacobucci 2005). The research instrument was pre-tested
before undertaking a full-scale quantitative survey.
Measurement of store image. The store environment was conceptualized by the following
dimensions: (1) store design; (2) store layout; (3) store ambience; (4) store personnel; (5) clien-
tele; and (6) merchandise assortment. After scale purification 37 items were used to assess the
store environment. Store design items originated from Wakefield and Baker (1998) and
Schnessl (2005). Items representing store layout, store ambience, store personnel, clientele and
merchandise assortment were taken from Bost (1987), Hightower et al. (2002), Gruber (2004)
and Schnessl (2005). Additional items originated from a series of expert interviews with store
design experts which served as basis for scale development. All items were measured by using
a seven-point Likert scale (from 0-I totally disagree, to 6-I totally agree). In order to assess
validity of the constructs an exploratory factor analysis (PCA, varimax rotation, eigenvalue cri-
terion) was performed. Validity of the six factors was supported as all indicators showed high
correlation with their corresponding store environment component and low correlations with all
other store dimensions. In total, the extracted factors explained 65% of the variance. Reliabili-
ty analysis was conducted for each construct based on the Cronbach’s alpha test of internal con-
sistency. All reliabilities (except for store ambience with .61) were between .81 and .90 - above
the required cut-off level (Nunnually 1978). Item-to-total correlations were above the cut-off
level of .40 and therefore acceptable.
Measurement of utilitarian and hedonic shopping value. Items measuring the utilitarian and
hedonic shopping value were taken from Babin et al. (1994) and Schnessl (2005). Additional
items were derived from interviews with retailing experts. Respondents used a seven-point Lik-
ert scale (from 0-I totally disagree, to 6-I totally agree) to indicate perceived value derived from
the shopping experience. Validity was assessed by an exploratory factor analysis (PCA, varimax
rotation, eigenvalue criterion) on the 12 scale items. Two factors emerged with eigenvalues
greater than one which together accounted for 67% of the variance in the data. As expected, all
scale items loaded highly on their respective factors and had low loadings on the other factor.
Cronbach’s alpha values above the .70 cut-off level and adequate item-to-total correlations sup-
port reliability of the two scales.
Measurement of customer satisfaction and store loyalty. Three items were used to evaluate a
shopper’s degree of satisfaction. In line with prior research (Groeppel-Klein 1997; Spieß, Hesse
et al. 1997; Mattila/Wirtz 2001) customer satisfaction was assessed through the evaluation of a
shopper’s satisfaction with (1) the purchase itself; (2) the shopping experience; and (3) the
store. Respondents indicated their degree of satisfaction on a seven-point rating scale (from 0
- very dissatisfied, to 6 - very satisfied). Three items were used to assess story loyalty: (1) the
Weitzl, W.; Zniva, R. 133

time the shopper was loyal to the store in the past; (2) the intention to visit the store again; and
(3) the intention to make future purchases. This satisfaction measure was adopted from Bost
(1987) and Spangenberg et al. (1996). Respondents rated prior patronage on a six-point rating
scale (0 - first time visit, 5 - over five years) and future shopping intentions on a seven-point rat-
ing scale ranging from 0 - very unlikely, to 6 - very likely. To confirm reported validity of both
shopping outcomes’ dimensions, an exploratory factor analysis was implemented. As expected,
two factors emerged with eigenvalues greater than one and together accounted for 72% of the
variance. Cronbach’s alpha values (above .71) and item-to-total correlation (above .42) provide
evidence for both measures.
3.2. Sample
Data collection was done by personal interviews using a standardized questionnaire as the
research instrument. The study was conducted in a major Austrian city with a population of
more than one million citizens. As for research location, two different grocery stores of the
same retail chain were selected. These supermarkets were similar with regard to their general
store layout, size (between 400 and 600 square meters) and merchandise offering (about 4,000
different grocery articles), reflecting a typical grocery store. Significance tests for differences
of means in the evaluation of the store environment between the two stores did not show
major differences; nevertheless, store design of one store was evaluated more positively
(Store 1: M = 4.07, SD = 1.06; Store 2: M = 3.52; SD = 1.07; p < .05). This result can be
explained by a recent architectural make-over of the better rated store. The location of both
stores was downtown and both supermarkets were within one kilometer apart. Both stores
served the needs of an upper-level clientele with a demand on high quality groceries and fan-
cy food. The study respondents were taken from a convenient sample of supermarket shop-
pers. The data collection was part of an undergraduate extra credit exercise in marketing
research. Twelve students trained and instructed in data collection procedures were used as
interviewers. Customers were intercepted in the store after checking out, close to the exit
where the respondents had no direct possibility of examining the interior of the store. Every
third shopper was approached and asked to participate in a ten-minute interview. A screening
question was used to evaluate that potential respondents who were just “passing through” the
store were omitted. Approximately 800 respondents who met the criteria for inclusion were
intercepted. Of these, 342 agreed to participate and provided data for the analysis. The relative
low response rate (43%) is a result of a time-constrained shopping situation, especially during
rush hour, which is typical for supermarkets. Shoppers were approached in the second and
third week of December, 2009. Data collection took place on five days of the week (Monday-
Friday), from 8 a.m. till 6 p.m. The demographic characteristics of the respondents are sum-
marized in Table 1.
134 European Retail Research, Vol. 24, Issue I, pp. 121-148
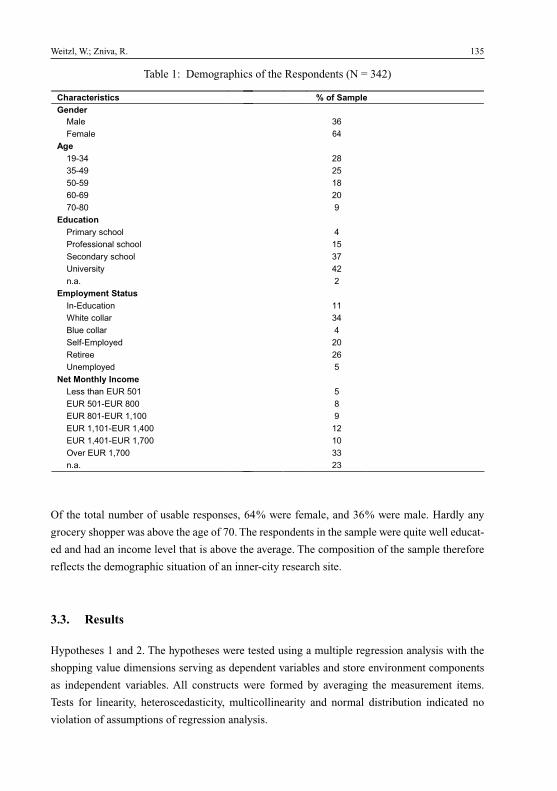
Of the total number of usable responses, 64% were female, and 36% were male. Hardly any
grocery shopper was above the age of 70. The respondents in the sample were quite well educat-
ed and had an income level that is above the average. The composition of the sample therefore
reflects the demographic situation of an inner-city research site.
3.3. Results
Hypotheses 1 and 2. The hypotheses were tested using a multiple regression analysis with the
shopping value dimensions serving as dependent variables and store environment components
as independent variables. All constructs were formed by averaging the measurement items.
Tests for linearity, heteroscedasticity, multicollinearity and normal distribution indicated no
violation of assumptions of regression analysis.
Weitzl, W.; Zniva, R. 135
�����������
��� ��
����
������
���
���
� �
�
���
����
� ������
������� ������
�������������������
��������� ������
��� ����!�
�"�"
����������������
#�$�%��!���
&��!� ������
'�%��������
����$�(�����
)�!����
����(�����
������������������
*��� !����$�) ��
$�) ��$�) ���
$�) ���$�) �+���
$�) �+���$�) �+���
$�) �+���$�) �+���
, ���$�) �+���
�"�"
� �� ����
��
��
��
��
��
��
��
��
�
�
��
�
��
��
�
�
�
��
��
��
��
Table 1: Demographics of the Respondents (N = 342)
64
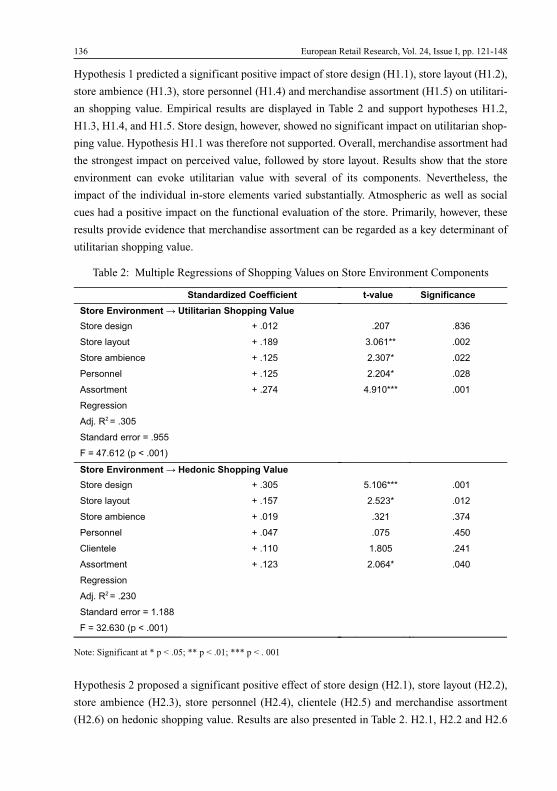
Hypothesis 1 predicted a significant positive impact of store design (H1.1), store layout (H1.2),
store ambience (H1.3), store personnel (H1.4) and merchandise assortment (H1.5) on utilitari-
an shopping value. Empirical results are displayed in Table 2 and support hypotheses H1.2,
H1.3, H1.4, and H1.5. Store design, however, showed no significant impact on utilitarian shop-
ping value. Hypothesis H1.1 was therefore not supported. Overall, merchandise assortment had
the strongest impact on perceived value, followed by store layout. Results show that the store
environment can evoke utilitarian value with several of its components. Nevertheless, the
impact of the individual in-store elements varied substantially. Atmospheric as well as social
cues had a positive impact on the functional evaluation of the store. Primarily, however, these
results provide evidence that merchandise assortment can be regarded as a key determinant of
utilitarian shopping value.
136 European Retail Research, Vol. 24, Issue I, pp. 121-148
������������ �������
�� � ����� ���� ������������� �� ����������
����� ���� � ����
����� ������ � ����
����� ������� � ����
��������� � ����
���������� � ����
�������
��!� � " �#��
�������� ����� " ����
$ " ���%�� &' ( ����)
�� � ����� ���� ���� ��� �� ����������
����� ���� � �#��
����� ������ � ����
����� ������� � ����
��������� � ����
*������� � ����
���������� � ���#
�������
��!� � " ��#�
�������� ����� " �����
$ " #��%#� &' ( ����)
�����������
����
����
����
����
����
����
����
��
���
���
���
�������
����
�����
�����
����
����
�����
�����
����
����
�� ��
����
Table 2: Multiple Regressions of Shopping Values on Store Environment Components
Note: Significant at * p < .05; ** p < .01; *** p < . 001
Hypothesis 2 proposed a significant positive effect of store design (H2.1), store layout (H2.2),
store ambience (H2.3), store personnel (H2.4), clientele (H2.5) and merchandise assortment
(H2.6) on hedonic shopping value. Results are also presented in Table 2. H2.1, H2.2 and H2.6
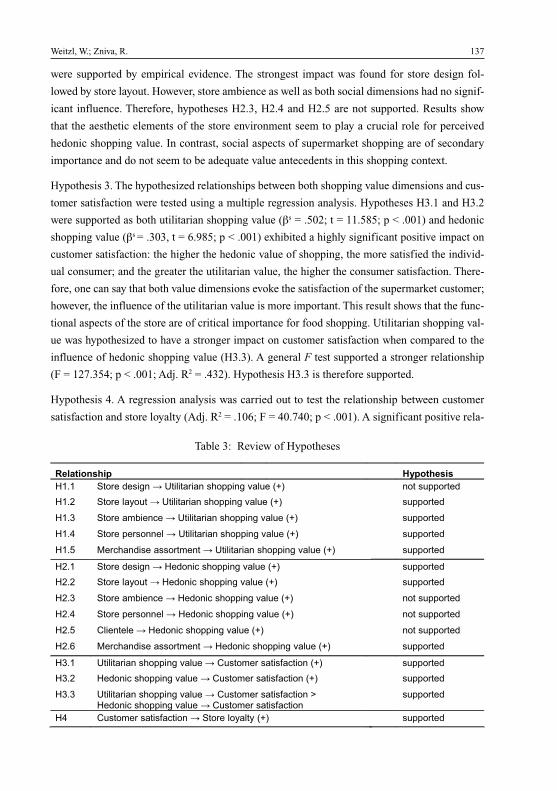
were supported by empirical evidence. The strongest impact was found for store design fol-
lowed by store layout. However, store ambience as well as both social dimensions had no signif-
icant influence. Therefore, hypotheses H2.3, H2.4 and H2.5 are not supported. Results show
that the aesthetic elements of the store environment seem to play a crucial role for perceived
hedonic shopping value. In contrast, social aspects of supermarket shopping are of secondary
importance and do not seem to be adequate value antecedents in this shopping context.
Hypothesis 3. The hypothesized relationships between both shopping value dimensions and cus-
tomer satisfaction were tested using a multiple regression analysis. Hypotheses H3.1 and H3.2
were supported as both utilitarian shopping value (�s = .502; t = 11.585; p < .001) and hedonic
shopping value (�s = .303, t = 6.985; p < .001) exhibited a highly significant positive impact on
customer satisfaction: the higher the hedonic value of shopping, the more satisfied the individ-
ual consumer; and the greater the utilitarian value, the higher the consumer satisfaction. There-
fore, one can say that both value dimensions evoke the satisfaction of the supermarket customer;
however, the influence of the utilitarian value is more important. This result shows that the func-
tional aspects of the store are of critical importance for food shopping. Utilitarian shopping val-
ue was hypothesized to have a stronger impact on customer satisfaction when compared to the
influence of hedonic shopping value (H3.3). A general F test supported a stronger relationship
(F = 127.354; p < .001; Adj. R2 = .432). Hypothesis H3.3 is therefore supported.
Hypothesis 4. A regression analysis was carried out to test the relationship between customer
satisfaction and store loyalty (Adj. R2 = .106; F = 40.740; p < .001). A significant positive rela-
Weitzl, W.; Zniva, R. 137
����������
���� ���� �� � � ����������� ������� ���� ���
���� ���� ������ ������������� ������� ���� ���
���� ���� ����� � ����������� ������� ���������
���! ���� ������� � ����������� ������� ���������
���" #� ����� ��������� � ����������� ������� ���� ���
���� ���� �� � � ���� ������� ���������
���� ���� ������ ������ ������� ���� ���
���� ���� ����� � ���� ������� ���������
���! ���� ��������� ���� ������� ���� ���
���" $����� � ���� ������� ���������
���% #� ����� ��������� � ���� ������� ���� ���
���� ����������� ������� ��������$������ �����&� ��������
���� ���� ������� ����� � $������ �����&� ��������
���� ����������� ������� ������� $������ �����&� �����'���� ������� ����� � $������ �����&� ����
�! $������������&� ���� � ���� ������� ���
�������
�����������
�������
�������
�������
�������
�������
�������
�����������
�����������
�����������
�������
�������
�������
�������
�������
Table 3: Review of Hypotheses
tionship was observed (�s = .330; t = 6.383). The more satisfied shoppers were, the higher was
their loyalty towards the stores. Therefore, hypothesis H4 is supported. Table 3 summarizes the
results of the hypotheses tests.
4. Discussion and Implications
This study provides insights into the complex relationship between store image characteristics
with customer satisfaction as well as store loyalty as key shopping outcomes. By doing this, the
mediating role of shopping value has been accentuated.
Results show that various store image characteristics affect both shopping value dimensions.
All three shopping dimensions - (1) environmental cues; (2) social cues; and (3) merchandise
cues - were found to influence value perceptions of the shopping experience to varying degrees.
Merchandise assortment showed the strongest impact on utilitarian shopping value: the better
the shopper perceives the variety of merchandise offerings, the higher her/his perceived utilitar-
ian shopping value will be. This means that product availability plays a central role for the eval-
uation of the successful fulfillment of the shopping task in the grocery context. This perspective
is supported by earlier research by Cottet et al. (2006). This study, in contrast, was able to iden-
tify additional, store image components contributing to the functional value of shopping: store
layout, ambience and store personnel. Each have been found to impact this value dimension;
however, their influence seemed to be weaker compared to the product-related factor. Regard-
ing the hedonic side of shopping, the study at hand presents a different picture. Here, store
design contributes foremost to the hedonic shopping experience, emphasizing the importance
of the aesthetics of the shopping environment. Furthermore, layout factors and merchandise
assortment can also be considered important drivers of hedonic shopping value. Surprisingly, a
positive relationship with ambient conditions was not indicated. Generally, the study provides
some evidence that the social dimension of shopping in general plays a relatively minor role in
grocery shopping. This is especially true of the presence of other customers who in this context
do not seem to have an influence on either shopping value dimension. These results punctuate
the findings of Cox et al. (2005) who noted that relatively few consumers visit a store to mingle
with other shoppers. An explanation for this finding may be the nature of the shopping activity
itself. Especially in the grocery context, the majority of shoppers are task-oriented and want to
do their shopping in an effective and efficient manner.
The study furthermore extends previous research contributions on the main effects of value on
satisfaction (e.g. Cronin/Brady/Hult 2000). The grocery shopping experience is capable of
evoking not only utilitarian value but to also stimulate the hedonic side of consumption. Both
value dimensions were shown to be important for feelings of satisfaction; however, in the con-
138 European Retail Research, Vol. 24, Issue I, pp. 121-148
text of frequently purchased products the emerging assumption that both shopping values play
nearly equal roles in predicting shopping outcomes (e.g. Batra/Ahtola 1991; Babin/Attaway
2000) can be questioned. This reinforces other authors who propose differential effects of utili-
tarian versus hedonic shopping value on satisfaction (Patterson/Spreng 1997; Woodruff 1997;
Cottet/Lichtlé/Plichon 2006; Jones/Reynolds/Mark 2006). Utilitarian value seems to be a better
predictor of customer satisfaction than the hedonic counterpart. It appears that shoppers turn to
the grocery market in order to fulfill primarily functional, product-related shopping goals.
In addition, results demonstrate that a positive relationship between shopping value and store
loyalty exists, but this effect is to a large degree mediated by customer satisfaction with the
shopping experience. This finding gives empirical support to the relevance of the satisfaction-
builds-loyalty framework in the grocery shopping context. It is likely that shoppers who have
been successful in fulfilling their shopping task remember the shopping experience positively
and are likely to visit the retailer again in the case of similar shopping needs.
From the managerial perspective it is worth noting that the store image characteristics are capa-
ble of influencing perceived in-store value which has a further impact on customer satisfaction
and store loyalty. Especially in grocery retailing, where the utilitarian side of shopping is the key
determinant of a positive perception of the shopping experience. Even so, store aesthetics are
also able to influence shopping experience and major shopping outcomes, and retailers are well
advised to enhance their stores’ functional aspects. Grocery shoppers seem to prefer a great vari-
ety of different products and brands. However, only a store that grants a quick orientation, rapid
access to the products and fast checkout enhances the quality of the shopping activity.
5. Limitations and Future Research
The study concentrates its efforts on the evaluation of grocery shopping and is therefore not in
the position to translate the findings to other retailing sectors. It is very likely that shopping
motivations and values differ in other retail formats like apparel and electronics. There, the
impact of hedonic shopping value on customer satisfaction might be stronger. That proposition
needs to be tested empirically in future studies. The results of the study at hand may have been
influenced by the distinct demographics of the sample, which was drawn from downtown super-
market shoppers. Nevertheless, there exists some heterogeneity among the sample - most par-
ticipants showed typical inner-city demographic profiles (i.e. high level of education, etc.).
Further research should overcome this restriction and should investigate the effects of demo-
graphics in further detail. Future research should also investigate additional types of shopping
values. The authors assume that a dichotomy of shopping values exists. More recent bus-limit-
ed research provides some evidence that other dimensions like the social aspects of shopping
Weitzl, W.; Zniva, R. 139

should be taken into consideration when evaluating shopping activities and their value (Diep/
Sweeney 2008). Research emphasizing the dimensionality of shopping value would be benefi-
cial for a better understanding of shopping outcomes.
Some results of the study at hand demand further analysis. It might be considered surprising
that ambience factors had a significant positive impact on utilitarian shopping value but no
effect on hedonic shopping value. A qualitative study could provide a deeper understanding of
this observation. From a methodological perspective, all constructs were measured with reflec-
tive items in line with prior research. Some store environment components (like, for example,
store ambience) might also be viewed as being formed by different characteristics (such as tem-
perature, scent, etc.) suggesting a formative measurement model. Future research might take a
closer look at this distinction.
Finally, all relationships in the model were tested with a series of regression analyses. Future
research should use advanced methodologies (such as structural equation modeling) to compre-
hensively examine the proposed framework. Such an approach would allow researchers to test
mediation effects, too.
Notes
[1] Measurement items are available upon request from the authors.
References
Anderson, E.W.; Fornell, C.; Mazvancheryl, S.K. (2004): Customer satisfaction and sharehold-er value, in: Journal of Marketing, Vol. 68, No. 4, pp. 172-185.
Ang, S.H.; Leong, S.W.; Lim, J. (1997): The mediating influence of pleasure and arousal on lay-out and signage effects: Comparing more and less customized retail services, in: Journal ofRetailing and Consumer Services, Vol. 4, No. 1, pp. 13-24.
Annamma, J.; Sherry, J.F. (2003): Speaking of art as embodied imagination: A multisensoryapproach to understanding aesthetic experience, in: Journal of Consumer Research, Vol. 30,No. 2, pp. 259-282.
Areni, C.S.; Kim, D. (1993): The influence of background music on shopping behavior: Classi-cal versus top-forty music in a wine store, in: Advances in Consumer Research, Vol. 20, pp.336-340.
Arons, L. (1961): Does television viewing influence store image and shopping frequency?, in:Journal of Retailing, Vol. 37, No. 3, pp. 1-13.
Aubert-Gamet, V.; Cova, B. (1999): Servicescapes: From modern non-places to postmoderncommon places, in: Journal of Business Research, Vol. 44, No. 1, pp. 37-45.
Babin, B.J.; Attaway, J.S. (2000): Atmospheric affect as a tool for creating value and gainingshare of customer, in: Journal of Business Research, Vol. 49, No. 2, pp. 91-99.
140 European Retail Research, Vol. 24, Issue I, pp. 121-148
Babin, B.J.; Darden, W.R. (1995): Consumer self-regulation in a retail environment, in: Journalof Retailing, Vol. 71, No. 1, pp. 47-70.
Babin, B.J.; Darden, W.R.; Griffin, M. (1994): Work and/or fun: Measuring hedonic and utilitar-ian shopping, in: Journal of Consumer Research, Vol. 20, No. 4, pp. 644-656.
Babin, B.J.; Hardesty, D.M.; Suter, T.A. (2003): Color and shopping intentions: the interveningeffect of price fairness and perceived affect, in: Journal of Business Research, Vol. 56, pp.541-551.
Bäckström, K.; Johansson, U. (2006): Creating and consuming experiences in retail store envi-ronments: Comparing retailer and consumer perspectives, in: Journal of Retailing and Con-sumer Services, Vol. 13, pp. 417-430.
Baker, J. (1986): The role of the environment in marketing services: The consumer perspective,in: Czepiel J.A.; Congram C.A.; Shanathan, J. (eds.): The service challenge: Integrating forcompetitive advantage, Chicago, IL, pp. 79-84.
Baker, J.; Levy, M.; Dhruv, G. (1992): An experimental approach to making retail store environ-mental decisions, in: Journal of Retailing, Vol. 68, No. 4, pp. 445-460.
Baker, J.; Parasuraman, A.; Dhruv, G.; Voss G.B. (2002): The influence of multiple store envi-ronment cues on perceived merchandise value and patronage intentions, in: Journal of Mar-keting, Vol. 66, No. 2, pp. 120-141.
Batra, R.; Ahtola, O.T. (1991): Measuring the hedonic and utilitarian sources of consumer atti-tudes, in: Marketing Letters, Vol. 2, No. 2, pp. 159-170.
Bearden, W.O.; Teel, J.E. (1983): Selected determinants of consumer satisfaction and complaintreports, in: Journal of Marketing Research, Vol. 20, No. 1, pp. 21-28.
Belk, R. (1979): Gift giving behavior, in: Jagdish, S. (ed.): Research in Marketing, Greenwich,CT, p. 2.
Bellenger, D.N.; Steinberg, E. (1976): The congruence of store image and self image as itrelates to store loyalty, in: Journal of Retailing, Vol. 52, No. 1, pp. 17.
Bellizzini, J.A.; Crowley, A.E.; Hasty, R.W. (1983): The effects of color in store design, in: Jour-nal of Retailing, Vol. 59, No. 1, pp. 21-44.
Bellizzini, J.A.; Hite, R. E. (1992): Environmental color, consumer feelings, and purchase like-lihood, in: Psychology & Marketing, Vol. 9, No. 5, pp. 347-364.
Bettman, J.R. (1979): An information processing theory of consumer choice, Reading, MA.
Blackwell, R.D.; Miniard, P.W.; Engel, J.W. (2001): Consumer behavior, Mason, OH.
Bloch, B.; Richins, M.L. (1983): Shopping without purchase: an investigation of consumerbroswing behavior, in: Advances in Consumer Research, Vol. 10, pp. 389-393.
Bloemer, J.; De Ruyter, K. (1998): On the relationship between store image, store satisfactionand store loyalty, in: European Journal of Marketing, Vol. 32, No. 5/6, p. 499.
Bloemer, J.; Odekerken-Schroder, G. (2002): Store satisfaction and store loyalty explained bycustomer- and store-related factors, in: Journal of Consumer Satisfaction, Dissatisfactionand Complaining Behavior, Vol. 15, pp. 68-80.
Bone, P.F.; Ellen, P.S. (1999): Scents in the marketplace: Explaining a fraction of olfaction, in:Journal of Retailing, Vol. 75, No. 2, pp. 243-262.
Bost, E. (1987): Ladenatmosphäre und Konsumentenverhalten, Heidelberg.
Weitzl, W.; Zniva, R. 141
Boulding, W.; Karla, A.; Staelin, R.; Zeithaml, V.A. (1993): A dynamic process model of serv-ice quality: From expectations to behavioral intentions, in: Journal of Marketing Research,Vol. 30, No. 1, pp. 7-27.
Bustos-Reyes, C.A.; Gaonzález-Benito, O. (2008): Store and store format loyalty measuresbased on budget allocation, in: Journal of Business Research, Vol. 61, No. 9.
Butler, D.L.; Biner, P.M. (1987): Preferred lighting levels: variability among settings, behaviorsand individuals, in: Environment and Behaviour, Vol. 19, No. 6, pp. 695-721.
Carpenter, J.M. (2008): Consumer shopping value, satisfaction and loyalty in discount retailing,in: Journal of Retailing and Consumer Services, Vol. 15, No. 6, pp. 358-363.
Carpenter, J.M.; Moore, M.; Fairhurst, A.E. (2005): Consumer shopping value for retail brands,in: Journal of Fashion Marketing and Management, Vol. 9, No. 1, pp. 43-53.
Chandron, P.; Wansink, B.; Laurent, G. (2000): A benefit congruency framework of sales pro-motion and effectiveness, in: Journal of Marketing, Vol. 64, No. 4, pp. 65-81.
Chebat, C.G.; Filiatrault, P. (1993): Interactive effects of musical and visual cues on time per-ceptions: an application to waiting lines in banks, in: Perceptual and Motor Skills, Vol. 77,No. 3, pp. 995-1020.
Chevalier, M. (1975): Increase in sales due to in-store display, in: Journal of MarketingResearch, Vol. 12, November, pp. 426-431.
Christopher, M.; Payne, A.; Ballantyne, D. (1991): Relationship Marketing, Oxford.
Churchill, G.A.; Iacobucci, D. (2005): Marketing research - Methodological foundations, Mason,OH.
Churchill, G.A.; Surprenant, C. (1982): An investigation into the determinants of customer sat-isfaction, in: Journal of Marketing Research, Vol. 19, No. 4, pp. 491-504.
Cottet, P.; Lichtle, M.C.; Plichon, V. (2006): The role of value in services: a study in a retailenvironment, in: Journal of Consumer Marketing, Vol. 23, No. 4, pp. 219-227.
Cox, A.D.; Cox, D.; Anderson, R.D. (2005): Reassessing the pleasures of store shopping, in:Journal of Business Research, Vol. 58, No. 3, pp. 250-259.
Cronin, J.J.; Brady, M.K.; Hult, G.T.M. (2000): Assessing the effects of quality, value, and cus-tomer satisfaction on consumer behaviour intentions in service environments, in: Journal ofRetailing, Vol. 76, No. 2, pp. 193-218.
Cronin, J.J.; Taylor, S.A. (1992): Measuring service quality: A reexamination and extension, in:Journal of Marketing, Vol. 56, No. 3, pp. 55-68.
Dick, A.S.; Basu, K. (1994): Customer loyalty: Toward an integrated conceptual framework, in:Journal of the Academy of Marketing Science, Vol. 22, No. 2, pp. 99-114.
Diep, V.C.S.; Sweeney, J.C. (2008): Shopping trip value: Do stores and products matter?, in:Journal of Retailing and Consumer Services, Vol. 15, pp. 399-409.
Donovan, R.J.; Rossiter, J.R. (1982): Store atmosphere: An environmental psychology approach,in: Journal of Retailing, Vol. 58, No. 1, pp. 34-58.
Donovan, R.J.; Rossiter, J.R.; Marcoolyn, G.; Nesdale, A. (1994): Store atmosphere and pur-chasing behaviour, in: Journal of Retailing, Vol. 70, No. 3, pp. 283-294.
Doyle, P.; Fenwick, I. (1974-75): How store images affect shopping habits in grocery chains, in:Journal of Retailing, Vol. 50, No. 4, pp. 39-52.
142 European Retail Research, Vol. 24, Issue I, pp. 121-148
East, J.R.; Lomax, W.; Willson, G.; Harris, P. (1994): Decision making and habit in shoppingtimes, in: European Journal of Marketing, Vol. 28, No. 4, pp. 56-71.
East, R.; Harris, P.; Willson, G.; Lomax, W. (1995): Loyalty to supermarkets, in: InternationalReview of Retail, Distribution and Consumer Research, Vol. 5, No. 1, pp. 99-109.
Eastwick, M.A.; Feinberg, R.A. (1999): Shopping motives for mail catalog shopping, in: Jour-nal of Business Research, Vol. 45, No. 3, pp. 281-290.
Erevelles, S.; Clark, L. (1992): A comparison of current models of consumer satisfaction/dis-satisfaction, in: Journal of Consumer Satisfaction, Dissatisfaction and Complaining Behav-ior, Vol. 5, No. 1, pp. 104-114.
Eroglu, S.A.; Machleit, K.A.; Chebat, J.C. (2005): The interaction of retail density and musictempo: Effects on shopper response, in: Psychology & Marketing, Vol. 22, No. 7, pp. 577-589.
Fischer, E.; Arnold, S.J. (1990): More than a labor of love: Gender roles and Christmas giftshopping, in: Journal of Consumer Research, Vol. 17, No. 3, pp. 333-345.
Fisk, R.; Young, C. (1985): Disconfirmation of equity expectations. Effects on consumer satis-faction with service, in: Advances in Consumer Research, Vol. 12, No. 1, p. 340-345.
Fornell, C. (1992): A national customer satisfaction barometer: the Swedish experience, in:Journal of Marketing, Vol. 56, No. 1, pp. 6-21.
Fornell, C.; Johnson, M.D.; Anderson, E.W.; Cha, J.; Bryant, B.E. (1996): The American cus-tomer satisfaction index: nature, purpose, and findings, in: Journal of Marketing, Vol. 60,No. 4, pp. 7-18.
Gagnon, J.P.; Osterhaus, J.T. (1985): Research note: effectiveness of floor displays on the salesof retail products, in: Journal of Retailing, Vol. 61, No. 1, pp. 104-116.
Golledge, R.S.; Rushton, G.; Clark, W.A.V. (1966): Some spatial characteristics or Iowa’s dis-persed farm population and their implications for the grouping of central places functions,in: Economic Geography, Vol. 42, pp. 261-272.
Grewal, D.; Monroe, K.B.; Krishnan, R. (1998): The effects of price-comparison advertising onbuyers’ perception of acquisition value, transaction value, and behavioral intentions, in:Journal of Marketing, Vol. 62, No. 2, pp. 46-59.
Grewal, D.; Sharma, A. (1991): The effect of salesforce behavior on customer satisfaction: aninteractive framework, in: Journal of Personal Sales Management, Vol. 11, No. 2, pp. 13-23.
Griffin, M.; Babin, B.J.; Modianos, D. (2000): Shopping values of Russian consumers: theimpact of habituation in a developing economy, in: Journal of Retailing, Vol. 76, No. 1, pp.33-52.
Groeppel-Klein, A. (1997): The influence of the dominance perceived at the point-of-sale onthe price assessment, in: European Advances in Consumer Research, Vol. 3, pp. 304-311.
Groeppel, A.; Bloch, B. (1990): An investigation of experience-oriented consumers in retailing,in: The International Review of Retail, Distribution and Consumer Research, Vol. 1, No. 1,pp. 101-118.
Gruber, E. (2004): Die Attraktivität von Einkaufsstätten im Handel, Wiesbaden.
Hanson, S. (1980): Spatial diversification and multipurpose travel: implications for choice the-ory, in: Geographical Analysis, Vol. 12, pp. 245-257.
Harrell, G.D.; Hutt, M.D.; Anderson J.C. (1980): Path analysis of buyer behavior under condi-tions of crowding, in: Journal of Marketing Research, Vol. 17, February, pp. 45-51.
Weitzl, W.; Zniva, R. 143
Hartline, M.D.; Ferrell, O.C. (1996): The management of customer-contact service employees,in: Journal of Marketing, Vol. 60, No. 4, pp. 52-70.
Heskett, J.L.; Jones, T.O.; Loveman, G.W.; Sasser, W.E.; Schlesinger, L.A. (1994): Putting theservice-profit chain to work, in: Harvard Business Review, Vol. 72, No. 2, pp. 164-174.
Hightower, R.; Brady, M.K.; Baker, T.L. (2002): Investigating the role of the physical environ-ment in hedonic service consumption: an exploratory study of sporting events, in: Journal ofBusiness Research, Vol 55, No. 9, pp. 697-707.
Hirsch, A.R. (1995). “Effects of ambient odors on slot-machine usage in a Las Vegas casino.”Psychology & Marketing, Vol. 12, No. 7, pp. 585-594.
Hirschman, E.C. (1981): Retail Research and Theory, in: Enis, B.; Roering, K. (eds.): Reviewof Marketing, Chicago, pp. 120-133.
Hoffman, K.D.; Turley, L.W. (2002): Atmospherics, service encounters and consumer decisionmaking: An integrative perspective, in: Journal of Marketing Theory, Vol. 10, No. 3, pp. 33-47.
Holbrook, M.B. (1999): Introduction to consumer value. Customer value: a framework foranalysis and research, London, UK.
Holbrook, M.B. (1994): The Nature of Customer Value: An Axiology of Services in the Con-sumption Experience, in: Rust, R.T.; Oliver, R.L. (eds.): Service Quality: New Directions inTheory and Practice, Newbury Park, CA, pp. 21–71.
Holbrook, M.B.; Hirschman, E.C. (1982): The experiential aspects of consumption: Consumerfantasies, feelings, and fun, in: Journal of Consumer Research, Vol. 9, No. 2, pp. 132-141.
Huddleston, P.; Whipple, J.; VanAuken, A. (2004): Food store loyalty: Application of a con-sumer loyalty framework, in: Journal of Targeting, Measurement and Analysis for Market-ing, Vol. 12, No. 3, pp. 213-230.
Huff, D.L. (1962): Determination of intra-urban retail trade areas, in: Real Estate Research Pro-gram, Los Angeles, pp. 11-12.
Hui, M.K.; Bateson, J.E.G. (1990): Testing a theory of crowding in the service environment, in:Advances in Consumer Research, Vol. 17, pp. 866-873.
Hui, M.K.; Bateson, J.E.G. (1991): Perceived control and the effects of crowding and con-sumer choice on the service experience, in: Journal of Consumer Research, Vol. 18, No. 2,pp. 174-184.
Hui, M.K.; Dube, L. (1997): The impact of music on consumers’ reactions to waiting for serv-ices, in: Journal of Retailing, Vol. 73, No. 1, pp. 87-104.
Hunt, H.K. (1977). Conceptualization and measurement of customer satisfaction and dissatis-faction, Cambridge, MA.
Ingene, C. (1984): Productivity and functional shifting in spatial retailing: private and socialperspectives, in: Journal of Retailing, Vol. 60, No. 3, pp. 15-36.
Jacoby, J.; Kyner, D.B. (1973): Brand loyalty vs. repeat purchasing behavior, in: Journal of Mar-keting Research, Vol. 10, No. 1, pp. 1-9.
Jones, M.A. (1999): Entertaining shopping experiences: An exploratory investigation, in: Jour-nal of Retailing and Consumer Services, Vol. 6, No. 3, pp. 128-139.
Jones, M.A.; Reynolds, K.E.; Mark, J.A. (2006): Hedonic and utilitarian shopping value: Inves-tigating differential effects on retail outcomes, in: Journal of Business Research, Vol. 59,No. 9, pp. 974-981.
144 European Retail Research, Vol. 24, Issue I, pp. 121-148
Klein, L.; Ford, G. (2003): Consumer search for information in the digital age: an empiricalstudy of prepurchase search for automobiles, in: Journal of Interactive Marketing, Vol. 17,No. 3, pp. 29-49.
Knox, S.D.; Denison, T.J. (2000): Store loyalty: Its impact on retail revenue. An empirical studyof purchasing behaviour in the UK, in: Journal of Retailing and Consumer Services, Vol. 7,No. 1, 33-45.
Kotler, P. (1973): Atmospherics as a marketing tool, in: Journal of Retailing, Vol. 49, No. 4,p. 48.
Kunkel, J.H.; Berry L.L. (1968): A behavioral conception of retail image, in: Journal of Market-ing, Vol. 32, No. 4, pp. 21-27.
Lessig, V.P. (1973): Consumer store images and store loyalties, in: Journal of Marketing,Vol. 37, No. 4, pp. 72-74.
Levy, M.; Weitz, B.A. (1995): Retailing management, Chicago, IL.
Lindquist, J.D. (1974-75): Meaning of image: survey of empirical and hypothetical evidence,in: Journal of Retailing, Vol. 50, No. 4, pp. 29-38.
Machleit, K.A.; Eroglu, S.A.; Mantel S.P. (2000): Perceived retail crowding and shopping satis-faction: What modifies this relationship?, in: Journal of Consumer Psychology, Vol. 9,No. 1, pp. 29-42.
Maciontosh, G.; Lockshin, L.S. (1997): Retail relationships and store loyalty: A multi-level per-spective, in: International Journal of Research in Marketing, Vol. 14, No. 5, pp. 487-497.
Malhotra, N. (1983): A threshold model of store choice, in: Journal of Retailing, No. 2, Vol. 59,pp. 3-21.
Mano, H.; Oliver, R.L. (1993): Assessing the dimensionality of the consumption experience:evaluation, feeling and satisfaction, in: Journal of Consumer Research, Vol. 20, No. 4,pp. 451-466.
Martineau, P. (1958): The personality of the retail store, in: Harvard Business Review, Vol. 36,No. 1, pp. 47-55.
Mattila, A.S.; Wirtz, J. (2001): Congruency of scent and music as a driver of in-store evalua-tions and behavior, in: Journal of Retailing, Vol. 77, No. 2, pp. 273-289.
May, E. (1989): A retail odyssey, in: Journal of Marketing, Vol. 65, No. 3, pp. 356-367.
Mehrabian, A.; Russell, J.A. (1974): An approach to environmental psychology, Cambridge,MA.
Milliman, R.E. (1982): Using background music to affect the behaviour of supermarket shop-pers, in: Journal of Marketing, Vol. 46, No. 3, pp. 86-91.
Mitchell, D.J; Kahn, B.E.; Knasko, S.C. (1995): There’s something in the air: Effects of congru-ent or incongruent ambient odor on consumer decision making, in: Journal of ConsumerResearch, Vol. 22, No. 2, pp. 229-238.
Nevin, J.; Houston, M. (1980): Images as a component of attractiveness to intra-urban shoppingareas, in: Journal of Retailing, Vol. 56, No. 1, pp. 77-93.
Nunually, J.C. (1978): Psychometric theory, New York, NY.
O’Curry, S.; Strahilevitz, M. (2001): Probability and mode of acquisition effects on choicesbetween hedonic and utilitarian options, in: Marketing Letters, Vol. 12, No. 1, pp. 37-49.
Weitzl, W.; Zniva, R. 145
Oliver, R.L. (1980): A cognitive model of the antecedents and consequences of satisfactiondecisions, in: Journal of Marketing Research, Vol. 17, No. 4, pp. 460-469.
Oliver, R.L. (1981): Measurement and evaluation of satisfaction process in retail setting, in:Journal of Retailing, Vol. 57, No. 3, pp. 25-48.
Oliver, R.L. (1997): Satisfaction, New York, NY.
Oliver, R.L. (1999): Whence consumer loyalty?, in: Journal of Marketing, Vol. 63, No. 1, pp.33-45.
Oliver, R.L.; DeSarbo, W.S. (1988): Response determinants in satisfaction judgements, in:Journal of Consumer Research, Vol. 14, No. 4, pp. 495-507.
Osman, M.Z. (1993): A conceputal model of retail image influences on loyalty patronagebehavior, in: International Review of Retail, Distribution and Consumer Research, Vol. 3,No. 2, pp. 133-148.
Ostrom, A.; Iacobucci, D. (1995): Consumer trade-offs and the evaluation of services, in: Jour-nal of Marketing, Vol. 59, No. 1, pp. 17-28.
Overby, J.W.; Lee, E.-J. (2006): The effects of utilitarian and hedonic online shopping valueon consumer preference and intentions, in: Journal of Business Research, Vol. 59, No. 10,pp. 1160-1166.
Parasuraman, A.; Zeithaml, V.A.; Berry L.L. (1988): SERVQUAL: a multiple-item scale formeasuring consumer perceptions of service quality, in: Journal of Retailing, Vol. 64, No. 1,pp. 12-40.
Patterson, P.G.; Spreng, R.A. (1997): Modelling the relationship between perceived value, sat-isfaction and repurchase intentions in a business-to-business services context: an empiricalexamination, in: International Journal of Service Industry Management, Vol. 8, No. 5, pp.414-434.
Pine, B.J.; Gilmore, J.H. (1999): The experience economy - work is theatre and every businessa stage, Boston, MA.
Prahalad, C.K.; Ramaswamy, V. (2004): The future of competition: Co-creating unique valuewith customers, Boston, MA.
Pritchard, M.P.; Howard, D.R.; Havitz, M.E. (1992): Loyalty measurement: a critical examina-tion and theoretical extension, in: Leisure Sciences, Vol. 14, No. 2, pp. 155-164.
Raajpoot, N.A.; Sharma, A.; Chebat, J.C. (2008): The role of gender and work status in shop-ping center patronage, in: Journal of Business Research, Vol. 61, No. 8, pp. 825-833.
Reynolds, K.E.; Arnold, M.J. (2000): Customer loyalty to the salesperson and the store: exam-ining relationship customers in an upscale retail context, in: Journal of Personal Selling andSales Management, Vol. 20, No. 2, pp. 89-98.
Reynolds, K.E.; Beatty, S.E. (1999): Customer benefits and company consequences of customer-salesperson relationships in retailing, in: Journal of Retailing, Vol. 75, No. 1, pp. 11-32.
Reynolds, K.E.; Ganesh, J.; Luckett, M. (2002): Traditional mall vs factory outlets: comparingshopper typologies and implications for retail strategy, in: Journal of Business Research,Vol. 55, No. 3, pp. 687-696.
Rich, S.; Portins, B. (1964): The imageries of department stores, in: Journal of Marketing, Vol.28, No. 2, pp. 10-15.
146 European Retail Research, Vol. 24, Issue I, pp. 121-148
Rintamäki, T.; Kanto, A.; Kuusela, H.; Spence, M.T. (2006): Decomposing the value of depart-ment store shopping into utilitarian, hedonic and social dimensions, in: International Journalof Retail & Distribution Management, Vol. 34, No. 1, pp. 6-23.
Roy, A. (1994): Correlates of mall visit frequency, in: Journal of Retailing, Vol. 70, No. 2, pp.139-161.
Rubenstein, C.; Shaver, P.R. (1980): Loneliness in two northeastern cities, in: Hartog, J.; Audy,J.R.; Cohen, Y.A. (eds.): The anatomy of loneliness, New York, pp. 319-337.
Scheuch, M. (2001): Verkaufsraumgestaltung und Ladenatmosphäre im Handel, Vienna.
Schnessl, N. (2005): Erlebnisorientierte Gestaltung des Dienstleistungsumfeldes: Ansatzpunktezur Stärkung der Kundenbindung, Vienna.
Shapiro, C.; Vivian, H.R. (2000): Information rules, Boston, MA.
Sharma, A. (1997): Customer satisfaction-based incentive systems: some managerial and sales-person considerations, in: Journal of Personal Sales Management, Vol. 17, No. 1, pp. 61-70.
Sherman, E.; Mathur, A.; Smith, R.B. (1997): Store environment and consumer purchasebehaviour: Mediating role of consumer emotions, in: Psychology & Marketing, Vol. 14,No. 4, pp. 361-378.
Sherry, J.F. (1990): A sociocultural analysis of a Midwestern American flea mark, in: Journal ofConsumer Research, Vol. 17, No. 1, pp. 13-30.
Sirgy, M.J.; Samli, A.C. (1985): A path analytic model of store loyalty involving self-concept,store image, geographic loyalty, and socioeconomic status, in: Journal of the Academy ofMarketing Science, Vol. 13, No. 3, pp. 265-291.
Smith, P.; Burns, D.J. (1996): Atmospherics and retail environment: the case of the “power aisle”,in: International Journal of Retail & Distribution Management, Vol. 24, No. 1, pp. 7-14.
Spangenberg, E.R.; Crowley, A.E.; Henderson, P.W. (1996): Improving the store environment:Do olfactory cues affect evaluations and behaviors, in: Journal of Marketing, Vol. 60, No. 2,pp. 67-81.
Spies, K.; Hesse, F.; Loesch, K. (1997): Store atmosphere, mood and purchasing behavior, in:International Journal of Research in Marketing, Vol. 14, No. 1, pp. 1-17.
Srivastava, R.K.; Shervani, T.A.; Fahey, L. (1998): Market-based assets and shareholder value:a framework for analysis, in: Journal of Marketing, Vol. 62, No. 1, pp. 2-18.
Stanley, T.; Sewall, M. (1976): Image inputs to a probabilistic model: predicting retail potential,in: Journal of Marketing, Vol. 40, No. 3, pp. 48-53.
Sullivan, M.; Adcock, D. (2002): Retail marketing, London.
Sullivan, P.; Savitt, R. (1997): Store patronage and lifestyle factors: implications for rural gro-cery retailers, in: International Journal of Retail & Distribution Management, Vol. 25, No.11, pp. 351-370.
Swan, J.E.; Trawick, I.F.; Carroll, M.G. (1981): Effect of participation in marketing research onconsumer attitudes to research and satisfaction with a service, in: Journal of MarketingResearch, Vol. 18, No. 3, pp. 356-363.
Tauber, E.M. (1972): Why do people shop?, in: Journal of Marketing, Vol. 36, No. 4, pp. 46-49.
Taylor, S.A.; Baker, T.L. (1994): An assessment of the relationship between service quality andcustomer satisfaction in the formation of consumers' purchase intentions, in: Journal ofRetailing, Vol. 70, No. 2, pp. 63-179.
Weitzl, W.; Zniva, R. 147
Thompson, J.C.; Locander, W.B.; Pollio, H.R. (1990): The lived meaning of free choice: anexistential-phenomenological description of everyday consumer experiences of contempo-rary married woman, in: Journal of Consumer Research, Vol. 17, No. 3, pp. 346-361.
Tse, D.K.; Wilton, P.C. (1988): Models of consumer satisfaction formation: an extension, in:Journal of Marketing Research, Vol. 25, No. 2, pp. 204-212.
Turley, L.W.; Milliman, R.E. (2000): Atmospheric effects on shopping behavior: A review ofthe experimental evidence, in: Journal of Business Research, Vol. 49, No. 2, pp. 193-211.
Tversky, A.; Sattah, S.; Slovic, P. (1988): Contingent weighting in judgment and choice, in: Psy-chological Review, Vol. 95, No. 3, pp. 371-384.
Wakefield, K.L.; Baker, J. (1998): Excitement at the mall: Determinants and effects on shop-ping response, in: Journal of Retailing, Vol. 74, No. 4, pp. 515-539.
Westbrook, R.A.; Black, W.C. (1985): Motivation-based shopper typology, in: Journal of Retail-ing, Vol. 61, No. 1, pp. 78-103.
Westbrook, R.A., Newman, J.W.; et al. (1978). Consumer satisfaction/dissatisfaction in the pur-chase decision process, in: Journal of Marketing Vol. 42, No. 4, pp. 54-60.
Wilkinson, J.B.; Mason, J.B.; Paksoy, C.H. (1982): Assessing the impact of short-term super-market strategy variables, in: Journal of Marketing Research, Vol. 14, No. 1, pp. 72-86.
Woodruff, R.B. (1997): Customer value: The next source of competitive advantage, in: Journalof the Academy of Marketing Science, Vol. 25, No. 2, pp. 139-153.
Yalch, R.F. Spangenberg, E.R. (1990): Effects of store music on shopping behaviour, in: Journalof Consumer Marketing, Vol. 7, No. 1, pp. 55-63.
Yalch, R.F.; Spangenberg, E.R. (2000): The effects of music in a retail setting on real and per-ceived shopping times, in: Journal of Business Research, Vol. 49, No. 2, pp. 139-147.
Zeedyk-Ryan, J.; Smith, G.F. (1983): The effects of crowding on hostility, anxiety and drive forsocial interaction, in: Journal of Social Psychology, Vol. 120, No. 3, pp. 245-252.
Zeithaml, V.A. (1988): Consumer perceptions of price, quality, and value: A means-end modeland synthesis of evidence, in: Journal of Marketing, Vol. 52, No. 3, pp. 2-22.
Zineldin, M. (2006): The royalty of loyalty: CRM, quality and retention, in: Journal of Con-sumer Marketing, Vol. 23, No. 7, pp. 430-437.
Zins, A. (2001): Relative attitudes and commitment in customer loyalty models, in: Internation-al Journal of Service Industry Management, Vol. 12, No. 3, pp. 269-294.
148 European Retail Research, Vol. 24, Issue I, pp. 121-148
Strategic Differentiation in the Japanese Convenience Store Business.The Example of Lawson’s Format Variation
Ari Huuhka, Nobutoshi Shimizu and Martti Laaksonen
AbstractIn the Japanese convenience store business Lawson has applied format variation (the creationand development of branded sub-formats) most intensively and is now implementing multi-for-mat strategy. Until the change of governance in 2001 Lawson’s strategy focused on store loca-tions and market expansion. Since then Lawson has introduced format variation and sought thestrategic fit between the offering of the store format and new customer segments. Lawson’sstrategy differs from its competitors in many ways. Lawson has differentiated the offering of thestore formats in terms of location, price, product and service mixes, and has created novel cus-tomer value propositions and responses to emerging customer needs. Lawson’s strategy has alsoinvolved the creation of active business alliances and networks. In this paper we show howLawson’s strategy has been conditioned by competition, market conditions and the company’ssearch for new strategic direction. We show also how Lawson uses store format as a strategicinnovation.
KeywordsStrategy, Differentiation, Store Format, Format Variation, Japanese Convenience Store Business
Ari Huuhka (corresponding author)Department of Marketing, University of Vaasa, Vaasa, Finland(Tel: +35863248555; E-mail: [email protected]).
Nobutoshi ShimizuUniversity of Marketing and Distribution Sciences, Kobe, Japan.
Martti LaaksonenDepartment of Marketing, University of Vaasa, Vaasa, Finland.
Received: August 31, 2009Revised: January 15, 2010Accepted: January 16, 2010
EUROPEAN
RETAIL
RESEARCHVol. 24, Issue I, 2010, pp. 149-172
1. Introduction
Convenience stores, the concept of which originates from the United States, have become part
of the retail structures in Europe and in many international markets (Kotler 1988, p. 165;
Ahlert/Blut/Evanschitzky 2006). In Japan the convenience store (CVS) format emerged as a
retail institutional innovation in the early 1970s. Since then the CVS format has evolved to have
many distinctive features. In Japan convenience stores have come to epitomize the lifestyle of
young urban people. They are popular especially among the young male consumer segment.
The typical Japanese CVS, or “konbini”, has about 100 square meter sales space with about
3,000 items. The majority of CVSs in Japan are open 24 hours. They are located - often many
stores close to each other - in densely populated urban areas in easy-to-get to, high-traffic loca-
tions where they supply consumers within walking distance of the stores (CCRRCA 2007,
p. 28). The sales mainly consist of fast food and processed food products, also non-food items
and several services (Seiders/Berry/Gresham 2000, p. 82; Rapp/Islam 2006). Japanese CVSs
are known for their frequent introduction of new product innovations and their ability to quick-
ly alter the product mix in standardized stores according to local demand patterns (Stalk/Web-
ber 1993, p. 98; Reinmoeller 2002, p. 41).
The market leader is Seven-Eleven Japan (SEJ), the pioneer and innovator of the archetypal
Japanese CVS format. Its store format together with its efficient business model based on a
franchising system is regarded as the retail industry’s benchmark and the standard for efficient
and profitable CVS operations (Reinmoeller 2002, p. 41). Many of SEJ’s innovations in store
format, merchandising, logistics and systems development have been copied by the other major
chains, including the second largest chain, Lawson, the third largest chain, FamilyMart, and the
many mid- and small-size regional chains. As a result, the Japanese CVS chains have become
famous for their know-how in the strategic application of retail technologies to enhance the
store format’s competitiveness in the marketplace (CCRRCA 2007, p. 28; see also Rapp/Islam
2006, p. 187). Besides, the chains (especially through the model and standards set by SEJ) are
renowned of their high operational efficiency that comes from the effectiveness of the total sys-
tem, including the integration of supply management (e.g. the physical distribution, supply
chain design, etc.), demand management (e.g. the item-by-item control) and information tech-
nology systems (Larke 1994, p. 149; Takeda/Matsuo 2002).
For a long time the Japanese CVS chains benefited from continuous market growth. That led to
the proliferation of stores, saturation, and heavy competition for the best store locations in
mature markets. The major chains have nearly identical store formats and compete with each
other in the same market segment. They carry similar strategic product categories with relative-
ly high, non-discounted prices and offer similar kind of services. Lawson, the second largest
chain, is the rare exception in this sense. It was first company in the Japanese CVS business that
150 European Retail Research, Vol. 24, Issue I, pp. 149-172
introduced format variation. It is also the only company that operates CVSs nationwide in every
prefecture in Japan.
Lawson began to employ its current strategy that emphasizes format variation in 2001. At pres-
ent Lawson operates and develops four types of CVSs targeted to different customer segments.
In addition to the standard, mainstream “Lawson” CVS format that is targeted to the young
male segment, Lawson operates the following format variations or sub-formats: The “Natural
Lawson” store format for the young female with a healthy lifestyle segment, the low-price
“Lawson Store 100” store format for the price-conscious consumer segment, and the “Lawson
Plus” store format for the housewives and aged persons segment. With this strategy Lawson has
been able to create new markets and to operate stores in such geographic regions and locations
where SEJ and other competitors could not run their stores profitably. Although Lawson’s cur-
rent strategy is still in progress, it is, however, the first clear divergence from both the dominant
mode of intra-format competition and the SEJ’s or other Japanese CVS companies’ more con-
ventional store development strategies.
The fragmentation of the format landscape and the emergence of more specialised store formats
has been recognized as an emergent trend in food retailing in Asia, especially in the mature and
low-growth markets such as Japan (CCRACA 2007, p. 16). In the Japanese CVS business,
Lawson’s format variation is an example of this phenomenon. Also Lawson’s competitors, SEJ
and FamilyMart, have experimented, piloted and are currently running a small number of stores
that are variants of their major store formats. Lawson, however, has developed and applied
format variation the most intensively and progressed the farthest in its pursuit of a long-term
multi-format strategy.
In this paper we aim to contribute to the discussion of how retail companies use store formats as
strategic innovations to differentiate their store offerings from competitors in the highly com-
petitive and mature markets. Lawson’s use of store format variation in the Japanese market is an
illustrative empirical example of retailers’ strategic differentiation. We propose, by referring to
the concept of strategic innovation (Reynolds et al. 2007; Markides 1997; Govindarajan/Trim-
ble 2004), that, in the context of Japanese CVS business, Lawson’s new store formats can be
regarded as strategic innovations with which Lawson is seeking to change, in the long run, the
dominant mode of competition.
The paper focuses on examining Lawson’s format variation in the Japanese market. The
purpose of the paper is twofold, first to describe how Lawson’s began to employ its current
strategy emphasising format variation, and second, to analyse how Lawson’s store development
activities have been conditioned by competition, market conditions and the company’s search
for new strategic direction. The paper has three objectives. The first objective is to provide a
conceptual framework for understanding the use of store formats in strategic differentiation.
Huuhka, A.; Shimizu, N.; Laaksonen, M. 151
The second objective is to describe the competitive setting and the development of the Japanese
CVS business. The third objective is to identify the major events and changes in Lawson’s store
development activities and to analyse how Lawson’s current strategy and its store formats differ
from those of its closest competitors, SEJ and FamilyMart.
The structure of the paper is as follows. This introduction is followed by the conceptual frame-
work part of the paper focusing on the conceptual foundations of the strategic use of store for-
mats. It provides the literature review and discussion on the concept of store format, format
strategies and format variation, strategic positioning with store formats, and store formats as
strategic innovations. The third part presents the outline of the Japanese CVS business in its
competitive setting. The fourth part describes the central elements of the market-leader SEJ’s
business model with its archetypal Japanese CVS format. The fifth part focuses on describing
Lawson’s store development activities and format variation. The description is based on second-
ary data such as annual reports, articles in business magazines, newspapers and other such doc-
umentation. The paper ends with conclusions.
2 . Strategic Use of Store Formats
2.1. Defining the Concept of Store Format
As pointed out by González-Benito (2005, p. 458) and Reynolds et al. (2007, p. 648) there is in
the retailing literature no commonly agreed definition of the term retail format. However, retail
formats have been the central concept in the broad array of theoretizations concerning retail
institutional change (Brown 1987). At the highest level of analysis and abstraction, a particular
retail format such as a convenience store could be regarded as a retail institution that is subject
to retail institutional change in the context of a given retail structure. However, in this paper we
are especially interested in strategic use of the store formats and store formats as strategic inno-
vations. We regard a store format as a strategic concept and build our view of the concept of a
store format on the ideas and definitions put forward by Dawson (2004, 2006), Goldman
(2001), and Reynolds et al. (2007).
Dawson (2004, p. 121-126) analysed the trends and structural changes in the UK food retailing
sector and pointed out the strategic move by food retailers to develop the concepts of format and
formulae. These two concepts are closely related, yet distinct. According to Dawson (2004,
p. 121-126) a sales format is a sales outlet that has been standardized to meet the needs of a
particular consumer segment (Dawson 2004, p. 121; compare Coopers/Lybrand 1996, p. 113).
Formula is a format that it adjusted and branded by an individual firm to represent their own
brand; formula is the retail company’s operational interpretation of a format (Dawson 2004,
p. 123; 2006, p. 55). Dawson (2004, p. 123) maintains that the idea of format requires the iden-
152 European Retail Research, Vol. 24, Issue I, pp. 149-172
tification of customer segments, each of which can be targeted by a particular combination of
marketing mix factors.
Goldman (2001, p. 223) in his study of the strategy of the international retail format transfer has
made the distinction between the offering part of the format and the know-how part of the format
(see also González-Benito 2005, p. 458). The offering part of the format consists of the external
elements of the store format (e.g. the aforementioned combination of marketing mix factors) that
according to Goldman (2001, p. 223) deliver the functional, social, psychological, aesthetic and
entertainment benefits that attract consumers to stores. The know-how part of the format refers
to the know-how needed to operate the format: it determines a retailer’s operational strength and
strategic direction, and consists of the retail technology dimension and the retail culture dimen-
sion (Goldman 2001, p. 233). According to Goldman (2001, p. 233) the retail technology dimen-
sion contains the systems, methods, procedures and techniques that the retailer uses, whereas the
retail culture dimension contains the repertoire of concepts, norms, rules, practices and experi-
ences. The retail culture dimension enhances retailers’ ability to evaluate situations, identify
trends and opportunities, and deal with problems (Goldman 2001, p. 233).
In their recent research on the retail format innovations in UK retailing, Reynolds et al. (2007,
p. 648) found that retail practitioners’ conceptions of retail formats were concerned more often
with the current specific offer of the format to consumers than the underlying strategy and oper-
ation of the format. However, for Reynolds et al. (2007) the retail format is more than merely
the retail offering that retailers seek to differentiate. They define a retail format “as the physical
embodiment of a retail business model: the framework that relates the firm’s activities to its
business context and strategy” (Reynolds et al. 2007, p. 648). According to this view the format
differences (or similarities) are attributable to different (or similar) business models. They
maintain that “the business model sets out how a retailer defines and differentiates its products
and range, promotes itself, finds and keeps its customers, uses its resources, arrives at key
processes and obtains a profit or return on investment” (Reynolds et al. 2007, p. 648).
According to our view the central aspects of store formats from the strategic differentiation
point of view are the offering being recognized as differentiated by the targeted customer seg-
ment and as providing benefits and value for them; and the know-how and the business model
that is needed to develop, operate and replicate the store format and its brand. The strategic dif-
ferentiation involves decisions about the overall format strategy of the company, the degree of
format variation needed for the competitive positioning of the format in the existing retail struc-
ture and in the minds of potential customers. Besides, the strategic differentiation concerns the
search and creation of the strategic fit between the offering of the store format and the targeted
customer segment. The strategic fit is relative to other customer segments and competitors’
positions in the market structure.
Huuhka, A.; Shimizu, N.; Laaksonen, M. 153
2.2. Retailers’ Store Format Strategies and Format Variation
The increase of the variety of store formats especially in food retailing has been noted in many
studies (Ahlert/Blut/Evanschitzky 2006, p. 289; Colla 2004; González-Benito 2005, p. 458;
CCRRCA 2007). Store format decisions belong to the critical long-term strategic decisions of
retailers (Gauri/Trivedi/Grewal 2008, p. 256). The store format decisions have an important role
in retailers’ growth and market coverage strategies (González-Benito 2005, p. 60) and in inter-
nationalization strategies (Burt et al. 2008, p. 90). Basically, a retail company can choose to
employ a single-format strategy (operations with one core format only) or a multi-format strat-
egy (operations with multiple formats). International grocery retailers, for instance, have
employed internationalization strategies involving multi-format operations (Burt et al. 2008, p.
87). From that point of view, and in that context, the multi-format strategy can be understood as
a retailer’s strategy to develop and operate two or more distinct store formats (e.g. hypermar-
kets, supermarkets and convenience stores). Besides, as shown next, the creation of format vari-
ation can also be viewed as a multi-format strategy.
Retailers’ strategic use of store format also involves decisions about the possible introduction of
format variation, the development of branded formats (formulae) as the response to changes in
the retail environment. In his analysis of the structural changes in European retailing, Dawson
(2006, p. 49) pointed out that many of the retailers’ managerial decisions are a response to both
the local culture of consumers and the local culture of consumption in Europe. He argues that
the dynamic local cultural environment requires responses from retailers, or “the close match-
ing of their operations to consumer requirements” (Dawson 2006, p. 49). Retailers’ strategies
- the aforementioned responses - are executed through the formats and formulae that the retail-
er creates (Dawson 2006, p. 49).
The creation of format variation (i.e. formulae development and the introduction of sub-formats)
can take place in many ways and (at least in theory) with infinite variation. The offering of the
existing store format can be adjusted to have a new combination of marketing mix factors for the
targeted customer segment. The existing or adjusted store format can be re-branded or re-formatted
and operated under a new store brand name or fascia, with or without the retailer’s brand. Accord-
ing to Dawson (2004, p. 126.), in European retailing the branding of the format emerged during the
1990’s as a major strategy of large retailers such as Tesco and Sainsbury which developed multiple
formats each carrying the corporate brand name and a formula name (e.g. Tesco Extra and Sains-
bury Local; compare the store brand names of Lawson’s sub-formats, e.g. Natural Lawson and
Lawson Plus). Dawson (2004, p. 126) maintains that “the logic behind this branding exercise is the
belief that in respect of marketing activity the ‘store’ is the ‘product’ of the retailer”. Burt et al.
(2008, p. 90) have pointed out that new retail formulae have emerged also as a result of internation-
al retailers’ “renewal” programmes that have involved the segmentation of existing formats to
include new formulae (for a strategic segmentation see Cravens/Piercy/Baldauf 2009, pp. 42-44).
154 European Retail Research, Vol. 24, Issue I, pp. 149-172
In particular market conditions, the creation of format variation by retailers can lead to the blur-
ring of the boundaries of competing store formats (Fox/Sethuraman 2006, p. 200; Reynolds et
al. 2007, p. 648). The blurring can take place, for instance, when some key aspects of store for-
mats (such as strategic product categories) overlap between different store formats (Fox/Sethu-
raman 2006, p. 200). Besides, the introduction of unique format variations, twists, and hybrids
due to retailers’ increasing efforts to differentiate their offering to satisfy the particular dimen-
sions of customer needs can lead to format fragmentation (Coopers/Lybrand 1996, p. 113;
Dawson 2004, pp. 120-122).
As a result, retailers seek novel ways to respond to customers’ diverse needs and emerging cus-
tomer values. Studies on customers’ store choice behavior have shown that customers patronize
multiple formats and that customers’ needs and wants vary depending upon a range of factors
such as time, shopping occasions and shopping experience (Colla 2004, pp. 48-49;
Reutterer/Teller 2009, pp. 695-696; Messinger/Narasimhan 1997, p. 2). This is reflected in the
introduction of different formats and format variation. Thus, as pointed out by Dawson (2006, p.
54), “the formula design has moved beyond the traditional variables associated with the market-
ing mix factors”. Examples of this kind of new sources of customer value are formula designs in
which customer value is co-created by the customer and the retailer (Dawson 2006, pp. 54-55).
2.3. Strategic Positioning with Store Formats
The strategic use of store formats also involves decisions about the competitive positioning of
the store format as a part of the retail market structure, consisting of similar and different store
formats. By creating format variation, store formats and formulae with differentiated offering
and customer value propositions, retailers can seek to better reach the targeted consumer seg-
ments, and to avoid competing on the same dimension with competitors (Porter 2008, p. 86). As
pointed out in many studies on the competitive interaction among store formats, the competitive
dynamics of a given retail market structure results from the competition between stores of the
same store format (intra-format competition) and from the competition between different store
formats (inter-format competition) (Miller/Reardon/McCorkle 1999, pp. 107-108; González-
Benito 2001, pp. 64; 2005, pp. 457-459; González-Benito/Muñoz-Gallego/Kopalle 2005, pp.
59-60; Fox/Sethuraman 2006, p. 193-194). Besides, depending on market conditions, the com-
petitive dynamics can arise also from inter-category competition (competition between retailers
carrying similar merchandising) (Miller/Reardon/McCorkle 1999, pp. 108) or from the inten-
sive rivalry between retailers (Furrer/Thomas 2000, p. 629; Porter 2008).
In addition to competitive positioning in relation to intra-format and inter-format competition,
the strategic positioning with store format can also take place due to the company’s needs to
seek a new strategic direction or for the renewal of its existing strategy (for renewal strategies
Huuhka, A.; Shimizu, N.; Laaksonen, M. 155
see Chakravarthy/Lorange 2007, p. 4). In their study on the new strategic alternatives available
to retailers that operate in highly saturated markets in the United States, Werner/McDermott/
Rotz (2004, p. 10-11) argued that retailers should abandon strategies involving “the geographic
expansionism, that ironically, created their original success”. As an alternative they propose
management strategies based on profit-driven product selection and customer targeting, the
application of which requires not only changes in the company’s culture, operations, strategy
and finance but also the development of capabilities to successfully execute the change of
strategic direction (Werner/McDermott/Rotz 2004, p. 10-11). Among the central aspects of
Werner/McDermott/Rotz’s (2004, p. 10-11) view of strategic change is “the increasing cus-
tomer value” as the company’s strategic aim. It calls for the understanding of customer prof-
itability, the targeting of desired customers, and the management of customer value (Werner/
McDermott/Rotz 2004, p. 11).
The implementation of any major strategic change, the divergence from a retailer’s existing
strategy to create new markets and to seek long-term growth, requires changes both in the offer-
ing part and the know-how part of the store format. The offering part of the store format must
be adjusted to fit the targeted customer segment, whereas improvement of the operational
strength might demand capabilities (Werner/McDermott/Rotz 2004, p. 10) or distinctive com-
petencies (Chakravarthy/Lorange 2007, p. 4) that are new to the company. Besides, the strategic
positioning with store formats, as in all strategic decision-making, concerns risk-taking and the
efficient and effective use of a company’s resources. Thus retailers’ strategic decision-making is
above all conditioned by the interlinked efficiency and effectiveness of business operations. As
pointed out by Achabal/Heineke/McIntyre (1984, p. 114), “efficiency by itself never assures
effectiveness” since “being ‘efficient’ relates only to using resources in the best possible way
for a given organizational strategy. But whether a given strategy is the ‘best’ one is a different
manner”. They maintain that “efficiency is a necessary but not sufficient condition for effec-
tiveness” (Achabal/Heineke/McIntyre 1984, p. 114). Effectiveness concerns the company’s
long-term goal achievement (Goodman 1985, p. 77; Achabal/Heineke/McIntyre 1984, p. 114).
In the context of the strategic use of store formats, effectiveness can be viewed as the company’s
long-term goal to achieve the strategic fit between the offering of the store format and the tar-
geted customer segment. Thus effectiveness concerns the elaboration of the offering part of the
store format whereas efficiency concerns the internal operational efficiency related to the
know-how or the retail technology part of the store format. The Japanese CVS companies are
especially renown for the efficiency of their business operations.
2.4. Store Formats as Strategic Innovations
It is an imperative for any retailer to develop and improve the both the offering part of the store
format and the retail technologies and underlying systems needed in retail operations. While
156 European Retail Research, Vol. 24, Issue I, pp. 149-172
some of these often incremental operational improvements can be regarded as “operational
innovations”, some of them belong to the realm of “good business development practice”
(Reynolds et al. 2007, p. 652). “Operational innovations” are typically continuous and incre-
mental and characterised among other things by their short innovation cycles (ibid.). Retailers’
store development activities can also include the development and introduction of “strategic
innovations” (e.g. incremental improvements of the business model by introducing new sub-
brands) which are more clearly guided by the company’s long-term goals and/or strategic plan-
ning processes, and which have more strategic importance to the company (Reynolds et al.
2007, p. 651-652).
In certain conditions strategic innovations can change the conventional ways in which compa-
nies in a given industry define the business, markets and the dominant logic of competition.
Thus in certain conditions strategic innovation can result in a major divergence from the main-
stream. According to Markides (1997, p. 12), “strategic innovation occurs when a company iden-
tifies the gaps in the industry’s positioning map, decides to fill them, and gaps grow to become
the new mass market”. In Markides’ (1997, p. 12) view the gaps are related to strategic level
who-what-how questions. The Markides idea of strategic innovation can also be applied to con-
ceptualize the idea of store formats as strategic innovations. According to Markides (1997, p. 9),
“the trick is not to play the game better than the competition but to develop and play an altogeth-
er different game”. In the context of the strategic use of store formats this would mean that (1)
the offering of the store format is targeted for emerging customer segments or existing customer
segments that the other competitors have neglected, (2) the offering of the store format is able to
serve emerging customer needs or existing customer needs not well served by other competitors,
and (3) that the business model, or the know-how part of the store format, provides new ways of
producing, delivering or distributing existing or new products or services to existing or new cus-
tomer segments (Markides 1997, p. 12-13). A similar kind of idea of strategic innovation was put
forward by Govindarajan/Trimble (2004, p. 69) who maintain that strategic innovation is a cre-
ative and significant departure from historical practice in at least one of the following areas: (1)
value-chain design, (2) conceptualization of delivered customer value, and (3) identification of
potential customers. According to our view both Markides’ (1997) and Govindarajan/Trimble’s
(2004) ideas of strategic innovation are applicable to elucidate retailers’ strategic use of store for-
mats to create new markets and to seek new strategic direction for their business.
3. Outline of the Japanese Convenience Store Business
The convenience store business has grown vitally in the Japanese retailing sector in the last
quarter of a century. At the beginning of the 1970s, several companies started to introduce
CVSs as a new business by cooperating with or imitating CVSs in the United States. However,
Huuhka, A.; Shimizu, N.; Laaksonen, M. 157

because of the differences of market conditions, Japanese CVS companies were confronted
with lots of difficulties in tracing the American way. Some CVS headquarters decided to create
original systems by themselves and they have innovated lots of efficient and effective methods
of CVS operation.
At present, the CVS business is one of the major sectors in the Japanese retail industry (see Fig-
ure 1). Its scale of sales is nearly ahead of department stores which have a more than 100 year
history in Japan, having sold many expensive items in big buildings. However, it should be
pointed out that the Japanese CVS market is already getting saturated as the very low current
growth rate of this sector shows.
158 European Retail Research, Vol. 24, Issue I, pp. 149-172
1998
(a) sales of department stores
the share of (a) in whole retailsales
the share of (b) in whole retailsales
the share of (c) in whole retailsales
(b) sales of supermarkets (c) sales of convenience stores
.00
2.00
4.00
6.00
8.00
10.00
12.00
14.00
(trillions of Yen)
1999 2000 2001 2002 2003 2004 2005 2006 2007 2008
12.0%
10.0%
8.0%
6.0%
4.0%
2.0%
.0%
Figure 1: The Sales Value of Japanese Large-Scale Retail Stores and CVS
Source: METI (1998, 1999, 2000, 2001, 2002, 2003, 2004, 2005, 2006, 2007, 2008), [1].
Generally each CVS has around 100 square meters of sales space which deals in about 3,000
items, and the majority of stores are open 24 hours all the year round. Sales mainly consist of
food products which appeal to lots of young males, the main customers of Japanese CVS, who
do not cook and prefer fast foods or ready-to-eat dishes. Additionally, non-food items and serv-
ice products are strategic assortments because many consumers would visit CVS whenever they
want to buy necessities or need to pay bills (see Figure 2). As a general rule, Japanese CVS do
not discount items. The advantage is that they can provide consumers with lots of conveniences
without price slashing.
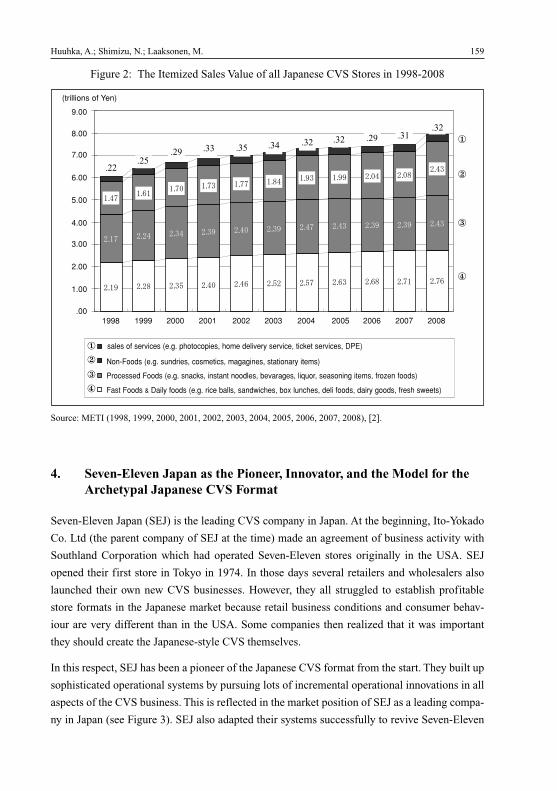
4. Seven-Eleven Japan as the Pioneer, Innovator, and the Model for theArchetypal Japanese CVS Format
Seven-Eleven Japan (SEJ) is the leading CVS company in Japan. At the beginning, Ito-Yokado
Co. Ltd (the parent company of SEJ at the time) made an agreement of business activity with
Southland Corporation which had operated Seven-Eleven stores originally in the USA. SEJ
opened their first store in Tokyo in 1974. In those days several retailers and wholesalers also
launched their own new CVS businesses. However, they all struggled to establish profitable
store formats in the Japanese market because retail business conditions and consumer behav-
iour are very different than in the USA. Some companies then realized that it was important
they should create the Japanese-style CVS themselves.
In this respect, SEJ has been a pioneer of the Japanese CVS format from the start. They built up
sophisticated operational systems by pursuing lots of incremental operational innovations in all
aspects of the CVS business. This is reflected in the market position of SEJ as a leading compa-
ny in Japan (see Figure 3). SEJ also adapted their systems successfully to revive Seven-Eleven
Huuhka, A.; Shimizu, N.; Laaksonen, M. 159
���� ���� ���� �� ��� ���� ���� ���� ���� ���� ����
������� ��� ���� �� ���� ��� ��� ���� ���� ���
�������
������� ���� ���
���� ���� �� ������
���
���������
�����������
���
������
1998
sales of services (e.g. photocopies, home delivery service, ticket services, DPE)
Non-Foods (e.g. sundries, cosmetics, magagines, stationary items)
Processed Foods (e.g. snacks, instant noodles, bevarages, liquor, seasoning items, frozen foods)
Fast Foods & Daily foods (e.g. rice balls, sandwiches, box lunches, deli foods, dairy goods, fresh sweets)
.00
3.00
2.00
1.00
4.00
5.00
6.00
7.00
.22.25
.29 .33 .35 .34 .32 .32 .29 .31.32
8.00
9.00
(trillions of Yen)
1999 2000 2001 2002 2003 2004 2005 2006 2007 2008
�
�
�
�
�
�
�
�
Figure 2: The Itemized Sales Value of all Japanese CVS Stores in 1998-2008
Source: METI (1998, 1999, 2000, 2001, 2002, 2003, 2004, 2005, 2006, 2007, 2008), [2].
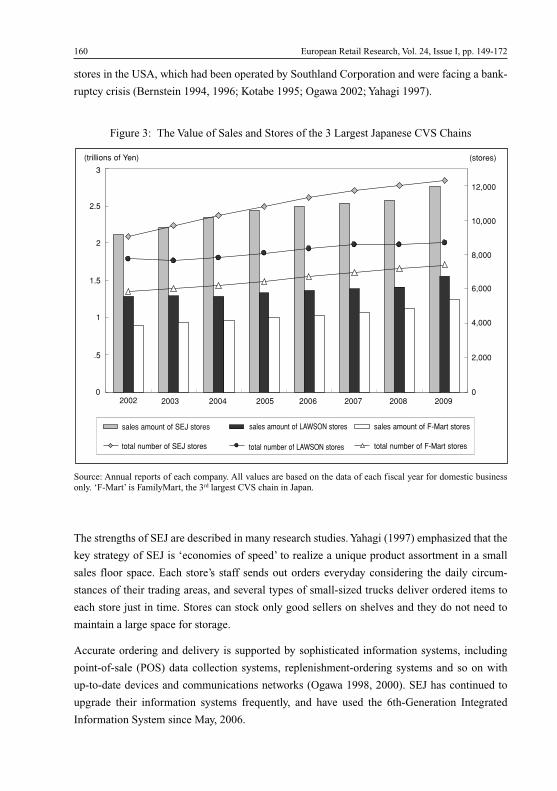
stores in the USA, which had been operated by Southland Corporation and were facing a bank-
ruptcy crisis (Bernstein 1994, 1996; Kotabe 1995; Ogawa 2002; Yahagi 1997).
160 European Retail Research, Vol. 24, Issue I, pp. 149-172
2002
sales amount of SEJ stores
total number of SEJ stores
sales amount of LAWSON stores
total number of LAWSON stores
sales amount of F-Mart stores
total number of F-Mart stores
0 0
4,000
2,000
6,000
8,000
10,000
12,000
.5
1
1.5
2
2.5
3
(trillions of Yen) (stores)
2003 2004 2005 2006 2007 2008 2009
Figure 3: The Value of Sales and Stores of the 3 Largest Japanese CVS Chains
Source: Annual reports of each company. All values are based on the data of each fiscal year for domestic businessonly. ‘F-Mart’ is FamilyMart, the 3rd largest CVS chain in Japan.
The strengths of SEJ are described in many research studies. Yahagi (1997) emphasized that the
key strategy of SEJ is ‘economies of speed’ to realize a unique product assortment in a small
sales floor space. Each store’s staff sends out orders everyday considering the daily circum-
stances of their trading areas, and several types of small-sized trucks deliver ordered items to
each store just in time. Stores can stock only good sellers on shelves and they do not need to
maintain a large space for storage.
Accurate ordering and delivery is supported by sophisticated information systems, including
point-of-sale (POS) data collection systems, replenishment-ordering systems and so on with
up-to-date devices and communications networks (Ogawa 1998, 2000). SEJ has continued to
upgrade their information systems frequently, and have used the 6th-Generation Integrated
Information System since May, 2006.
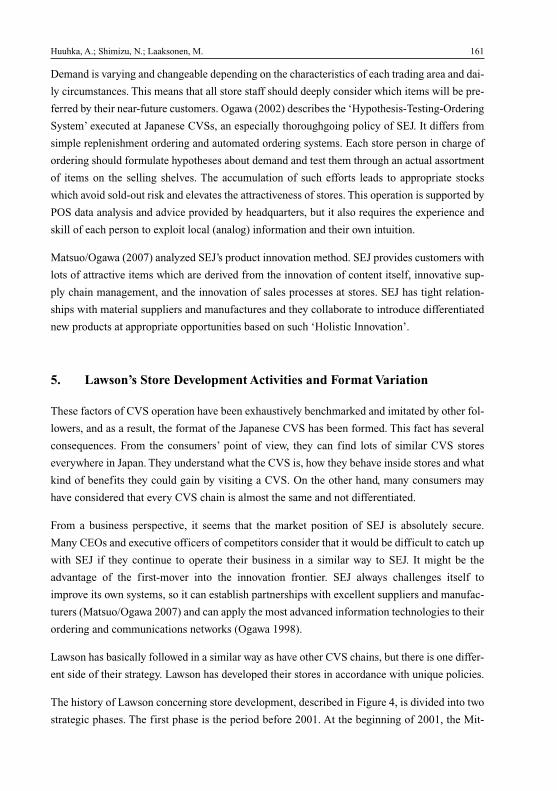
Demand is varying and changeable depending on the characteristics of each trading area and dai-
ly circumstances. This means that all store staff should deeply consider which items will be pre-
ferred by their near-future customers. Ogawa (2002) describes the ‘Hypothesis-Testing-Ordering
System’ executed at Japanese CVSs, an especially thoroughgoing policy of SEJ. It differs from
simple replenishment ordering and automated ordering systems. Each store person in charge of
ordering should formulate hypotheses about demand and test them through an actual assortment
of items on the selling shelves. The accumulation of such efforts leads to appropriate stocks
which avoid sold-out risk and elevates the attractiveness of stores. This operation is supported by
POS data analysis and advice provided by headquarters, but it also requires the experience and
skill of each person to exploit local (analog) information and their own intuition.
Matsuo/Ogawa (2007) analyzed SEJ’s product innovation method. SEJ provides customers with
lots of attractive items which are derived from the innovation of content itself, innovative sup-
ply chain management, and the innovation of sales processes at stores. SEJ has tight relation-
ships with material suppliers and manufactures and they collaborate to introduce differentiated
new products at appropriate opportunities based on such ‘Holistic Innovation’.
5. Lawson’s Store Development Activities and Format Variation
These factors of CVS operation have been exhaustively benchmarked and imitated by other fol-
lowers, and as a result, the format of the Japanese CVS has been formed. This fact has several
consequences. From the consumers’ point of view, they can find lots of similar CVS stores
everywhere in Japan. They understand what the CVS is, how they behave inside stores and what
kind of benefits they could gain by visiting a CVS. On the other hand, many consumers may
have considered that every CVS chain is almost the same and not differentiated.
From a business perspective, it seems that the market position of SEJ is absolutely secure.
Many CEOs and executive officers of competitors consider that it would be difficult to catch up
with SEJ if they continue to operate their business in a similar way to SEJ. It might be the
advantage of the first-mover into the innovation frontier. SEJ always challenges itself to
improve its own systems, so it can establish partnerships with excellent suppliers and manufac-
turers (Matsuo/Ogawa 2007) and can apply the most advanced information technologies to their
ordering and communications networks (Ogawa 1998).
Lawson has basically followed in a similar way as have other CVS chains, but there is one differ-
ent side of their strategy. Lawson has developed their stores in accordance with unique policies.
The history of Lawson concerning store development, described in Figure 4, is divided into two
strategic phases. The first phase is the period before 2001. At the beginning of 2001, the Mit-
Huuhka, A.; Shimizu, N.; Laaksonen, M. 161
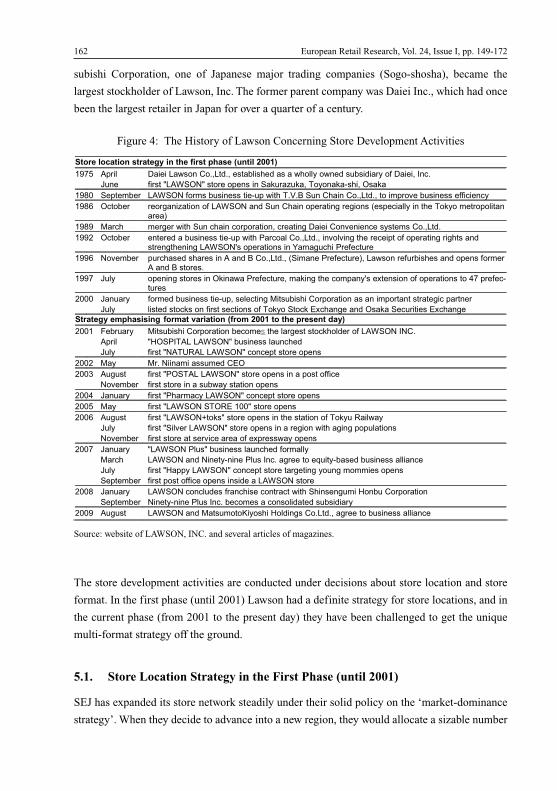
subishi Corporation, one of Japanese major trading companies (Sogo-shosha), became the
largest stockholder of Lawson, Inc. The former parent company was Daiei Inc., which had once
been the largest retailer in Japan for over a quarter of a century.
162 European Retail Research, Vol. 24, Issue I, pp. 149-172
Figure 4: The History of Lawson Concerning Store Development Activities
����� ������ ����� � � ��� ���� ���� ����� �����
���� ��� �� ������ ��������� ������ ���� � ���� ��� ���������� �� �� � ����
�� �����!��"#$%!����� ��� �� ��#�&���'�&�� (�����&�)����$��&�
��*+ # �� ,� � ��"#$% ���,� ���� �� � )�� ��� (�-�.�#�� ���� ��������� ���,���/ ����� �� ��� ���
��*0 $���� � � ��1��'���� �� ��"#$% ��� #�� ���� �� ����1 � 1��� 2 �� �������� (�&�� , ���������� �3
��*� 4���� , �1 ����� #�� ���� ����������� �� ���1 �� ���/ � �� ���� ,� ��������
���5 $���� � �� � �������� �� � )������ 6�����������������/�/�1��� � � �� �� �� ����1 �1��� ������� �1�� ��1 ��"#$%7� �� ������ ��8�,�1��� 6� � ����
���0 %�/ ,� � ������� ������ � ��������.���������� 2#,�� �6� � ���� 3� ������ � ������ �������� ������, ��� ��� .����� ��
���� �� �� ��1 ���� � ��$&���� 6� � ���� � ,�&�1��� ��,����7�� 9� ���� �� �� ������ ���:���� � �)��� �
5+++ ������ ���, � ���� �� � )����� ���1 4������ ���������� �� �� ,������� ����� 1������� �
�� �� � ����&���� ���� � ����� �� (�&�� #���& ;9����1 ���� $��&� # ���� � ;9����1
����� � ������� ����� ����������� ������� ��� ������� ���
5++� < ������ 4������ ���������� � ��, � �� ��1 �� ����&��� ���� ��"#$%��%��
��� !=$#6�(�� ��"#$%!����� �� ����� �
�� �����!%�(>?�� ��"#$%!����� �� ���� �� ��
5++5 4�� 4�� %��, ����, � �;$
5++@ ��1��� �����!6$#(�� ��"#$%!����� ��� �� � ������ ����
%�/ ,� � ��������� ��� ������������� �� ��
5++: ������ �����!6���,������"#$%!����� �� ���� �� ��
5++� 4�� �����!��"#$%�#($?; �++! ���� ��� ��
5++0 ��1��� �����!��"#$%A��&�! ���� ��� �� � �� ������ �� (�&�� ?����
�� �����!#/ ����"#$%!����� �� �� ��� � 1������ �1�1 ���������
%�/ ,� � ��������� ���� �/� ��� � �� 9�� �������� ��
5++� ������ !��"#$% 6��!����� �� ����� � ���,��
4���� ��"#$%�����%� ��)�� �6���������1� ���� B���)��� � ���� �� ����
�� �����!=���� ��"#$%!����� �� ���� ���1 ��1 ����1 ,�,, ���� ��
# �� ,� � ��������� ���� ��� �� ��� � ��"#$% ����
5++* ������ ��"#$% ������ � ������� �������� ��� #��� �1�, =���� ����������
# �� ,� � %� ��)�� �6�� ������ ��, ������������ � ��������
5++� ��1��� ��"#$% ��� 4����,���C���� =���1���������� �1� ������� �� ����
Source: website of LAWSON, INC. and several articles of magazines.
The store development activities are conducted under decisions about store location and store
format. In the first phase (until 2001) Lawson had a definite strategy for store locations, and in
the current phase (from 2001 to the present day) they have been challenged to get the unique
multi-format strategy off the ground.
5.1. Store Location Strategy in the First Phase (until 2001)
SEJ has expanded its store network steadily under their solid policy on the ‘market-dominance
strategy’. When they decide to advance into a new region, they would allocate a sizable number

of stores in a fixed spatial area at the same time. This realizes efficient and frequent delivery of
ordered items from their distribution centres to each store by small-sized trucks. Their manu-
facturing partners would establish exclusive factories in such areas, and then customers could
enjoy very fresh foods. Many residents in such a high store density area might recognize SEJ as
the leading retail brand.
Conversely, Lawson pursued nation-wide store locations from the beginning stage of their busi-
ness. The total number of stores has never exceeded SEJ’s but Lawson had established their
stores in all 47 prefectures in Japan by 1997. Table 1 shows the situation in fiscal 1999 [3].
Huuhka, A.; Shimizu, N.; Laaksonen, M. 163
Table 1: The Number of SEJ and Lawson Stores in Every Prefecture
���������� � � ���� ���������� � � ���� ���������� � � ����
�������� � � ��� ��� ��� �� ������� �� ��
������ � �� ������ � � ��������� ��� ���
����� � �� �������� � �� ��� !"�� � ��
����� � �� #!�!� � �� $� ��� � ��
��� ��� � %��&!��� ''� ��� ���!����� � �'
(��� � ��� ��� ��"�� � '� $�"�� � ��
#!�!����� '�' �� )�*! � �� +���� � ��
�,����� '�� �' (�� � �' #!�!��� �� ��
��"�� � ��� �� %�� � � �� %� � � �
)!-�� ��� � $���� � ��� �� ����� � ��
%������ �� �'� ����� ��� ��� $!������ �� �
.��,� �'' �' ��� � �� �� ���� � ��
����� ��� ��� ���� � ��' (���&��� �� ��
$�-� ��� �� �� /������� � �' $� ������ � �
���-���� ��� �� ������� � '� ���-��� � �'
�� �-� '� ��� %����-� � � ��� � ����� �����
Source: Konbini (October 2000, pp. 163-164).
Lawson seemed to place special emphasis on the economies of scale at that time. They expand-
ed their nationwide store network rapidly, in some cases by absorbing existing regional CVS
chains (see Figure 4). This might have been affected by the ideology of their parent company,
Daiei, which had constructed Japan’s largest supermarket chain and whose overwhelming bar-
gaining power was a strong weapon against suppliers and manufactures. And Daiei had already
operated supermarket stores everywhere in Japan, so Lawson could utilize existing assets such
as distribution centres, information networks and relationships with regional suppliers. Some
analysts also pointed out that a large sales volume was their first priority rather than the prof-
itability ratio, because Lawson was an important breadwinner of cash in the Daiei group [4].
As a result, it is considered that SEJ and Lawson developed their stores in different ways within
each regional area. For example, as shown in Table 2, Lawson operated a variety of store types in
every location, and we could notice that SEJ might have some standards for store development.
Note: Grey cell means that the number of stores is the largest in each prefecture. Originally SEJ started their businessin Tokyo and Lawson had their former headquarters and first store in Osaka prefecture. The names of prefectures onthis table are arranged according to geographical order from the northeast to the southwest of Japan.
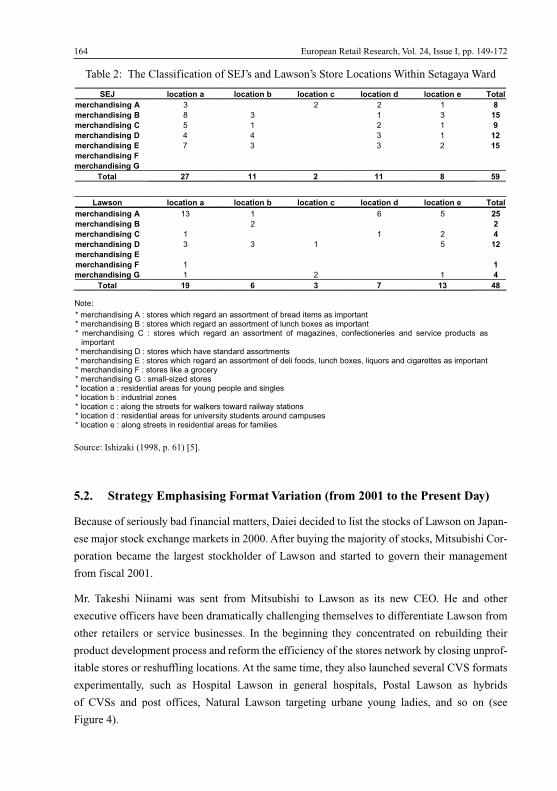
5.2. Strategy Emphasising Format Variation (from 2001 to the Present Day)
Because of seriously bad financial matters, Daiei decided to list the stocks of Lawson on Japan-
ese major stock exchange markets in 2000. After buying the majority of stocks, Mitsubishi Cor-
poration became the largest stockholder of Lawson and started to govern their management
from fiscal 2001.
Mr. Takeshi Niinami was sent from Mitsubishi to Lawson as its new CEO. He and other
executive officers have been dramatically challenging themselves to differentiate Lawson from
other retailers or service businesses. In the beginning they concentrated on rebuilding their
product development process and reform the efficiency of the stores network by closing unprof-
itable stores or reshuffling locations. At the same time, they also launched several CVS formats
experimentally, such as Hospital Lawson in general hospitals, Postal Lawson as hybrids
of CVSs and post offices, Natural Lawson targeting urbane young ladies, and so on (see
Figure 4).
164 European Retail Research, Vol. 24, Issue I, pp. 149-172
Table 2: The Classification of SEJ’s and Lawson’s Store Locations Within Setagaya Ward
��� ������ � ������ � ������ � ������ ������ � ����
������� ��� � � � � � �
������� ��� � � � � � ��
������� ��� � � � � � �
������� ��� � � � � � ��
������� ��� � � � � � ��
������� �����
������� ����
���� �! �� � �� � ��
"�#��� �������� ������ � �������� ������ �������� ����
������� ��� � �� � � ��
������� ��� � � �
������� ��� � � � � $
������� ��� � � � � � ��
������� ��� �
������� ����� � �
������� ���� � � � $
���� �� % & ! �& $�
��������� �� ��� ���� ����� ����� ������ �� ���� ���� � ���������������� ������� ���� ����� ����� ������ �� ���� ���� � �������� ������� �� � � ���� ����� ����� ������ �� ����� � ������������ � ������ ������� �������
��������� �� � �� ���� ����� ��� ���� ������ ��������� ��� ��� ���� ����� ����� ������ �� ���� ���� � ���� ���� � ��!��� � �������� ����������������� ���"��� ���� ��#� �������$� ������� �� % � ���& ���� ���� �������� ���� ��������� �����$��� ������ �� ���� ���������������� ���� ��� �������� ��� ������� ����� ��� ��#�� ������ ����$ ���� ��������������� ��������� ���������� ��$� ����� ���������� � �������� � ����� ����� ���� ��������� ��� ������
Note:
Source: Ishizaki (1998, p. 61) [5].
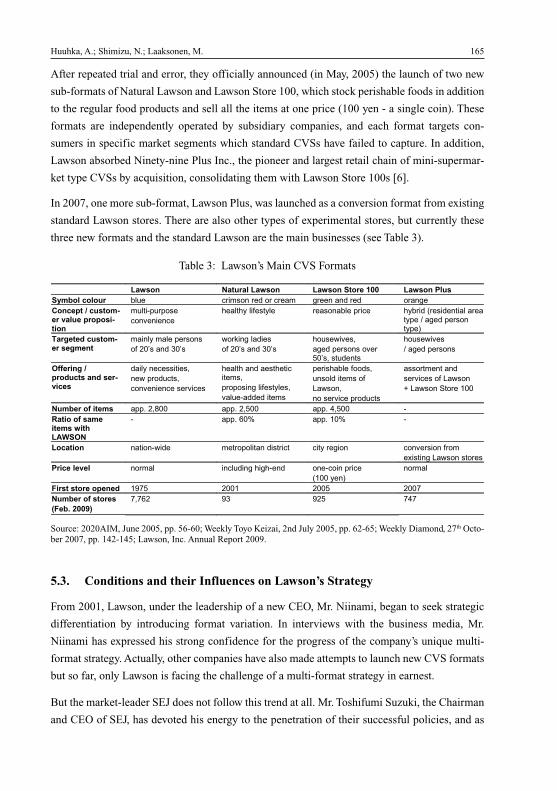
After repeated trial and error, they officially announced (in May, 2005) the launch of two new
sub-formats of Natural Lawson and Lawson Store 100, which stock perishable foods in addition
to the regular food products and sell all the items at one price (100 yen - a single coin). These
formats are independently operated by subsidiary companies, and each format targets con-
sumers in specific market segments which standard CVSs have failed to capture. In addition,
Lawson absorbed Ninety-nine Plus Inc., the pioneer and largest retail chain of mini-supermar-
ket type CVSs by acquisition, consolidating them with Lawson Store 100s [6].
In 2007, one more sub-format, Lawson Plus, was launched as a conversion format from existing
standard Lawson stores. There are also other types of experimental stores, but currently these
three new formats and the standard Lawson are the main businesses (see Table 3).
Huuhka, A.; Shimizu, N.; Laaksonen, M. 165
Table 3: Lawson’s Main CVS Formats
Source: 2020AIM, June 2005, pp. 56-60; Weekly Toyo Keizai, 2nd July 2005, pp. 62-65; Weekly Diamond, 27th Octo-ber 2007, pp. 142-145; Lawson, Inc. Annual Report 2009.
������ ����� ������ ������ ���� ��� ������ ���
������ ����� ���� ����� �� ��� ���� ����� �� �� ������
������ � ������� ���� �����������
�����������
�����������
������� �������� ��������� ����� ����� ���� ������ �������������� ����������
������� ������� ������
��������� �����
������ �� ���
��� ��� �� ��
������ �� ����
��������!
��� ������ ����"��!��� ���
��������
� ��� �����
!!����� ������� ��� ���������
���� ��������!
������� ���!
����������� ������
������ �� ������������!�
�������� ��������!
������� � ����
��������� ��� !
���� ��� ��
#����!�
��������� ��� ���
����������
��������� #����
$ #���� %���� &��
����� �! ���� ���'��!(�� ���' �!"�� ���'�)!"�� �
"��� �! �������� ��#�$%� �
� ���' *�+ ���' &�+ �
������� ��������� � ������������ ������ ���� ������ �������������
�,������#���� ����
����� ����� ����� ����� ��� ������� ��������������
�&�� ����
�����
&��� ���� ������ &-." ���& ���" ���.
����� �! �����
'&��( )��*+
.!.*� -� -�" .).
5.3. Conditions and their Influences on Lawson’s Strategy
From 2001, Lawson, under the leadership of a new CEO, Mr. Niinami, began to seek strategic
differentiation by introducing format variation. In interviews with the business media, Mr.
Niinami has expressed his strong confidence for the progress of the company’s unique multi-
format strategy. Actually, other companies have also made attempts to launch new CVS formats
but so far, only Lawson is facing the challenge of a multi-format strategy in earnest.
But the market-leader SEJ does not follow this trend at all. Mr. Toshifumi Suzuki, the Chairman
and CEO of SEJ, has devoted his energy to the penetration of their successful policies, and as
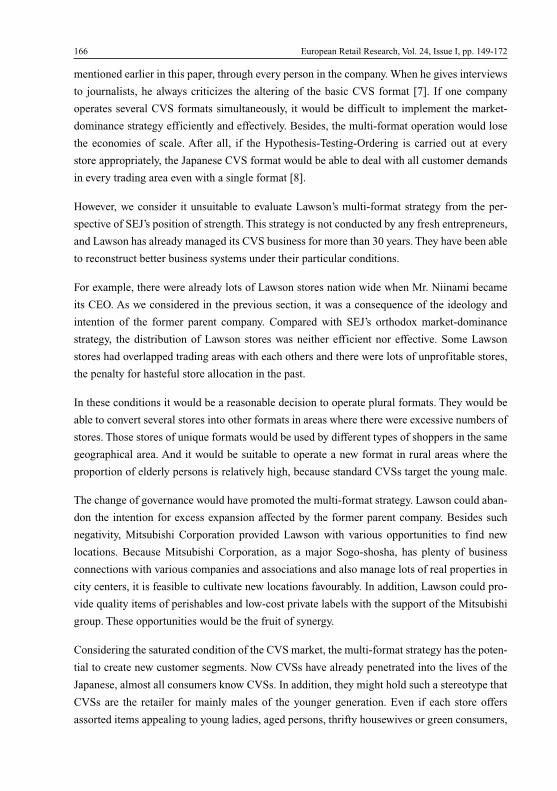
mentioned earlier in this paper, through every person in the company. When he gives interviews
to journalists, he always criticizes the altering of the basic CVS format [7]. If one company
operates several CVS formats simultaneously, it would be difficult to implement the market-
dominance strategy efficiently and effectively. Besides, the multi-format operation would lose
the economies of scale. After all, if the Hypothesis-Testing-Ordering is carried out at every
store appropriately, the Japanese CVS format would be able to deal with all customer demands
in every trading area even with a single format [8].
However, we consider it unsuitable to evaluate Lawson’s multi-format strategy from the per-
spective of SEJ’s position of strength. This strategy is not conducted by any fresh entrepreneurs,
and Lawson has already managed its CVS business for more than 30 years. They have been able
to reconstruct better business systems under their particular conditions.
For example, there were already lots of Lawson stores nation wide when Mr. Niinami became
its CEO. As we considered in the previous section, it was a consequence of the ideology and
intention of the former parent company. Compared with SEJ’s orthodox market-dominance
strategy, the distribution of Lawson stores was neither efficient nor effective. Some Lawson
stores had overlapped trading areas with each others and there were lots of unprofitable stores,
the penalty for hasteful store allocation in the past.
In these conditions it would be a reasonable decision to operate plural formats. They would be
able to convert several stores into other formats in areas where there were excessive numbers of
stores. Those stores of unique formats would be used by different types of shoppers in the same
geographical area. And it would be suitable to operate a new format in rural areas where the
proportion of elderly persons is relatively high, because standard CVSs target the young male.
The change of governance would have promoted the multi-format strategy. Lawson could aban-
don the intention for excess expansion affected by the former parent company. Besides such
negativity, Mitsubishi Corporation provided Lawson with various opportunities to find new
locations. Because Mitsubishi Corporation, as a major Sogo-shosha, has plenty of business
connections with various companies and associations and also manage lots of real properties in
city centers, it is feasible to cultivate new locations favourably. In addition, Lawson could pro-
vide quality items of perishables and low-cost private labels with the support of the Mitsubishi
group. These opportunities would be the fruit of synergy.
Considering the saturated condition of the CVS market, the multi-format strategy has the poten-
tial to create new customer segments. Now CVSs have already penetrated into the lives of the
Japanese, almost all consumers know CVSs. In addition, they might hold such a stereotype that
CVSs are the retailer for mainly males of the younger generation. Even if each store offers
assorted items appealing to young ladies, aged persons, thrifty housewives or green consumers,
166 European Retail Research, Vol. 24, Issue I, pp. 149-172
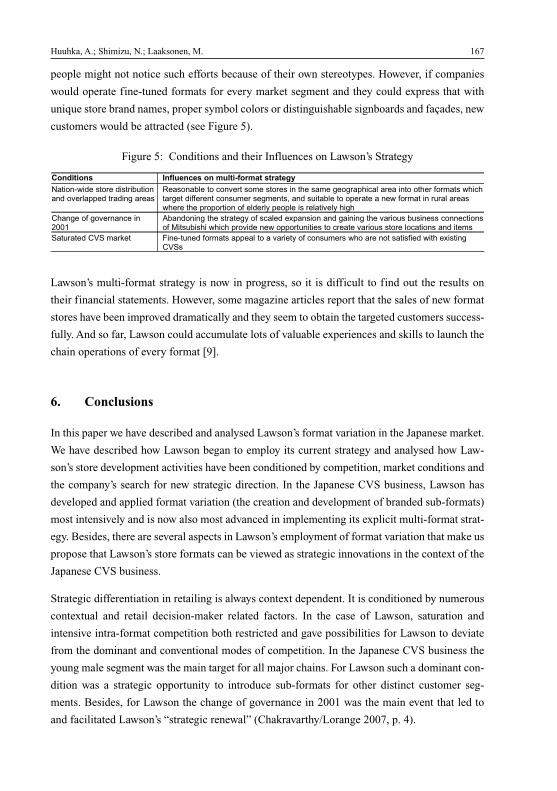
people might not notice such efforts because of their own stereotypes. However, if companies
would operate fine-tuned formats for every market segment and they could express that with
unique store brand names, proper symbol colors or distinguishable signboards and façades, new
customers would be attracted (see Figure 5).
Huuhka, A.; Shimizu, N.; Laaksonen, M. 167
Figure 5: Conditions and their Influences on Lawson’s Strategy
���������� ��� �� ���������������� ����� ��
���������� ���� � ���������������������������������
��� ������ ����������� ��� ���� ������ ���������������� ���� ���� ����� ������ ������������������� ��� ���� ������ � ��� ���������� ������� � ��������� �������� ���� ���� ��� ���������� �� ������ ������ � ���������� ����
��������� ���������� ������
�������� ��� ���������� ���� �!��� ��� ���������� ��� ������ ��� ��� ���������� ����"�� ��� �� ���� ������ �� ������������ ���������� ������ � ���� �������� �� ����
#������� �$#����%�� &�������� ������ ������ ������������ ������ ���� �� ��� ��� ��� ��� ��� �!� �����$#
Lawson’s multi-format strategy is now in progress, so it is difficult to find out the results on
their financial statements. However, some magazine articles report that the sales of new format
stores have been improved dramatically and they seem to obtain the targeted customers success-
fully. And so far, Lawson could accumulate lots of valuable experiences and skills to launch the
chain operations of every format [9].
6. Conclusions
In this paper we have described and analysed Lawson’s format variation in the Japanese market.
We have described how Lawson began to employ its current strategy and analysed how Law-
son’s store development activities have been conditioned by competition, market conditions and
the company’s search for new strategic direction. In the Japanese CVS business, Lawson has
developed and applied format variation (the creation and development of branded sub-formats)
most intensively and is now also most advanced in implementing its explicit multi-format strat-
egy. Besides, there are several aspects in Lawson’s employment of format variation that make us
propose that Lawson’s store formats can be viewed as strategic innovations in the context of the
Japanese CVS business.
Strategic differentiation in retailing is always context dependent. It is conditioned by numerous
contextual and retail decision-maker related factors. In the case of Lawson, saturation and
intensive intra-format competition both restricted and gave possibilities for Lawson to deviate
from the dominant and conventional modes of competition. In the Japanese CVS business the
young male segment was the main target for all major chains. For Lawson such a dominant con-
dition was a strategic opportunity to introduce sub-formats for other distinct customer seg-
ments. Besides, for Lawson the change of governance in 2001 was the main event that led to
and facilitated Lawson’s “strategic renewal” (Chakravarthy/Lorange 2007, p. 4).
Until the change of governance in 2001 Lawson’s store development activities and strategy
were characterised by intensive market expansion (Werner/McDermott/Rotz 2004, pp. 10-11),
increasing the number of standard-format stores. At that time the strategy emphasized store
location. The second strategic phase began in 2001. Ever since then, the main emphasis in Law-
son’s strategy has been on the creation of format variations and in seeking the strategic fit
between the offering of the store format and the targeted customer segment. As a result, Law-
son’s current strategy differs in many ways from its competitors’ more conventional strategies
and store development activities. According to our view those points of divergence show also
how Lawson is using its store formats as strategic innovation.
The first major difference is that Lawson has differentiated the offering part of its sub-formats
in terms of store locations, price levels, and product and service mixes. By adjusting these
primary marketing mix variables, Lawson has been able to serve new customer segments
(Markides 1997, p. 12: the emerging customer segments). The second major difference is that
Lawson has served the needs of new customer segments with novel customer value propositions
(e.g. healthy lifestyle, reasonable price, hybrid) (Govindarajan/Trimble 2004, p. 69: the concep-
tualization of delivered customer value). The third major difference is that Lawson’s sub-
formats seek also to respond to emerging trends in society and in local conditions (e.g. serving
the needs of aged persons) (Markides 1997, p. 12: the emerging customer needs).
It was argued in this paper that strategic differentiation also concerns, above all, the search and
the creation of the strategic fit between the offering of the store format and the targeted cus-
tomer segment. Unlike SEJ or other companies in the Japanese CVS business, Lawson seemed
to have placed more emphasis on effectiveness than on operational efficiencies. Effectiveness
is, according to our view, central from the strategic fit point of view, since it is more clearly
related to the company’s long-term goal achievement (compare Goodman 1985, p. 77). The cre-
ation of the strategic fit calls for changes not only in the offering part of the store format but
also in the know-how part of the store format. It was shown in the paper how Lawson’s current
strategy has also involved the creation of active business alliances and networks, and the devel-
opment of new delivery and distribution methods and systems to support the operation of the
sub-formats (Werner/McDermott/Rotz 2004, p. 10: the development of key capabilities; Chak-
ravarthy/Lorange 2007, p. 4: the development of distinctive competencies). Also the aforemen-
tioned aspects of Lawson’s strategy are inherent in Markides’ (1997, p. 12) and Govindarajan/
Trimble’s (2004, p. 49) conceptualization of strategic innovation.
Lawson’s multi-format strategy is in progress. The creation of format variation has not been
predestined by the strategic planning process but involved trial and error, piloting and experi-
menting with store format variants (cf. Reynolds et al.’s 2007, p. 652-653) notion concerning
“emergent strategy” approach to format innovation process; see also Mitzberg/Waters 1985).
Will Lawson’s multi-format strategy some day become the dominant mode of competition in
the Japanese CVS business? At least the main competitors have awakened and begun to imitate.
168 European Retail Research, Vol. 24, Issue I, pp. 149-172
Notes
[1] This survey was conducted by the Industrial Statistics Office, Research and StatisticsDepartment, METI (Ministry of Economy, Trade and Industry). In this survey, METI sentout questionnaires to the headquarters of major CVS chains which operate more than 500stores in Japan. According to another survey conducted by the editorial department of Kon-bini (a major CVS magazine in Japan), 12 companies fulfil this condition in 2008.
[2] In 2008 the sales value is estimated to be pushed up by special procurement for cigaretteproducts. A new regulation which prohibits buying cigarettes without certificate cards atvending machines went into force from this year, since then many smokers visited CVSsbecause they do not need to show the cards at person-to-person selling counters. Theywould purchase cigarettes and simultaneously buy additional items together at the CVS.
[3] SEJ still has not advanced into 10 prefectures (as of July 31, 2009). FamilyMart establishedstores in all prefectures in 2006. The latest numbers and distribution of stores areannounced at their websites. (Cf. http://www.sej.co.jp/english/company/n_stores.html,
[3] Lawson: http://www.lawson.co.jp/company/e/corporate/store.html,FamilyMart: http://www.family.co.jp/english/investor_relations/stores.html)
[4] cf. Nikkei Business, December 8, 1986, pp. 46-50; Nikkei Business, June 23, 1997, p44;Ekonomisuto, February 29, 2000, pp. 59-62; Gekiryu, May, 2001, pp. 76-80; Nikkei Busi-ness, September 25, 2006, pp. 70-73.
[5] Setagaya ward is one of 23 in the Tokyo metropolitan area and the population is around800,000. This ward mainly consists of well-known residential areas for families and popu-lar commercial regions for young people. There are lots of schools and universities. These7 types of store merchandising and 5 types of locational characteristics are classified byapplying factor analysis and cluster analysis with the data of GIS and the author’s originalsurvey in the spring of 1994.
[6] In the current phase, Lawson actively made contracts of business alliance or for absorbingexisting stores with several companies such as Japan Post Holdings, Shinsengumi HonbuCorporation and MatsumotoKiyoshi Holdings. Shinsengumi Honbu had operated CVSsequipped with kitchens. MatsumotoKiyoshi is Japan’s largest drugstore chain. It is thoughtthat Lawson would be aiming at obtaining partner’s experiences in different retail business-es and for gaining opportunities to establish new store formats, not aiming to have thelargest store networks. (cf. Keizaikai, April 3, 2007, pp. 56-57; Gekiryu, January, 2009, pp.20-22.)
[7] cf. Ekonomisuto, February 29, 2000, pp. 56-58; Nikkei Business, August 8, 2005, p. 42;Nikkei Business, September 4, 2006, pp. 46-48.
[8] Actually SEJ has recently started to operate a new type of store which has a small salesspace in buildings, gas stations and so on. But the store brand name and the design of itsfaçade is the same as standard SEJ stores. FamilyMart has another store brand, “Famima!!”,which targets urban residents and they have a different image colour, façade or item assort-ment, but there are only 17 stores (FamilyMart Annual Report 2009, p. 27). They startedthis business in 2003.
[9] cf. Gekiryu, October, 2006, pp. 23-28; Keizaikai, November 28, 2006, pp. 42-45; WeeklyToyo Keizai, May 26, 2007, pp. 72-76; PRESIDENT, July 2, 2007, pp. 146-151; WeeklyDiamond, October 27, 2007, pp. 142-145; Weekly Toyo Keizai, December 6, 2008, pp.106-108; Gekiryu, January, 2009, pp. 20-22.
Huuhka, A.; Shimizu, N.; Laaksonen, M. 169
References
Achabal, D.D.; Heineke, J.M.; McIntyre, S.H. (1984): Issues and perspectives on retail produc-tivity, in: Journal of Retailing, Vol. 60, No. 3, pp. 107-126.
Ahlert, D.; Blut, M.; Evanschitzky, H. (2006): Current Status and Future Evolution of RetailFormats, in: Krafft, M.; Mantrala, M.K. (eds.): Retailing in the 21st Century: Current andFuture Trends, Berlin.
Bernstein, J. (1994): Convenience-store retailing in two countries: Southland and Seven-ElevenJapan, Harvard Business School, Case N9-795-051.
Bernstein, J. (1996): 7-Eleven in America and Japan, Harvard Business School, Case N9-797-030.
Brown, S. (1987): Institutional change in retailing: a review and synthesis, in: European Journalof Marketing, Vol. 21, No. 6, pp. 5-36.
Burt, S.; Davies, K.; Dawson, J.; Sparks, L. (2008): Categorizing patterns and processes inretail grocery internationalisation, in: Journal of Retailing and Consumer Services, Vol. 15,No. 2, pp. 78-92.
CCRRCA (2007): Food retail formats in Asia: understanding format success, Coca-ColaRetailing Research Council Asia (CCRRCA).
Chakravarthy, B.; Lorange, P. (2007): Continuous renewal, and how Best Buy did it, in: Strate-gy & Leadership, Vol. 35, No. 6, pp. 4-11.
Colla, E. (2004): The outlook for European grocery retailing: competition and format develop-ment, in: International Review of Retail, Distribution and Consumer Research, Vol. 14, No.1, pp. 47-69.
Coopers; Lybrand (1996): The future for the food store, Coca-Cola Research Group Europe.
Cravens, D.W.; Piercy, N.F.; Baldauf, A. (2009): Management framework guiding strategicthinking in rapidly changing markets, in: Journal of Marketing Management, Vol. 25,No. 1-2, pp. 31-49.
Dawson, J. (2004): Food retailing, wholesaling and catering, in: Bourlakis, M.A.; Weightman,P.W.H. (eds.): Food Supply Chain Management, pp. 117-135.
Dawson, J. (2006): Retail Trends in Europe, in: Krafft, M.; Mantrala, M.K. (eds.): Retailing inthe 21st Century: Current and Future Trends, Berlin.
Fox, E.J.; Sethuraman, R. (2006): Retail competition, in: Krafft, M.; Mantrala, M.K. (eds.):Retailing in the 21st Century: Current and Future Trends, Berlin.
Furrer, O.; Thomas, H. (2000): The rivalry matrix: understanding rivalry and competitivedynamics, in: European Management Journal, Vol. 18, No. 6, pp. 619-637.
Gauri, D.K.; Trivedi, M.; Grewal, D. (2008): Understanding the determinants of retail strategy:an empirical analysis, in: Journal of Retailing, Vol. 84, No. 3, pp. 256-267.
Goldman, A. (2001): The transfer of retail formats into developing countries: the example ofChina, in: Journal of Retailing, Vol. 77, No. 2, pp. 221-242.
González-Benito, Ó. (2001): Inter-format spatial competition of Spanish hypermarkets, in:International Review of Retail, Distribution and Consumer Research, Vol. 11, No. 1, pp.63-81.
González-Benito, Ó. (2005): Spatial competitive interaction of retail store format: modeling pro-posal and empirical results, in: Journal of Business Research, Vol. 58, No. 4, pp. 457-466.
170 European Retail Research, Vol. 24, Issue I, pp. 149-172
González-Benito, Ó.; Muñoz-Gallego, P.A.; Kopalle, P.K. (2005): Asymmetric competition inretail store formats: evaluating inter- and intra-format spatial effects, in: Journal of Retail-ing, Vol. 81, No. 1, pp. 59-73.
Goodman, C.S. (1985): Comment: on output measures of retail performance, in: Journal ofRetailing, Vol. 61, No. 3, pp. 77-82.
Govindarajan, V.; Trimble, C. (2004): Strategic innovation and the science of learning, in: MITSloan Management Review, Vol. 45, No. 2, pp. 67-75.
Ishizaki, K. (1998): (in Japanese) Location analysis of convenience stores with store merchan-dising and locational characteristics in Setawaya Ward, in: Comprehensive Urban Studies,No. 65, pp. 45-67.
Kotabe, M. (1995): The return of 7-ELEVEN … from Japan: the Vanguard Program, in: TheColumbia Journal of World Business, Vol. 30, No. 4, pp. 70-81.
Kotler, P. (1988): The convenience store: past developments and future prospects, in: Nevett, T;Fullerton, R.A. (eds.): Historical Perspectives in Marketing, Essays in Honor of Stanley C.Hollander, Lexington, pp. 163-175.
Larke, R. (1994): Japanese Retailing, London.
Markides, C. (1997): Strategic innovation, in: Sloan Management Review, Vol. 38, No. 3, pp. 9-23.
Matsuo, H.; Ogawa, S. (2007): Innovating innovation: the case of Seven-Eleven Japan, in: Inter-national Commerce Review, Vol. 7, No. 2, pp. 105-114.
METI (Ministry of Economy, Trade and Industry) (1998, 1999, 2000, 2001, 2002, 2003, 2004,2005, 2006, 2007, 2008): Yearbook of the Current Survey of Commerce.
Messinger, P.R.; Narasimhan, C. (1997): A model of retail formats based on consumers’ econo-mizing on shopping time, in: Marketing Science, Vol. 16, No. 1, pp. 1-23.
Miller, C.E.; Reardon, J.; McCorkle, D.E. (1999): The effects of competition on retail structure:an examination of intratype, intertype, and intercategory competition, in: Journal of Market-ing, Vol. 63, No. 4, pp. 107-120.
Mintzberg, H.; Waters, J.A. (1985): Of strategies, deliberate and emergent, in: Strategic Man-agement Journal, Vol. 6, No. 3, pp. 257-272.
Ogawa, S. (1998): Does sticky information affect the locus of innovation? Evidence from theJapanese convenience-store industry, in: Research Policy, Vol. 26, No. 7-8, pp. 777-790.
Ogawa, S. (2000): Innovations of the convenience-store ordering system in Japan, in: Chinkota,M.R.; Kotabe, M. (eds.): Japanese Distribution Strategy: Changes and Innovations, pp.263-279.
Ogawa, S. (2002): The hypothesis-testing ordering system: a new competitive weapon of Japan-ese convenience stores in a new digital era, in: Industrial Relations, Vol. 41, No. 4, pp.579-604.
Porter, M.E. (2008): The five competitive forces that shape the strategy, in: Harvard BusinessReview, Vol. 86, No. 1, pp. 79-93.
Rapp, W.V.; Islam, M. (2006): Japanese mini-banks: retail banking services through conven-ience stores, in: Asian Business & Management, Vol. 5, No. 2, pp. 187-206.
Reinmoeller, P. (2002): Dynamic contexts for innovation strategy: utilizing customer knowl-edge, in: Design Management Journal, Vol. 2, No. 1, pp. 37-50.
Huuhka, A.; Shimizu, N.; Laaksonen, M. 171
Reutterer, T.; Teller, C. (2009): Store format choice and shopping trip types, in: InternationalJournal of Retail & Distribution Management, Vol. 37, No. 8, pp. 695-710.
Reynolds, J.; Howard, E.; Cuthbertson, C.; Hristov, L. (2007): Perspectives on retail formatinnovation: relating theory and practice, in: International Journal of Retail & DistributionManagement, Vol. 35, No. 8, pp. 647-660.
Seiders, K.; Berry, L.; Gresham, L.G. (2000): Attention, retailers! How convenient is your con-venience strategy?, in: Sloan Management Review, Vol. 41, No. 3, pp. 79-89.
Stalk, G.; Webber, A.M. (1993): Japan’s dark side of time, in: Harvard Business Review, Vol. 71,No. 4, pp. 93-102.
Takeda, Y.; Matsuo, H. (2002): ECR: a “fresh” look from Japan, in: ECR Journal, Vol. 2, No. 2,pp. 17-27.
Werner, U.; McDermott, J.; Rotz, G. (2004): Retailers at the crossroads: how to develop prof-itable new growth strategies, in: Journal of Business Strategy, Vol. 25, No. 2, pp. 10-17.
Yahagi, T. (1997): The convenience store system - “Made in Japan”, in: European Retail Digest,No. 13, Winter, pp. 18-28.
172 European Retail Research, Vol. 24, Issue I, pp. 149-172
Retailing in the United Kingdom - a Synopsis
Steve Burt, Leigh Sparks and Christoph Teller
AbstractThis paper illustrates the structure of, and trends in, the retail market of the United Kingdom(UK). This industry analysis describes the retail environment compared to continental Europeand considers the regulatory issues which have helped form this retail environment. By usingsecondary data we describe concentration and consolidation tendencies and explain specificfeatures of the UK retail market. Major trends are identified and discussed, concluding with anoutlook on future developments.
KeywordsUnited Kingdom, Retail Structure, Industry Analysis
Steve BurtInstitute for Retail Studies, Stirling Management School, University of Stirling, Stirling, Scotland,United Kingdom.
Leigh SparksInstitute for Retail Studies, Stirling Management School, University of Stirling, Stirling, Scotland,United Kingdom.
Christoph Teller (corresponding author)Institute for Retail Studies, Stirling Management School, University of Stirling, Stirling, Scotland,United Kingdom(Tel: ++44 1786 46 6454; E-mail: [email protected]).
Received: January 1, 2010Revised: April 22, 2010Accepted: April 22, 2010
EUROPEAN
RETAIL
RESEARCHVol. 24, Issue I, 2010, pp. 173-194
1. Introduction
1.1. Retailing in the United Kingdom and Europe
In a number of ways retailing in the United Kingdom of Great Britain and Northern Ireland [in
the following United Kingdom (UK)] appears to operate differently from the general pattern in
continental Europe. Some may see this as yet another example of UK’s unwillingness to
embrace the European Union, but as with all retailing, the sector merely reflects the context
within which it operates and the norms of behaviour that have developed in the domestic mar-
ket. In this brief paper we highlight the distinctive features of the UK’s retail market and illus-
trate how these have shaped the nature of competition in the sector.
Any attempt to understand the UK retail scene should start by recognising the distinctive fea-
tures of this market (Mintel 2010). The United Kingdom is a compact island market of more than
60 m people living in circa 25 m households and with the third highest density of population in
Europe after Belgium and the Netherlands. It is the sixth largest economy (Gross domestic prod-
uct 1,808 bn EUR) worldwide and third largest in Europe after Germany and France. The total
consumer expenditures are the second highest in Europe (1,096 bn EUR) after Germany (1,367
EUR) and 7th highest per capita in Europe (17,851 EUR in 2008). The UK is ranked 4th in terms
of total retail sales (318 bn EUR) and 12th in terms of retail sales per capita (5,184 EUR). Urban
centres are relatively close together and although decentralisation of large retail stores to the
urban periphery has occurred, planning policy has attempted to maintain a strong retail presence
in the urban core of most major towns and cities (BCSC 2006; Guy 2007).
As occupants of mainland Europe know all too well, Britain can perhaps best be described as
“in Europe, but not European”! General attitudes towards the European Union amongst the
majority of the population can be described as ambivalent, as illustrated in the strong desire to
retain the national currency. Despite this somewhat ethnocentric view, the UK market is an open
economy, and a large number of non-national retailers operate in the market. At the same time,
UK retailers are increasing their presence outside the domestic market.
1.2. The Retail Environment in UK
Government intervention in retailing has generally been directed at de-regulation and the pur-
suit of a free market economy. For example most restrictions on opening hours were removed in
1994; resale price maintenance in the book trade disappeared in 1995; and rules on pharmacy
licensing were amended in 2004. Where intervention has been restrictive, like elsewhere, it has
primarily been in response to fears about the growing power of large operators. Store location in
Britain is managed through zoning procedures in general land use planning policy i.e. it is the
land use itself that receives the permission and not the user per se. From the mid 1990s there has
174 European Retail Research, Vol. 24, Issue I, pp. 173-194
been a clear emphasis on protecting and reviving town centres, rather than allowing further
expansion on the periphery i.e. the so-called town centres first’ policy. Guy (2007) summarises
retail land-use planning and regulation in the United Kingdom into four phases. Whilst the pol-
icy framework differs in timescale and to some degree in approach between the constituent
countries/parts of the United Kingdom (Scotland, Wales, Northern Ireland and England), the
broad dimensions of these four phases holds true across the constituent countries:
- 1960s/1970s - early days of retail regulation with initial resistance to new retail forms e.g. out
of town shopping centres, hypermarkets;
- 1980s - a loosening up of regulation to more approach a market led system allowing an expan-
sion of new forms e.g. superstores, retail warehouses, regional shopping centres, outlet centres;
- 1990s - the gradual tightening up of policy as cumulative effects from retail decentralisation on
town centres became more noticeable e.g. the development of the ‘town centres first’ policy;
- 2000s - the continuation of the ‘town centres first’ policy which has redirected off-centre
developments to, and focus attention back on, town and city centres.
As can be noted from the brief policy descriptions of these phases, policy has tended to switch
between restrictions on new forms of development to encouragement of such developments (as
in the ‘planning-free’ Enterprise Zone experiment of the 1980s - see Dawson and Sparks 1982;
Sparks 1987), and then back to more restriction. This switching of land-use policy has been
driven essentially by the outcome of debates at particular times over the social versus econom-
ic requirements from retailing and the question of the degree of impact on existing retailers and
existing centres (e.g. Guy 1998b; Guy/Bennison 2002). More recently these issues have been
overlain with debates about the environmental impact and sustainability of various forms of
retailing as for example in terms of productivity (e.g. Sparks 2005).
At the same time as there has been this policy regulation over land-use, there has also been peri-
odic concerns about the continued growth of large retailers. These concerns have generally been
couched in terms of competitive impacts of large retailers on smaller independent retailer oper-
ations and ‘small shops’ and on impacts on suppliers and producers of products, particularly in
the food arena (e.g. Clarke 2000; Clarke et al. 2002). In the early 1980s, the decline of the small
shop/independent retailer and the relationships between large retailers and suppliers were inves-
tigated by the Monopolies and Mergers Commission (MMC 1981). They found that whilst such
concerns were justified, the evidence suggested that consumers were benefiting overall in terms
of lower prices and as such there was no need to intervene in the market. This finding was con-
firmed in a follow-up study by the Office of Fair Trading (OFT 1985).
With the relaxation of restrictions on new retail forms in the 1980s, large retailers began to
exploit a cycle of growth which saw considerable increases in scale and concentration. Existing
large retailers continued to get bigger and concentration ratios continued to grow. In the early
Burt, S.; Sparks, L.; Teller, Ch. 175
1990s, academic concerns about abuses of market power began to be raised (e.g. Wrigley 1991,
1992a, 1992b, 1993) particularly in food retailing, and were picked up by the media especially
in terms of price comparisons with overseas markets. This price comparison issue was taken up
by politicians, notably by the Labour Party, before and after its election success in 1997 (Sparks
2002). The basic claim was that the market had ceased to operate fairly and that large (food)
retailers were making excess profits and abusing their market positions. Some of this perceived
abuse was put down to individual ‘greedy’ firms, but there was also a concern over the opera-
tion of the market as a whole and the potential for collusion amongst companies. As power in
food retailing continued to concentrate in the hands of a smaller number of retailers, so these
concerns grew louder (e.g. Marsden et al. 1998; Dobson/Waterson 1999; Dobson et al. 2003),
eventually focusing on the dominant position of Tesco (Burt/Sparks 2003). Whilst impact
on town centres and small independent retailers has remained a topic of concern, the scale of
the largest retailers, especially in food, has been seen as causing a competitive problem for the
market as a whole.
The UK had in many ways in the 1980s had a more laissez-faire approach to retail development
than elsewhere in Europe (Davies 1995; Guy 1998a). This came to an end in the early to mid
1990s when regulation was tightened primarily on the basis of competitive impact on town cen-
tres, the continuing growth of large retailers and the stirrings of environmental concern (e.g.
BDP et al. 1992; CB Hillier Parker et al. 1998). Decentralisation of retailing as a consequence
began to alter in form and to slow (Schiller 1986, Hallsworth 1994; Wrigley 1994; Fernie
1998). The tightening of land-use regulation constrained development and altered the trajectory
of retail development in the UK (Wrigley 1994, 1998a, 1998b; Pal et al. 2001; Guy 2002). This
is not to say that the concerns over scale and impact have gone away. Indeed large retailers have
proved adept at reacting to the new situations (e.g. Wood et al. 2006; Thomas 2006; Guy/Benni-
son 2007). The continuing increases in concentration and corporate scale, and the ability of
some retailers to continue to expand floorspace, have brought retailing, and especially food
retailing, much closer attention from regulatory authorities. In particular there has been a
sequence of investigations by the Competition Commission into the grocery market and its sup-
plier relationships and competition (Sparks 2008a):
The culmination of the media and political campaign in the mid-1990s over retail prices was an
investigation into supermarkets in 1999/2000 (Competition Commission 2000). The bid for
Safeway by Morrisons in 2003 led to another investigation as competing bids for Safeway were
all examined together (Competition Commission 2003). When Morrisons were permitted to
buy Safeway (the other leading food retailers were not, on the basis of subsequent concentration
levels), some stores had to be sold off due to concerns over local market shares, which produced
a further report (Competition Commission 2005). Then in 2006 another full investigation into
the market position in food retailing was announced as a consequence of continuing concerns
176 European Retail Research, Vol. 24, Issue I, pp. 173-194
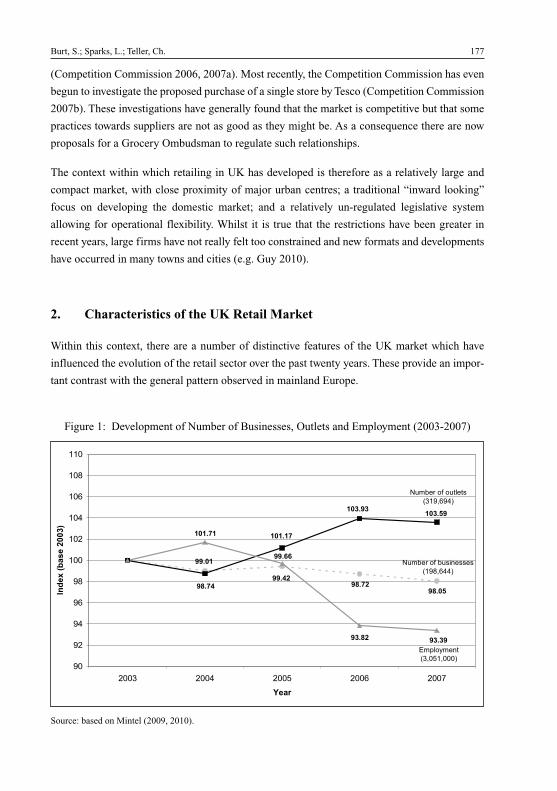
(Competition Commission 2006, 2007a). Most recently, the Competition Commission has even
begun to investigate the proposed purchase of a single store by Tesco (Competition Commission
2007b). These investigations have generally found that the market is competitive but that some
practices towards suppliers are not as good as they might be. As a consequence there are now
proposals for a Grocery Ombudsman to regulate such relationships.
The context within which retailing in UK has developed is therefore as a relatively large and
compact market, with close proximity of major urban centres; a traditional “inward looking”
focus on developing the domestic market; and a relatively un-regulated legislative system
allowing for operational flexibility. Whilst it is true that the restrictions have been greater in
recent years, large firms have not really felt too constrained and new formats and developments
have occurred in many towns and cities (e.g. Guy 2010).
2. Characteristics of the UK Retail Market
Within this context, there are a number of distinctive features of the UK market which have
influenced the evolution of the retail sector over the past twenty years. These provide an impor-
tant contrast with the general pattern observed in mainland Europe.
Burt, S.; Sparks, L.; Teller, Ch. 177
����������
����
����
����������
���
����
����������
�����
���
��
��
��
��
��
���
���
���
���
���
���
��� ���� ��� ���� ����
���
����������������
� ���� �� � ��������
���������
� ��������� ������
��������
����������
���������
Figure 1: Development of Number of Businesses, Outlets and Employment (2003-2007)
Source: based on Mintel (2009, 2010).
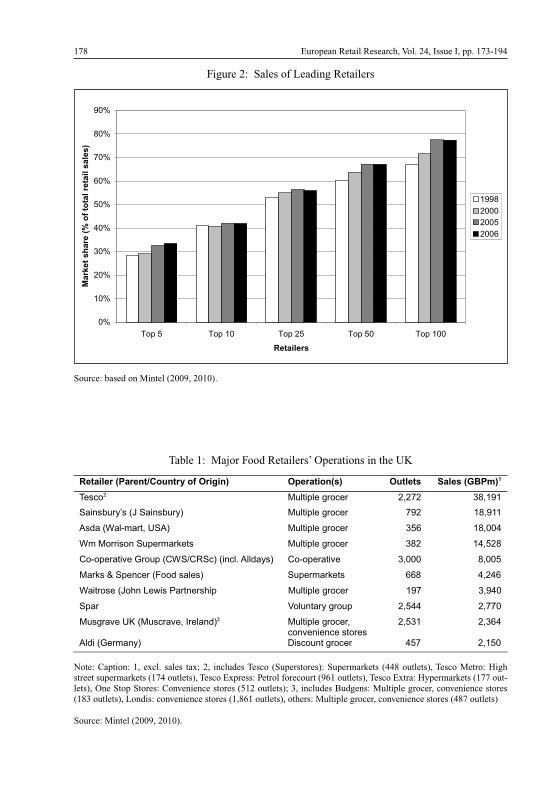
178 European Retail Research, Vol. 24, Issue I, pp. 173-194
�������� ������ ������ ���������� ����������� ������� �����������
������ ��� � ������ ����� ������
���������� ������������ ��� �������� ��� ������
�!� �"�#$���� %� � ��� � ������ �&' ���(()
"$����������� ��$��*��� ��� � ������ ��� �)�&��
+�#� �����,� -�� ��+"�.+/��� ����0 !���� +�#� �����,� ��((( ��((&
���*��1�� ����� �2��!������ � ��$��*��� ''� )��)'
"������� ���3��4�5���6�������3� ��� � ������ ��� ���)(
� �� 7������ ��� ��&)) ����(
�����,� %8 ������,�� 9����!�� ��� � ����������,��������������
��&�� ���')
!� �-��$���� :������������� )&� ���&(
Table 1: Major Food Retailers’ Operations in the UK
Source: Mintel (2009, 2010).
��
���
���
���
���
���
��
��
���
���
���� ����� ����� ����� ������
��������
������ ���
�����������������������
����
����
����
���
Figure 2: Sales of Leading Retailers
Source: based on Mintel (2009, 2010).
Note: Caption: 1, excl. sales tax; 2, includes Tesco (Superstores): Supermarkets (448 outlets), Tesco Metro: Highstreet supermarkets (174 outlets), Tesco Express: Petrol forecourt (961 outlets), Tesco Extra: Hypermarkets (177 out-lets), One Stop Stores: Convenience stores (512 outlets); 3, includes Budgens: Multiple grocer, convenience stores(183 outlets), Londis: convenience stores (1,861 outlets), others: Multiple grocer, convenience stores (487 outlets)
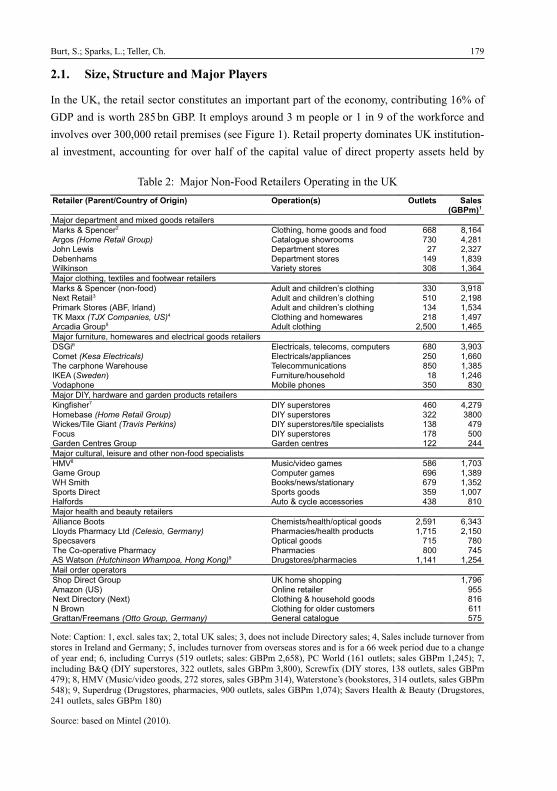
2.1. Size, Structure and Major Players
In the UK, the retail sector constitutes an important part of the economy, contributing 16% of
GDP and is worth 285 bn GBP. It employs around 3 m people or 1 in 9 of the workforce and
involves over 300,000 retail premises (see Figure 1). Retail property dominates UK institution-
al investment, accounting for over half of the capital value of direct property assets held by
Burt, S.; Sparks, L.; Teller, Ch. 179
�������� ������ ������ ���������� ����������� ������� ����������
����� ������� ��� ����� ����� ��������
����� � ������� �������� ���� ����� ��� ���� ��� ����� ���� ����������� ����� ������!� ���"����� #$% �����&��� '�"�� (������ ����� �# ��$�#(�)������ (������ ����� ��* ���$*+�������� ,����- ����� $%� ��$��
����� �������� ������ ��� ���"��� ��������
����� � ������ .���/����0 �!� ��� ��������1� ������� $$% $�*��2�� 3����$ �!� ��� ��������1� ������� 4�% ���*�5������ ����� . 67� 8�����0 �!� ��� ��������1� ������� �$� ��4$�9: ���� �������������� ���� ������� ��� ����"���� ��� ���*# ������ ;��!4 �!� ������� ��4%% ����4
����� �!���!��� ����"���� ��� ��������� ����� ��������
(�;�� <���������� �������� ���!��� ��% $�*%$���� ���� ���������� <���������=�������� �4% ����%9�� ������� +�����!�� 9�������!�������� �4% ��$�48:< .������0 7!���!��=��!������ �� �����,������� ��)��� ����� $4% �$%
����� (8>� ����"��� ��� ������ ���!�� ��������
:���������# (8> �!������� ��% ���#*?���)��� ����� ����� ����� (8> �!������� $�� $�%%+�����=9��� ;��� ��� ���!��"���� (8> �!�������=��� ��������� �$� �#*7��!� (8> �!������� �#� 4%%;����� ������ ;��! ;����� ������ ��� ���
����� �!�!���� ����!�� ��� ���� ���/���� ���������
?�,� �!���=@���� ����� 4�� ��#%$;��� ;��! ���!�� ����� �*� ��$�*+? ���� 6����=��"�=�������- �#* ��$4����� (���� ���� ����� $4* ��%%#?������� !� � �-��� ����������� �$� ��%
����� ����� ��� )��!- ��������
������� 6��� �������=�����=����� ����� ��4*� ��$�$'��-�� 5������- '� ���������� ����#� 5���������=����� ���!�� ��#�4 ���4%�����@��� A���� ����� #�4 #�%9�� ��/�����@� 5������- 5��������� �%% #�4 � +���� ����$������%$��������&����&�* (�!������=��������� ����� ���4�
���� ����� �������
��� (���� ;��! B: ���� ������ ��#*� ��C�� .B�0 A����� ������� *442�� (������- .2��0 ������� � ��!������ ����� ���2 6��"� ������� ��� ����� �!������ ���;����=7������� �'�� ������ ����#� ;������ ������!� 4#4
Table 2: Major Non-Food Retailers Operating in the UK
Source: based on Mintel (2010).
Note: Caption: 1, excl. sales tax; 2, total UK sales; 3, does not include Directory sales; 4, Sales include turnover fromstores in Ireland and Germany; 5, includes turnover from overseas stores and is for a 66 week period due to a changeof year end; 6, including Currys (519 outlets; sales: GBPm 2,658), PC World (161 outlets; sales GBPm 1,245); 7,including B&Q (DIY superstores, 322 outlets, sales GBPm 3,800), Screwfix (DIY stores, 138 outlets, sales GBPm479); 8, HMV (Music/video goods, 272 stores, sales GBPm 314), Waterstone’s (bookstores, 314 outlets, sales GBPm548); 9, Superdrug (Drugstores, pharmacies, 900 outlets, sales GBPm 1,074); Savers Health & Beauty (Drugstores,241 outlets, sales GBPm 180)
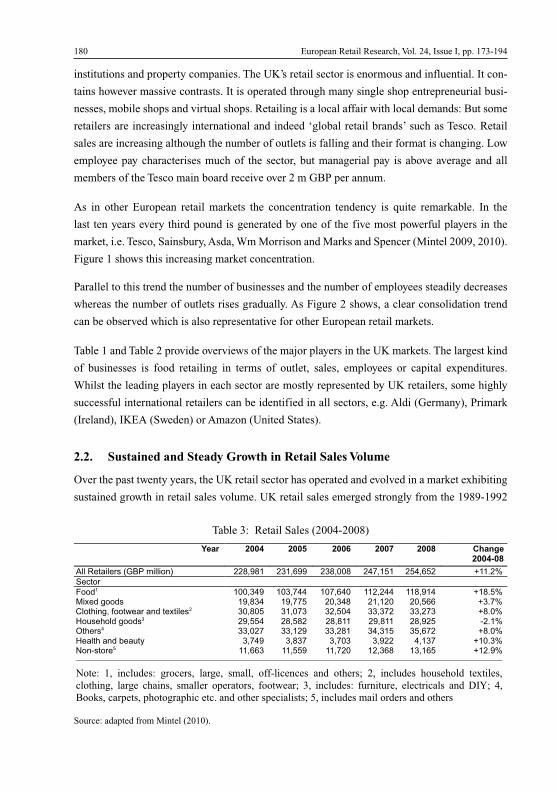
institutions and property companies. The UK’s retail sector is enormous and influential. It con-
tains however massive contrasts. It is operated through many single shop entrepreneurial busi-
nesses, mobile shops and virtual shops. Retailing is a local affair with local demands: But some
retailers are increasingly international and indeed ‘global retail brands’ such as Tesco. Retail
sales are increasing although the number of outlets is falling and their format is changing. Low
employee pay characterises much of the sector, but managerial pay is above average and all
members of the Tesco main board receive over 2 m GBP per annum.
As in other European retail markets the concentration tendency is quite remarkable. In the
last ten years every third pound is generated by one of the five most powerful players in the
market, i.e. Tesco, Sainsbury, Asda, Wm Morrison and Marks and Spencer (Mintel 2009, 2010).
Figure 1 shows this increasing market concentration.
Parallel to this trend the number of businesses and the number of employees steadily decreases
whereas the number of outlets rises gradually. As Figure 2 shows, a clear consolidation trend
can be observed which is also representative for other European retail markets.
Table 1 and Table 2 provide overviews of the major players in the UK markets. The largest kind
of businesses is food retailing in terms of outlet, sales, employees or capital expenditures.
Whilst the leading players in each sector are mostly represented by UK retailers, some highly
successful international retailers can be identified in all sectors, e.g. Aldi (Germany), Primark
(Ireland), IKEA (Sweden) or Amazon (United States).
2.2. Sustained and Steady Growth in Retail Sales Volume
Over the past twenty years, the UK retail sector has operated and evolved in a market exhibiting
sustained growth in retail sales volume. UK retail sales emerged strongly from the 1989-1992
180 European Retail Research, Vol. 24, Issue I, pp. 173-194
���� ���� ��� ��� ���� ���� ������
����������� � �� ������ ������� ������� ������� ������� ������� ��� �!
"�#��
$��%� ������� ������� ������� ������� ������� ��� �!&'�% (��%� ������ ������ ������ ������ ������ �� �!)���*�(��+���,�����%���'����� ������ ������ ������ ������ ������ �� �!-�.��*��%�(��%�� ������ ������ ������ ������ ������ /� �!0�*��� ������ ������ ������ ������ ������ �� �!-����*���% 1��.�2 ����� ����� ����� ����� ����� ��� �!3��/����� ������ ������ ������ ������ ������ ��� �!
������ � �� ����� ������� ���� ��� ���� ������ ��� ������� � �� ���� ������� � ���� ��
� ����� ���� ����� ��� �� ��������� ��������� � �� ����� �������� � ������ � ��� �� � !�
"��#� �����������������������$���������������� �����%��� ������� ������������������
Table 3: Retail Sales (2004-2008)
Source: adapted from Mintel (2010).
2004-08

recession, reinforcing a similar strong pattern of growth in the 1980s. The availability of con-
sumer credit is cited as the driving force behind this sales growth, allowing customers to take
advantage of the changing retail offer made available by shorter market lead times, more fash-
ion cycles and the improved merchandising and marketing activities of retailers. Whatever the
driving force behind these trends, unlike most of mainland Europe over this period, most retail
sectors in the UK evolved against a background of steady and sustained growth in retail sales
volume (see Table 3). Most recently however the ‘credit crunch recession’ of 2008 onwards has
seen retail sales fall and stagnate and many businesses close shops or shut down totally (e.g.
Woolworths).
2.3. Stock Market Ownership
Although the last few years has seen a number of high street clothing retailers move into private
ownership, the majority of UK retailers have a long history of raising finance on capital mar-
kets. The involvement of external stakeholders in this way places increased pressure on man-
agement, and focuses attention on financial measures of performance. The problems of retail
icons such as Marks and Spencer and J. Sainsbury in the mid1990s and 2000s respectively, and
the fate of senior managers at these companies, illustrate the power of the “city” and institution-
al shareholders in monitoring performance and raising expectations as critical stakeholders. A
further implication of a listing on the stock exchange is that it makes companies vulnerable to
takeover (at the right price) and contested acquisitions are not uncommon as companies seek to
grow market share. Tesco in the 2000s grew its convenience market share through acquisitions,
Wal-Mart was able to snatch Asda from an agreed deal with Kingfisher in 1997 and the Mor-
risons/Safeway merger of 2003 only came about after a Competition Commission investigation
as to which company should be allowed to buy Safeway amongst all the leading food retailers.
2.4. Cost Structures
A cursory glance at the financial accounts of UK retailers (particularly grocery retailers) sug-
gests that the market generates high net margins. However, direct comparison with similar com-
panies in mainland Europe is dangerous as differences in financial accounting procedures,
especially in the treatment of items such as depreciation and goodwill distorts direct compar-
isons. Cost structures within UK retailing are however different and as such influence operating
policies and behaviour. Property and labour cost structures illustrate some of these differences.
Land and store fitting out costs are high, and shop rents are not linked to turnover, but often to
regular Upward Only Rent Reviews, which means that rental charges generally increase irre-
spective of market performance (although the recent recession has challenged this approach).
Labour cost structures are also different, not necessarily in respect of the overall cost of labour,
but in the management of labour. Part-time labour is the dominant form of shop-floor employ-
Burt, S.; Sparks, L.; Teller, Ch. 181
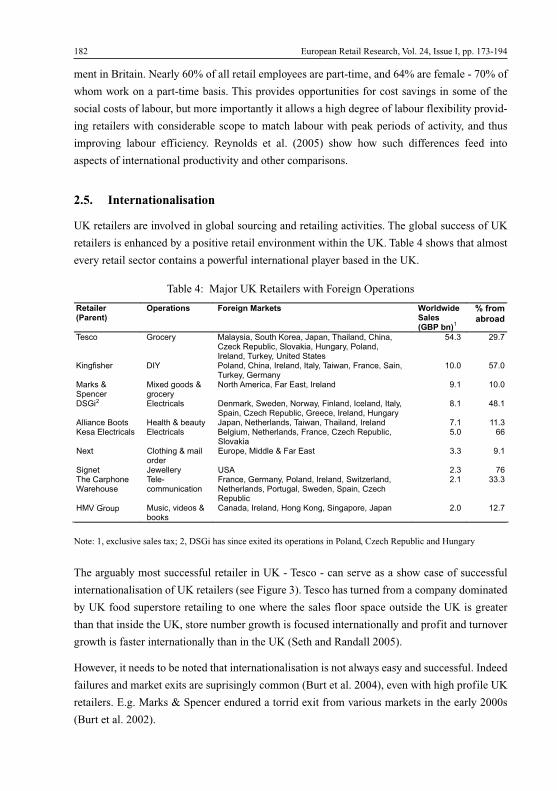
ment in Britain. Nearly 60% of all retail employees are part-time, and 64% are female - 70% of
whom work on a part-time basis. This provides opportunities for cost savings in some of the
social costs of labour, but more importantly it allows a high degree of labour flexibility provid-
ing retailers with considerable scope to match labour with peak periods of activity, and thus
improving labour efficiency. Reynolds et al. (2005) show how such differences feed into
aspects of international productivity and other comparisons.
2.5. Internationalisation
UK retailers are involved in global sourcing and retailing activities. The global success of UK
retailers is enhanced by a positive retail environment within the UK. Table 4 shows that almost
every retail sector contains a powerful international player based in the UK.
182 European Retail Research, Vol. 24, Issue I, pp. 173-194
��������������
��������� ��������������� ���������������������
�������������
����� ������ ���� ���������������������� ��� �������� �������� ������ ��������� ������ ����!������"������� ������ #� ��� ������
$%&' ()&*
� � + ���� ,"- !��������� ����"��������"���� �� .����/��������� ������������0��
12&2 $*&2
�����3��������
4�� ���� 3 �����
5�����60�� ����/���7�����"������ )&1 12&2
,�� 7����� ���� ,��0������.������5��.���/ �������"��������"������� ��������������� �����������"����������� ��
8&1 %8&1
6�� �����9���� �������3������ �������5����������� �� .��� ��� ������"������ *&1 11&'�����7����� ���� 7����� ���� 9�� �0��5����������� /������������ ������ ���
������ �$&2 ::
5�4� ����� � �3 0� ������
7������� ���� 3 /�� 7��� '&' )&1
� ��� ��.����� #�6 (&' *:������������;��������
����<��00�� ��� ��
/����������0��� !�������"���������. ���������5����������� !���� ��� �.����� ��� �������������� �
(&1 ''&'
�;������ �� ���� �����3������
��������"����������� ���� ��� � ������ ����� (&2 1(&*
Table 4: Major UK Retailers with Foreign Operations
Note: 1, exclusive sales tax; 2, DSGi has since exited its operations in Poland, Czech Republic and Hungary
The arguably most successful retailer in UK - Tesco - can serve as a show case of successful
internationalisation of UK retailers (see Figure 3). Tesco has turned from a company dominated
by UK food superstore retailing to one where the sales floor space outside the UK is greater
than that inside the UK, store number growth is focused internationally and profit and turnover
growth is faster internationally than in the UK (Seth and Randall 2005).
However, it needs to be noted that internationalisation is not always easy and successful. Indeed
failures and market exits are suprisingly common (Burt et al. 2004), even with high profile UK
retailers. E.g. Marks & Spencer endured a torrid exit from various markets in the early 2000s
(Burt et al. 2002).
2
1
% fromabroad
V Group
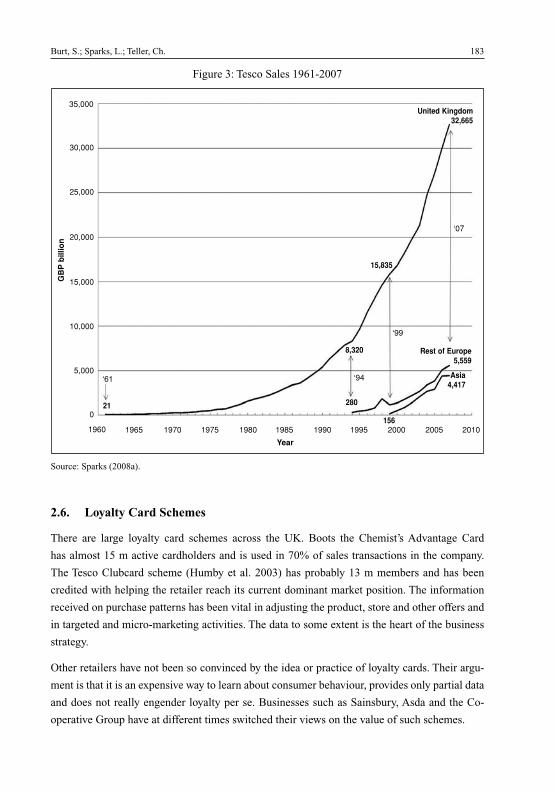
2.6. Loyalty Card Schemes
There are large loyalty card schemes across the UK. Boots the Chemist’s Advantage Card
has almost 15 m active cardholders and is used in 70% of sales transactions in the company.
The Tesco Clubcard scheme (Humby et al. 2003) has probably 13 m members and has been
credited with helping the retailer reach its current dominant market position. The information
received on purchase patterns has been vital in adjusting the product, store and other offers and
in targeted and micro-marketing activities. The data to some extent is the heart of the business
strategy.
Other retailers have not been so convinced by the idea or practice of loyalty cards. Their argu-
ment is that it is an expensive way to learn about consumer behaviour, provides only partial data
and does not really engender loyalty per se. Businesses such as Sainsbury, Asda and the Co-
operative Group have at different times switched their views on the value of such schemes.
Burt, S.; Sparks, L.; Teller, Ch. 183
35,000
30,000
United Kingdom32,665
Rest of Europe5,559
Asia4,417
156
28021
Year
GB
Pb
illio
n
8,320
15,835
25,000
20,000
15,000
10,000
5,000
1960 1965 1970 1975 2010200520001995
‘94‘61
‘99
‘07
199019851980
0
Figure 3: Tesco Sales 1961-2007
Source: Sparks (2008a).
The evidence however would seem to point to loyalty schemes being successful when managed
and integrated fully with the business. The consumer focus that a loyalty scheme can bring
allows retailers to track mobile consumers as they shop in different ways across the company.
Thus for example as Tesco have developed their various formats and channels (e.g. Metro,
Express, Extra, Direct, Homeplus, Telecoms, etc.; see Table 5) so the Clubcard can be used as
the connective mechanism to track consumers and their patterns of shopping. Such data, whilst
somewhat problematic in both privacy and practical terms at the individual level (e.g.
Smith/Sparks 2004) does allow a strong degree of segmentation and a fuller understanding of
actual and potential behaviours. It also allows store specific and individualised merchandising
and marketing.
3. The Nature of Competition
Faced until recently with an operating environment with natural growth in retail sales, fuelled in
part by consumer credit and a consumer willing to spend; strict taskmasters in the form of city
investors requiring continued growth, financial performance and returns on investment; and
cost structures allowing a service based focus in the retail offer, the nature of competition in the
UK market has taken a particular form, with a strong emphasis on non-price based competition,
and control and replication of a branded retail offer.
3.1. Centralised Management and Procedures
Management systems and operating procedures in UK retailing are highly centralised. This
reflects investment in technology based control systems to improve efficiency and control
costs, but also a management philosophy based upon control and conformity. Localised mer-
chandising and marketing activities do take place, but these are company managed and sup-
ported rather than the outcome of store level entrepreneurial activity. One example of cen-
tralised management systems providing scope for operational efficiencies, cost savings, and
general improvements in quality standards and service levels is the investments made by UK
grocery retailers in managing the supply chain - initially through the adoption of centralised
distribution systems and third party distribution services, and latterly through EDI and ECR
initiatives. Figure 4 provides the example of the impact upon Tesco’s inventory levels over this
period. The 1960s to 1980s were characterised by manufacturer organised direct to store deliv-
eries. Retailer controlled centralisation and composite centre development in the 1980s pro-
duced major costs savings and service benefits. Recent complications to the business e.g.
global operations, internet sales, non-food growth, catalogue sales, have added complexity, but
the operation continues to be world leading (Smith/Sparks 2009). In a broader context, the
strong central control exercised over operations also provides corporate discipline and unifor-
184 European Retail Research, Vol. 24, Issue I, pp. 173-194

mity in the customer offer; a consistency which has enhanced the potential to develop strong
private brand ranges.
3.2. Channel Leadership
Concentration at the level of the firm has occurred in every retail sector. The growth of retail
power in the channel is a universal phenomenon, but the way that this power is used differs from
market to market. In Britain, market power, and information power provided via scanning and
EPOS systems has been used not just to improve trading terms with suppliers but in a proactive
way to manage and develop product categories. This does not mean that retailers have not
sought improved terms, but there has also been an emphasis on growing channel margin not just
taking a larger share of channel margin. Reductions in payment delays (typically under 28 days
in grocery), investments in supplier capabilities and supply chain efficiencies, and more intense
developmental cooperation with a reduced number of key suppliers, characterise this way of
operating. Leading retailers now talk of a demand rather than supply channel, which reflects the
emphasis on responding to customers and providing innovation in products and services, rather
than supplying existing products and services.
Burt, S.; Sparks, L.; Teller, Ch. 185
Figure 4: Tesco - Inventory Levels 1961-2007
Source: Sparks (2008a)
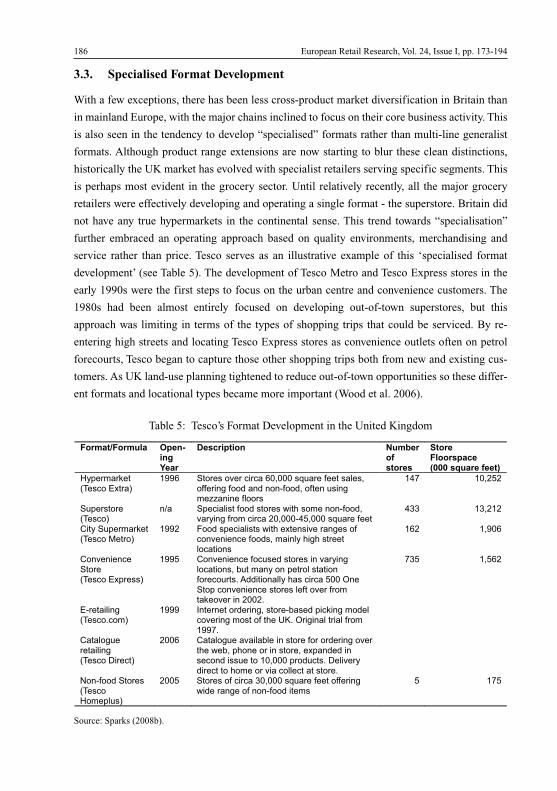
3.3. Specialised Format Development
With a few exceptions, there has been less cross-product market diversification in Britain than
in mainland Europe, with the major chains inclined to focus on their core business activity. This
is also seen in the tendency to develop “specialised” formats rather than multi-line generalist
formats. Although product range extensions are now starting to blur these clean distinctions,
historically the UK market has evolved with specialist retailers serving specific segments. This
is perhaps most evident in the grocery sector. Until relatively recently, all the major grocery
retailers were effectively developing and operating a single format - the superstore. Britain did
not have any true hypermarkets in the continental sense. This trend towards “specialisation”
further embraced an operating approach based on quality environments, merchandising and
service rather than price. Tesco serves as an illustrative example of this ‘specialised format
development’ (see Table 5). The development of Tesco Metro and Tesco Express stores in the
early 1990s were the first steps to focus on the urban centre and convenience customers. The
1980s had been almost entirely focused on developing out-of-town superstores, but this
approach was limiting in terms of the types of shopping trips that could be serviced. By re-
entering high streets and locating Tesco Express stores as convenience outlets often on petrol
forecourts, Tesco began to capture those other shopping trips both from new and existing cus-
tomers. As UK land-use planning tightened to reduce out-of-town opportunities so these differ-
ent formats and locational types became more important (Wood et al. 2006).
186 European Retail Research, Vol. 24, Issue I, pp. 173-194
������������ �� ������� ��
� ��������� ��� ��������� �
���� ��������� ��������� �� ��
������������ ��������
���� ���� ������������������� ���������� ��� �������� !����"�� "� � #���"����� �� � !��$$� � �������
�%& ���'('
����� ������ ���
)� �������� ����"� ��� �*�+� ���� � #���"������� !������������'�����#%(����� ���������
%,, �,�'�'
-��������������� ���.����
���' /��"� ������� �*�+���� ������ !� ������ �� �� ������" ����� ���+�!+� ����������
��' �����
-� �� �� ���������� �������� �
���( -� �� �� ������� �"� ��� �� ������ !������� ��0���� ��� ������� ��� ��������� 1�2""��� �����+� �������(���3 �������� �� �� ��� ��� ����������������������� �'��'1
&,( ��(�'
�#������ !���� ��1����
���� 4 �� ����"��� !�� ���#0� �"����� !���"��������� !��� ����+��561�3��!� ���������������&1�
-����!�������� !���� ���7�����
'��� -����!���������0���� � ����������"��� !������+��*�0���+� ������ � ��������� "�"�� � ��� "�� ���������������"�� 1�7�������"�������+�������������������� ���1
8� #���"����� ��� ���������� �
'��( ���� ����������,������ ���������������� !�*�"���� !����� � #���"����
( �&(
Table 5: Tesco’s Format Development in the United Kingdom
Source: Sparks (2008b).
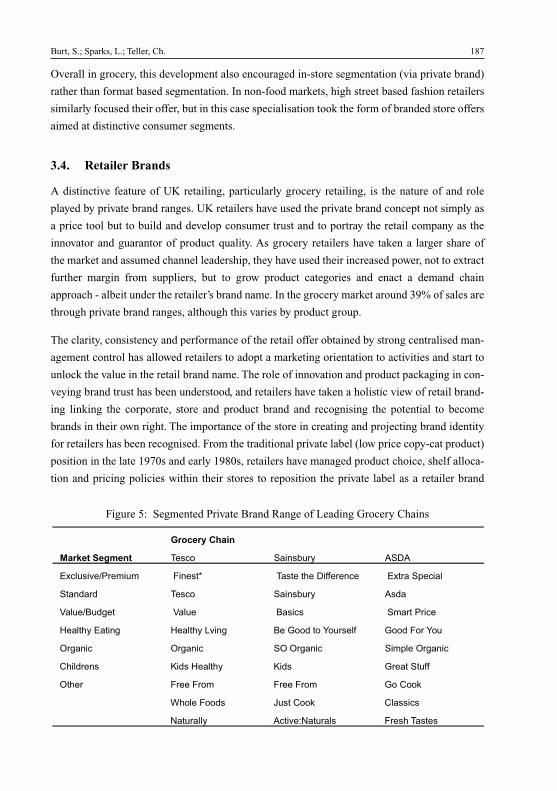
Overall in grocery, this development also encouraged in-store segmentation (via private brand)
rather than format based segmentation. In non-food markets, high street based fashion retailers
similarly focused their offer, but in this case specialisation took the form of branded store offers
aimed at distinctive consumer segments.
3.4. Retailer Brands
A distinctive feature of UK retailing, particularly grocery retailing, is the nature of and role
played by private brand ranges. UK retailers have used the private brand concept not simply as
a price tool but to build and develop consumer trust and to portray the retail company as the
innovator and guarantor of product quality. As grocery retailers have taken a larger share of
the market and assumed channel leadership, they have used their increased power, not to extract
further margin from suppliers, but to grow product categories and enact a demand chain
approach - albeit under the retailer’s brand name. In the grocery market around 39% of sales are
through private brand ranges, although this varies by product group.
The clarity, consistency and performance of the retail offer obtained by strong centralised man-
agement control has allowed retailers to adopt a marketing orientation to activities and start to
unlock the value in the retail brand name. The role of innovation and product packaging in con-
veying brand trust has been understood, and retailers have taken a holistic view of retail brand-
ing linking the corporate, store and product brand and recognising the potential to become
brands in their own right. The importance of the store in creating and projecting brand identity
for retailers has been recognised. From the traditional private label (low price copy-cat product)
position in the late 1970s and early 1980s, retailers have managed product choice, shelf alloca-
tion and pricing policies within their stores to reposition the private label as a retailer brand
Burt, S.; Sparks, L.; Teller, Ch. 187
������������
������������
����� ����� � ����
��������/� ���� ����� ����� ��� ���� ��� ��� � ������
����� � ����� ����� � ����
�����/��� �� ����� ����� ��� � � ��
!������"��� !������ #� �� $���"�� %�� ���� $���"�� "%��
& �� & �� �& & �� ����� & ��
'��� �� (�� !������ (�� $ ���"�����
&��� � ��"� �� � ��"� �� $� '��)
*����"����� +��� '��) '������
,��� ���� �����-,��� ��� � ���"������
Figure 5: Segmented Private Brand Range of Leading Grocery Chains
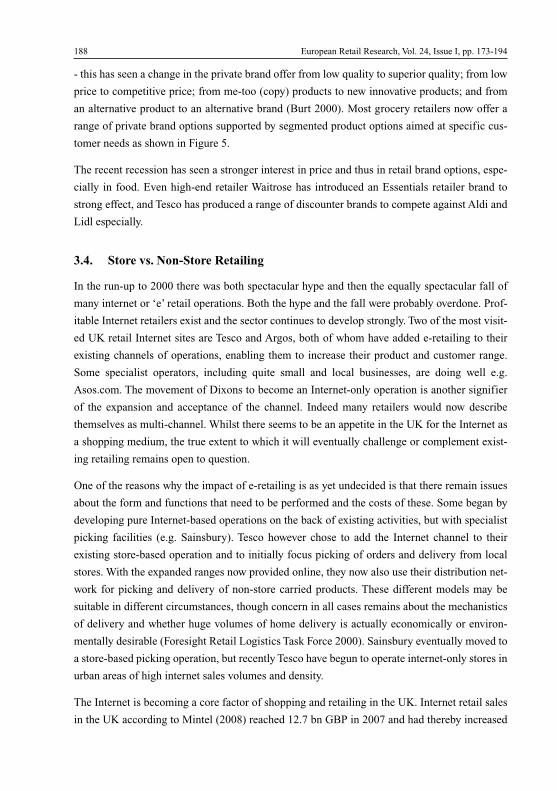
- this has seen a change in the private brand offer from low quality to superior quality; from low
price to competitive price; from me-too (copy) products to new innovative products; and from
an alternative product to an alternative brand (Burt 2000). Most grocery retailers now offer a
range of private brand options supported by segmented product options aimed at specific cus-
tomer needs as shown in Figure 5.
The recent recession has seen a stronger interest in price and thus in retail brand options, espe-
cially in food. Even high-end retailer Waitrose has introduced an Essentials retailer brand to
strong effect, and Tesco has produced a range of discounter brands to compete against Aldi and
Lidl especially.
3.4. Store vs. Non-Store Retailing
In the run-up to 2000 there was both spectacular hype and then the equally spectacular fall of
many internet or ‘e’ retail operations. Both the hype and the fall were probably overdone. Prof-
itable Internet retailers exist and the sector continues to develop strongly. Two of the most visit-
ed UK retail Internet sites are Tesco and Argos, both of whom have added e-retailing to their
existing channels of operations, enabling them to increase their product and customer range.
Some specialist operators, including quite small and local businesses, are doing well e.g.
Asos.com. The movement of Dixons to become an Internet-only operation is another signifier
of the expansion and acceptance of the channel. Indeed many retailers would now describe
themselves as multi-channel. Whilst there seems to be an appetite in the UK for the Internet as
a shopping medium, the true extent to which it will eventually challenge or complement exist-
ing retailing remains open to question.
One of the reasons why the impact of e-retailing is as yet undecided is that there remain issues
about the form and functions that need to be performed and the costs of these. Some began by
developing pure Internet-based operations on the back of existing activities, but with specialist
picking facilities (e.g. Sainsbury). Tesco however chose to add the Internet channel to their
existing store-based operation and to initially focus picking of orders and delivery from local
stores. With the expanded ranges now provided online, they now also use their distribution net-
work for picking and delivery of non-store carried products. These different models may be
suitable in different circumstances, though concern in all cases remains about the mechanistics
of delivery and whether huge volumes of home delivery is actually economically or environ-
mentally desirable (Foresight Retail Logistics Task Force 2000). Sainsbury eventually moved to
a store-based picking operation, but recently Tesco have begun to operate internet-only stores in
urban areas of high internet sales volumes and density.
The Internet is becoming a core factor of shopping and retailing in the UK. Internet retail sales
in the UK according to Mintel (2008) reached 12.7 bn GBP in 2007 and had thereby increased
188 European Retail Research, Vol. 24, Issue I, pp. 173-194
by 33% from 2006. Between 2003 and 2007 the increase of sales was 220% mainly driven by
the above mentioned multi channel strategy e.g. of Tesco and Argos, the growth of Internet-only
retailers, multi-award winning Asos.com e.g. the rising demand for digitalised products, the
increasing number of click and collect type offers and the online sales of other distance retail
businesses like mail order providers (Mintel 2008; see Figure 6).
Burt, S.; Sparks, L.; Teller, Ch. 189
14,000
12,000
Total online retail sales12,700
Other e-commerce8,100
Mail order e-commerce4,600
4,095
Mail order catalogue
1,600
2,370
3,970
5,616
Year forecast
Sa
les
(e
xc
l. V
AT,
GB
Pm
illi
on
)
10,000
8,000
6,000
4,000
2,000
2003 2004 200720062005
0
Figure 6: UK Online Retail Sales
Source: Mintel (2008).
Nevertheless, it should not be forgotten that the increase rate has to be interpreted with respect
to the low online sales level in 2003. Furthermore, the online sales for 2007 are only 5.1% of the
total retail sales (compare also with Table 2). Nonetheless the internet market continues to grow
and evolve into a recognisable channel of retail operations.
4. Outlook
The UK retail market has generally evolved with an emphasis upon service based non-price
competition over the past twenty years. Certain features of the UK market have encouraged - or
at least not hindered - this approach. The major challenge over the past few years has been how
to incorporate a more price sensitive focus within the retail offer, particularly after the onset of
the credit crunch recession. The price issue has come to the fore in a number of ways. The
arrival of discounters (Aldi, Lidl, Netto, Costco and Wal-Mart) in the 1990s drew attention to
pricing and margin strategies of grocery retailers. This compounded the underlying feeling of
price disparities with continental Europe and North America from the experiences of customers
visiting these markets (a perception compounded by the strength of the pound), and a press
campaign based on the “rip off Britain” theme. Whilst Aldi and Lidl have done well in the
recession in the UK, there remains UK suspicion over aspects of pricing and the relationship of
low price to low quality. In food this has been based around both issues of food safety and
scares e.g. BSE, but also increasingly about concerns over environmental welfare. In non-food
however fast fashion and price based retailers such as Primark, New Look, Top Shop etc. have
been hugely successful, with little concern shown by the public over sourcing issues.
Retailers in all sectors have responded, and government statistics show retail price deflation in
most product markets. In the grocery sector a blurring of product lines has occurred as fast
moving (and higher margin) key non-food lines are added to the offer to maintain performance
whilst grocery prices are adjusted. In non-food, sourcing from low cost countries has increased,
and fast fashion principles have been embraced. The challenge however, is that the UK con-
sumer has become accustomed to a retail sector offering quality shopping environments and
high service levels and will expect these to be maintained whilst prices are reduced. This must
be achieved in a system with relatively high cost structures. As always the best retailers will
adjust and prosper, but it is evident that some previously lauded as market leaders eg Marks and
Spencer and Sainsbury have found the transition much more painful.
Retailing in the UK is thus a successful and a significant sector of the economy. It contains
major corporate and co-operative entities. The impact of these large businesses is perhaps the
main concern currently in regulatory terms, as aspects of their power are seen negatively by
some consumer groups, sections of the media and some suppliers. Whilst there is a rising con-
cern to ensure retail diversity, there is as yet no consensus on what this means and how to
achieve it. For some, even the evidence is unclear (Wrigley et al. 2009), whereas for others sup-
posed remedies to local competition are simply recipes for further concentration (Hughes et al.
2009).
An interesting development in recent years however, and symptomatic of the scale and potential
role of retailers, has been the attempt by government to capture their assistance in changing
consumer behaviours. There has been enacted regulation on control of smoking displays, alco-
hol sales and descriptions of product contents e.g. healthy living. Government is seeing large
retailers as potent forces in combating some of the health problems of consumer society. Some
might see this as odd, blaming the retailers for the problems in the first place, but government is
increasingly realising that getting large retailers to work for positive ends could bring big bene-
fits. Retailers are thus seen as a social force.
190 European Retail Research, Vol. 24, Issue I, pp. 173-194
At the other end of the scale spectrum, though linked in a topic sense, there has been a major
revival of local production and sales. Famers’ markets have expanded enormously in number
and local community focused stores and farm shops have added to the range of store choices.
Increasing concern with traceability, sustainability and localisation of food promises to be a
recurring theme in food retailing in the coming years.
References
BCSC (British Concil of Shopping Centres) (2006): Future of Retail Property. ChangingDemographics and Consumer Patterns, London.
BDP Planning and Oxford Institute of Retail Management (1992): The Effects of Major Out ofTown Retail Development: A Literature Review for the Department of the Environment,London.
Burt, S. (2000): The Strategic Role of Retailer Brands in British Grocery Retailing, in: Euro-pean Journal of Marketing, Vol. 34, No. 8, pp. 875-890.
Burt, S.L.; Sparks, L. (2003): Power and Competition in the UK Retail Grocery Market, in:British Journal of Management, Vol. 14, No. 3, pp. 237-254.
Burt, S.L.; Dawson, J.A.; Sparks, L. (2004): The international divestment activities of Europeangrocery retailers, in: European Management Journal, Vol. 22, No. 5, pp. 483-492.
Burt, S.L.; Mellahi, K.; Jackson, T.P.; Sparks, L. (2002): Retail internationalisation and retailfailuer: issues from the case of Marks and Spencer, in: International Review of Retail, Dis-tribution and Consumer Research, Vol. 12, No. 2, pp. 191-219.
Clarke, I. (2000): Retail power, competition and local consumer choice in the UK grocery sec-tor, in: European Journal of Marketing, Vol. 34, No. 8, pp. 975-1002.
Clarke, R.; Davies, S.; Dobson, P.; Waterson, M. (2002): Buyer Power and Competition in Euro-pean Food Retailing, Cheltenham: Edward Elgar.
Competition Commission (2000): Supermarkets: A report on the supply of groceries from mul-tiple stores in the United Kingdom, London: TSO, online: http://www.competition-commis-sion.org.uk/inquiries/completed/2000/index.htm.
Competition Commission (2003): Safeway plc and Asda Group Limited (owned by Wal-MartStores Inc); Wm Morrison Supermarkets plc; J Sainsbury plc; and Tesco plc: A report on themergers in contemplation, London: TSO, online: http://www.competition-commission.org.uk/inquiries/completed/2003/safeway/index.htm.
Competition Commission (2005): Somerfield plc/Wm Morrison Supermarkets plc. A report onthe acquisition by Somerfield plc of 115 stores from Wm Morrison. London: TSO. online:http://www.competition-commission.org.uk/inquiries/ref2005/somerfield/index.htm.
Competition Commission (2006): Groceries Market Investigation: Issues Statement. London: TSO,online: http://www.competition-commission.org.uk/inquiries/ref2006/grocery/index.htm.
Competition Commission (2007a): Groceries Market Investigation: Emerging Thinking London:TSO, online: http://www.competition-commission.org.uk/inquiries/ref2006/grocery/index.htm.
Competition Commission (2007b): Tesco/Co-op store acquisition in Slough. London: TSO,online:http://www.competition-commission.org.uk/inquiries/ref2007/tesco/index.htm.
Burt, S.; Sparks, L.; Teller, Ch. 191
Davies, R.L. (ed.) (1979): Retail Planning in the European Community, Farnborough.
Davies, R.L. (ed.) (1995): Retail Planning Policies in Western Europe, London.
Dawson, J.A.; Sparks, L. (1982): Retailing Developments and Enterprise Zones, in: Interna-tional Journal of Retail and Distribution Management, Vol. 10, No. 1, pp. 43-46.
Dobson, P.; Waterson, M.; Davies, S.W. (2003): The patterns and implications of increasingconcentration, in: European food retailing, Journal of Agricultural Economics, Vol. 54,No. 1, 111-125.
Dobson. P.; Waterson, M. (1999): Retailer power: how regulators should respond to greater con-centration in retailing, in: Economic Policy, Vol. 28, No. 2, pp. 134-156.
Fernie, J. (1998): The breaking of the fourth wave: recent out-of-town retail developmentsin Britain, in: International Review of Retail, Distribution and Consumer Research, Vol. 8,No. 3, No, pp. 303-17.
Guy, C.M. (1998a): Controlling new retail spaces: the impress of planning policies in westernEurope, in: Urban Studies, Vol. 35, No. 5-6, pp. 953-979.
Guy, C.M. (1998b): High street retailing in off-centre retail parks: a review of the effectivenessof land use planning policies, in: Town Planning Review, Vol. 69, No. 3, pp. 291-313.
Guy, C.M. (2002): Is retail planning policy effective? The case of very large store developmentin the UK’, in: Planning Theory and Practice, Vol. 3, No. 3, pp. 319-330.
Guy, C.M. (2007a): Planning for Retail Development, Abingdon.
Guy, C.M. (2010): Development pressure and retail planning: a study of 20-year change inCardiff, UK, in: The International Review of Retail, Distribution and Consumer Research,Vol. 20, No. 1, 119-133.
Guy, C.M.; Bennison, D. (2002): Retail planning policy, superstore development and retailercompetition, in: International Journal of Retail and Distribution Management, Vol. 30,No. 8, pp. 431-434.
Hallier Parker, C.B.H.; Axon, S.B. (1998): The Impact of Large Foodstores on Market Towns andDistrict Centres, Report for the Department of Environment, Transport and the Regions, Lon-don.
Hallsworth, A. (1994): The decentralization of retailing in Britain - the breaking of the thirdwave, in: Professional Geographer, Vol. 46, No. 3, pp. 296-307.
Hughes, R.; Hallsworth, A. G.; Clarke, G. (2009): Testing the effectiveness of the proposed UK‘competition test’, in: Service Industries Journal, Vol. 29, No. 5, pp. 569-590.
Humby, C.; Hunt, H.; Phillips, T. (2003): Scoring Points: how Tesco is winning customer loyal-ty, London.
Marsden, T.; Harrison, M.; Flynn, A. (1998): Creating competitive space: exploring the socialand political maintenance of retail power, in: Environment and Planning A, Vol. 30, No. 3,pp. 481-498.
Mintel (2008): E-Commerce - Europe. Retail Intelligence. London.
Mintel (2009): UK Retail Rankings 2009, London.
Mintel (2010): European Retail Handbook 2009/10, 13th ed., London.
MMC (Monopolies and Mergers Commission) (1981): Discounts to Retailers, London.
192 European Retail Research, Vol. 24, Issue I, pp. 173-194
OFT (Office of Fair Trading) (1985): Competition and Retailing, London.
Pal, J.; Bennison, D.; Clarke, I.; Byrom, J. (2001): Power, policy networks and planning: theinvolvement of major grocery retailers in the formulation of Planning Policy GuidanceNote 6 since 1988, in: International Review of Retail Distribution and Consumer Research,Vol. 11, No. 3, pp. 225-246.
Reynolds, J.; Howard, E.; Dragun, D.; Rosewell, B.; Ormerod, P. (2005): Assessing the Produc-tivity of the UK Retail Sector, in: International Review of Retail, Distribution and ConsumerResearch, Vol. 15, No. 3, pp. 237-280.
Schiller, R. (1986): Retail decentralisation: the coming of the third wave, in: The Planner, Vol.72, No. 7, pp. 13-15.
Seth, A.; Randall, G. (2005): Supermarket Wars, Basingstoke, (Ch.4, Tesco: Chasing Hard).
Smith, A. P.; Sparks, L. (2004): ‘All about Eve?’ in: Journal of Marketing Management, Vol. 20,No. 3-4, pp. 363-385.
Smith, D.; Sparks, L. (2009): Tesco’s supply chain management, in: Fernie, J.; Sparks, L. (eds.):Logistics & Retail Management: Emerging Issues and New Challenges in the Retail SupplyChain, London and Philadelphia, pp. 143-171.
Sparks, L. (1987): Retailing in enterprise zones: the example of Swansea, in: Regional Studies,Vol. 21, No. 1, pp. 37-42.
Sparks, L. (2002): The findings have surprised some shoppers, in: International Journal ofRetail and Distribution Management, Vol. 30, No. 2, 126-133.
Sparks, L. (2005): Editorial - Special Issue: Assessing Retail Productivity, in: InternationalReview of Retail, Distribution and Consumer Research, Vol. 15, No. 3, pp. 227-236.
Sparks, L. (2008a): Retail Regulation, Performance and Supplier Relationships in the UnitedKingdom, in: Colla, E. (ed.): Réglementation et Commerce en Europe: Les effets de laréglementation sur les stratégies et les performances des entreprises, Paris, pp. 31-56.
Sparks, L. (2008b): TESCO: Every Little Helps, in: Usui, K. (ed.): The History of Top Retailersin Europe, Tokyo (published in Japanese), pp. 51-81.
Thomas, C.J. (2006): New ‘high streets’ in the suburbs? The growing competitive impact ofevolving retail parks, in: International Review of Retail Distribution and ConsumerResearch, Vol. 16, No. 1, pp. 43-68.
Wood, S.; Lowe, M.; Wrigley, N. (2006): Life after PPG6: recent food retailer responses toplanning regulation tightening, in: International Review of Retail, Distribution and Con-sumer Research, Vol. 16, No. 1, pp. 23-41.
Wrigley, N. (1991): Is the ‘Golden Age’ of British grocery retailing at a watershed?, in: Envi-ronment and Planning A, Vol. 23, No. 11, pp. 1537-1544.
Wrigley, N. (1992a): Sunk capital, the property crisis, and the restructuring of British foodretailing, in: Environment and Planning A, Vol. 24, No. 11, pp. 1521-1530.
Wrigley, N. (1992b): Antitrust regulation and the restructuring of grocery retailing in Britain,Environment and Planning A, Vol. 24, No. 5, pp. 727-749.
Wrigley, N. (1993): Abuses of Market Power - further reflections on UK food retailing and theregulatory state, in: Environment and Planning A, Vol. 25, pp. 1545-1552.
Wrigley, N. (1994): After the store wars: towards a new era of competition in UK food retail-ing?, in: Journal of Retailing and Consumer Services, Vol. 1, No. 1, pp. 5-20.
Burt, S.; Sparks, L.; Teller, Ch. 193

Wrigley, N. (1998a): Understanding store development programmes in post-property-crisis UKfood retailing, in: Environment and Planning A, Vol. 30, pp. 15-35.
Wrigley, N. (1998b): PPG6 and the contemporary UK food store development dynamic, in:British Food Journal, Vol. 100, No. 3, pp. 154-161.
Wrigley, N.; Branson, J.; Murdock, A., Clarke, A. (2009): Extending the Competition Commis-sion’s findings on entry and exit of small stores in British high streets: implications for com-petition and planning policy, Environment and Planning A, Vol. 41, pp. 2063-2085.
194 European Retail Research, Vol. 24, Issue I, pp. 173-194
The Danish Retail Market: Overview and Highlights
Jesper Aastrup, Mogens Bjerre, Niels Kornum and Herbert Kotzab
AbstractThis paper presents an overview of the Danish retail market. A detailed picture of the Danishgrocery sector is provided, and we highlight issues from the specialty sectors of fashion andDIY as well as patterns of internationalisation among Danish retailers. We further profile theDanish consumer in terms of consumption patterns and demographic changes as well as somespecific consumer tendencies with a special emphasis on sustainability issues. E-commerce istaken up as a special theme, both profiling the consumer side and the retailer side. This part isexemplified with books and groceries. Finally, we present the state-of-the-art of retail logisticsin Denmark and analyse the impact on retailing of law on planning and law on opening hours.
KeywordsDenmark, Retail Structure, E-Commerce, Retail Logistics, Planning
Jesper AastrupDepartment of Marketing, Copenhagen Business School, Frederiksberg, Denmark.
Mogens BjerreDepartment of Marketing, Copenhagen Business School, Frederiksberg, Denmark.
Niels KornumDepartment of Marketing, Copenhagen Business School, Frederiksberg, Denmark.
Herbert Kotzab (corresponding author)Department of Operations Management, Copenhagen Business School, Frederiksberg, Denmark(Tel: ++45 3815 2931; E-mail: [email protected]).
Received: November 27, 2009Revised: February 15, 2010Accepted: February 16, 2010
EUROPEAN
RETAIL
RESEARCHVol. 24, Issue I, 2010, pp. 195-222
1. Introduction
Denmark is the smallest of the Scandinavian countries with a population of approx. 5.5 m
inhabitants. The country is a constitutional monarchy with a parliamentary system of govern-
ment and a market capitalist economy linked with a large welfare system, guaranteeing one of
the world’s most equally distributed income levels amongst the population.
The country is not well known for the outstanding contributions of Danish companies which
hold leading positions in their relevant industries. Denmark is the home of the largest container
shipping company in the World, A.P. Møller Mærsk; the largest insulin producer of the world,
Novo Nordisk; the largest windmill manufacturer, Vestas; and of probably the most well
known toy manufacturer, Lego. Amongst the largest manufacturers of food and beverages are
Carlsberg Breweries; the Swedish co-owned dairy company, Arla Foods Amba; and the meat
producer, Danish Crown Amba.
In this paper we will provide insights into Danish retailing as we present a profile of:
- The Danish retail sector in section 2, where we present a detailed picture of the Danish gro-
cery market with its major store formats and players, highlight some successful textile and
DIY-retailing companies, and present the internationalization paths taken by Danish retailing
companies.
- The Danish consumer in section 3, where we show the socio-demographic development of
the Danish society, specific consumer trends that drive the retail development, and discuss the
affinity of Danes towards sustainability.
- Danish e-commerce in section 4, with statistics on online purchase categories and tendencies
as well as a more in-depth elaboration on the impact of online business in book and grocery
sectors.
- A look behind the scenes of retail logistics in Denmark in section 5, which includes a presen-
tation of the state-of-the-art logistic systems that have changed the way logistics is performed
in the sector.
- Planning and regulations in section 6, with an emphasis on opening hours and urban planning
issues.
2. A Profile of the Danish Retail Sector
The total retail turnover in Denmark (2007) is worth 280 bn DKK (Statistics Denmark 2009a,
2009b). Danish food retailers hold about 36.6% of the Danish retail turnover. Grocery retailers
and kiosks cover 32.9%. Only 3.7% are specialty food retailers, and here the bakery sector
196 European Retail Research, Vol. 24, Issue I, pp. 195-222
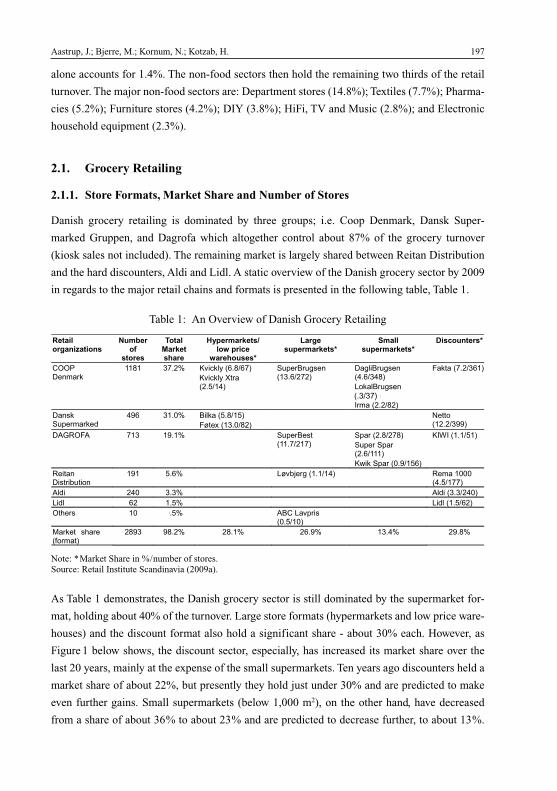
alone accounts for 1.4%. The non-food sectors then hold the remaining two thirds of the retail
turnover. The major non-food sectors are: Department stores (14.8%); Textiles (7.7%); Pharma-
cies (5.2%); Furniture stores (4.2%); DIY (3.8%); HiFi, TV and Music (2.8%); and Electronic
household equipment (2.3%).
2.1. Grocery Retailing
2.1.1. Store Formats, Market Share and Number of Stores
Danish grocery retailing is dominated by three groups; i.e. Coop Denmark, Dansk Super-
marked Gruppen, and Dagrofa which altogether control about 87% of the grocery turnover
(kiosk sales not included). The remaining market is largely shared between Reitan Distribution
and the hard discounters, Aldi and Lidl. A static overview of the Danish grocery sector by 2009
in regards to the major retail chains and formats is presented in the following table, Table 1.
Aastrup, J.; Bjerre, M.; Kornum, N.; Kotzab, H. 197
����������������
�������
���
���������� ���
��������� ����� �����
������ � �
���� �������� �
����� �������� �
!� ������ �
���������
�� � ����� ����������� ����
�������������� ��!�
"#$�%#&'������������
�&��%#&'����!����! �
()��%#&'���*������
+������� ��
,�� ���������
��'�"#$����-
!.� ���*� %����� � �� �
,/��0 ����*� ��
1���)��������..�
�234�,2 ��� �.��� "#$�%�'�����������
"$���� ��� �
"#$� "$���������
�5�� "$��*�.�� ��
�+6+������ ��
4�������'��7#��)�
�.� ��� (/�78�&�������!� 4����***�!� �����
2�-� �!* ���� 2�-��������!*�
(�-� �� �� � (�-� ��� ����
��9�' �* *� � 2%��(�$�'�*� ��*�
:��t '9��;)���
� .� . ��� � ��� ���.� ���!� �.� �
Table 1: An Overview of Danish Grocery Retailing
Note: *Market Share in %/number of stores.Source: Retail Institute Scandinavia (2009a).
As Table 1 demonstrates, the Danish grocery sector is still dominated by the supermarket for-
mat, holding about 40% of the turnover. Large store formats (hypermarkets and low price ware-
houses) and the discount format also hold a significant share - about 30% each. However, as
Figure 1 below shows, the discount sector, especially, has increased its market share over the
last 20 years, mainly at the expense of the small supermarkets. Ten years ago discounters held a
market share of about 22%, but presently they hold just under 30% and are predicted to make
even further gains. Small supermarkets (below 1,000 m2), on the other hand, have decreased
from a share of about 36% to about 23% and are predicted to decrease further, to about 13%.
(.3/37)
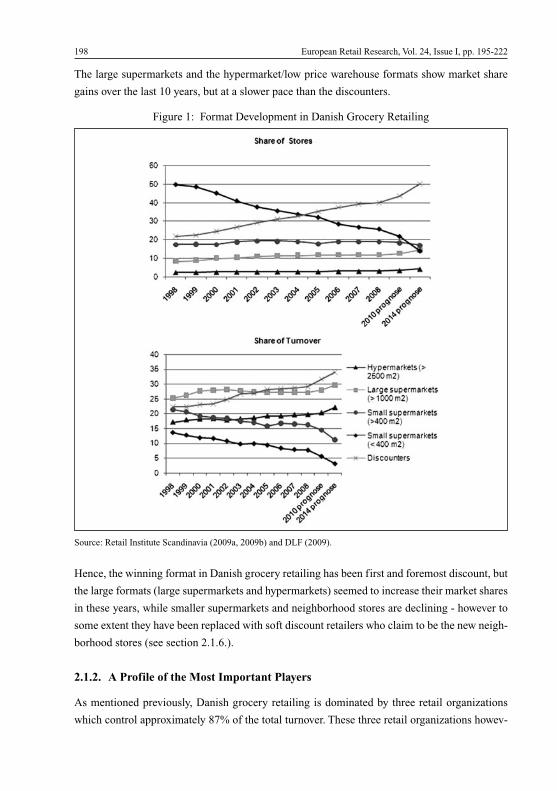
The large supermarkets and the hypermarket/low price warehouse formats show market share
gains over the last 10 years, but at a slower pace than the discounters.
198 European Retail Research, Vol. 24, Issue I, pp. 195-222
Figure 1: Format Development in Danish Grocery Retailing
Source: Retail Institute Scandinavia (2009a, 2009b) and DLF (2009).
Hence, the winning format in Danish grocery retailing has been first and foremost discount, but
the large formats (large supermarkets and hypermarkets) seemed to increase their market shares
in these years, while smaller supermarkets and neighborhood stores are declining - however to
some extent they have been replaced with soft discount retailers who claim to be the new neigh-
borhood stores (see section 2.1.6.).
2.1.2. A Profile of the Most Important Players
As mentioned previously, Danish grocery retailing is dominated by three retail organizations
which control approximately 87% of the total turnover. These three retail organizations howev-
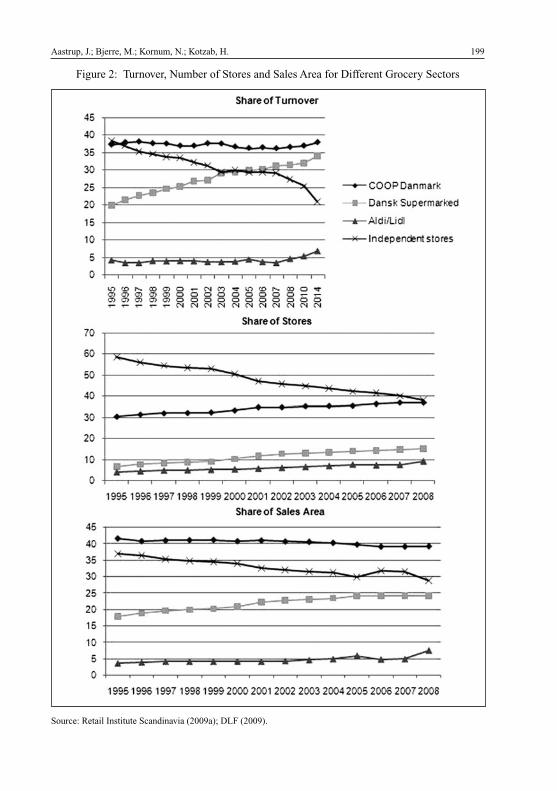
Aastrup, J.; Bjerre, M.; Kornum, N.; Kotzab, H. 199
Figure 2: Turnover, Number of Stores and Sales Area for Different Grocery Sectors
Source: Retail Institute Scandinavia (2009a); DLF (2009).
er represent different ownership structures, where COOP ultimately owned by the members/
shoppers through local coops; Dansk Supermarked, a centrally owned and controlled system;
and the independent sector struggling with the historical influence of their store owners, evolv-
ing nonetheless towards more centrally controlled systems. The development between the major
retail organizations since 1995 in terms of turnover, number of stores, and sales area - all rela-
tive to market totals is presented in Figure 2.
The figure shows an increasing market share of Dansk Supermarked from 20% in 1995 to
31.4% in 2008 (mainly accountable to the expansion of the Netto chain). This has mainly hap-
pened at the expense of the independent sector (now concentrated under Dagrofa and Reitan
distribution) that have gone from almost 40% market share in 1995 to 27.4% in 2008 with pro-
jected further loss in market share (DLF 2009). COOP Denmark has retained their dominating
market share at about 36-38%.
Looking at the share of stores and the share of sales area, we can see an overweight in the rela-
tively small formats especially in the independent sector (38.2% of the stores accounting for
only 28.9% of the sales area); COOP has 37.1% of the stores, accounting for 39.1% of the sales
area; On the contrary Dansk Supermarked are dominated by large formats having only 15.4%
of the stores, accounting for 24.2% of the sales area. Looking at sales area compared to market
share says something about sales efficiency. Here Dansk Supermarked ‘leads’ by obtaining
31.4% market share from their 24.2% of the sales area. The independent sector and COOP are
slightly below their ‘fair share’ (COOP having 39.3% of the sales area and 36.6% of turnover,
and the independent sector having 28.9% of the sales area and 27.4% of turnover). It is notica-
ble that Aldi/Lidl despite the significant growth in shares of both number of stores (from 4.2%
in 1995 to 9.2% in 2008) and sales area (from 3.6% in 1995 to 7.6% in 2008) has not been able
to increase market share at a similar pace (from 4.3% in 1995 to just 4.7% in 2008).
2.1.3. Coop Danmark
The largest grocery retail group is Coop Danmark. It was founded in the late 19th century as
‘Fællesforeningen for Danmarks Brugsforeninger’ (FDB) as a cooperative between the local
coops established over the previous 30 years with the aim of getting better and cheaper gro-
ceries to the poorer social classes. This was based on joint purchasing as well as its own produc-
tion of groceries (e.g. coffee and confectionary) to be sold to the local coops owning and run-
ning the stores.
Throughout the 20th century FDB grew. Becoming one of the country’s largest firms, the
Brugsen stores dominated grocery retailing. From the 1960s FDB started to develop from a
wholesaler and producer into a retailer first by starting up the Kvickly chain in 1961, then
merging with Hovedstadens Brugsforening (HB) in 1971, then buying the Irma chain in 1982
200 European Retail Research, Vol. 24, Issue I, pp. 195-222
and the Fakta chain in 1987. The original Brugsen brand was split into larger supermarkets
(SuperBrugsen) and smaller supermarkets (DagliBrugsen and LokalBrugsen) in the early
1990s.
In the late 1980s the factories were sold off rounding out the transition from a wholesaler/pro-
ducer into a retailer. In the early years of the new millennium the coops of Denmark, Sweden
and Norway formed Coop Norden (with FDB owning 38%) in order to create a large Nordic
retail firm. However, in 2008 this Nordic cooperation was reduced with purchase consolidation
through Coop Trading, whereas the retail business of Coop Denmark became again fully owned
by FDB.
Today, Coop Denmark dominates with chains in all parts of the grocery retail sector: in the
hypermarket segment with Kvickly and Kvickly Xtra; in the large supermarket segment with
market share leader SuperBrugsen; with the market share leader in smaller supermarkets
(DagliBrugsen); Irma in the upscale/high quality supermarket sector; and with Fakta, the sec-
ond largest discounter in the market. Coop Denmark had problems with profitability for a long
period of time but in recent years has developed itself into profitability and surplus.
2.1.4. Dansk Supermarked
Closely following in market share in the Danish grocery industry is Dansk Supermarked. The
origin of Dansk Supermarked dates back to 1906 with the opening of Ferdinand Salling’s first
store. But it was from the initiatives of Herman Salling, his son, that in the 50’s and 60’s Dansk
Supermarket developed into its present form. In the late 50’s Herman Salling, based on his
international traveling experiences, developed his vision of centrally controlled chains of stores
selling foods and non-food. A year later in 1960 Jysk Supermarked was formed and the Føtex
(high quality hypermarket) chain was established.
In 1964 Herman Salling partnered with the A.P. Møller firm, took over 50% of the shares and
changed the name to Dansk Supermarked. The first Bilka stores (the name is short for the Ger-
man word Billiges Kaufhaus) were opened in 1970 as low price warehouses, and in 1981 the
first Netto discount store opened in Copenhagen as a response to Aldi’s penetration of the Dan-
ish market. The Netto chain has since been expanding fast - to about 400 stores in Denmark.
Netto is also the only exported Danish grocery retail concept with about 620 stores in Germany,
England, Poland and Sweden. Its first stores abroad opened in 1990.
Today Dansk Supermarket is two thirds owned by A.P. Møller-Mærsk A/S. It, F. Salling A/S,
and the three main grocery chains Bilka, Føtex and Netto dominate the warehouse/hypermarket
as well as the discount sector but are not present in the supermarket sectors. Dansk Supermar-
ket has shown over the years to be the most profitable of the major grocery retail players in
Aastrup, J.; Bjerre, M.; Kornum, N.; Kotzab, H. 201
Denmark with a 1.8 bn EUR result in 2008 (about four times larger than the COOPs). Yet it is
worth noticing the historical differences between the two firms. Coop (previously FDB) was
established to serve the rural areas with affordable high value products and therefore estab-
lished shops in nearly every village, whereas Dansk Supermarked has focused on hypermarkets
and discount stores primarily located in larger city areas. This makes for their widely different
logistics costs and explains some of the profitability differences.
2.1.5. Dagrofa and the Independent Sector
The independent sectors have played a very important role in Denmark. The history of the
independent sector is largely one of continuous concentration in wholesale and retail chains.
15 years ago several wholesalers existed serving independent stores within different areas and
categories of groceries. These wholesalers have merged and a few years ago only Supergros
(Dagrofa) and Edeka (now Reitan Distribution) had any significance as wholesalers for
independent stores. Dagrofa was established in 1983 in a merger between Dagros A/S and
Brdr. Justesen A/S - both firms dating back almost 250 years. Dagrofa has since made several
acquisitions in order to consolidate the independent sectors and increase buying power and effi-
ciency.
Similarly when it comes to retail chains, development has decreased the number of chains.
SuperBest (the dominating independent chain today) was established in 1997 and has continu-
ously merged with and included preexisting chains, e.g. the Prima and Favør chains, and more
recently the ISO and Dreisler chains.
The Edeka group has functioned as a wholesaler for a number of small independent chains.
Since 2003, Reitan has been a part owner of Edeka and has put an emphasis on the discount
chain Rema 1000 and the kiosk sector (7-eleven, YX energy, Q8). Quite recently the Reitan
ownership was increased to 85%, the name was changed to Reitan Distribution and the smaller
chains of independent stores (e.g. AktivSuper and Merko) have been closed. Most of these
stores have been included in the Dagrofa chains.
Hence, the sector merges into fewer units both regarding wholesale and retail chains. Even
within the independent sector there is a tendency towards becoming more centrally controlled
and managed. The chains of independent stores are becoming more and more centrally man-
aged as well as relying more and more on own stores or franchise-like setups (e.g. Rema 1000
and Kiwi). Hence what we experience is a deterioration of the independent sectors, both in its
loss of market share as well as the fact that the independent sector itself develops towards ‘less
independence’. In 1995, the independent sector accounted for almost 60% of the stores and
almost 40% of the turnover. The sector has however heavily lost its significance in the Danish
retail sectors with an estimated 21% market share in 2014 (DLF 2009).
202 European Retail Research, Vol. 24, Issue I, pp. 195-222
2.1.6. The Danish Discount Sector - the Dominance of Soft Discount
With a projected 50% share of stores and 34% market share, the discount sector in Denmark is
quite competitive. A characteristic of the Danish discount sector is the dominance of so-called
‘soft’ discount.
Aldi was established in Denmark in the late 1970s, followed by Netto in 1981. In 1987 Fakta
was included in Coop; Rema 1000 started up in 1994; Only recently in 2005 Lidl opened in
Denmark and last year (2008) KIWI started up. Hence all retail organizations now have their
own version of a discount chain. The hard discounters, Aldi and Lidl, control about 16% of the
discount turnover, whereas the soft discounters, Netto, Fakta, Rema 1000 and KIWI control
84% of the discount turnover. Netto is the absolute market leader with about 41% of the dis-
count turnover.
The critical success factors of Danish soft discounters have been:
- Becoming the shopper’s local choice. Danish discount stores are relatively small (about
500 m2) and often function as neighborhood stores. Lidl is the exception with an average size
of 1,000 m2 and has locations relating to main commuting corridors.
- Wide discount assortments with well known brands and popular weekly promotional papers.
The soft discounters carry a wide range of well known brands (less emphasis on private labels
compared to Lidl and Aldi); They have as discounters relatively wide assortments (up to 3,000
SKUs in the case of Rema1000 and Kiwi); and they produce popular weekly promotional
papers.
- Perceived wide range and good quality of fresh food. One of the consumer-perceived ‘risks’
of discount is fresh food quality. The soft discounters have successfully worked with their
fresh food categories (e.g. meat, poultry and fruit and vegetables). Kiwi for example launched
a fruit and vegetables freshness guarantee, and generally soft discount has managed to close
the perceived gap in these categories compared to supermarkets.
- Softer discounters have successfully managed to include organic products in their assort-
ments.
- Danish discounters have successfully included non-fixed spot items in their assortments. This
however does not differentiate the soft and hard discounters.
2.2. Specialty Retailing - Textiles and DIY
Specialty retailing, i.e. not fast moving consumer goods (FMCG) retailing, constitutes approxi-
mately 50% of the total turnover in the Danish retail sector. The total overview over sectors and
numbers of stores are shown below in Figure 3.
Aastrup, J.; Bjerre, M.; Kornum, N.; Kotzab, H. 203
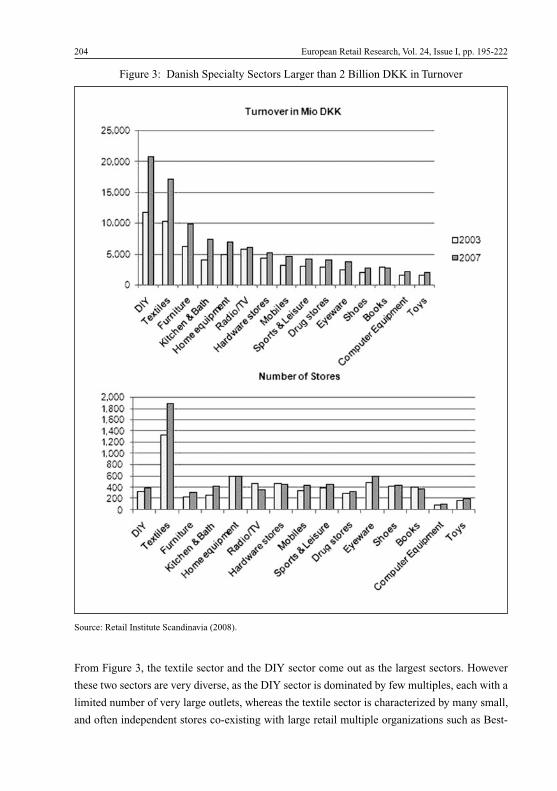
From Figure 3, the textile sector and the DIY sector come out as the largest sectors. However
these two sectors are very diverse, as the DIY sector is dominated by few multiples, each with a
limited number of very large outlets, whereas the textile sector is characterized by many small,
and often independent stores co-existing with large retail multiple organizations such as Best-
204 European Retail Research, Vol. 24, Issue I, pp. 195-222
Figure 3: Danish Specialty Sectors Larger than 2 Billion DKK in Turnover
Source: Retail Institute Scandinavia (2008).

Seller. Furthermore the DIY sector only shows limited growth in the number of stores, whereas
the textile sector has been quite affluent over the past few years.
The DIY sector in Denmark is traditionally dominated by national players where most of them
are voluntary chains. The sector has witnessed a sharp decrease in the number of trademarks on
retailer facades, reflecting several mergers and acquisitions over the past five years. This result-
ed in a concentration with a few dominant players such as STARK (formerly Dansk Trælast),
focusing on the professional customer (and now operating in Scandinavia as well); XL Byg
(a merger between Dendek and Ditas); and finally Silvan, primarily focusing on the private
consumer. Discount also plays a role in this retail sector, e.g. Jem & Fix and Harald Nyborg.
Although these stores are quite small compared to Bauhaus, the influx of Bauhaus has increased
competition and provided an international dimension.
The Danish textile retail sector is much more varied, with the highest number of chains in any
retail sector. But even largest actor in the Danish textile sector, Bestseller (operating several
retail brands: Vero Moda, Jack & Jones, VILA, ONLY, SELECTED FEMME/HOMME, Pieces
accessories, Object Collectors Item, mama•licious, and OUTFITTERS NATION) does not
match the turnover (in Denmark) of textiles by the hypermarket chain Bilka. This sector is by
far the most active in terms of exporting retail concepts, however. These concepts are the results
of vertical integration, as they typically have been developed by manufacturers such as IC Com-
pany, Bison, Cha Cha, REDGREEN, etc.
Multiples, especially voluntary multiples, have been a unique way of combining the independ-
ent small retailer with the benefits of the large, integrated retail operation. Voluntary multiples
come in various forms, and can be described in the following steps (Bjerre 1990):
- The purchasing multiple
- The marketing multiple
- The integrated multiple
Over the past few years we have seen a development in which different business formats were
mixed - even within the individual retail organization - combining voluntary multiples with
franchise based operations and even fully-owned. For example the furniture chain Idémøbler,
has expanded with a franchise based model abroad. Even in the FMCG sector this is a way for
COOP to handle the mix between fully owned stores (labeled B stores) and the voluntary parts
(called A stores). It is obvious that this combination offers experience and insights into multiple
management formats, and so far, the Danish experience is that they “cross-fertilize” each other,
and in the future all management formats will be able to incorporate best practice from the
other formats.
Aastrup, J.; Bjerre, M.; Kornum, N.; Kotzab, H. 205
In 2007 and 2008 we witnessed voluntary multiples being sold and converted to fully owned
retail operations. One of the most noticeable examples of this was the acquisition of Matas (a
national chain of personal care products) and Imerco (a national chain of tabletop hardware
merchandise). Matas dominates its sector with a market share of approximately 90%, and
Imerco had a market share of approximately 40%. In both cases most of the - former store
owners - were offered 3 year contracts as store managers to ensure continuity and retail man-
agement competence.
2.3. Danish Retailers and Internationalization - Some Highlights
Looking at grocery retailing, we can identify Netto as a Danish ‘export article’. From 1990 Net-
to has opened a total of 620 stores in Sweden, Germany, Poland and UK. However, it has been
necessary to adjust the Netto concept to the local markets. Further, COOP Denmark entered
into a Nordic alliance with COOP Norway and COOP Sweden, primarily focusing on purchas-
206 European Retail Research, Vol. 24, Issue I, pp. 195-222
2003 2004 2005 2006 2007
Bestseller 1,500 1,750 1,750 1,800 1,800
Jysk 689 900 1,100 1,110 1,290
Bang & Olufsen 599 600 702 700 700
Netto 419 501 547 623 652
Ecco Sko 335 353 457 551 637
IC Companys 269 182 189 221 221
BoConcept 122 138 149 160 218
B-Young 194 181 181 207 207
Flügger 167 176 176 176 176
Synoptik 191 223 134 156 156
BR Legetøj 49 66 85 97 134
SKORINGEN 79 106 116 127 132
Bianco Danmark 57 80 84 84 122
Flexa Møbler 55 54 70 94 110
Kvik A/S 21 24 40 40 73
Noa Noa 18 62 86 72 61
Wagner 10 27 58 59 59
Blen+BlendShe 60 62 75 80 54
Change 0 0 0 47 47
Hi-Fi Klubben 27 27 35 35 41
Table 2: Top 20 Danish International Retailers by Number of Foreign Stores
Source: Retail Institute Scandinavia (2008).
ing and private label development. This alliance was cancelled in 2007, and the three countries
are now cooperating in a number of areas, but are no longer a joint entity.
Within specialty retailing and especially textiles, the use of franchising, primarily trademark
franchising, has been the main vehicle for exporting the concepts. There are few very success-
ful concepts like those of Bestseller and Bianco Shoes.
Table 2 gives a snapshot of the foreign franchise operations of Danish retailing companies.
The total foreign franchise network includes 1,772 units and a total turnover of 2.3 bn. Hence,
so far Danish retailer’s internationalization seems to be lacking an export strategy and the
choice of countries seems to be randomly driven.
On the other side, retail store formats have been successfully imported in FMCG (7-Eleven,
Aldi, Lidl, Rema 1000), in textiles (H&M) and furniture (IKEA, Natuzzi). Aldi, Lidl and Rema
1000 have all stated that being competitive in the Danish market would mean that they could
compete in any market. The background for this statement seems to be an acknowledgement of
the low average net profit in the Danish FMCG sector. However, there were also a number of
failures as well (Lindex, Guldfynd, Decathlon). It seems to be quite difficult to explain why
some of the retail operations were successful and others were not, but it is remarkable that suc-
cess in one’s home country is not a sufficient precondition.
3. A Profile of the Danish Consumer
3.1. Changing Consumption Patterns and Demographics
When it comes to consumption patterns there is an overall tendency for household consumption
to change in relative terms from food, beverages and tobacco towards household expenses (due
to, among other things, the increasing prices of property and energy). Figure 4 shows how the
consumption expenditures of Danish households have developed since 2000.
For retailing it seems important that the expenditures for food are still increasing (despite a
slight fall in relative share of consumption). Also, clothing and footwear as well as home equip-
ment, furniture and household services show an increase in consumption value (despite a slight
decrease in relative share). The expenditures for leisure, entertainment and traveling are
increasing in both value and relative share as does the category ‘other goods and services’ that
covers mainly restaurants, cantinas, hotels and camping, and insurances.
Despite the changes in consumer patters, we can also observe changes in the demographic
structure of Denmark. Since the 1990s, the Danish population is experiencing changes in its
Aastrup, J.; Bjerre, M.; Kornum, N.; Kotzab, H. 207
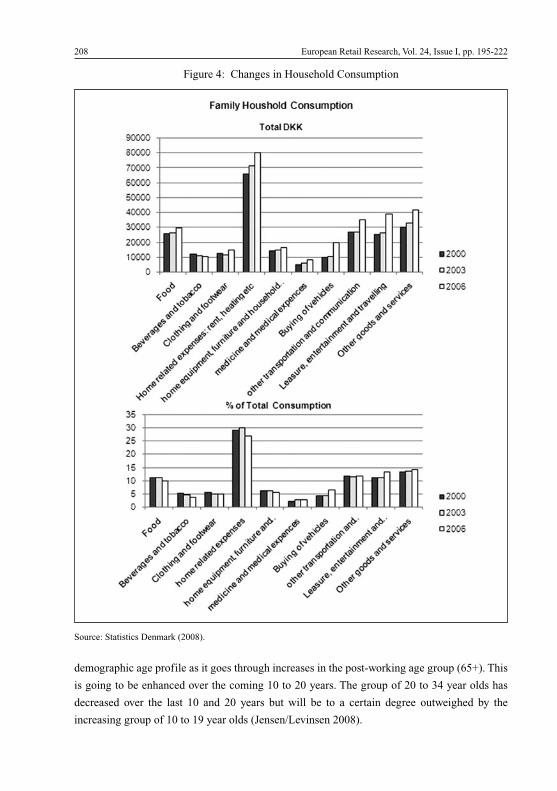
demographic age profile as it goes through increases in the post-working age group (65+). This
is going to be enhanced over the coming 10 to 20 years. The group of 20 to 34 year olds has
decreased over the last 10 and 20 years but will be to a certain degree outweighed by the
increasing group of 10 to 19 year olds (Jensen/Levinsen 2008).
208 European Retail Research, Vol. 24, Issue I, pp. 195-222
Figure 4: Changes in Household Consumption
Source: Statistics Denmark (2008).
3.2. Specific Consumer Tendencies that Drive the Danish Retail Development
3.2.1. Convenience as a Value Creator
Consumers and shoppers feel increasingly pressured about time. Many consumers, especially
families with children, experience the daily functional shopping as a stress factor. A general
tendency towards longer working hours as well as increasingly important ideals about value and
for quality leisure and family time makes convenience an important value creator in this type of
non-hedonic shopping. Thus, convenience is an important driver in Danish retail sectors, espe-
cially those dealing with non-hedonic shopping. Convenience is also the driver for e-commerce,
as evidenced by the dominant arguments of consumers for shopping online related to the con-
venience motive - i.e. time savings, no closing hours and home delivery (Konkurrencestyrelsen
2006). However, we have not (yet) in Denmark seen a significant increase in and development
of grocery e-commerce, despite this business opportunity’s potential as a convenience creator
for grocery consumers. This is largely ascribed to the fact that the major grocery providers have
not yet developed home delivery systems (cf. section 4).
Physical stores and concepts also develop due to issues of convenience. In Danish grocery
retailing we see several up and coming convenience formats, especially in urban areas. The dis-
counters Fakta and Netto both have developed smaller formats, FaktaQuick and DøgnNetto
(‘24hourNetto’). Irma developed their smaller IrmaCity format based quick quality meal solu-
tions as their designated category. This was based on the insight that many urban consumers in
the late afternoon do not know what to prepare for dinner, but they still value a quality meal.
Recently, a new soft discount format, KIWIminipris opened. Among other things it is posi-
tioned on being open late (until 10pm in the evening which is unusual in Denmark). Hence,
opening hours and meal solutions are parameters that drive new as well as existing grocery con-
cepts in Denmark.
3.2.2. Value Emphasis - Saving and Splurge
Aside from the worldwide financial crisis that presently restrains the economy, there is the
longer-term trend of a steady increase in consumption. Over the last 30 years, private consump-
tion has increased in Denmark by an average of 2.6% per year (Jensen/Levinsen 2008). With
this larger consumption comes the tendency of dichotomizing consumption into discount and
luxury, also termed ‘saving and splurge’ (Jensen/Levinsen 2008; IBM 2004).
On the one side there are commodity purchases, i.e. purchase categories where consumers per-
ceive a high standardization, few differences between products and chains, and where they
experience a high degree of transparency regarding prices. Here it is very difficult for retail
strategies to differentiate their offerings or services and legitimize a price premium. Quality is
perceived as homogenous and relatively high, and shoppers go for value (i.e. functional quality)
Aastrup, J.; Bjerre, M.; Kornum, N.; Kotzab, H. 209
and low price. This has affected sectors such as consumer electronics and groceries. The Danish
success of (soft) discount in groceries, described in section 2, is largely ascribed to this phe-
nomenon.
On the other hand there is a tendency to buy more hedonic and self-expressive items, i.e. luxu-
ry items, unique products, experiences and products to spoil oneself, and a consumer willing-
ness to pay price premiums and spend a larger part of the budget. The term ‘experience and
desire economy’ describes this. These issues of ‘splurge’ take several forms, e.g.:
- Experience products: Pine and Gilmore (1998) coined the term ‘experience economy’, stat-
ing that future consumption and value propositions are about staging and selling memorable
events. We can see that from the consumption statistics (see Figure 4) in the increased share
of consumption going towards leisure and travel as well as related areas such as restaurants,
hotels and camping. Many providers of experiences appear on the Internet, as well as in
physical stores where general merchandisers and lifestyle related stores take experience cat-
egories into their assortments - wine tasting, weekends of wellness, etc.
- Storytelling and unique products: Another way out of ‘commodity hell’ is by offering unique
versions of products or attaching storytelling to products. A few years ago, Danish Supermar-
ket Group launched a private label called Princip which emphasized high end quality and ori-
gin over a range of daily food products such as sausage, cheese, salt, seafood, chips, pizza and
chocolate. All emphasized the origin of the basic input in an attempt to add high end quality
and uniqueness to everyday products.
- Luxury brands: Luxury brands, luxury products and exclusivity in general have experienced
growth. Brands such as Burberry have grown more than the clothing market in general. These
premium products are expected to decline during the financial crisis; however, after this, the
demand is expected to be even higher (Bahr 2008).
Hence, this saving and splurge dichotomy affects retail sectors on the one hand by providing a
success criterion for retail strategies aiming to provide value for money in perceived commodi-
ty categories, e.g. discount. On the other hand this dichotomy also provides a rationale for retail
strategies emphasizing luxury, leisure, wellness and unique products; i.e. more hedonic and
self-expressive needs.
3.2.3. Danish Consumers and Sustainability Issues
In the Danish retailing sector greening and sustainability were already initiated by the Coop
movement as early as the beginning of the 20th century, securing healthy and affordable food
products for the average citizen, especially worker families and small farmers in the country-
side. More recently, specifically in the beginning of the 1990s, Coop Denmark (then called
210 European Retail Research, Vol. 24, Issue I, pp. 195-222
FDB, the Association of Danish Cooperative Outlets) initiated a development that now gives
Denmark the highest per capita sales of organic food in the world. Also in recent years ethical-
ly or Fair Trade product sales have increased rapidly. CO2 emission concerns are also beginning
to get a foothold. Recently, Coop has introduced a plan called ‘1-4-40’ with a stronger focus on
the environment, ecology, health, climate and ethical trade. This development can be seen as a
symptomatic return to the values on which the firm was founded - yet unfolded in a contempo-
rary context.
From the consumer perspective the introduction of organic and fair traded products in the broad-
er grocery retailing context have given a far better and broader assortment from which to choose,
yet the often-contradictory demands between different aspects of sustainability have, at the same
time, significantly increased the complexity of the consumers’ decision-making process.
One remarkable development is the rapid growth of organic food sales in Denmark [1]. Before
the beginning of the 1990s organic products were sold primarily via direct sales from producers
or via weekly marketplaces, but had barely any impact on national grocery sales statistics. This
changed when Coop Denmark kick-started the development in 1993 by lowering prices on
organic milk and later for other produce like carrots and potatoes. This gave rapidly increasing
sales and spread throughout the entire sector during rest of the 1990s. The first years after 2000
saw stagnating sales due to an international downturn but grew afterwards, increasing 65%
from 2005 to 2007.
In the year 2007, 1,500 new organic items were introduced resulting in a total assortment of
4,400 items. Danish Retailing has thereby obtained the world largest organic share growing
from 4.6 % of total food sales in 2006, to 5.5 % in 2007, and finally to 6% in 2008 (9% if meas-
ured only in categories where organic alternatives are available). In many grocery categories it
is widespread to have organic or green alternatives, e.g. around 20% of milk sales is organic.
Danish grocery chains often use organic products and themes in their promotions. Most heavi-
ly profiled for its organic and green products is the COOP-owned grocery chain of Irma (see
section 3). Thus, in 2006 18% of Irma’s food sales were organic: 85% of milk sales, 71% of its
eggs and 29% of its fruit & vegetables. By 2009 Irma had 1,000 organic items in their assort-
ment: 67% of its breakfast cereals and 50% of rice, flour, butter and pasta sales were organic.
More or less all Danish grocery chains (see section 3) apply the theme in assortment and week-
ly promotions, generating growth in organic sales also for these retailer chains. For instance
COOP’s Super Brugsen chain gained 35% in 2007; the Spar Group chains, Super Spar (33%)
and Spar (29%) also in 2007. Even smaller specialty retailers selling only organic foods have
emerged, e.g. Aarstiderne.com and Egefeld founded in 2006 (the only purely organic grocery
shop), however by 2009 consisting of only two shops. Lastly, it is worth mentioning that the
Coop group has launched a very popular green and organic private label (Änglamark). Hence,
Aastrup, J.; Bjerre, M.; Kornum, N.; Kotzab, H. 211
organic and green products are profiled in certain chains, but in most it is more or less a market
condition to use the theme in category assortment and weekly promotions.
A more recent trend is the mainstreaming of fair traded product in the sense that, like organic
products, fair trade was primarily sold via alternative channels and shops in its early days and
therefore had an extremely low share of national sales. By 2006 the global sales of fair traded
products were 1.6 bn. The growth from 2005-2006 was 41%, but this growth differed by prod-
uct: cocoa (93%), coffee (53%), tea (41%) and bananas (31%). In Denmark in 2006 there was a
50% increase in sales and every Dane spent 20 DKK out of 14,000 DKK on fair traded food,
which amounts to .14% out of 95 bn DKK in grocery sales. Fair trade is therefore estimated to
represent 18 m, averaging 1.1% of global fair trade sales. In 2009 every Dane spent 69 DKK on
fair traded products representing a 245% increase in sales in this period and is the third highest
per capita in spending globally. In the same period the Danish fair trade assortment has
increased from 200 to 400 items, and the price of fair traded products is around 25% higher
than comparable products.
Despite the global recession Danish fair trade sales have continued to grow 12% in the first half
of 2009. In the same year 76% of Danes knew the Fair Trade label, compared to 2007 where
only 58% knew the label. All retail formats seem to have had increases in sales. In 2007 Coop
had a 30% increase in medium sized towns compared to only 20% in the largest towns. Dansk
Supermarked (i.e. Føtex) the same year had a 50% increase in fair trade coffee and a 20%
increase in sales of the rest of the fair trade assortment, which represented the highest growth
rates of their entire assortment.
4. Denmark - a Country of E-Consumers?
Denmark has a high penetration of Internet access in private households, having increased
between 2001 and 2009 from 54% to 86%. In 2008, 93% of households also have a mobile
phone, out of which 43% use some form of mobile Internet access (Statistics Denmark 2008).
90% of the households’ Internet access is via broadband. That makes Denmark, together with
the Netherlands, the country with the highest level of broadband access in the EU (Statistics
Denmark 2008). Thus, retailers operating in Denmark should have good opportunities to reach
their customers online.
In 2008, the number of persons who had bought goods via the Internet within the last three
month was 47% - right after the UK (49%), and nearly double as much as the EU average (25%)
(Statistics Denmark 2008). When asked in 2009, 64% of the Danish population aged between
16 and 74 have bought goods via the Internet during the last year, primarily theatre tickets or
airplane tickets or holiday bookings (see Table 3).
212 European Retail Research, Vol. 24, Issue I, pp. 195-222
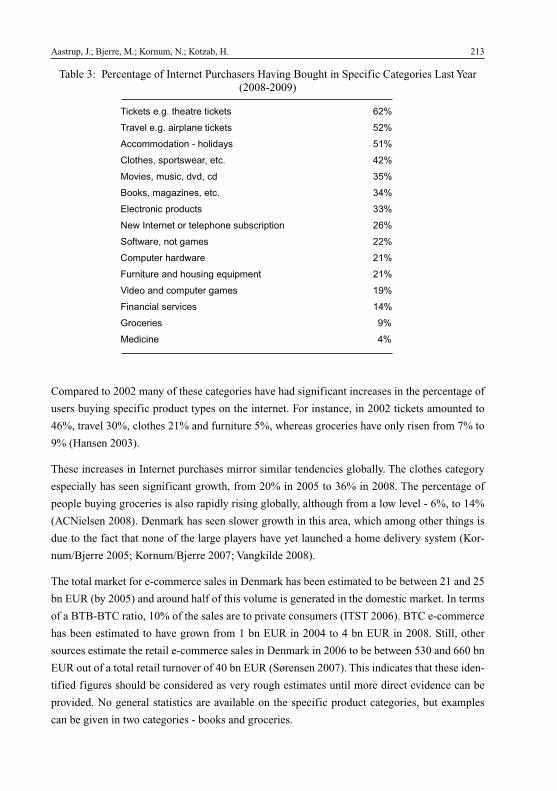
Compared to 2002 many of these categories have had significant increases in the percentage of
users buying specific product types on the internet. For instance, in 2002 tickets amounted to
46%, travel 30%, clothes 21% and furniture 5%, whereas groceries have only risen from 7% to
9% (Hansen 2003).
These increases in Internet purchases mirror similar tendencies globally. The clothes category
especially has seen significant growth, from 20% in 2005 to 36% in 2008. The percentage of
people buying groceries is also rapidly rising globally, although from a low level - 6%, to 14%
(ACNielsen 2008). Denmark has seen slower growth in this area, which among other things is
due to the fact that none of the large players have yet launched a home delivery system (Kor-
num/Bjerre 2005; Kornum/Bjerre 2007; Vangkilde 2008).
The total market for e-commerce sales in Denmark has been estimated to be between 21 and 25
bn EUR (by 2005) and around half of this volume is generated in the domestic market. In terms
of a BTB-BTC ratio, 10% of the sales are to private consumers (ITST 2006). BTC e-commerce
has been estimated to have grown from 1 bn EUR in 2004 to 4 bn EUR in 2008. Still, other
sources estimate the retail e-commerce sales in Denmark in 2006 to be between 530 and 660 bn
EUR out of a total retail turnover of 40 bn EUR (Sørensen 2007). This indicates that these iden-
tified figures should be considered as very rough estimates until more direct evidence can be
provided. No general statistics are available on the specific product categories, but examples
can be given in two categories - books and groceries.
Aastrup, J.; Bjerre, M.; Kornum, N.; Kotzab, H. 213
������������ ���������� ���
�� ����� ���� ��������� ���
�������� ����- ����� �� ���
�������� �������� ����� ��
!�������"���������� #��
$������ � %�������� # �
&��������� ����"��� ##�
'��(��������� ����������")��������� ���
*�+�� ������� ��� ���
����"���� ��� �� ���
,"����"�� ����"���� �-"������ ���
.���� ������"���� ��� �/�
,�� ��� ��������� � �
0�������� /�
!������� �
Table 3: Percentage of Internet Purchasers Having Bought in Specific Categories Last Year(2008-2009)
Books sold online represented 20% of the total sales of books (261 m EUR) in Denmark in
2008, which involve an increase of its relative share, up 4% from 2004 - a 69% growth in Inter-
net based sales of books during that period. At the same time the number of books sold via
supermarkets has risen in the same period from 5% to 9% of its relative share of total book sales
The growth of supermarket based sales have risen dramatically, 119% in the same period, where
the total market increased by only 18% (Olsen 2005, Svane 2009). However, industry reports
indicate that the statistics do not include all sales to supermarkets and so this figure may be sig-
nificantly higher (Dagbladet Information 2009). Although offline book dealer and book club
sales still represent around 70% of the market, the total impact of increasing supermarket and e-
commerce book sales is that the offline part finds itself under pressure because, among other
things, the internationally and nationally bestselling books that earlier were an important part of
their profit are now sold primarily via the alternative channels just mentioned. Thus e-com-
merce is beginning to have a major contributing impact on the development of the entire book
sales sector.
This is far from what can be said of the impact of home delivery in the grocery sector. As
already noted grocery e-commerce has rudimentary sales in absolute figures and a very slow
growth rate in Denmark because the major players like Dansk Supermarked and Coop have not
yet chosen to offer home delivery as an option (Kornum/Bjerre 2007). An estimate would sug-
gest that the grocery/food home delivery in Denmark by 2009 represents sales of around 49 m.
Aarstiderne.com who sells organic vegetables and fruit boxes by subscription represents 60% of
the market; whereas SkagenFoods.com and Torvet.dk each represent 10% of the market [2].
Torvet.dk offers an assortment of around 2,500 items and 25% of its food items are organic.
Skagen Foods delivers fresh fish and vegetable boxes to the homes all over Denmark. The rest
of the market consists of smaller local or regional supermarket home delivery systems and food
producers selling foods directly to consumers.
It is in total quite difficult to estimate this remaining part of the market because it is a very
broad mixture of various SME’s. Examples of regional or local e-supermarket operators are Yel-
lowman.dk, e-supermarked.dk, Osuma.dk and a number of food producers with home delivery
(see for instance these three lists consisting of food producers where some of these offer home
delivery, some covering one selected area [3]).
As the total Danish retail food grocery market in 2007 represents 13.7 bn EUR, home delivery
sales correspond to only .4% of the total market - hardly a figure that will give the large grocery
retailers in Denmark a nightmare. Also, the share of grocery e-commerce will probably not take
off to any significant extent before the three large retail conglomerates Dagrofa, Dansk Super-
marked and Coop begin to compete directly in this area (Kornum/Bjerre 2005; Kornum/ Bjerre
2007; Vangkilde 2008).
214 European Retail Research, Vol. 24, Issue I, pp. 195-222
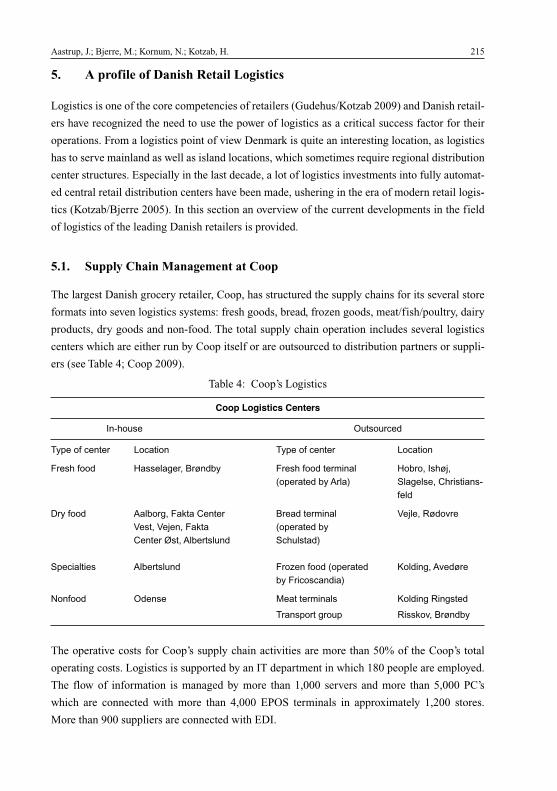
5. A profile of Danish Retail Logistics
Logistics is one of the core competencies of retailers (Gudehus/Kotzab 2009) and Danish retail-
ers have recognized the need to use the power of logistics as a critical success factor for their
operations. From a logistics point of view Denmark is quite an interesting location, as logistics
has to serve mainland as well as island locations, which sometimes require regional distribution
center structures. Especially in the last decade, a lot of logistics investments into fully automat-
ed central retail distribution centers have been made, ushering in the era of modern retail logis-
tics (Kotzab/Bjerre 2005). In this section an overview of the current developments in the field
of logistics of the leading Danish retailers is provided.
5.1. Supply Chain Management at Coop
The largest Danish grocery retailer, Coop, has structured the supply chains for its several store
formats into seven logistics systems: fresh goods, bread, frozen goods, meat/fish/poultry, dairy
products, dry goods and non-food. The total supply chain operation includes several logistics
centers which are either run by Coop itself or are outsourced to distribution partners or suppli-
ers (see Table 4; Coop 2009).
Aastrup, J.; Bjerre, M.; Kornum, N.; Kotzab, H. 215
Table 4: Coop’s Logistics
Coop Logistics Centers
In-house Outsourced
Type of center Location Type of center Location
Fresh food Hasselager, Brøndby Fresh food terminal Hobro, Ishøj,
(operated by Arla) Slagelse, Christians-
feld
Dry food Aalborg, Fakta Center Bread terminal Vejle, Rødovre
Vest, Vejen, Fakta (operated by
Center Øst, Albertslund Schulstad)
Specialties Albertslund Frozen food (operated Kolding, Avedøre
by Fricoscandia)
Nonfood Odense Meat terminals Kolding Ringsted
Transport group Risskov, Brøndby
The operative costs for Coop’s supply chain activities are more than 50% of the Coop’s total
operating costs. Logistics is supported by an IT department in which 180 people are employed.
The flow of information is managed by more than 1,000 servers and more than 5,000 PC’s
which are connected with more than 4,000 EPOS terminals in approximately 1,200 stores.
More than 900 suppliers are connected with EDI.
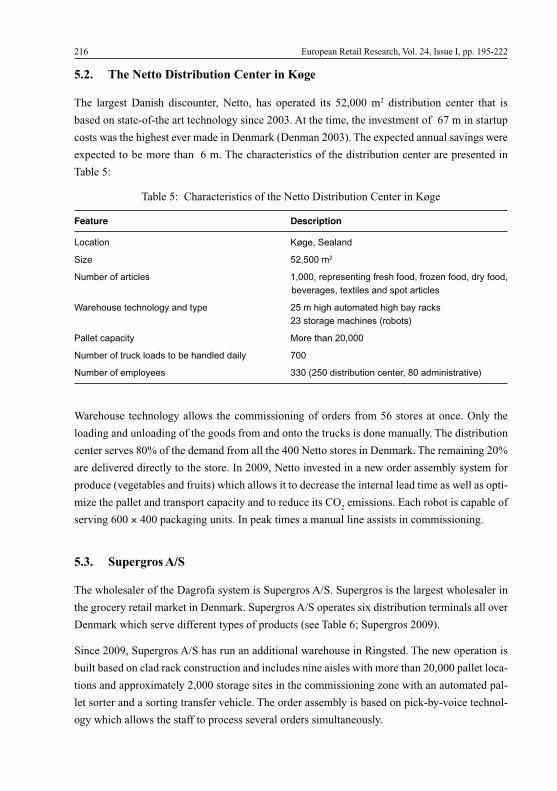
5.2. The Netto Distribution Center in Køge
The largest Danish discounter, Netto, has operated its 52,000 m2 distribution center that is
based on state-of-the art technology since 2003. At the time, the investment of 67 m in startup
costs was the highest ever made in Denmark (Denman 2003). The expected annual savings were
expected to be more than 6 m. The characteristics of the distribution center are presented in
Table 5:
216 European Retail Research, Vol. 24, Issue I, pp. 195-222
Table 5: Characteristics of the Netto Distribution Center in Køge
Feature Description
Location Køge, Sealand
Size 52,500 m2
Number of articles 1,000, representing fresh food, frozen food, dry food,
beverages, textiles and spot articles
Warehouse technology and type 25 m high automated high bay racks
23 storage machines (robots)
Pallet capacity More than 20,000
Number of truck loads to be handled daily 700
Number of employees 330 (250 distribution center, 80 administrative)
Warehouse technology allows the commissioning of orders from 56 stores at once. Only the
loading and unloading of the goods from and onto the trucks is done manually. The distribution
center serves 80% of the demand from all the 400 Netto stores in Denmark. The remaining 20%
are delivered directly to the store. In 2009, Netto invested in a new order assembly system for
produce (vegetables and fruits) which allows it to decrease the internal lead time as well as opti-
mize the pallet and transport capacity and to reduce its CO2
emissions. Each robot is capable of
serving 600 × 400 packaging units. In peak times a manual line assists in commissioning.
5.3. Supergros A/S
The wholesaler of the Dagrofa system is Supergros A/S. Supergros is the largest wholesaler in
the grocery retail market in Denmark. Supergros A/S operates six distribution terminals all over
Denmark which serve different types of products (see Table 6; Supergros 2009).
Since 2009, Supergros A/S has run an additional warehouse in Ringsted. The new operation is
built based on clad rack construction and includes nine aisles with more than 20,000 pallet loca-
tions and approximately 2,000 storage sites in the commissioning zone with an automated pal-
let sorter and a sorting transfer vehicle. The order assembly is based on pick-by-voice technol-
ogy which allows the staff to process several orders simultaneously.
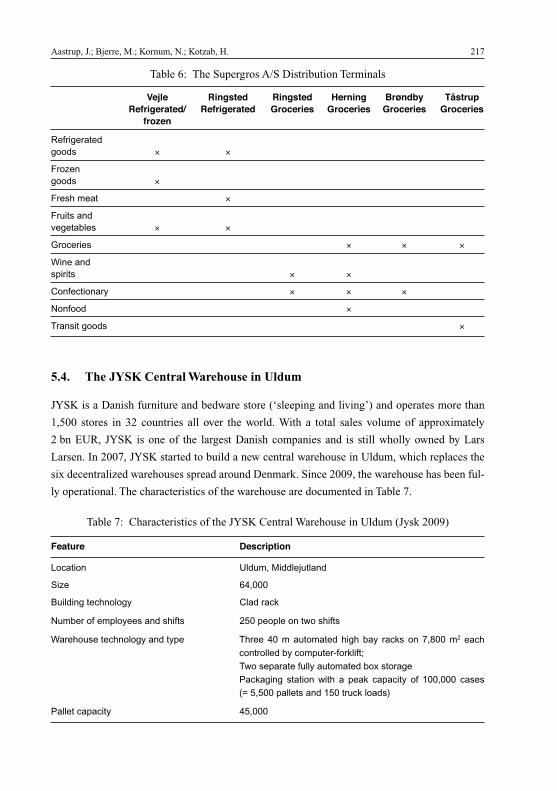
5.4. The JYSK Central Warehouse in Uldum
JYSK is a Danish furniture and bedware store (‘sleeping and living’) and operates more than
1,500 stores in 32 countries all over the world. With a total sales volume of approximately
2 bn EUR, JYSK is one of the largest Danish companies and is still wholly owned by Lars
Larsen. In 2007, JYSK started to build a new central warehouse in Uldum, which replaces the
six decentralized warehouses spread around Denmark. Since 2009, the warehouse has been ful-
ly operational. The characteristics of the warehouse are documented in Table 7.
Aastrup, J.; Bjerre, M.; Kornum, N.; Kotzab, H. 217
Table 7: Characteristics of the JYSK Central Warehouse in Uldum (Jysk 2009)
Feature Description
Location Uldum, Middlejutland
Size 64,000
Building technology Clad rack
Number of employees and shifts 250 people on two shifts
Warehouse technology and type Three 40 m automated high bay racks on 7,800 m2 each
controlled by computer-forklift;
Two separate fully automated box storage
Packaging station with a peak capacity of 100,000 cases
(= 5,500 pallets and 150 truck loads)
Pallet capacity 45,000
Table 6: The Supergros A/S Distribution Terminals
Vejle Ringsted Ringsted Herning Brøndby TåstrupRefrigerated/ Refrigerated Groceries Groceries Groceries Groceries
frozen
Refrigeratedgoods × ×
Frozengoods ×
Fresh meat ×
Fruits andvegetables × ×
Groceries × × ×
Wine andspirits × ×
Confectionary × × ×
Nonfood ×
Transit goods ×
The Uldum-warehouse serves 170 JYSK stores in Denmark, Norway, the Netherlands and the
UK as well as approximately 100 franchise stores all around the world. The total investment in
the central warehouse was expected to be around 100 m. It is the first clad-rack warehouse to be
built in Denmark.
6. Planning and Regulation Perspective
There are two areas of Danish legislation which have gained attention over the recent years in
relation to retailing, i.e. the law regulating opening hours and the law regulating planning and
location of stores.
Thus, considerations and concerns regarding the city center and the availability of commodities
and pharmacy/postal services in rural areas are the main political drivers of retail regulation.
The law on opening hours is being more and more liberalized these years, whereas the parts of
the planning law regarding store sizes and location is being more tightly regulated.
The law regulating store opening hours (Law no. 606 of 24th of June 2005) is balancing con-
cerns mainly between allowing structural changes and securing the availability of stores and
accessibility of daily commodities and other services in smaller cities and rural areas where
retail stores face a difficult competitive situation. Smaller retailers, especially, compete there
against larger store formats whereby it is observed that the smaller the city, the smaller the aver-
age size of retail stores and their turnover as well as their efficiency measured as turnover
per m2 (Retail Institute Scandinavia 2009b). Therefore services such as pharmacy outlets and
post offices are often integrated into grocery stores in these smaller cities. The law protects
these small stores by making it possible for them to be open every day. Using turnover as a KPI
has made the administration of the law simple. Smaller stores (less than 27.1 m DKK per year)
are allowed to trade every day, all year round.
This makes it possible for smaller stores to use Sundays as a special competitive differentiator
over the larger stores which are more restricted in their opening hours on Sundays (Law no. 606,
2005). In principle, all stores could be open from 6am Monday through 6pm Saturday, and all
stores are allowed to sell all products during this period (Law no. 606, 2005). Practice shows
however, that these options are not used - actually only one operator (7-Eleven) is utilizing the
law to its full extent. Most retailers only operate with opening hours of 9 am-7 pm (Monday-
Thursday), 9 am-8 pm on Fridays and 8 am-5 pm on Saturdays. Besides these everyday opening
hours, the differentiated possibility lies in being open on Sundays. Stores larger than the turnover
KPI are allowed a number of open Sundays a year (every first Sunday in a month, all December
Sundays before Christmas, and 6 Sundays to be chosen individually as well). This adds up to 21-
22 open Sundays for large stores. On a typical Sunday, stores are open between 10 am and 4 pm.
218 European Retail Research, Vol. 24, Issue I, pp. 195-222
This law is up for renewal in 2009, and generally expectations are that liberalization will contin-
ue, resulting in more opportunities for Sunday opening (DLF 2009). Interviews suggest that
especially centrally controlled retailers operating larger retail formats and destinations (e.g.
hypermarket formats and furniture stores) will utilize the opportunities for the increased open-
ing hours (DLF 2009).
It might be worth noting that it is the labor unions that are now trying to stop continued liberal-
ization, arguing that the infrastructure in terms of childcare is not in place to accommodate par-
ents working full time during weekends. The trade association, DSK (organizing small and
medium sized FMCG retailers), has accepted the continued liberalization.
The other important regulation concerning retailing is the planning and location of stores (Law
no. 937 of September 24th 2009) - focusing on maximum sizes for individual stores in the
FMCG sector (largest stores allowed) and specialty stores (such as furniture, DIY). The law
aims at 1) ensuring a variety of stores in cities (both small and large), 2) ensuring that stores are
planned in relation to infrastructural access (especially public transport), and 3) increasing a
sustainable retail structure lowering or minimizing transport distances in relation to shopping
(DLF 2009).
Retail parks outside the city center have been a trend in several cities in Denmark over recent
decades, i.e. harming inner-city retail environments. A major concern is to keep and sustain
retail environments in the cities, and the law is actively trying to avoid further expansion of the
out-of-the-city-center shopping opportunities (DLF 2009), also in order to remain and apply
existing infrastructure. A new law passed in 2008 introduced a new methodology to define what
the “inner city” is. Previous to this law the postal number system was used which was easily
applicable but less valid and relevant as a measure of ‘inner-city’. With the new law, inspired by
a Swedish model, measures based on density of buildings, inhabitants, traffic and stores is used
to define what inner city is. This law is not up for renewal within the next 5 years. The law
emphasizes that stores should mainly be established within cities and it limits store sizes to
3,500 m2 for grocery stores and 2,000 m2 for specialty retailing.
This has restricted both grocery and specialty retailers’ possibilities to establish larger store for-
mats which has been an interest for certain retailers, especially centrally controlled retailers,
e.g. those with hypermarkets, furniture, consumer electronics and DIY stores. The hypermarket
chain Føtex has, as an example, developed stores where grocery and non-food departments are
separated into two legally distinct entities with distinct entry and payment areas right next to
each other. In this way the well known Føtex format with both non-food and groceries remains
possible to uphold despite the restrictions of the law. Hence, this law is less liberal and more
regulated than in its earlier versions.
Aastrup, J.; Bjerre, M.; Kornum, N.; Kotzab, H. 219
7. Summary
Denmark is known for its scientists like the physicists Niels Bohr and Tycho Brahe, the physiol-
ogist August Krogh, the architects Arne Jacobsen or Jørn Utzon, the designers Georg and Jacob
Jensen or Gertrud Vasegaard, and the film maker Lars von Trier. Besides that, though, Denmark
is also the home of some quite successful retailing companies which this paper has shown.
The Danish consumer can be seen as a benchmark for acting in a socially and environmentally
responsible manner and who actively influences retailing policy, e.g. in terms of offering eco-
logical and fair-traded products. We may also see best practices for the future when it comes to
electronic commerce, as Denmark is one of the countries with the highest Internet diffusion
rate.
Due to the small size of the market, foreign retailing companies are not entering the market in
that dimension as is the case in other countries. On the contrary, we are able to see, especially in
the fashion retailing segment, that Danish companies are quite successful in foreign markets.
Meanwhile, grocery retailing remains in more or less local hands, where only Netto has gone
international. Other Danish retailing companies, such as JYSK, are becoming important global
players.
Notes
[1] The sources for the rest of the data in this section are from a number of Danish newspapersavailable in the Info Media database.
[2] There is no recent data available on the turnover of these two firms. By 2007 the CEOof Torvet mentioned that “this year our turnover will reach the amount of a double cifrein mill. and I am quite sure that within two years we will reach a turnover of 100 m DKK(13 m EUR)” (Sørensen 2007). By 2007 Torvet.dk was “above 10,000” and is seeminglygrowing very fast (Jyllands Posten 2007). Skagen Foods had a turnover of 32 m DKK in2006 (4 m EUR) (Sørensen, 2007).
[3] http://www.abonnementslisten.dk, http://www.okologi.dk/Eksterne/stalddor/Default.asp andhttp://www.landkoeb.dk
References
ACNielsen (2008): Trends in Online Shopping - A Global Nielsen Consumer Report.
Bahr, H. (2008): Supermarkedshåndbogen [Handbook of Supermarkets], StockmanngruppenA/S.
Bjerre, M. (1990): 90’ernes forretningskoncept: franchising [The business concept of the 90’s:Franchising], Schultz, Copenhagen.
Bjerre, M.; Denman, H. (2004): Franchiseguiden, Erhvervsbladets Forlag, Copenhagen.
220 European Retail Research, Vol. 24, Issue I, pp. 195-222
Coop (2009): Coop Logistik [Coop Logistics], http://studio1-2.dk/Referencer/Kommunika-tionsfilm/COOP-Logistik.aspx.
Dagbladet Information (2009): “Bogsalget til supermarkeder holdes skjult” [The book sales tosupermarkets are kept hidden], June 18th 2009, NK.
Denman, H. (2003): Moderne lager stiller nye krav [Modern distribution centers have newdemands], Transport Erhervsbladet, 17/12, 1.
DLF (2009): Detailhandelsprognose 2008-2010-2014 [Retail Forecast 2008-2010-2014], RetailInstitute Scandinavia, 2009.
Gudehus, T.; Kotzab, H. (2009): Comprehensive Logistics, Springer, Berlin.
Hansen, T. (2003): The Online Grocery Consumer. Results From Two Scandinavian Surveys,Copenhagen.
IBM (2004): Deeper Customer Insight, Understanding today’s complex shoppers, IBM.
ITST (2006): Information Society Denmark IT&C Status 2006 [Danish Language]. IT andTelestyrelsen.
Jensen, J.B.; Levinsen, M. (2008): Forbrugere, detailhandel og byer i fremtiden, in: Consumer,Retailing and Cities of the Future, Fremforsk 2009, Jyllands Posten August 7th 2007.
Jyllands Posten (2007): Et år med succes [A year with success], http://jp.dk/morgenavisen/erhverv/article1032234.ece?ncc=1, accessed August 7, 2007.
Jysk (2009): JYSKs kæmpelager i Uldum [Jysk’s large distribution center in Uldum],http://www.jysk.dk/presse/uldum, accessed December 5, 2009.
Konkurrencestyrelsen (2006): Danskernes handel på internettet [Danes buy on the Internet],Konkurrencestyrelsen, Copenhagen.
Kornum, N.; Bjerre, M. (2005) (eds.): Grocery E-Commerce: Consumer Behaviour and Busi-ness Strategies, Edward Elgar Publishing, Cheltenham/Northhampton, MA.
Kornum, N.; Bjerre, M. (2007): Grocery e-commerce in the UK and Denmark - strategic mar-ket creation, in: International Journal of Business Innovation and Research, Vol. 1, No. 3,pp. 296-314.
Kotzab, H.; Bjerre, M. (2005): Retailing in a SCM perspective, CBS Press, Frederiksberg.
Law no. 606 of 24th of June 2005: Lov om detailsalg fra butikker mv (Lukkeloven) [Law onretail sales from stores], Økonomi- og Erhvervsministeriet.
Law no. 937 of 24th of September 2009: Lov om planlægning (Planloven) [Law on Planning},Miljøministeriet.
Olsen, I.T. (2005): Bogmarkedet i Danmark [The Bookmarket in Denmark], Bogbarometret.Bogmarkedet No. 5, 2005, p. 10.
Pine, B.J.; Gilmore, J.H. (1998): Welcome to the experience economy, in: Harvard BusinessReview, Vol. 76, No. 4, pp. 97-105.
Retail Institute Scandinavia (2008): Kæder i Dansk Detailhandel [Chains in Danish SpecialtyRetailing], Retail Institute Scandinavia, Asnæs.
Retail Institute Scandinavia (2009a): Supermarkedshåndbogen 2009 [Handbook of Supermar-kets], Retail Institute Scandinavia, Asnæs.
Retail Institute Scandinavia (2009b): Dansk Dagligvarehandel 10 årsstatistik 1998-2008 [Sta-tistical ten-year review of Danish Grocery Retailing], Retail Institute Scandinavia, Asnæs.
Aastrup, J.; Bjerre, M.; Kornum, N.; Kotzab, H. 221
Sørensen Højgård, B. (2007): Danskerne er blevet bidt af e-handel [Danes have been bitten bye-commerce], Berlingske Tidende, http://www.business.dk/tech-mobil/danskerne-er-blevet-bidt-af-e-handel, accessed June 11, 2007.
Supergros (2009): Logistics guide. http://www.supergros.com/2007/pdf/logistik/Logistikguide_ENG_version2009-5.pdf, accessed December 5, 2009.
Statistics Denmark (2008): FU05 Household yearly consumption. http://www.dst.dk/HomeUK.aspx, accessed May 17, 2009.
Statistics Denmark (2009a): Statistisk Årbog 2009 [Statistical Yearbook 2009], Danmarks Sta-tistik, Copenhagen.
Statistics Denmark (2009b): Statistisk Tiårsoversigt 2009 [Statistical ten-year review 2009],Danmarks Statistik, Copenhagen.
Svane, M. (2009): Fra slemt til værre. [From Bad to Worse]. Bogbarometret. Bogmarkedet No.12, p. 27.
Vangkilde, M. (2008): Why Wait - An Exploration of first-mover advantages among Danishe-grocers through a resource based perspective, PhD Thesis, Copenhagen Business School,Frederiksberg.
222 European Retail Research, Vol. 24, Issue I, pp. 195-222