Embed Size (px)
Citation preview
Peterson-Kaiser Health System Tracker
How do health expenditures vary across the population?
Peterson-Kaiser Health System Tracker
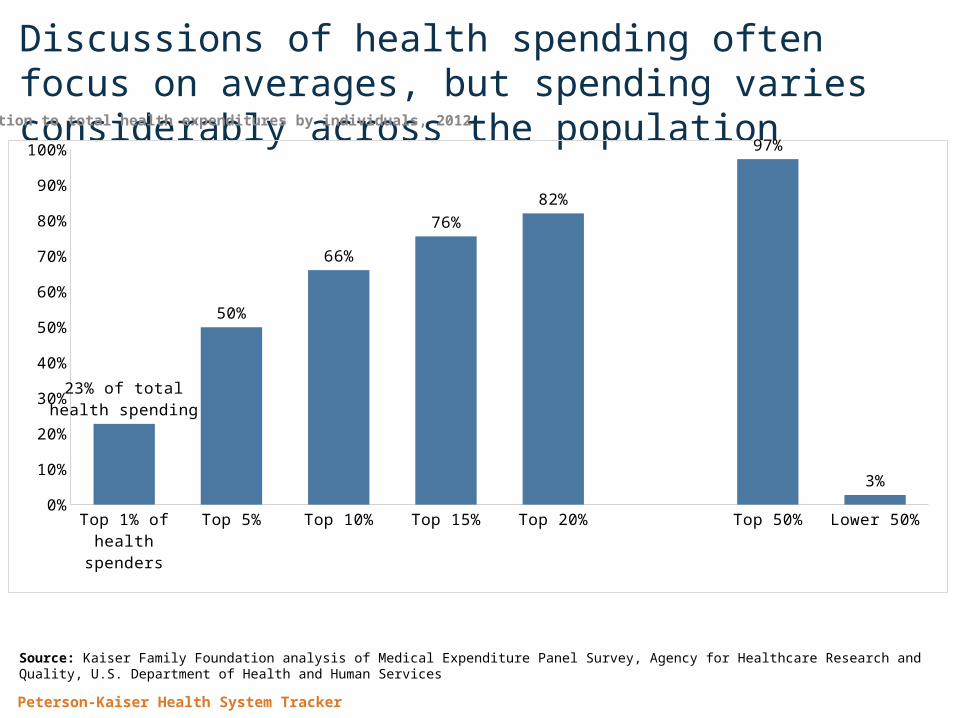
Discussions of health spending often focus on averages, but spending varies considerably across the populationContribution to total health expenditures by individuals, 2012
Source: Kaiser Family Foundation analysis of Medical Expenditure Panel Survey, Agency for Healthcare Research and Quality, U.S. Department of Health and Human Services
Top 1% of health
spenders
Top 5% Top 10% Top 15% Top 20% Top 50% Lower 50%0%
10%
20%
30%
40%
50%
60%
70%
80%
90%
100%
23% of totalhealth spending
50%
66%
76%
82%
97%
3%
Peterson-Kaiser Health System Tracker
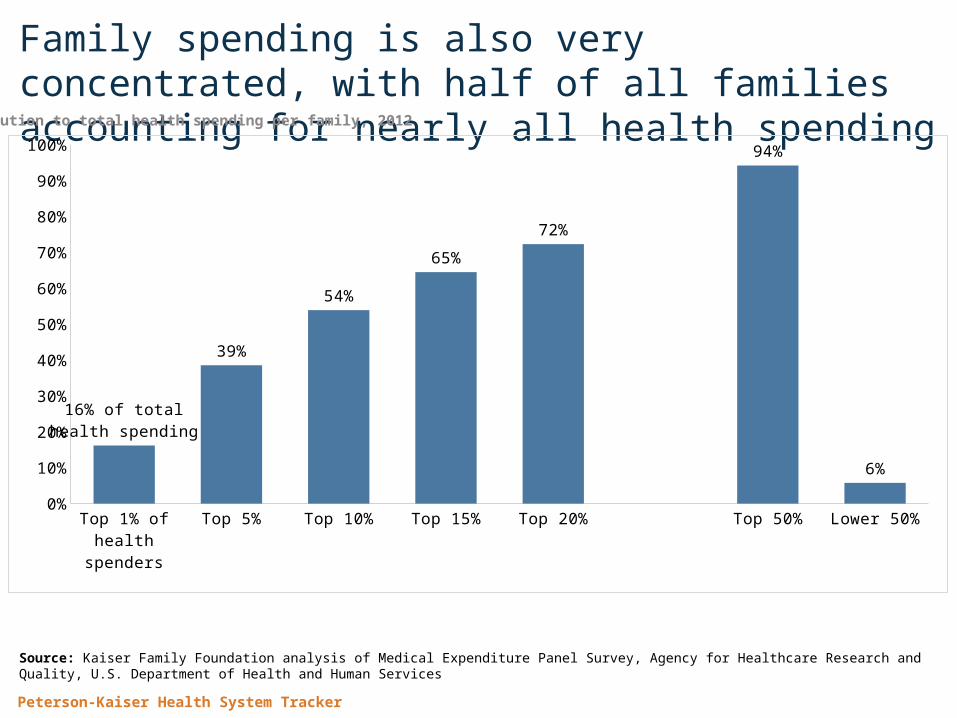
Family spending is also very concentrated, with half of all families accounting for nearly all health spending
Top 1% of health
spenders
Top 5% Top 10% Top 15% Top 20% Top 50% Lower 50%0%
10%
20%
30%
40%
50%
60%
70%
80%
90%
100%
16% of totalhealth spending
39%
54%
65%
72%
94%
6%
Contribution to total health spending per family, 2012
Source: Kaiser Family Foundation analysis of Medical Expenditure Panel Survey, Agency for Healthcare Research and Quality, U.S. Department of Health and Human Services
Peterson-Kaiser Health System Tracker
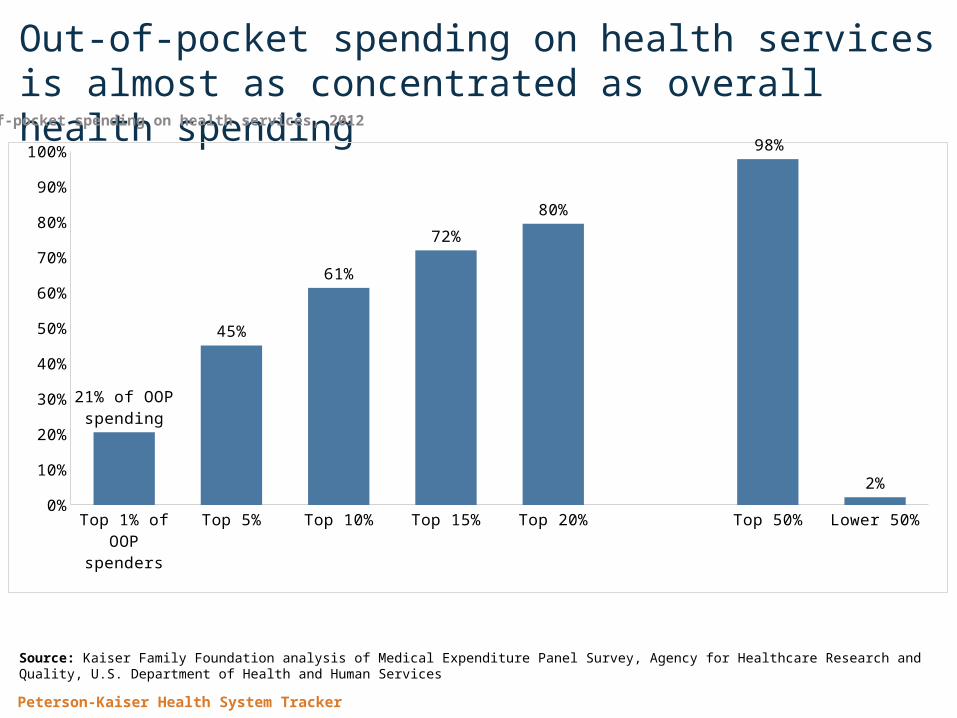
Out-of-pocket spending on health services is almost as concentrated as overall health spendingOut-of-pocket spending on health services, 2012
Top 1% of OOP spenders
Top 5% Top 10% Top 15% Top 20% Top 50% Lower 50%0%
10%
20%
30%
40%
50%
60%
70%
80%
90%
100%
21% of OOPspending
45%
61%
72%
80%
98%
2%
Source: Kaiser Family Foundation analysis of Medical Expenditure Panel Survey, Agency for Healthcare Research and Quality, U.S. Department of Health and Human Services
Peterson-Kaiser Health System Tracker
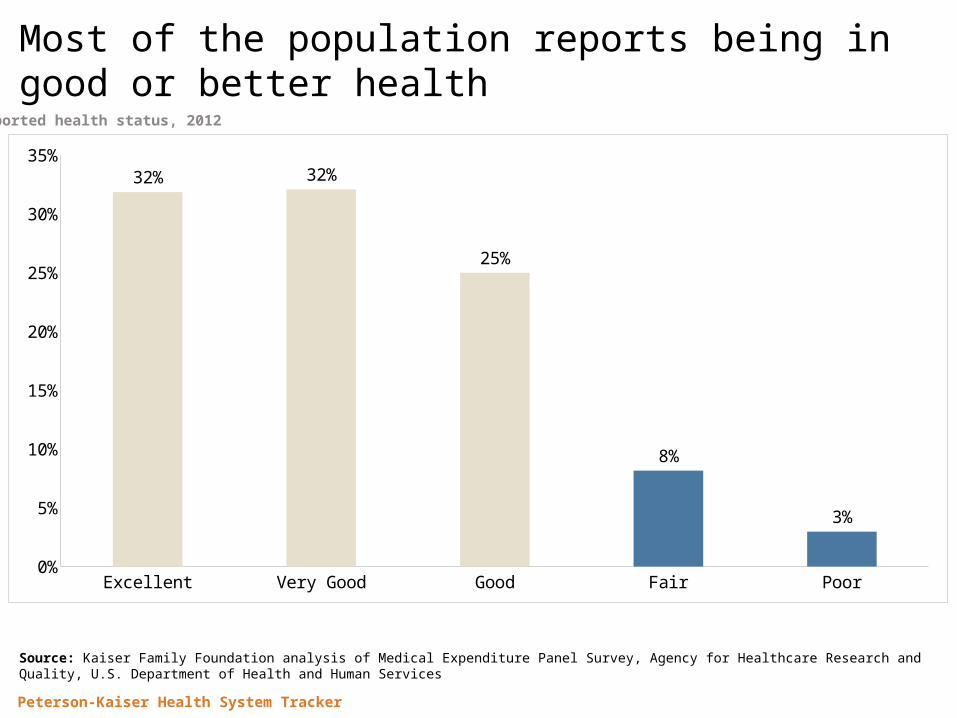
Most of the population reports being in good or better health
Reported health status, 2012
Excellent Very Good Good Fair Poor0%
5%
10%
15%
20%
25%
30%
35%32% 32%
25%
8%
3%
Source: Kaiser Family Foundation analysis of Medical Expenditure Panel Survey, Agency for Healthcare Research and Quality, U.S. Department of Health and Human Services
Peterson-Kaiser Health System Tracker
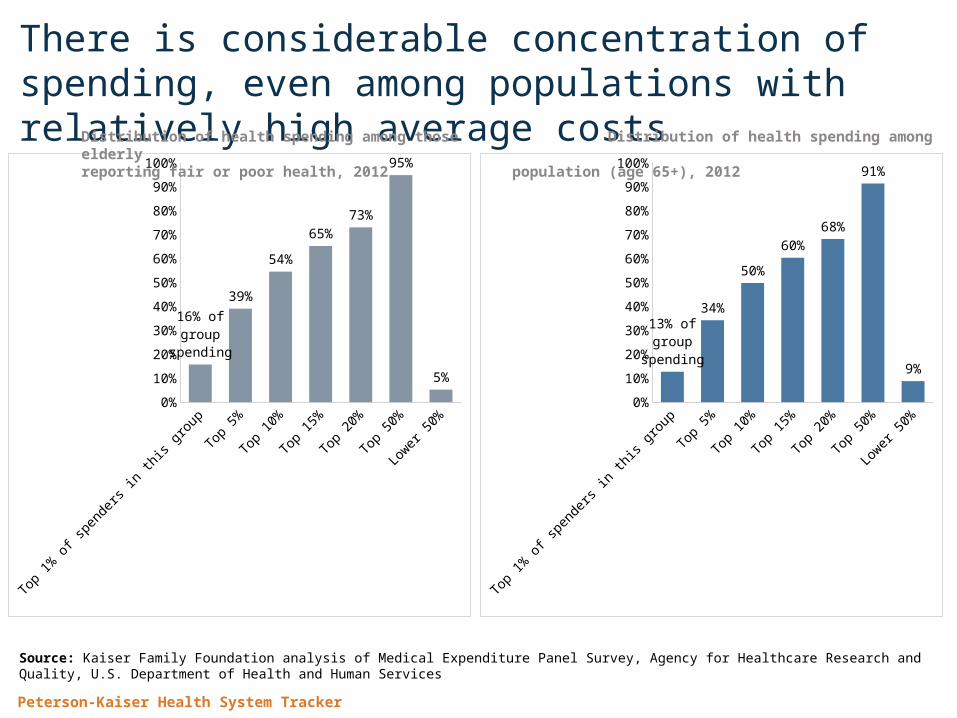
There is considerable concentration of spending, even among populations with relatively high average costs
Top 1% of spenders
in this group
Top 5% Top 10% Top 15% Top 20% Top 50% Lower 50%
0%
10%
20%
30%
40%
50%
60%
70%
80%
90%
100%
16% ofgroup
spending
39%
54%
65%
73%
95%
5%
Source: Kaiser Family Foundation analysis of Medical Expenditure Panel Survey, Agency for Healthcare Research and Quality, U.S. Department of Health and Human Services
Top 1% of spenders
in this group
Top 5% Top 10% Top 15% Top 20% Top 50% Lower 50%
0%
10%
20%
30%
40%
50%
60%
70%
80%
90%
100%
13% ofgroup
spending
34%
50%
60%
68%
91%
9%
Distribution of health spending among those Distribution of health spending among elderlyreporting fair or poor health, 2012 population (age 65+), 2012
Peterson-Kaiser Health System Tracker
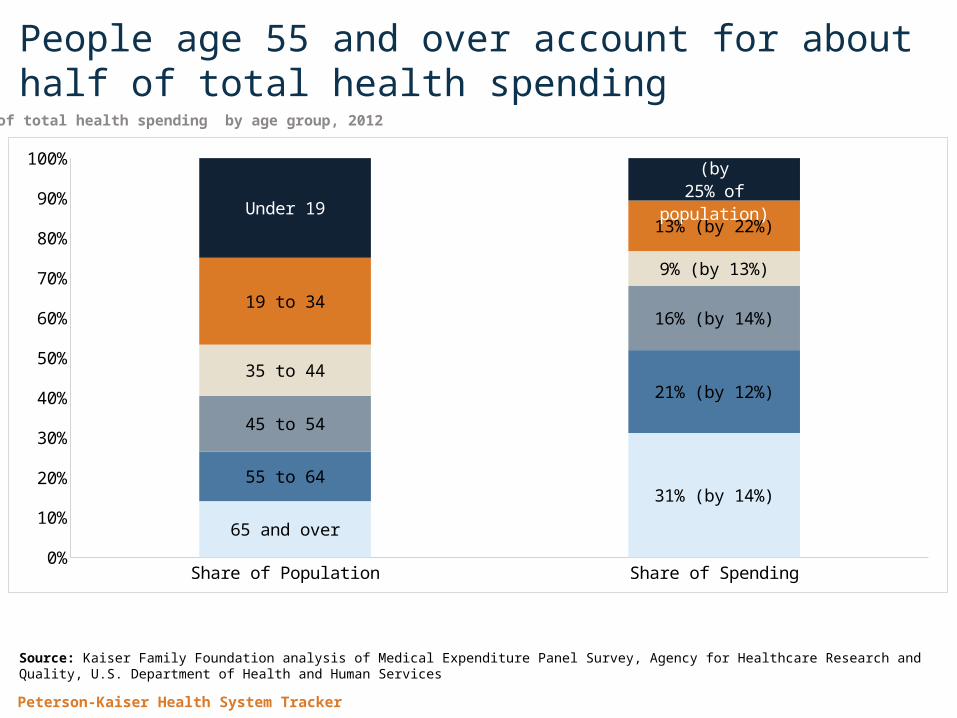
People age 55 and over account for about half of total health spending
Share of Population Share of Spending0%
10%
20%
30%
40%
50%
60%
70%
80%
90%
100%
65 and over
31% (by 14%)55 to 64
21% (by 12%)
45 to 54
16% (by 14%)
35 to 44
9% (by 13%)
19 to 34
13% (by 22%)Under 19
11% of spending (by25% of population)
Share of total health spending by age group, 2012
Source: Kaiser Family Foundation analysis of Medical Expenditure Panel Survey, Agency for Healthcare Research and Quality, U.S. Department of Health and Human Services
Peterson-Kaiser Health System Tracker
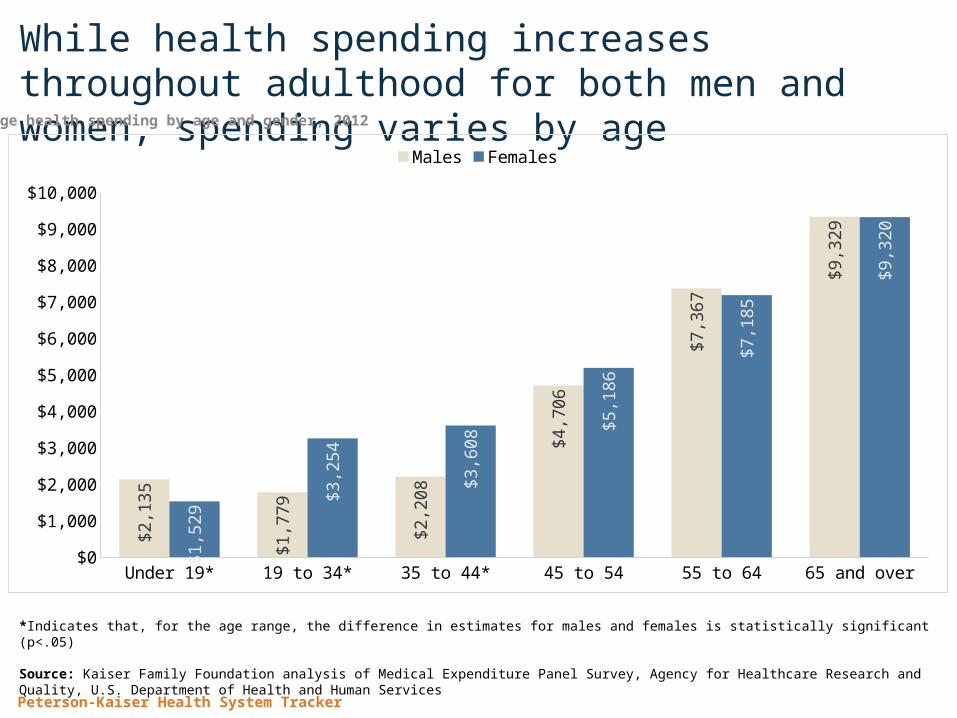
While health spending increases throughout adulthood for both men and women, spending varies by ageAverage health spending by age and gender, 2012
Under 19* 19 to 34* 35 to 44* 45 to 54 55 to 64 65 and over$0
$1,000
$2,000
$3,000
$4,000
$5,000
$6,000
$7,000
$8,000
$9,000
$10,000
$2,1
35
$1,7
79
$2,2
08
$4,7
06
$7,3
67
$9,3
29
$1,5
29
$3,2
54
$3,6
08
$5,1
86
$7,1
85
$9,3
20
Males Females
*Indicates that, for the age range, the difference in estimates for males and females is statistically significant (p<.05)
Source: Kaiser Family Foundation analysis of Medical Expenditure Panel Survey, Agency for Healthcare Research and Quality, U.S. Department of Health and Human Services
Peterson-Kaiser Health System Tracker
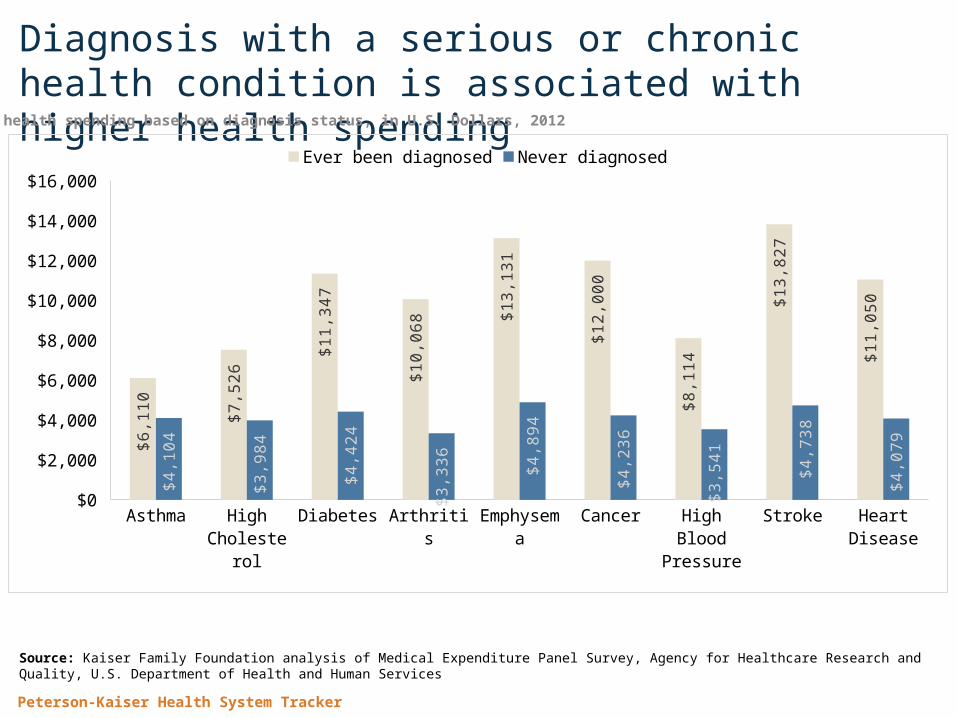
Diagnosis with a serious or chronic health condition is associated with higher health spending
Asthma High Cholesterol
Diabetes Arthritis Emphysema Cancer High Blood Pressure
Stroke Heart Disease
$0
$2,000
$4,000
$6,000
$8,000
$10,000
$12,000
$14,000
$16,000
$6,1
10
$7,5
26
$11,
347
$10,
068
$13,
131
$12,
000
$8,1
14
$13,
827
$11,
050
$4,1
04
$3,9
84
$4,4
24
$3,3
36 $4
,894
$4,2
36
$3,5
41
$4,7
38
$4,0
79
Ever been diagnosed Never diagnosed
Source: Kaiser Family Foundation analysis of Medical Expenditure Panel Survey, Agency for Healthcare Research and Quality, U.S. Department of Health and Human Services
Per capita health spending based on diagnosis status, in U.S. Dollars, 2012
Peterson-Kaiser Health System Tracker
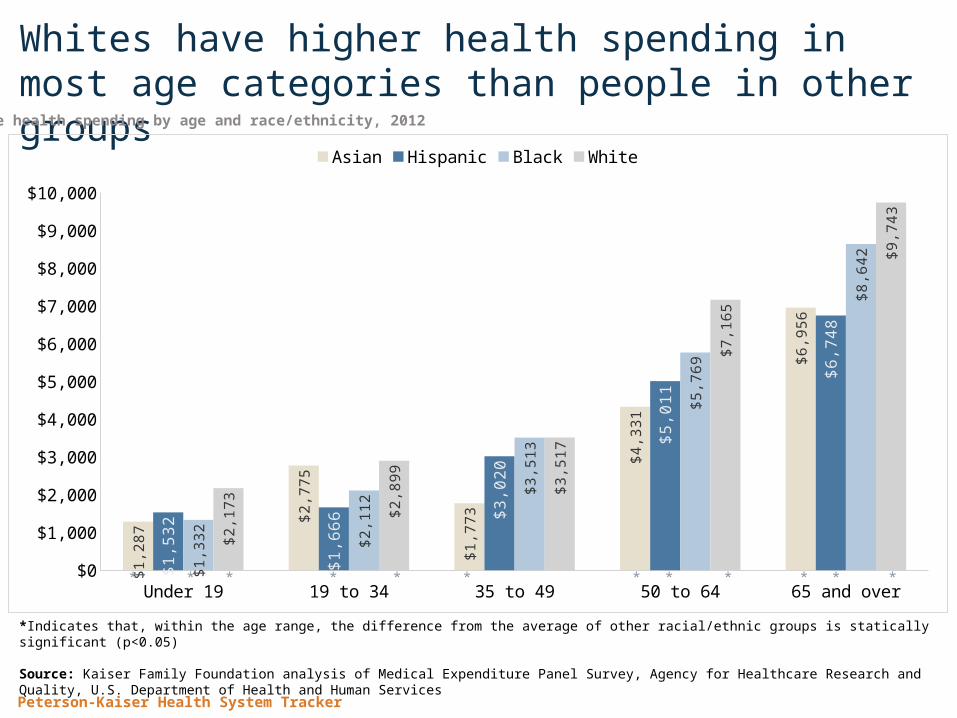
Whites have higher health spending in most age categories than people in other groups
Average health spending by age and race/ethnicity, 2012
Under 19 19 to 34 35 to 49 50 to 64 65 and over$0
$1,000
$2,000
$3,000
$4,000
$5,000
$6,000
$7,000
$8,000
$9,000
$10,000
$1,2
87
$2,7
75
$1,7
73
$4,3
31
$6,9
56
$1,5
32
$1,6
66
$3,0
20
$5,0
11
$6,7
48
$1,3
32 $2,1
12
$3,5
13
$5,7
69
$8,6
42
$2,1
73 $2,8
99 $3,5
17
$7,1
65
$9,7
43
Asian Hispanic Black White
*Indicates that, within the age range, the difference from the average of other racial/ethnic groups is statically significant (p<0.05)
Source: Kaiser Family Foundation analysis of Medical Expenditure Panel Survey, Agency for Healthcare Research and Quality, U.S. Department of Health and Human Services
* * * ** * ** * * * *
Peterson-Kaiser Health System Tracker
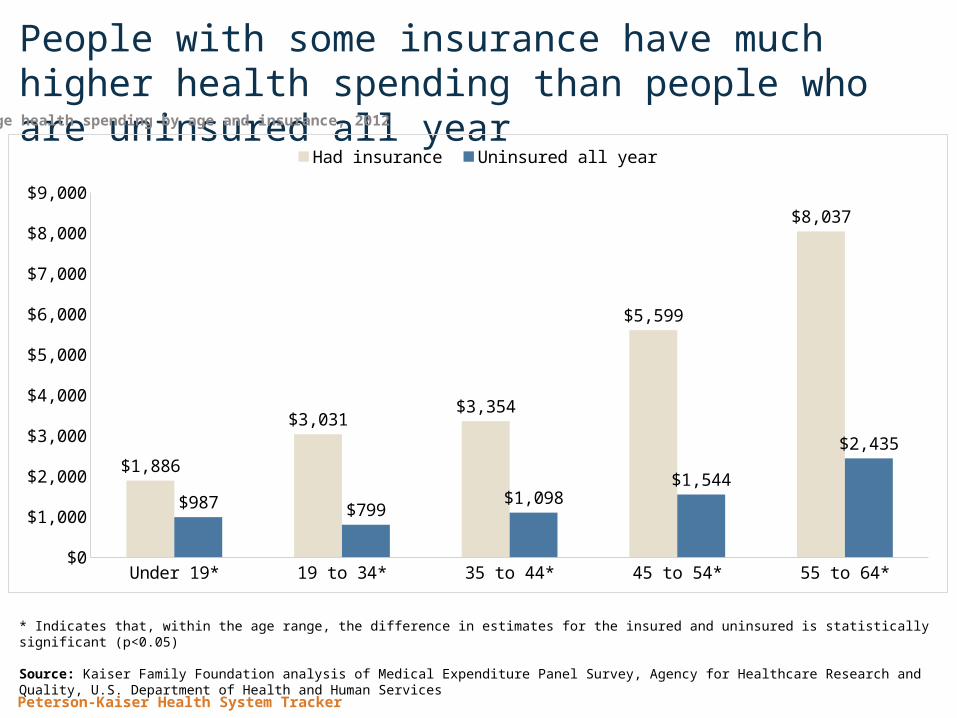
People with some insurance have much higher health spending than people who are uninsured all yearAverage health spending by age and insurance, 2012
Under 19* 19 to 34* 35 to 44* 45 to 54* 55 to 64*$0
$1,000
$2,000
$3,000
$4,000
$5,000
$6,000
$7,000
$8,000
$9,000
$1,886
$3,031$3,354
$5,599
$8,037
$987 $799$1,098
$1,544
$2,435
Had insurance Uninsured all year
* Indicates that, within the age range, the difference in estimates for the insured and uninsured is statistically significant (p<0.05)
Source: Kaiser Family Foundation analysis of Medical Expenditure Panel Survey, Agency for Healthcare Research and Quality, U.S. Department of Health and Human Services
Peterson-Kaiser Health System Tracker
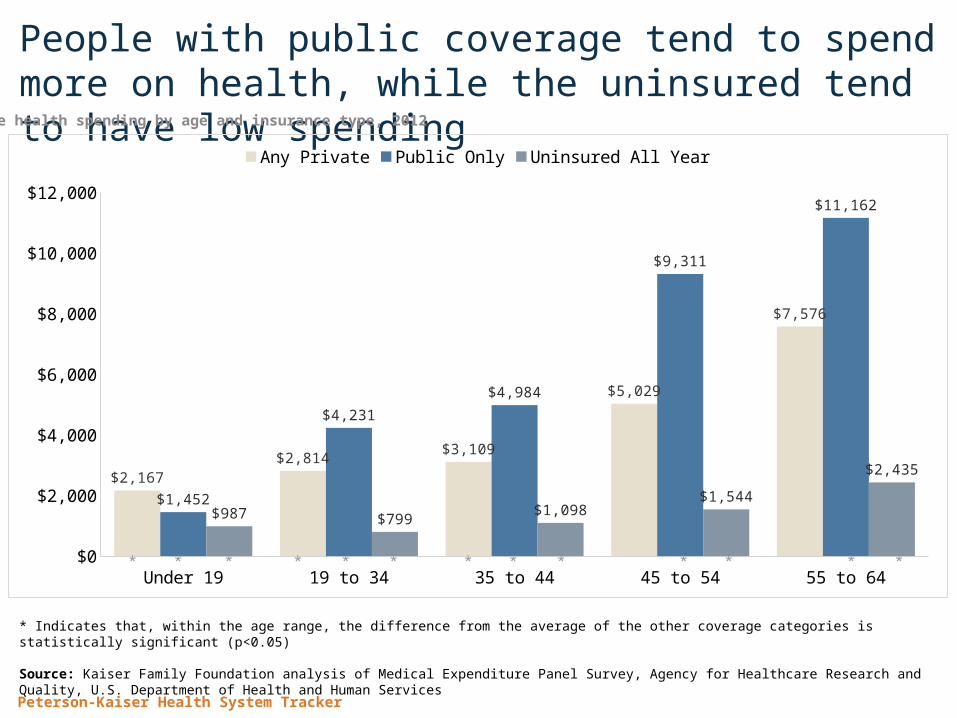
People with public coverage tend to spend more on health, while the uninsured tend to have low spendingAverage health spending by age and insurance type, 2012
Under 19 19 to 34 35 to 44 45 to 54 55 to 64$0
$2,000
$4,000
$6,000
$8,000
$10,000
$12,000
$2,167$2,814
$3,109
$5,029
$7,576
$1,452
$4,231
$4,984
$9,311
$11,162
$987 $799$1,098
$1,544
$2,435
Any Private Public Only Uninsured All Year
* Indicates that, within the age range, the difference from the average of the other coverage categories is statistically significant (p<0.05)
Source: Kaiser Family Foundation analysis of Medical Expenditure Panel Survey, Agency for Healthcare Research and Quality, U.S. Department of Health and Human Services
* * * * * * * * * * * * *
Peterson-Kaiser Health System Tracker
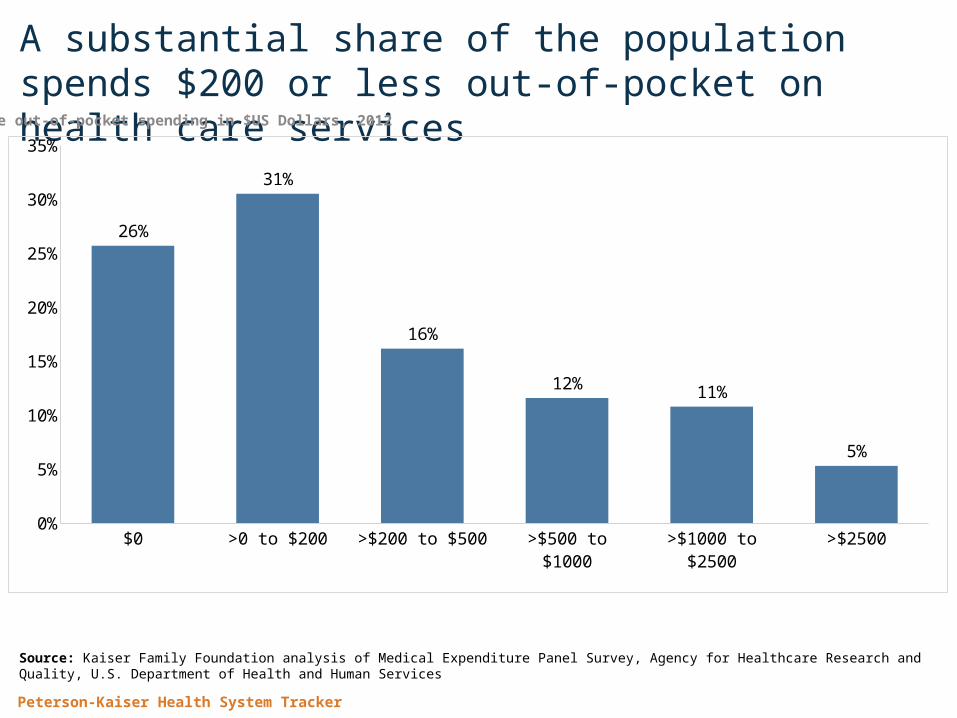
A substantial share of the population spends $200 or less out-of-pocket on health care servicesAverage out-of-pocket spending in $US Dollars, 2012
$0 >0 to $200 >$200 to $500 >$500 to $1000 >$1000 to $2500 >$25000%
5%
10%
15%
20%
25%
30%
35%
26%
31%
16%
12% 11%
5%
Source: Kaiser Family Foundation analysis of Medical Expenditure Panel Survey, Agency for Healthcare Research and Quality, U.S. Department of Health and Human Services