Embed Size (px)
Citation preview

Petrofac Limited INTERIM CONDENSED CONSOLIDATED FINANCIAL STATEMENTS 30 June 2017
Petrofac Limited
CONTENTS Page
Group financial highlights 1
Business review 2
Interim condensed consolidated income statement 13
Interim condensed consolidated statement of comprehensive income 14
Interim condensed consolidated statement of financial position 15
Interim condensed consolidated statement of cash flows 16
Interim condensed consolidated statement of changes in equity 18
Notes to the interim condensed consolidated financial statements 19
Statement of Directors’ responsibilities 33
Independent review report to Petrofac Limited 33
Shareholder information 34
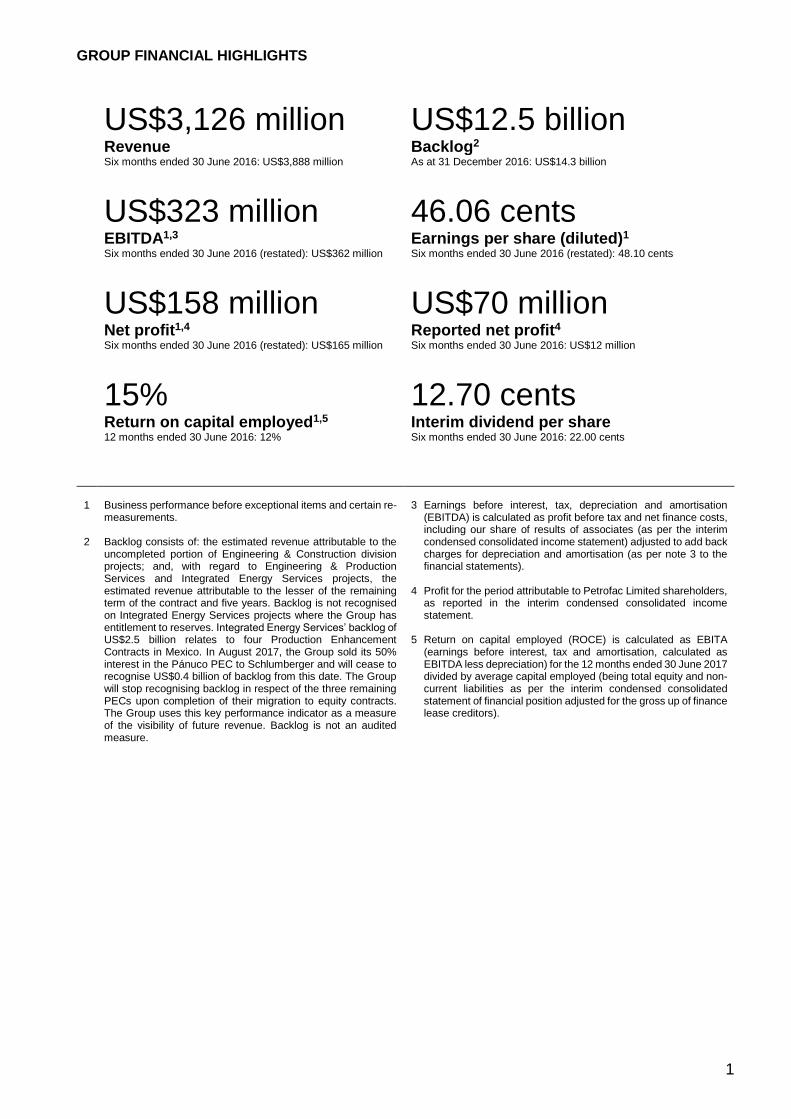
GROUP FINANCIAL HIGHLIGHTS
1
US$3,126 million US$12.5 billion Revenue Backlog2 Six months ended 30 June 2016: US$3,888 million As at 31 December 2016: US$14.3 billion
US$323 million 46.06 cents EBITDA1,3 Earnings per share (diluted)1 Six months ended 30 June 2016 (restated): US$362 million Six months ended 30 June 2016 (restated): 48.10 cents
US$158 million US$70 million Net profit1,4 Reported net profit4 Six months ended 30 June 2016 (restated): US$165 million Six months ended 30 June 2016: US$12 million
15% 12.70 cents Return on capital employed1,5 Interim dividend per share 12 months ended 30 June 2016: 12% Six months ended 30 June 2016: 22.00 cents
1 2
Business performance before exceptional items and certain re-measurements. Backlog consists of: the estimated revenue attributable to the uncompleted portion of Engineering & Construction division projects; and, with regard to Engineering & Production Services and Integrated Energy Services projects, the estimated revenue attributable to the lesser of the remaining term of the contract and five years. Backlog is not recognised on Integrated Energy Services projects where the Group has entitlement to reserves. Integrated Energy Services’ backlog of US$2.5 billion relates to four Production Enhancement Contracts in Mexico. In August 2017, the Group sold its 50% interest in the Pánuco PEC to Schlumberger and will cease to recognise US$0.4 billion of backlog from this date. The Group will stop recognising backlog in respect of the three remaining PECs upon completion of their migration to equity contracts. The Group uses this key performance indicator as a measure of the visibility of future revenue. Backlog is not an audited measure.
3 Earnings before interest, tax, depreciation and amortisation (EBITDA) is calculated as profit before tax and net finance costs, including our share of results of associates (as per the interim condensed consolidated income statement) adjusted to add back charges for depreciation and amortisation (as per note 3 to the financial statements).
4 Profit for the period attributable to Petrofac Limited shareholders,
as reported in the interim condensed consolidated income statement.
5 Return on capital employed (ROCE) is calculated as EBITA
(earnings before interest, tax and amortisation, calculated as EBITDA less depreciation) for the 12 months ended 30 June 2017 divided by average capital employed (being total equity and non- current liabilities as per the interim condensed consolidated statement of financial position adjusted for the gross up of finance lease creditors).
BUSINESS REVIEW
2
Results The Group made a positive start to the year, delivering solid first half results that reflect good project execution and lower revenue. Reported revenue for the first half of 2017 was US$3.1 billion (2016: US$3.9 billion) and business performance net profit was US$158 million (2016 restated: US$165 million).
Revenue Revenue for the first half of the year was US$3,126 million (2016: US$3,888 million), down 20% from record levels in 2016. Revenue in Engineering & Construction (E&C) declined reflecting project scheduling. Revenue in Engineering & Production Services (EPS) declined due to lower activity, utilisation and order intake in the period. Integrated Energy Services’ (IES) revenue fell reflecting asset sales in the prior period, lower production, lower investment in our production enhancement contracts (PECs) in Mexico and a delay in the approval of our application to enter the Greater Stella Development licence.
Backlog The Group’s backlog decreased 13% to US$12.5 billion at 30 June 2017 (31 December 2016: US$14.3 billion), reflecting progress delivered on the existing project portfolio and US$1.7 billion of new order intake in the first half of 2017. Reported backlog excludes both the framework agreement signed with Petroleum Development Oman in June, which will add to backlog as projects are sanctioned, and the US$1.0 billion Duqm refinery project award in August 2017.
30 June 2017 31 December 2016
US$ billion US$ billion
Engineering & Construction 7.3 8.2
Engineering & Production Services 2.7 3.5
Integrated Energy Services (IES) 2.5 2.6
Group 12.5 14.3
IES backlog of US$2.5 billion relates to our four PECs in Mexico. In August 2017, the Group sold its 50% interest in the Pánuco PEC to Schlumberger and will cease to recognise US$0.4 billion of backlog from this date. The Group will stop recognising backlog in respect of the three remaining PECs upon completion of their migration to equity contracts.
Earnings Before Interest, Tax, Depreciation and Amortisation (EBITDA) Business Performance EBITDA was 11% lower at US$323 million (2016 restated: US$362 million), predominantly due to our exit from Berantai in Malaysia during the second half of 2016 and project scheduling in E&C. EBITDA before recognising losses on the Laggan-Tormore project in 2016 decreased 30% to US$323 million (2016 restated: US$463 million).
Finance costs/income Finance costs for the first half of the year declined 26% to US$39 million (2016: US$53 million) reflecting a reduction in finance lease interest cost following our exit from Berantai in 2016 (see page 10). Finance income for the first half of the year was US$1 million (2016: US$1 million).
Taxation The Group’s total income tax charge for the first half of the year was US$34 million (2016: US$38 million), an effective tax rate of 31.2% (2016 restated: 65.5%). The Group’s effective tax rate, excluding exceptional items and certain re-measurements, for the first half of the year declined to 19.3% (2016 restated: 20.3%). A number of factors have impacted the overall effective tax rate, with the key drivers being: exceptional items and certain re-measurements, which are not subject to tax; and, the disallowance of expenditure, which is not deductible for tax purposes. In line with prior years, the effective tax rate is also driven by the mix of profits in the jurisdictions in which profits are earned.
Six months ended 30 June 2017 Six months ended 30 June 2016 (restated)
US$ millions Business
performance
Exceptional items and certain re-
measurements
Total Business
performance
Exceptional items and certain re-
measurements
Total
Revenue 3,126 - 3,126 3,888 - 3,888
EBITDA 323 - 323 362 - 362
Net profit 158 (88) 70 165 (153) 12
BUSINESS REVIEW
3
In the 2016 Budget, the UK Government announced proposed changes to the carry forward tax loss relief rules. However, these were not substantively enacted by the reporting date and hence any impact has not been included within the calculations. The impact of the proposed change in legislation is estimated to be a decrease in the carrying value of a recognised deferred tax asset of US$22 million.
Net profit Business performance net profit for the first half of the year was broadly flat at US$158 million (2016 restated: US$165 million). Reported net profit for the period increased to US$70 million (2016: US$12 million), reflecting a lower level of exceptional items and certain re-measurements.
Business performance net profit for the first half of the year before recognising losses on the Laggan-Tormore project in 2016 decreased 41% to US$158 million (2016 restated: US$266 million). Group net margin on the same basis decreased to 5.1% (2016 restated: 6.8%) due to:
• Lower net margins in Engineering & Construction reflecting the impact of project mix and phasing
• Higher net margins in Engineering & Production Services reflecting business mix and the depreciation of sterling
• The net loss in IES of US$19 million (2016: US$18 million net loss) reflecting lower revenue, partly offset by reductions in operating costs, overheads and depreciation
Earnings per share Business performance diluted earnings per share for the first half of the year was 46.06 cents per share (2016 restated: 48.10 cents per share), reflecting the decline in net profit. Total reported diluted earnings per share increased 483% to 20.41 cents per share (2016 restated: 3.50 cents per share), benefitting from a reduction in exceptional items and certain re-measurements in the first half of 2017.
Operating cash flow Net cash outflow from operating activities was US$43 million in the first half of the year (2016: US$205 million net inflow). The key components were:
• A decrease in operating profits before changes in working capital and other non-current items to US$336
million (2016: US$434 million), predominantly due to the elimination of provisions for costs in excess of revenues on a contract
• Net working capital outflows of US$296 million (2016: US$124 million), including: - a decrease in trade and other receivables of US$112 million due mainly to the receipt of a final settlement
on an E&C project partly offset by an increase in retentions - a decrease in trade and other payables of US$254 million, due mainly to reductions in trade payables of
US$155 million, advances received from customers of US$174 million and capital expenditure accrued on Block PM304 in Malaysia. The decline in advances received was partly offset by new advances of US$88 million received during the period in respect of E&C contract awards
- a decrease in accrued contract expenses of US$201 million due to actual costs incurred on E&C projects exceeding their percentage-of-completion based costs
• A reduction in interest paid on borrowing and finance leases to US$35 million (2016: US$51 million)
• An increase in net income taxes paid to US$48 million (2016: US$18 million)
Capital expenditure Total capital expenditure for the first half of 2017 on a cash basis decreased 44% to US$110 million (2016: US$196 million), principally reflecting decreases in capital expenditure on Petrofac JSD6000 installation vessel and development expenditure on Block PM304 in Malaysia.
30 June 2017 30 June 2016
US$ million US$ million
Purchase of property, plant and equipment 48 126
Payments for intangible oil and gas assets 27 27
Additional investment made in available-for-sale investment - 12
Loan in respect of the Greater Stella Area development 35 31
Cash capex 110 196
Balance sheet capital expenditure on property, plant and equipment for the first half of 2017 decreased 60% to US$40 million (2016: US$99 million). In addition, there was an increase of US$35 million (2016: US$31 million)
BUSINESS REVIEW
4
in the loan in respect of the Greater Stella Area development, which represents Petrofac’s contribution to the capital cost of the project. Capital expenditure on intangible oil and gas assets during the period was US$6 million (2016: US$1 million).
Free cash flow Free cash flow declined to a net outflow of US$149 million in the first half of the year (2016: US$17 million net cash inflow) due to net working capital outflows within operating activities, partly offset by a reduction in capital expenditure:
30 June 2017 30 June 2016
US$ million US$ million
Net cash flows (used in)/from operating activities (43) 205
Net cash flows used in investing activities (106) (188)
Free cash flow (149) 17
The Group defines free cash flow as net cash flow from operating activities less net cash flow used in investing activities.
Dividends The decline in – and weaker outlook for - commodity prices has had a significant impact on capital investment in the industry, impacting our cash flow. At the same time, we are committed to maintaining a strong balance sheet and credit rating to ensure that the Group remains competitive in current markets. As a result, the Board is declaring an interim dividend of 12.70 cents per share for the six months ended 30 June 2017 (2016: 22.00 cents), a reduction of 42%. This rebasing of the dividend is part of a range of measures being taken to deliver a sustainable reduction in net debt. The Board recognises the importance of a sustainable dividend to our shareholders. Consequently, the Board intends to target a dividend cover of between 2.0x and 3.0x business performance earnings as we transition back towards a low capital intensity business model. It is further proposed that the interim payment each year will be approximately 33% of the prior year total dividend. The interim dividend will be paid on 20 October 2017 to eligible shareholders on the register at 22 September 2017 (the ‘record date’). Shareholders who have not elected to receive dividends in US dollars will receive a sterling equivalent. Shareholders have the opportunity to elect by close of business on the record date to change their dividend currency election.
Employees At 30 June 2017, the Group had approximately 13,000 employees (including long-term contractors) (31 December 2016: 13,500).
BUSINESS REVIEW
5
Balance sheet IES carrying value The carrying value of Integrated Energy Services’ portfolio is US$1,101 million (31 December 2016: US$1,208 million), reflecting impairment charges of US$90 million in the first half of the year:
Oil and gas assets (Block
PM304, Chergui and
PECs) US$m
Intangible oil and gas assets (Block PM304, and other pre-
development costs) US$m
Greater Stella Area
development (note 13)
US$m Total
US$m
Cost
At 1 January 2017 1,146 80 276 1,502
Additions 8 6 35 49
Write off/accrual adjustment – (8) – (8)
Transfers (5) 5 – –
At 30 June 2017 1,149 83 311 1,543
Depreciation
At 1 January 2017 (466) – – (466)
Charge for the period (54) – – (54)
Charge for impairment (7) – (83) (90)
At 30 June 2017 (527) – (83) (610)
Net carrying amount: At 30 June 2017
622 83 228 933
At 31 December 2016 680 80 276 1,086
Other (assets held for sale US$97m, FPSO Opportunity US$10m, interest in associates US$61m (note 12)) 168
Total (excluding working capital) 1,101
Working capital The net working capital balance at 30 June 2017 was US$676 million (31 December 2016: US$277 million). The key movements in working capital during the period were:
• A decrease in trade and other receivables of US$124 million to US$2,038 million (31 December 2016:
US$2,162 million) due mainly to the receipt of a final settlement on an E&C project
• A decrease in trade and other payables of US$304 million to US$1,670 million (31 December 2016: US$1,974 million), due to reductions in trade payables, net advances received from customers and capital expenditure accrued on Block PM304 in Malaysia
• A decrease in accrued contract expenses of US$201 million to US$1,859 million (31 December 2016: US$2,060 million) due to actual costs incurred on E&C projects exceeding their percentage-of-completion based costs
Finance leases
Net finance lease liabilities decreased 13% to US$158 million at 30 June 2017 (31 December 2016: US$182 million; see note 13 to the financial statements) and predominantly relate to two leased floating production facilities on Block PM304 in Malaysia. Total equity Total equity at 30 June 2017 was US$1,069 million (31 December 2016: US$1,123 million), mainly reflecting the reported profit for the period of US$75 million and other comprehensive income of US$40 million, less dividends paid in the period of US$151 million and treasury shares purchased of US$39 million, which are held in the Petrofac Employees Benefit Trust for the purpose of making awards under the Group’s share schemes.
BUSINESS REVIEW
6
Return on capital employed
The Group’s return on capital employed for the twelve months ended 30 June 2017 increased to 15% (12 months ended 30 June 2016: 12%), reflecting improved profitability and a decrease in capital employed.
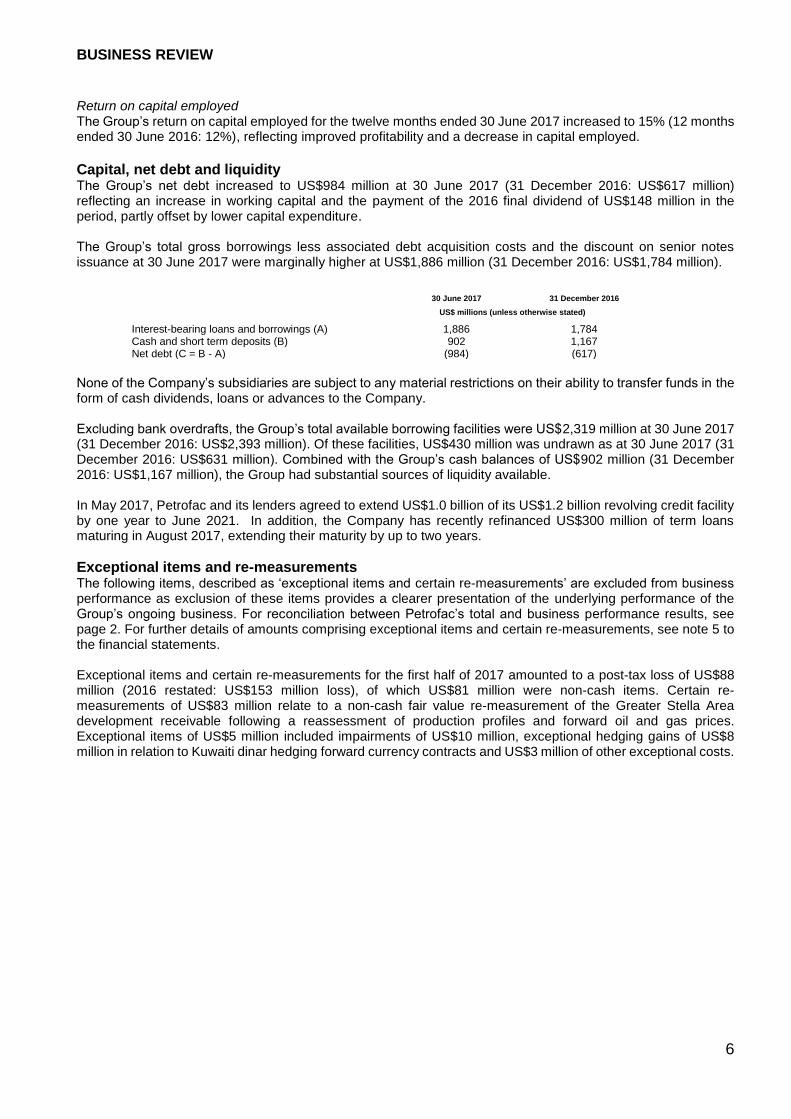
Capital, net debt and liquidity The Group’s net debt increased to US$984 million at 30 June 2017 (31 December 2016: US$617 million) reflecting an increase in working capital and the payment of the 2016 final dividend of US$148 million in the period, partly offset by lower capital expenditure. The Group’s total gross borrowings less associated debt acquisition costs and the discount on senior notes issuance at 30 June 2017 were marginally higher at US$1,886 million (31 December 2016: US$1,784 million).
30 June 2017 31 December 2016
US$ millions (unless otherwise stated)
Interest-bearing loans and borrowings (A) 1,886 1,784 Cash and short term deposits (B) 902 1,167 Net debt (C = B - A) (984) (617)
None of the Company’s subsidiaries are subject to any material restrictions on their ability to transfer funds in the form of cash dividends, loans or advances to the Company. Excluding bank overdrafts, the Group’s total available borrowing facilities were US$2,319 million at 30 June 2017 (31 December 2016: US$2,393 million). Of these facilities, US$430 million was undrawn as at 30 June 2017 (31 December 2016: US$631 million). Combined with the Group’s cash balances of US$902 million (31 December 2016: US$1,167 million), the Group had substantial sources of liquidity available. In May 2017, Petrofac and its lenders agreed to extend US$1.0 billion of its US$1.2 billion revolving credit facility by one year to June 2021. In addition, the Company has recently refinanced US$300 million of term loans maturing in August 2017, extending their maturity by up to two years.
Exceptional items and re-measurements The following items, described as ‘exceptional items and certain re-measurements’ are excluded from business performance as exclusion of these items provides a clearer presentation of the underlying performance of the Group’s ongoing business. For reconciliation between Petrofac’s total and business performance results, see page 2. For further details of amounts comprising exceptional items and certain re-measurements, see note 5 to the financial statements. Exceptional items and certain re-measurements for the first half of 2017 amounted to a post-tax loss of US$88 million (2016 restated: US$153 million loss), of which US$81 million were non-cash items. Certain re-measurements of US$83 million relate to a non-cash fair value re-measurement of the Greater Stella Area development receivable following a reassessment of production profiles and forward oil and gas prices. Exceptional items of US$5 million included impairments of US$10 million, exceptional hedging gains of US$8 million in relation to Kuwaiti dinar hedging forward currency contracts and US$3 million of other exceptional costs.
BUSINESS REVIEW
7
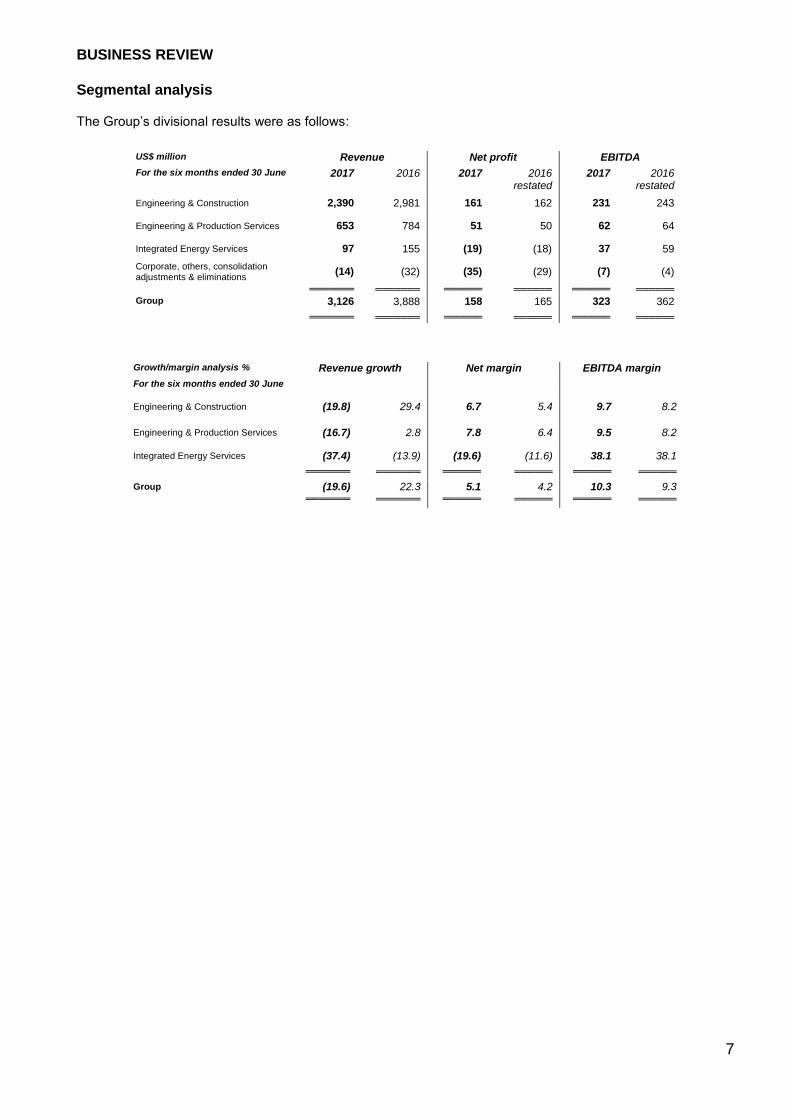
Segmental analysis The Group’s divisional results were as follows:
US$ million Revenue Net profit EBITDA
For the six months ended 30 June 2017 2016 2017 2016 restated
2017 2016 restated
Engineering & Construction 2,390 2,981 161 162 231 243
Engineering & Production Services 653 784 51 50 62 64
Integrated Energy Services 97 155 (19) (18) 37 59
Corporate, others, consolidation adjustments & eliminations
(14) (32) (35) (29) (7) (4)
═══════ ═══════ ══════ ══════ ══════ ══════ Group 3,126 3,888 158 165 323 362
═══════ ═══════ ══════ ══════ ══════ ══════
Growth/margin analysis % Revenue growth Net margin EBITDA margin
For the six months ended 30 June
Engineering & Construction (19.8) 29.4 6.7 5.4 9.7 8.2
Engineering & Production Services (16.7) 2.8 7.8 6.4 9.5 8.2
Integrated Energy Services (37.4) (13.9) (19.6) (11.6) 38.1 38.1
═══════ ═══════ ══════ ══════ ══════ ══════
Group (19.6) 22.3 5.1 4.2 10.3 9.3
═══════ ═══════ ══════ ══════ ══════ ══════
BUSINESS REVIEW
8
Engineering & Construction The Engineering & Construction division delivers onshore and offshore engineering, procurement, construction, installation and commissioning services on a lump-sum basis. We have more than 35 years of expertise in this area and our services encompass both greenfield and brownfield developments. We have delivered good progress across our portfolio of Engineering & Construction projects. For example, in the period we delivered and installed all modules to the Upper Zakum islands in Abu Dhabi and we introduced hydrocarbons to the Khazzan central processing facility in Oman. We also started up the process units and are progressing towards performance testing and initial acceptance on the Sohar Refinery Improvement project in Oman. New awards New order intake for the first six months of the year totalled US$1.4 billion, including the Gathering Centre 32 (GC 32) project in Kuwait. This lump-sum engineering, procurement and construction (EPC) project, valued at approximately US$1.3 billion, is the first sour gathering centre to be developed in the Burgan oil field, south east of Kuwait. The scope of work for GC 32 includes greenfield activities with tie-in works to existing brownfield infrastructure, and will have the capacity to produce around 120,000 barrels of oil per day together with associated water, gas and condensate. Work is scheduled to be completed in mid-2020. After the period end, Petrofac, in a 50/50 joint venture with Samsung Engineering, received notification of intent to award a contract worth approximately US$2 billion with Duqm Refinery and Petrochemical Industries LLC (DRPIC) in the southern part of Oman. Work on the 47-month project will commence shortly, subject to financial closure and full notice to proceed from DRPIC. Petrofac’s and Samsung’s scope of work includes engineering, procurement, construction, commissioning, training and start-up operations for all the utilities and offsites at Duqm. Results Revenue for the first half of the year was down 20% from record levels in 2016 to US$2,390 million (2016: US$2,981 million) due to project scheduling.
Business performance net profit was broadly unchanged at US$161 million (2016 restated: US$162 million),
reflecting lower revenue, but higher reported net margins. Business performance net profit for the first half of the
year before recognising losses on the Laggan-Tormore project decreased 39% to US$161 million (2016 restated:
US$263 million). Net margin on the same basis decreased to 6.7% (2016 restated: 8.8%) reflecting the impact
of project mix and phasing. Engineering & Construction backlog stood at US$7.3 billion at 30 June 2017 (31 December 2016: US$8.2 billion), reflecting progress delivered on the existing project portfolio and relatively low new order intake in the first half of 2017.
Engineering & Construction headcount was 7,100 at 30 June 2017 (31 December 2016: 7,500).
BUSINESS REVIEW
9
Engineering & Production Services
The Engineering & Production Services division brings together our services’ capability across brownfield projects
and operations, greenfield projects through concept, feasibility and front-end engineering and full project delivery
as well as a range of operations, maintenance and engineering services for onshore and offshore projects.
The Engineering & Production Services division delivered a solid operational performance in a challenging market
environment. It secured awards and extensions with new and existing clients worth approximately US$0.3 billion
in the first half of 2017, predominantly in the UK, Iraq and Kuwait. In June 2017, we secured a 10-year framework
agreement with Petroleum Development Oman for the provision of EPCm support services for major oil and gas
projects. The framework agreement, which has an additional five-year option, will add to backlog as projects are
sanctioned.
Results Revenue for the first half of the year declined 17% to US$653 million (2016: US$784 million). The decrease was predominantly due to lower activity on operations and engineering services contracts in the UK, including the upgrade and modification works on the FPF1 floating production facility which were substantially completed during 2016, and the depreciation of sterling. Business performance net profit for the first half of the year was US$51 million (2016: US$50 million), with net margin increasing to 7.8% (2016: 6.4%). The increase in net margin reflects business mix and performance, including the phasing of EPCm projects, and the impact of the depreciation of sterling.
Engineering & Productions Services backlog declined to US$2.7 billion at 30 June 2017 (31 December 2016: US$3.5 billion) reflecting lower order intake in the first half of the year. Headcount stood at 5,100 at 30 June 2017 (31 December 2016: 5,200).
BUSINESS REVIEW
10
Integrated Energy Services Integrated Energy Services provides an integrated service for clients under flexible commercial models that are aligned with their requirements. Our projects cover upstream developments - both greenfield and brownfield, related energy infrastructure projects, and can include investment. IES deploys the Group’s capabilities using a range of commercial frameworks, including Production Enhancement Contracts (PECs) and traditional Equity Upstream Investment models including both Production Sharing Contracts (PSCs) and concession agreements.
Production Enhancement Contracts The Group earns a tariff per barrel on PECs for an agreed level of baseline production and an enhanced tariff per barrel on incremental production. In the period, the Group earned tariff income on a total of 2.5 million barrels of oil equivalent (mboe) in the first half of 2017 (2016: 3.4 mboe). The 26% decrease in production reflected our exit from the Ticleni PEC during the second half of 2016 and lower investment in Mexico as we prepare for migration of our PECs into equity contracts as part of the ongoing energy reforms. In August 2017, the Group sold its 50% interest in the Pánuco PEC to Schlumberger. The total potential cash and deferred consideration is in line with net book value. Equity Upstream Investments
The Greater Stella Area (GSA) development commenced production in February 2017, although the ramp-up in production has been slower than expected. There was no contribution to production from GSA due to delay in approval of our formal entry onto the licence, which we now expect will occur in the second half of 2017. Net entitlement production from Block PM304 and the Chergui gas plant was lower at 0.9 mboe for the first half of the year (2016: 1.0 mboe). The Chergui gas plant in Tunisia recommenced production towards the end of May 2017 after extensive shut-ins due to civil unrest. Production from Block PM304 in Malaysia was marginally lower than in the first half of 2016, but in line with expectations. Risk Service Contract We reached mutual agreement with PETRONAS in July 2016 for the cessation of the Berantai RSC, offshore Malaysia. As part of the agreement, the Berantai FPSO, which was held as an asset under finance lease, was transferred to PETRONAS during the second half of 2016. Results Revenue for the first six months of the year declined 37% to US$97 million (2016: US$155 million), predominantly reflecting our lower production in the period and our exit from both the Berantai and Ticleni contracts during the second half of 2016. The business performance net loss was US$19 million for the first six months of the year, broadly unchanged year on year (2016: US$18 million net loss). Lower production, lower cost recovery in Mexico and lower tax credits, were offset by a reduction in operating costs, overheads and depreciation. IES’ exceptional items and certain re-measurements for the first half of 2017 totalled US$87 million after tax (2016: US$115 million; see note 5 to the financial statements), predominantly reflecting a US$83 million non-cash fair value re-measurement of the Greater Stella Area development receivable following a reassessment of production profiles and forward oil and gas prices. IES backlog relates to four PECs in Mexico and was broadly unchanged at US$2.5 billion at 30 June 2017 (31 December 2016: US$2.6 billion). The Group will cease to recognise US$0.4 billion of backlog in August 2017 following the sale of the Group’s interest in the Pánuco PEC. The Group will stop recognising backlog in respect of the remaining three PECs upon completion of their migration to equity contracts. Headcount in the IES division was 700 at 30 June 2017 (31 December 2016: 800).
BUSINESS REVIEW
11
Principal risks and uncertainties Principal risks are a risk or combination of risks that, given the Group’s current position, could seriously affect the performance, future prospects or reputation of the Group. They include those risks that could materially threaten our business model, performance, solvency or liquidity, or prevent us from meeting our strategic objectives. In terms of identifying and managing the principal risks and uncertainties, our systems of risk management and internal control are founded upon deployment of our Enterprise Risk Management Framework (based upon ISO 31000:2009); and our Internal Control Framework, details of which are included in the 2016 Annual Report and Accounts (pages 26 to 30). The Board has oversight of enterprise risk management. The Board identifies and conducts a robust assessment of principal risks facing the company and their connection to viability. Responsibility for monitoring and reviewing the integrity and effectiveness of the Group’s overall systems of risk management and internal controls is delegated to the Audit Committee. A summary of the principal risks and uncertainties facing the Group is set out below, full details of which are included in the 2016 Annual Report and Accounts (pages 31 to 35).
• Market conditions
• Worsening political risks in key geographies
• Failure to meet future order targets
• Operational and project performance
• Application of the commercial strategy
• IT resilience
• Counterparty risk
• Loss of financial capacity
• Dilution of company culture and/or capability
• Compliance and controls
The Audit Committee and the Board have continued to review these principal risks and uncertainties throughout the first half of 2017 and consider that they remain largely unchanged, other than the risk relating to compliance and controls, which has increased since the December 2016 year end assessment. The Board is overseeing a review of the Group’s compliance framework and in particular the anti-bribery and corruption controls in place. Whilst we can exercise direct control over most of the principal risks, some are not directly within our control, such as market conditions and worsening political risks in key geographies. We reported in May 2017 that the Serious Fraud Office had begun a formal investigation related to Unaoil and other agents. The Group is committed to cooperating with the ongoing SFO investigation. No other new risks have been identified for the remainder of 2017. We have considered the potential impact of the EU referendum result and believe that as an international Group, we have little exposure to the European Continent and do not expect that the United Kingdom leaving the EU will have any significant impact on our business.
BUSINESS REVIEW
12
Outlook The Group has secured US$2.7 billion of new orders in the year to date, evidence of our continued competitiveness in markets that remain challenging. Tendering activity remains high, but competitive. We are well positioned on a number of bids and have a healthy order backlog that provides good revenue visibility for the medium-term. Group net profit for the full year 2017 is expected to be weighted to the second half of the year. We expect IES to deliver EBITDA for the full year 2017 of US$80 million to US$100 million, reflecting an anticipated improvement in operating performance following the start-up of production at Chergui and our expected entry onto the Greater Stella Area development licence in the third quarter of the year. We are taking a range of measures to deliver a sustainable reduction in net debt and strengthen our balance sheet. These include a relentless focus on operational excellence, reducing capital investment, rebasing our dividend and divesting non-core assets. Group capital expenditure is expected to be in the range US$200 million to US$250 million in 2017, below previous guidance. Net debt is expected to reduce during the second half of the year.
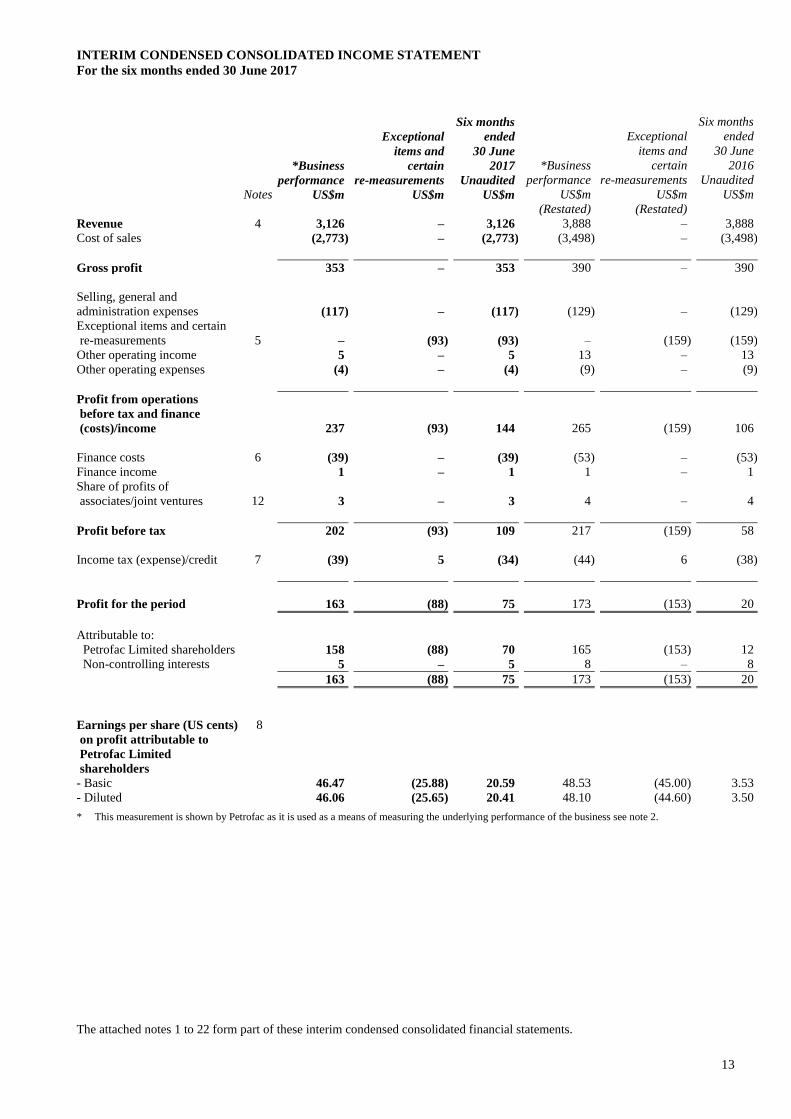
INTERIM CONDENSED CONSOLIDATED INCOME STATEMENT
For the six months ended 30 June 2017
13
Exceptional
Six months
ended
Exceptional
Six months
ended
items and 30 June items and 30 June
*Business certain 2017 *Business certain 2016
performance re-measurements Unaudited performance re-measurements Unaudited
Notes US$m US$m US$m US$m US$m US$m
(Restated) (Restated)
Revenue 4 3,126 – 3,126 3,888 – 3,888
Cost of sales (2,773) – (2,773) (3,498) – (3,498)
Gross profit 353 – 353 390 – 390
Selling, general and
administration expenses
(117)
–
(117)
(129)
–
(129)
Exceptional items and certain
re-measurements
5
–
(93)
(93)
–
(159)
(159)
Other operating income 5 – 5 13 – 13
Other operating expenses (4) – (4) (9) – (9)
Profit from operations
before tax and finance
(costs)/income 237 (93) 144 265 (159) 106
Finance costs 6 (39) – (39) (53) – (53)
Finance income 1 – 1 1 – 1
Share of profits of
associates/joint ventures
12
3
–
3
4
–
4
Profit before tax 202 (93) 109 217 (159) 58
Income tax (expense)/credit 7 (39) 5 (34) (44) 6 (38)
Profit for the period 163 (88) 75 173 (153) 20
Attributable to:
Petrofac Limited shareholders 158 (88) 70 165 (153) 12
Non-controlling interests 5 – 5 8 – 8
163 (88) 75 173 (153) 20
Earnings per share (US cents)
on profit attributable to
8
Petrofac Limited
shareholders
- Basic 46.47 (25.88) 20.59 48.53 (45.00) 3.53
- Diluted 46.06 (25.65) 20.41 48.10 (44.60) 3.50
* This measurement is shown by Petrofac as it is used as a means of measuring the underlying performance of the business see note 2.
The attached notes 1 to 22 form part of these interim condensed consolidated financial statements.
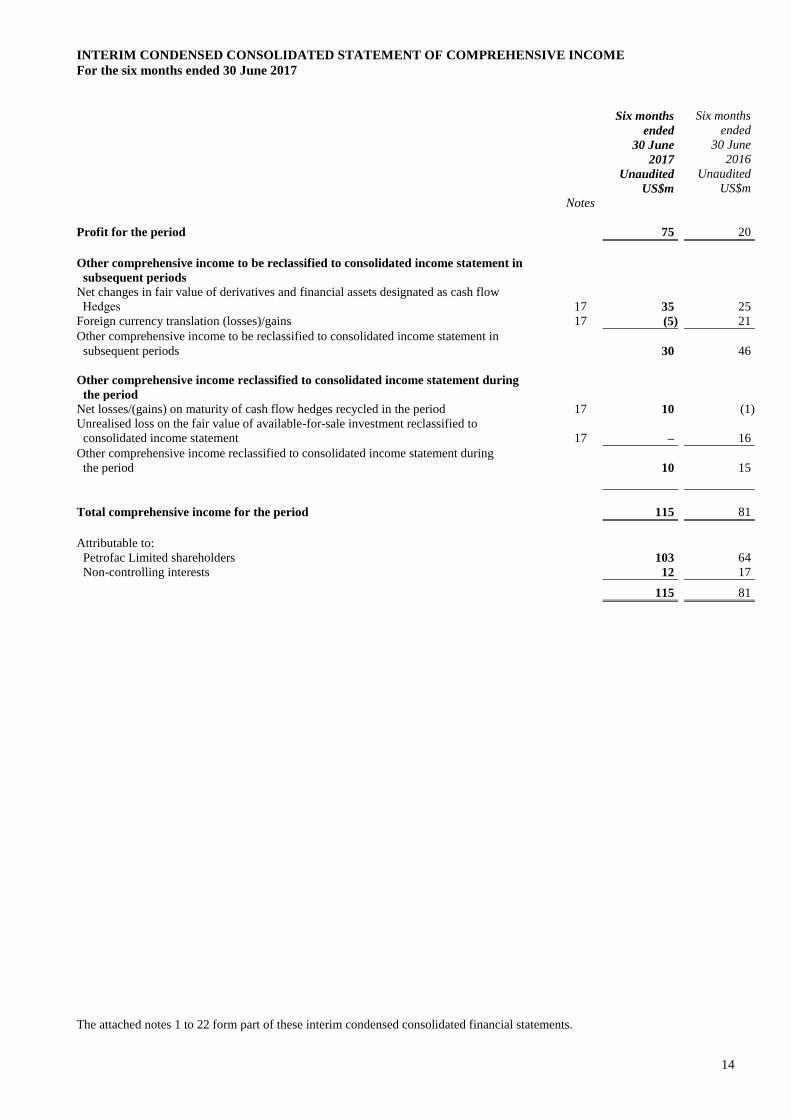
INTERIM CONDENSED CONSOLIDATED STATEMENT OF COMPREHENSIVE INCOME
For the six months ended 30 June 2017
14
Six months
ended
Six months
ended
30 June 30 June
2017 2016
Unaudited Unaudited
US$m US$m
Notes
Profit for the period 75 20
Other comprehensive income to be reclassified to consolidated income statement in
subsequent periods
Net changes in fair value of derivatives and financial assets designated as cash flow
Hedges 17 35 25
Foreign currency translation (losses)/gains 17 (5) 21
Other comprehensive income to be reclassified to consolidated income statement in
subsequent periods
30
46
Other comprehensive income reclassified to consolidated income statement during
the period
Net losses/(gains) on maturity of cash flow hedges recycled in the period 17 10 (1)
Unrealised loss on the fair value of available-for-sale investment reclassified to
consolidated income statement 17 – 16
Other comprehensive income reclassified to consolidated income statement during
the period
10
15
Total comprehensive income for the period 115 81
Attributable to:
Petrofac Limited shareholders 103 64
Non-controlling interests 12 17
115 81
The attached notes 1 to 22 form part of these interim condensed consolidated financial statements.
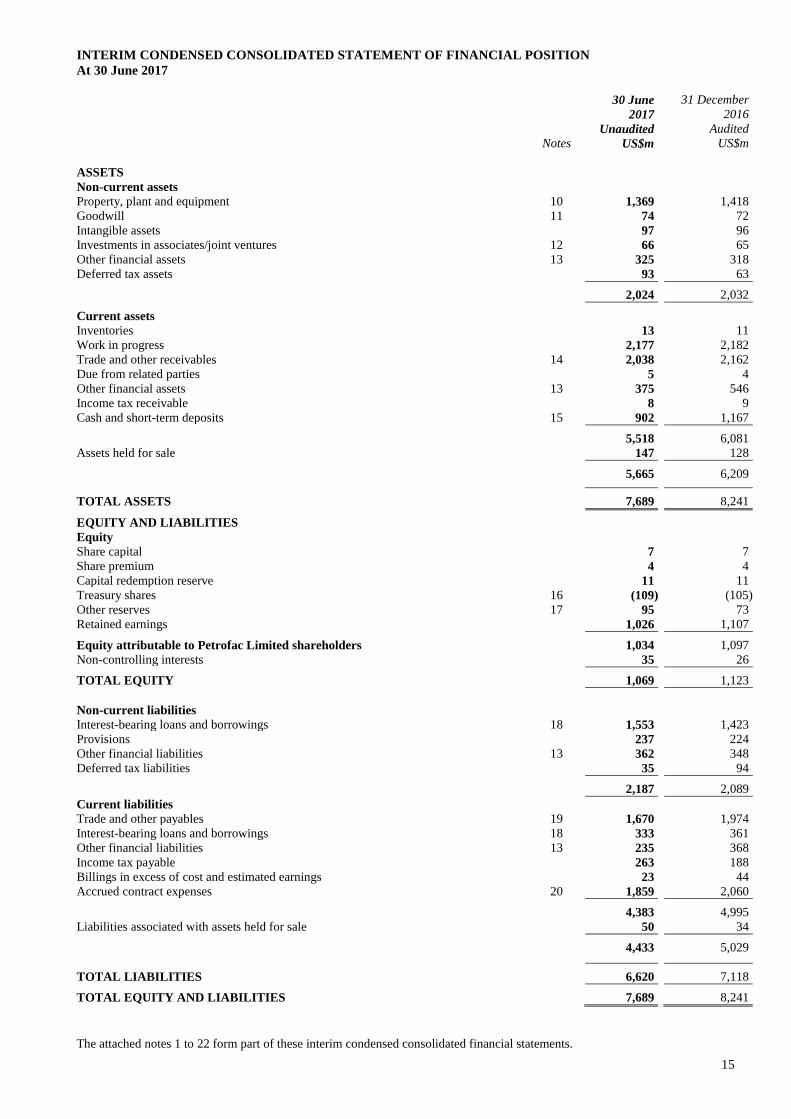
INTERIM CONDENSED CONSOLIDATED STATEMENT OF FINANCIAL POSITION
At 30 June 2017
15
30 June 31 December
2017 2016
Unaudited Audited
Notes US$m US$m
ASSETS
Non-current assets
Property, plant and equipment 10 1,369 1,418
Goodwill 11 74 72
Intangible assets 97 96
Investments in associates/joint ventures 12 66 65
Other financial assets 13 325 318
Deferred tax assets 93 63
2,024 2,032
Current assets
Inventories 13 11
Work in progress 2,177 2,182
Trade and other receivables 14 2,038 2,162
Due from related parties 5 4
Other financial assets 13 375 546
Income tax receivable 8 9
Cash and short-term deposits 15 902 1,167
5,518 6,081
Assets held for sale 147 128
5,665 6,209
TOTAL ASSETS 7,689 8,241
EQUITY AND LIABILITIES
Equity
Share capital 7 7
Share premium 4 4
Capital redemption reserve 11 11
Treasury shares 16 (109) (105)
Other reserves 17 95 73
Retained earnings 1,026 1,107
Equity attributable to Petrofac Limited shareholders 1,034 1,097
Non-controlling interests 35 26
TOTAL EQUITY 1,069 1,123
Non-current liabilities
Interest-bearing loans and borrowings 18 1,553 1,423
Provisions 237 224
Other financial liabilities 13 362 348
Deferred tax liabilities 35 94
2,187 2,089
Current liabilities
Trade and other payables 19 1,670 1,974
Interest-bearing loans and borrowings 18 333 361
Other financial liabilities 13 235 368
Income tax payable 263 188
Billings in excess of cost and estimated earnings 23 44
Accrued contract expenses 20 1,859 2,060
4,383 4,995
Liabilities associated with assets held for sale 50 34
4,433 5,029
TOTAL LIABILITIES 6,620 7,118
TOTAL EQUITY AND LIABILITIES 7,689 8,241
The attached notes 1 to 22 form part of these interim condensed consolidated financial statements.
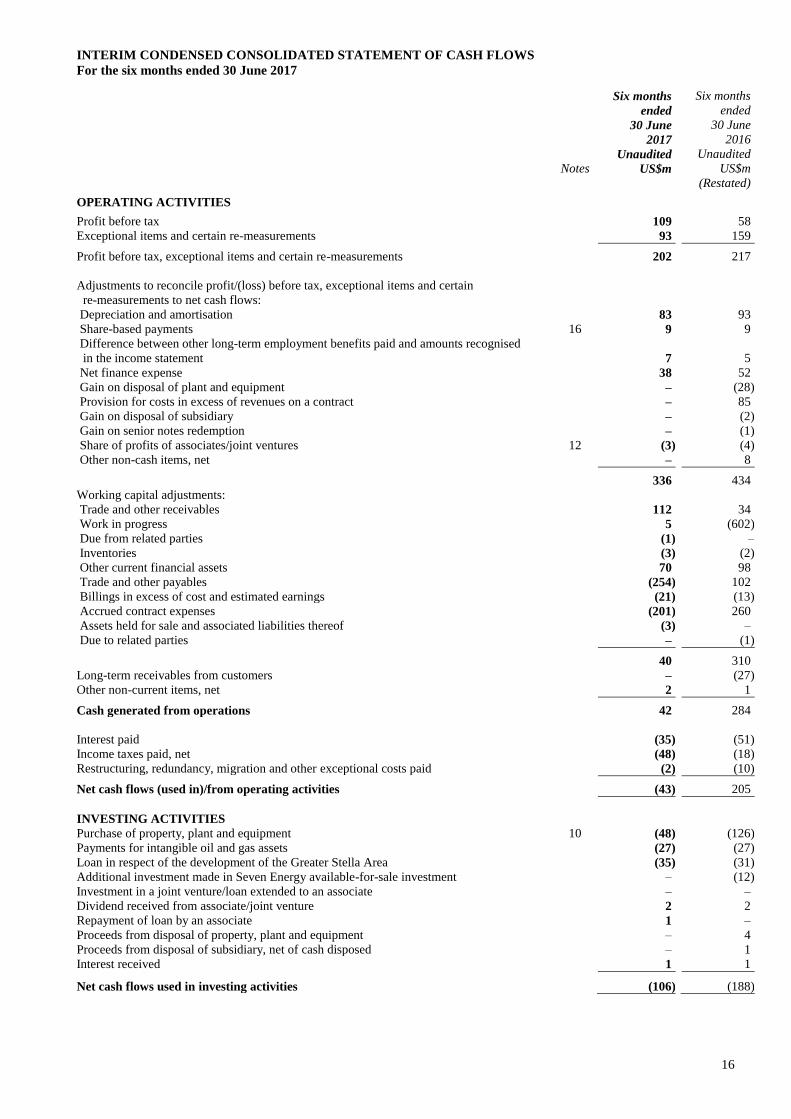
INTERIM CONDENSED CONSOLIDATED STATEMENT OF CASH FLOWS
For the six months ended 30 June 2017
16
Six months
ended
Six months
ended
30 June 30 June
2017 2016
Unaudited Unaudited
Notes US$m US$m
(Restated)
OPERATING ACTIVITIES
Profit before tax 109 58
Exceptional items and certain re-measurements 93 159
Profit before tax, exceptional items and certain re-measurements 202 217
Adjustments to reconcile profit/(loss) before tax, exceptional items and certain
re-measurements to net cash flows:
Depreciation and amortisation 83 93
Share-based payments 16 9 9
Difference between other long-term employment benefits paid and amounts recognised
in the income statement
7
5
Net finance expense 38 52
Gain on disposal of plant and equipment – (28)
Provision for costs in excess of revenues on a contract – 85
Gain on disposal of subsidiary – (2)
Gain on senior notes redemption – (1)
Share of profits of associates/joint ventures 12 (3) (4)
Other non-cash items, net – 8
336 434
Working capital adjustments:
Trade and other receivables 112 34
Work in progress 5 (602)
Due from related parties (1) –
Inventories (3) (2)
Other current financial assets 70 98
Trade and other payables (254) 102
Billings in excess of cost and estimated earnings (21) (13)
Accrued contract expenses (201) 260
Assets held for sale and associated liabilities thereof (3) –
Due to related parties – (1)
40 310
Long-term receivables from customers – (27)
Other non-current items, net 2 1
Cash generated from operations 42 284
Interest paid (35) (51)
Income taxes paid, net (48) (18)
Restructuring, redundancy, migration and other exceptional costs paid (2) (10)
Net cash flows (used in)/from operating activities (43) 205
INVESTING ACTIVITIES
Purchase of property, plant and equipment 10 (48) (126)
Payments for intangible oil and gas assets (27) (27)
Loan in respect of the development of the Greater Stella Area (35) (31)
Additional investment made in Seven Energy available-for-sale investment – (12)
Investment in a joint venture/loan extended to an associate – –
Dividend received from associate/joint venture 2 2
Repayment of loan by an associate 1 –
Proceeds from disposal of property, plant and equipment – 4
Proceeds from disposal of subsidiary, net of cash disposed – 1
Interest received 1 1
Net cash flows used in investing activities (106) (188)
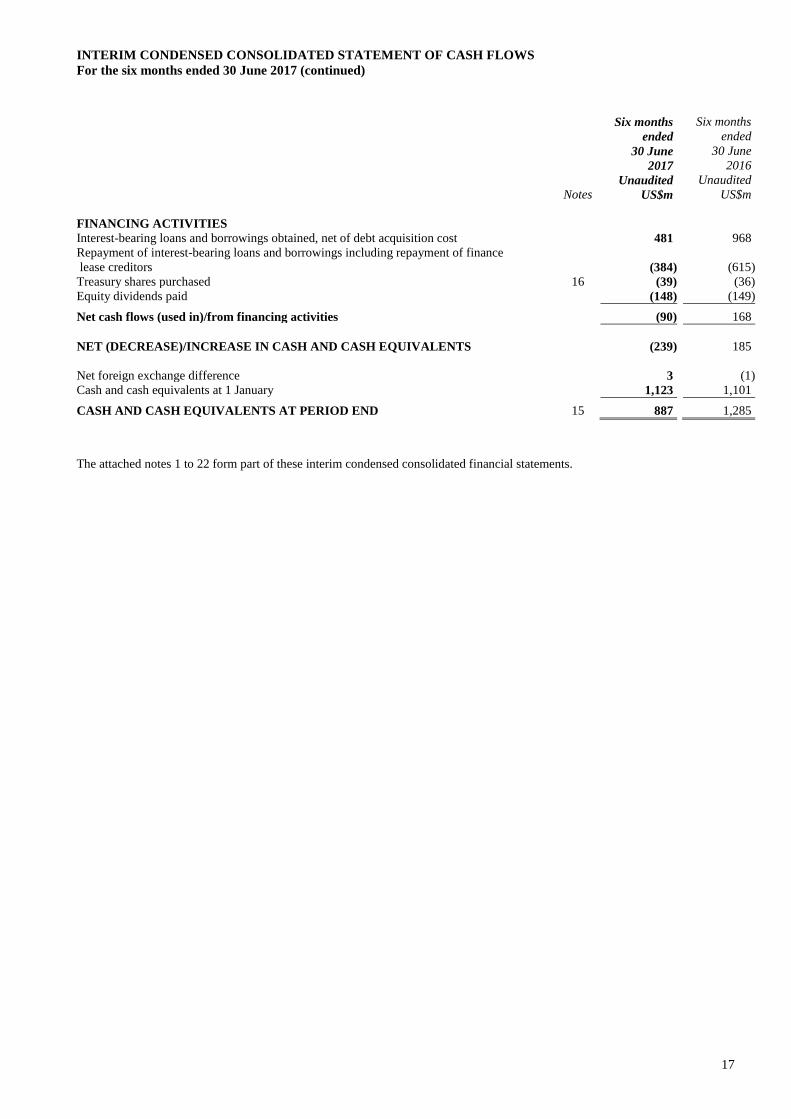
INTERIM CONDENSED CONSOLIDATED STATEMENT OF CASH FLOWS
For the six months ended 30 June 2017 (continued)
17
Six months
ended
Six months
ended
30 June 30 June
2017 2016
Unaudited Unaudited
Notes US$m US$m
FINANCING ACTIVITIES
Interest-bearing loans and borrowings obtained, net of debt acquisition cost 481 968
Repayment of interest-bearing loans and borrowings including repayment of finance
lease creditors
(384)
(615)
Treasury shares purchased 16 (39) (36)
Equity dividends paid (148) (149)
Net cash flows (used in)/from financing activities (90) 168
NET (DECREASE)/INCREASE IN CASH AND CASH EQUIVALENTS (239) 185
Net foreign exchange difference 3 (1)
Cash and cash equivalents at 1 January 1,123 1,101
CASH AND CASH EQUIVALENTS AT PERIOD END 15 887 1,285
The attached notes 1 to 22 form part of these interim condensed consolidated financial statements.
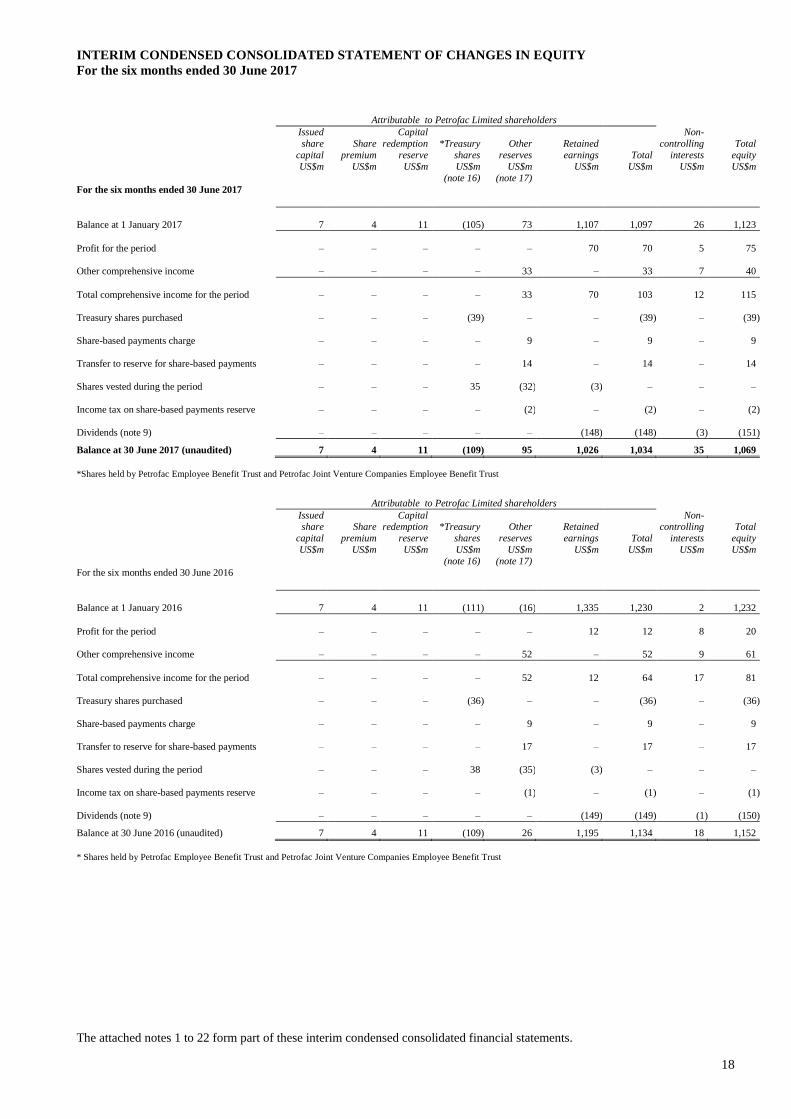
INTERIM CONDENSED CONSOLIDATED STATEMENT OF CHANGES IN EQUITY
For the six months ended 30 June 2017
18
Attributable to Petrofac Limited shareholders
Issued Capital Non-
share Share redemption *Treasury Other Retained controlling Total
capital premium reserve shares reserves earnings Total interests equity
US$m US$m US$m US$m US$m US$m US$m US$m US$m
(note 16) (note 17)
For the six months ended 30 June 2017
Balance at 1 January 2017 7 4 11 (105) 73 1,107 1,097 26 1,123
Profit for the period – – – – – 70 70 5 75
Other comprehensive income – – – – 33 – 33 7 40
Total comprehensive income for the period – – – – 33 70 103 12 115
Treasury shares purchased – – – (39) – – (39) – (39)
Share-based payments charge – – – – 9 – 9 – 9
Transfer to reserve for share-based payments – – – – 14 – 14 – 14
Shares vested during the period – – – 35 (32) (3) – – –
Income tax on share-based payments reserve – – – – (2) – (2) – (2)
Dividends (note 9) – – – – – (148) (148) (3) (151)
Balance at 30 June 2017 (unaudited) 7 4 11 (109) 95 1,026 1,034 35 1,069
*Shares held by Petrofac Employee Benefit Trust and Petrofac Joint Venture Companies Employee Benefit Trust
Attributable to Petrofac Limited shareholders
Issued Capital Non- share Share redemption *Treasury Other Retained controlling Total
capital premium reserve shares reserves earnings Total interests equity
US$m US$m US$m US$m US$m US$m US$m US$m US$m
(note 16) (note 17)
For the six months ended 30 June 2016
Balance at 1 January 2016 7 4 11 (111) (16) 1,335 1,230 2 1,232
Profit for the period – – – – – 12 12 8 20
Other comprehensive income – – – – 52 – 52 9 61
Total comprehensive income for the period – – – – 52 12 64 17 81
Treasury shares purchased – – – (36) – – (36) – (36)
Share-based payments charge – – – – 9 – 9 – 9
Transfer to reserve for share-based payments – – – – 17 – 17 – 17
Shares vested during the period – – – 38 (35) (3) – – –
Income tax on share-based payments reserve – – – – (1) – (1) – (1)
Dividends (note 9) – – – – – (149) (149) (1) (150)
Balance at 30 June 2016 (unaudited) 7 4 11 (109) 26 1,195 1,134 18 1,152
* Shares held by Petrofac Employee Benefit Trust and Petrofac Joint Venture Companies Employee Benefit Trust
The attached notes 1 to 22 form part of these interim condensed consolidated financial statements.
NOTES TO THE INTERIM CONDENSED CONSOLIDATED FINANCIAL STATEMENTS
For the six months ended 30 June 2017
19
1 CORPORATE INFORMATION
Petrofac Limited is a limited liability company registered and domiciled in Jersey under the Companies (Jersey) Law 1991 and is
the holding company for the international group of Petrofac subsidiaries (together “the Group”). The Group’s principal activity is
the provision of services to the oil and gas production and processing industry. The interim condensed consolidated financial
statements of the Group for the six months ended 30 June 2017 were authorised for issue in accordance with a resolution of the
Board of Directors on 29 August 2017.
2 BASIS OF PREPARATION AND ACCOUNTING POLICIES
Basis of preparation
The interim condensed consolidated financial statements for the six months ended 30 June 2017 have been prepared in accordance
with IAS 34 ‘Interim Financial Reporting’ and applicable requirements of Jersey law. The interim condensed consolidated financial
statements do not include all of the information and disclosures required in the annual financial statements and should be read in
conjunction with the consolidated financial statements of the Group as at and for the year ended 31 December 2016.
The presentation currency of the interim condensed consolidated financial statements is United States dollars (US$) and all values
in the interim condensed consolidated financial statements are rounded to the nearest million (US$m), except where otherwise
stated.
Presentation of results
Petrofac presents its results in the interim condensed consolidated income statement to identify separately the contribution of
impairments and certain re-measurements, notably impairments, certain re-measurements, restructuring and redundancy costs,
contract migration costs, material deferred tax movements arising due to foreign exchange differences in jurisdictions where tax is
computed based on the functional currency of the country and material forward rate movements in Kuwaiti dinar forward currency
contracts. This presentation provides readers with a clear and consistent presentation of the underlying operating performance of
the Group’s ongoing business (“Business Performance”).
New accounting standards, interpretations and amendments adopted by the Group
The accounting policies adopted in the preparation of these interim condensed consolidated financial statements are consistent with
those followed in the preparation of the Group’s annual consolidated financial statements for the year ended 31 December 2016.
No new accounting standards or amendments that apply for the first time in 2017 have a material impact on the interim condensed
consolidated financial statements of the Group.
Accounting standards issued but not yet effective
The Group has not early adopted any other accounting standard, interpretation or amendment that has been issued but is not yet
effective. Standards issued but not yet effective up to the date of issuance of the Group’s interim condensed consolidated financial
statements are listed below. The Group intends to adopt these standards when they become effective.
IFRS 9 Financial Instruments
IFRS 9 Financial Instruments addresses the classification, measurement and derecognition of financial assets and financial
liabilities, introduces new rules for hedge accounting and a new impairment model for financial assets. The group will adopt IFRS
9 when it becomes mandatory on 1 January 2018.
The Group does not expect the new guidance will have a significant impact on the financial asset classification. However
measurement of its financial assets are expected to be impacted by the new impairment model that requires the recognition of
impairment provisions based on expected credit losses (ECL), rather than incurred credit losses as is the case under IAS 39. For the
Group, the new impairment model under IFRS 9 applies to its financial assets classified at amortised cost and contract assets under
IFRS 15 Revenue from Contracts with Customers. The Group is currently assessing the impact of a new impairment model on its
financial assets and contract assets and plans to provide an update in the 2017 annual report and accounts.
There will be no impact on the Group’s accounting for financial liabilities, as the new requirements only affect the accounting for
financial liabilities that are designated at fair value through profit or loss and the Group does not have any such liabilities. The
derecognition rules have been transferred from IAS 39 Financial Instruments: Recognition and Measurement and have not been
changed.
The new hedge accounting rules will align the accounting for hedging instruments more closely with the Group’s risk management
practices. Generally, additional relationships may be eligible for hedge accounting, as the standard introduces a more principles-
based approach. The Group is currently in the process of identifying any new hedge relationship that will qualify for hedge
accounting under IFRS 9, assessing the impact of new hedging rules on its financial performance and financial position and plans
to provide an update in the 2017 annual report and accounts.
The new standard also introduces expanded disclosure requirements and changes in presentation. These are expected to change the
nature and extent of the Group’s disclosures about its financial instruments particularly in 2018 in the year of the adoption of the
new standard.
NOTES TO THE INTERIM CONDENSED CONSOLIDATED FINANCIAL STATEMENTS
For the six months ended 30 June 2017
20
2 BASIS OF PREPARATION AND ACCOUNTING POLICIES (continued)
Restatement
The material forward rate movements in Kuwaiti dinar forward currency contracts were reported as exceptional items in the 2016
annual report and accounts to provide readers with a clear and consistent presentation of the underlying operating performance of
the Group’s ongoing business. However, such forward rate movements were not treated as exceptional items for the period ended
30 June 2016 and therefore, to achieve comparability with the prior period, the US$30m loss relating to forward rate movements
in Kuwaiti dinar forward currency contracts has been reclassified from cost of sales to exceptional items and certain re-
measurements for the period ended 30 June 2016. This reclassification results in higher business performance profit for the E&C
segment and higher exceptional items and certain re-measurements of US$30m for the period ended 30 June 2016. In the interim
condensed consolidated statement of cash flows, US$30m has been re-classified from the other non-cash items (net) to the
exceptional items and certain re-measurement line. Consequently it has no impact on the net cash flows from operating activities
for the period ended 30 June 2016.
Going concern
The Company’s business activities together with the factors likely to affect its future development, performance and position are
set out in the Group’s annual report and accounts for the year ended 31 December 2016 on pages 16 to 23. The financial position
of the Company, its cash flows, liquidity position and borrowing facilities are described in the financial review on pages 48 to 51.
In addition, note 32 to the financial statements includes the Company’s objectives, policies and processes for managing its capital,
its financial risk management objectives, details of its financial instruments and hedging activities and its exposures to credit risk
and liquidity risk.
The Company has considerable financial resources together with long-term contracts with customers and suppliers across different
geographic areas and industries. Consequently, the Directors believe that the Company is well placed to manage its business risks
successfully. The Directors have a reasonable expectation that the Company has adequate resources to continue in operational
existence for the foreseeable future. Thus, they continue to adopt the going concern basis of accounting in preparing the interim
2017 financial statements.
NOTES TO THE INTERIM CONDENSED CONSOLIDATED FINANCIAL STATEMENTS
For the six months ended 30 June 2017
21
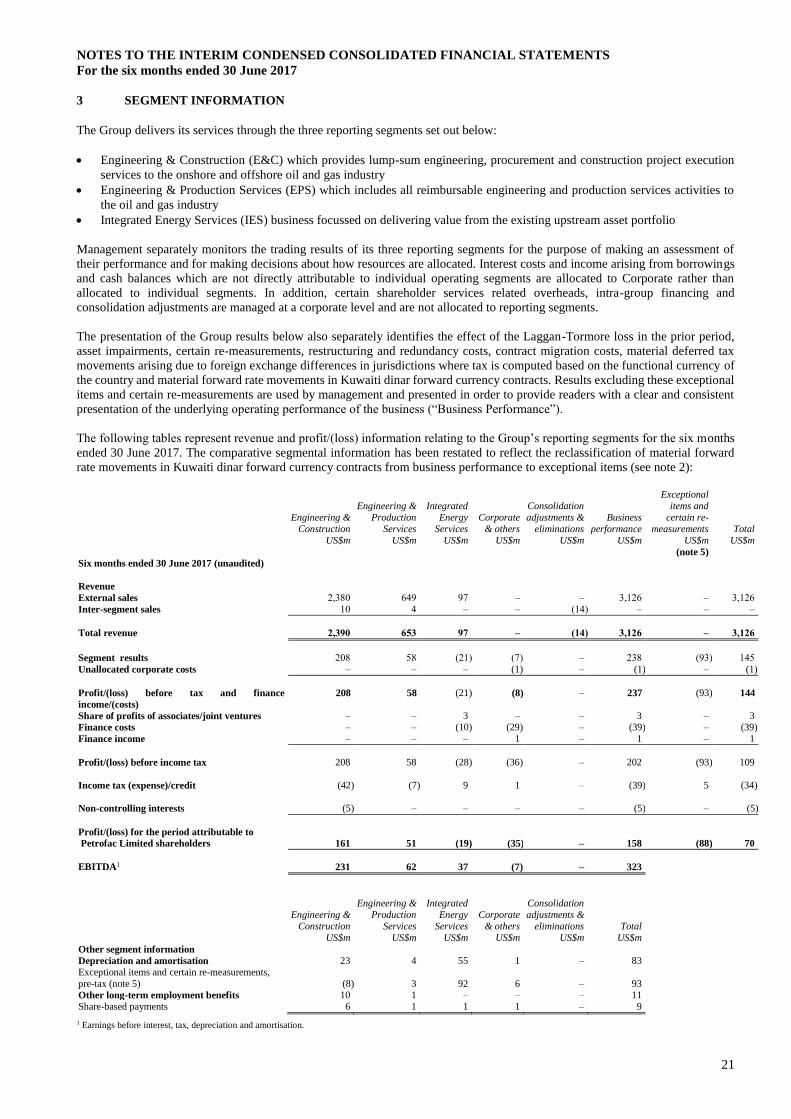
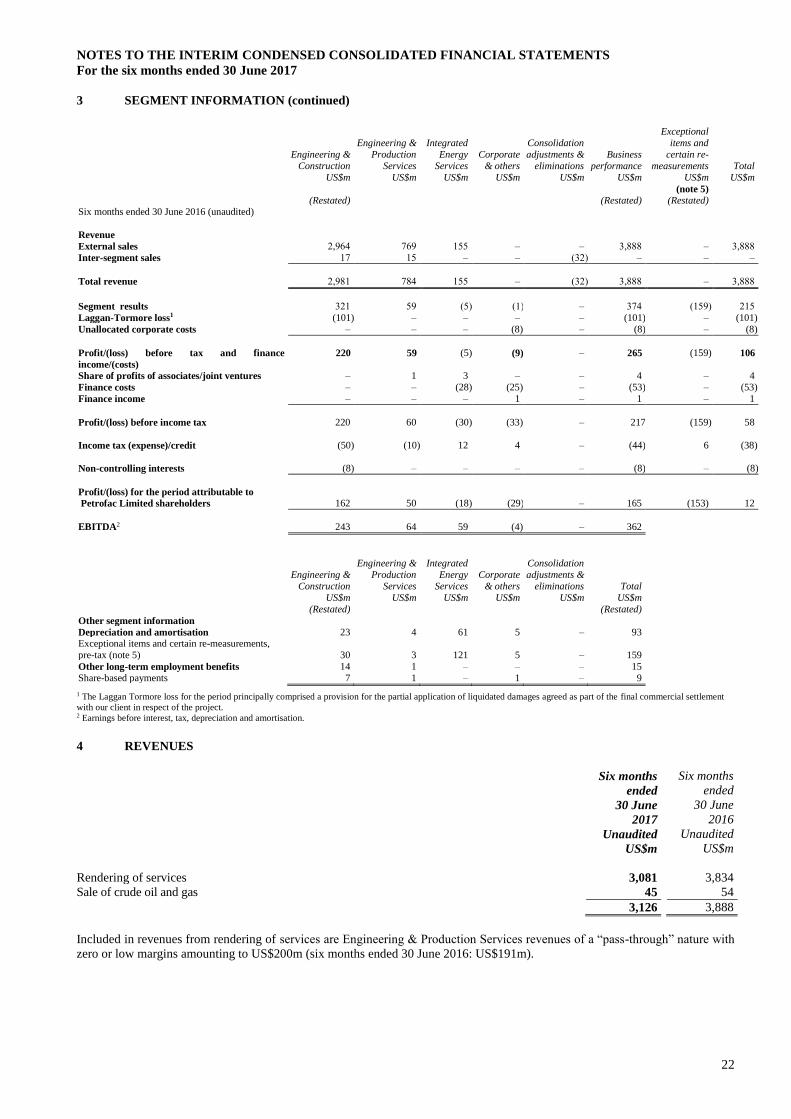
3 SEGMENT INFORMATION
The Group delivers its services through the three reporting segments set out below:
• Engineering & Construction (E&C) which provides lump-sum engineering, procurement and construction project execution
services to the onshore and offshore oil and gas industry
• Engineering & Production Services (EPS) which includes all reimbursable engineering and production services activities to
the oil and gas industry
• Integrated Energy Services (IES) business focussed on delivering value from the existing upstream asset portfolio
Management separately monitors the trading results of its three reporting segments for the purpose of making an assessment of
their performance and for making decisions about how resources are allocated. Interest costs and income arising from borrowings
and cash balances which are not directly attributable to individual operating segments are allocated to Corporate rather than
allocated to individual segments. In addition, certain shareholder services related overheads, intra-group financing and
consolidation adjustments are managed at a corporate level and are not allocated to reporting segments.
The presentation of the Group results below also separately identifies the effect of the Laggan-Tormore loss in the prior period,
asset impairments, certain re-measurements, restructuring and redundancy costs, contract migration costs, material deferred tax
movements arising due to foreign exchange differences in jurisdictions where tax is computed based on the functional currency of
the country and material forward rate movements in Kuwaiti dinar forward currency contracts. Results excluding these exceptional
items and certain re-measurements are used by management and presented in order to provide readers with a clear and consistent
presentation of the underlying operating performance of the business (“Business Performance”).
The following tables represent revenue and profit/(loss) information relating to the Group’s reporting segments for the six months
ended 30 June 2017. The comparative segmental information has been restated to reflect the reclassification of material forward
rate movements in Kuwaiti dinar forward currency contracts from business performance to exceptional items (see note 2):
Engineering &
Construction
Engineering &
Production
Services
Integrated
Energy
Services
Corporate
& others
Consolidation
adjustments &
eliminations
Business
performance
Exceptional
items and
certain re-
measurements
Total
US$m US$m US$m US$m US$m US$m US$m US$m
(note 5)
Six months ended 30 June 2017 (unaudited)
Revenue
External sales 2,380 649 97 – – 3,126 – 3,126
Inter-segment sales 10 4 – – (14) – – –
Total revenue 2,390 653 97 – (14) 3,126 – 3,126
Segment results 208 58 (21) (7) – 238 (93) 145
Unallocated corporate costs – – – (1) – (1) – (1)
Profit/(loss) before tax and finance
income/(costs)
208 58 (21) (8) – 237 (93) 144
Share of profits of associates/joint ventures – – 3 – – 3 – 3
Finance costs – – (10) (29) – (39) – (39)
Finance income – – – 1 – 1 – 1
Profit/(loss) before income tax 208 58 (28) (36) – 202 (93) 109
Income tax (expense)/credit (42) (7) 9 1 – (39) 5 (34)
Non-controlling interests (5) – – – – (5) – (5)
Profit/(loss) for the period attributable to
Petrofac Limited shareholders
161
51
(19)
(35)
–
158
(88)
70
EBITDA1 231 62 37 (7) – 323
Engineering &
Construction
Engineering &
Production
Services
Integrated
Energy
Services
Corporate
& others
Consolidation
adjustments &
eliminations
Total
US$m US$m US$m US$m US$m US$m
Other segment information
Depreciation and amortisation 23 4 55 1 – 83
Exceptional items and certain re-measurements,
pre-tax (note 5)
(8)
3
92
6
–
93
Other long-term employment benefits 10 1 – – – 11
Share-based payments 6 1 1 1 – 9
1 Earnings before interest, tax, depreciation and amortisation.
NOTES TO THE INTERIM CONDENSED CONSOLIDATED FINANCIAL STATEMENTS
For the six months ended 30 June 2017
22
3 SEGMENT INFORMATION (continued)
Engineering &
Construction
Engineering &
Production
Services
Integrated
Energy
Services
Corporate
& others
Consolidation
adjustments &
eliminations
Business
performance
Exceptional
items and
certain re-
measurements
Total
US$m US$m US$m US$m US$m US$m US$m US$m
(note 5)
(Restated) (Restated) (Restated) Six months ended 30 June 2016 (unaudited)
Revenue
External sales 2,964 769 155 – – 3,888 – 3,888
Inter-segment sales 17 15 – – (32) – – –
Total revenue 2,981 784 155 – (32) 3,888 – 3,888
Segment results 321 59 (5) (1) – 374 (159) 215
Laggan-Tormore loss1 (101) – – – – (101) – (101)
Unallocated corporate costs – – – (8) – (8) – (8)
Profit/(loss) before tax and finance
income/(costs)
220 59 (5) (9) – 265 (159) 106
Share of profits of associates/joint ventures – 1 3 – – 4 – 4
Finance costs – – (28) (25) – (53) – (53)
Finance income – – – 1 – 1 – 1
Profit/(loss) before income tax 220 60 (30) (33) – 217 (159) 58
Income tax (expense)/credit (50) (10) 12 4 – (44) 6 (38)
Non-controlling interests (8) – – – – (8) – (8)
Profit/(loss) for the period attributable to Petrofac Limited shareholders
162
50
(18)
(29)
–
165
(153)
12
EBITDA2 243 64 59 (4) – 362
Engineering &
Construction
Engineering &
Production
Services
Integrated
Energy
Services
Corporate
& others
Consolidation
adjustments &
eliminations
Total
US$m US$m US$m US$m US$m US$m
(Restated) (Restated)
Other segment information
Depreciation and amortisation 23 4 61 5 – 93 Exceptional items and certain re-measurements,
pre-tax (note 5)
30
3
121
5
–
159
Other long-term employment benefits 14 1 – – – 15
Share-based payments 7 1 – 1 – 9
1 The Laggan Tormore loss for the period principally comprised a provision for the partial application of liquidated damages agreed as part of the final commercial settlement
with our client in respect of the project. 2 Earnings before interest, tax, depreciation and amortisation.
4 REVENUES
Six months
ended
Six months
ended
30 June
2017
30 June
2016
Unaudited Unaudited
US$m US$m
Rendering of services 3,081 3,834
Sale of crude oil and gas 45 54
3,126 3,888
Included in revenues from rendering of services are Engineering & Production Services revenues of a “pass-through” nature with
zero or low margins amounting to US$200m (six months ended 30 June 2016: US$191m).
NOTES TO THE INTERIM CONDENSED CONSOLIDATED FINANCIAL STATEMENTS
For the six months ended 30 June 2017
23
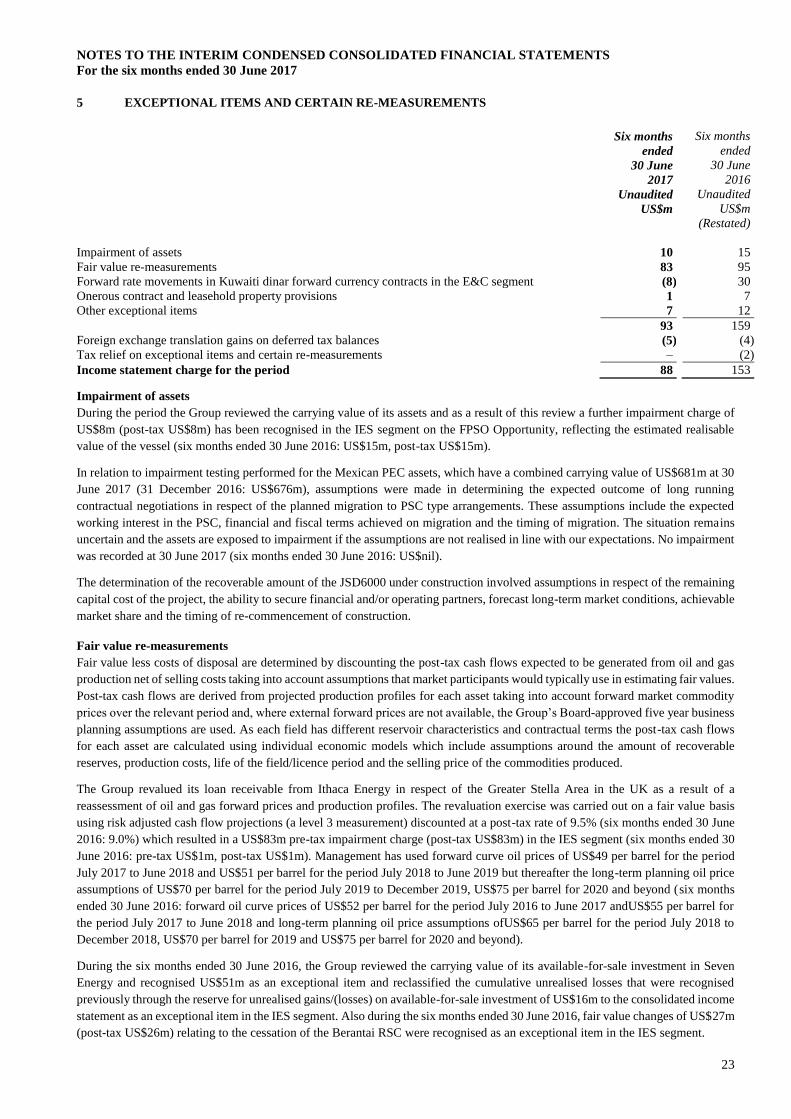
5 EXCEPTIONAL ITEMS AND CERTAIN RE-MEASUREMENTS
Six months
ended
Six months
ended
30 June
2017
30 June
2016
Unaudited Unaudited
US$m US$m
(Restated)
Impairment of assets 10 15
Fair value re-measurements 83 95
Forward rate movements in Kuwaiti dinar forward currency contracts in the E&C segment (8) 30
Onerous contract and leasehold property provisions 1 7
Other exceptional items 7 12
93 159
Foreign exchange translation gains on deferred tax balances (5) (4)
Tax relief on exceptional items and certain re-measurements – (2)
Income statement charge for the period 88 153
Impairment of assets
During the period the Group reviewed the carrying value of its assets and as a result of this review a further impairment charge of
US$8m (post-tax US$8m) has been recognised in the IES segment on the FPSO Opportunity, reflecting the estimated realisable
value of the vessel (six months ended 30 June 2016: US$15m, post-tax US$15m).
In relation to impairment testing performed for the Mexican PEC assets, which have a combined carrying value of US$681m at 30
June 2017 (31 December 2016: US$676m), assumptions were made in determining the expected outcome of long running
contractual negotiations in respect of the planned migration to PSC type arrangements. These assumptions include the expected
working interest in the PSC, financial and fiscal terms achieved on migration and the timing of migration. The situation remains
uncertain and the assets are exposed to impairment if the assumptions are not realised in line with our expectations. No impairment
was recorded at 30 June 2017 (six months ended 30 June 2016: US$nil).
The determination of the recoverable amount of the JSD6000 under construction involved assumptions in respect of the remaining
capital cost of the project, the ability to secure financial and/or operating partners, forecast long-term market conditions, achievable
market share and the timing of re-commencement of construction.
Fair value re-measurements
Fair value less costs of disposal are determined by discounting the post-tax cash flows expected to be generated from oil and gas
production net of selling costs taking into account assumptions that market participants would typically use in estimating fair values.
Post-tax cash flows are derived from projected production profiles for each asset taking into account forward market commodity
prices over the relevant period and, where external forward prices are not available, the Group’s Board-approved five year business
planning assumptions are used. As each field has different reservoir characteristics and contractual terms the post-tax cash flows
for each asset are calculated using individual economic models which include assumptions around the amount of recoverable
reserves, production costs, life of the field/licence period and the selling price of the commodities produced.
The Group revalued its loan receivable from Ithaca Energy in respect of the Greater Stella Area in the UK as a result of a
reassessment of oil and gas forward prices and production profiles. The revaluation exercise was carried out on a fair value basis
using risk adjusted cash flow projections (a level 3 measurement) discounted at a post-tax rate of 9.5% (six months ended 30 June
2016: 9.0%) which resulted in a US$83m pre-tax impairment charge (post-tax US$83m) in the IES segment (six months ended 30
June 2016: pre-tax US$1m, post-tax US$1m). Management has used forward curve oil prices of US$49 per barrel for the period
July 2017 to June 2018 and US$51 per barrel for the period July 2018 to June 2019 but thereafter the long-term planning oil price
assumptions of US$70 per barrel for the period July 2019 to December 2019, US$75 per barrel for 2020 and beyond (six months
ended 30 June 2016: forward oil curve prices of US$52 per barrel for the period July 2016 to June 2017 andUS$55 per barrel for
the period July 2017 to June 2018 and long-term planning oil price assumptions ofUS$65 per barrel for the period July 2018 to
December 2018, US$70 per barrel for 2019 and US$75 per barrel for 2020 and beyond).
During the six months ended 30 June 2016, the Group reviewed the carrying value of its available-for-sale investment in Seven
Energy and recognised US$51m as an exceptional item and reclassified the cumulative unrealised losses that were recognised
previously through the reserve for unrealised gains/(losses) on available-for-sale investment of US$16m to the consolidated income
statement as an exceptional item in the IES segment. Also during the six months ended 30 June 2016, fair value changes of US$27m
(post-tax US$26m) relating to the cessation of the Berantai RSC were recognised as an exceptional item in the IES segment.
NOTES TO THE INTERIM CONDENSED CONSOLIDATED FINANCIAL STATEMENTS
For the six months ended 30 June 2017
24
5 EXCEPTIONAL ITEMS AND CERTAIN RE-MEASUREMENTS (continued)
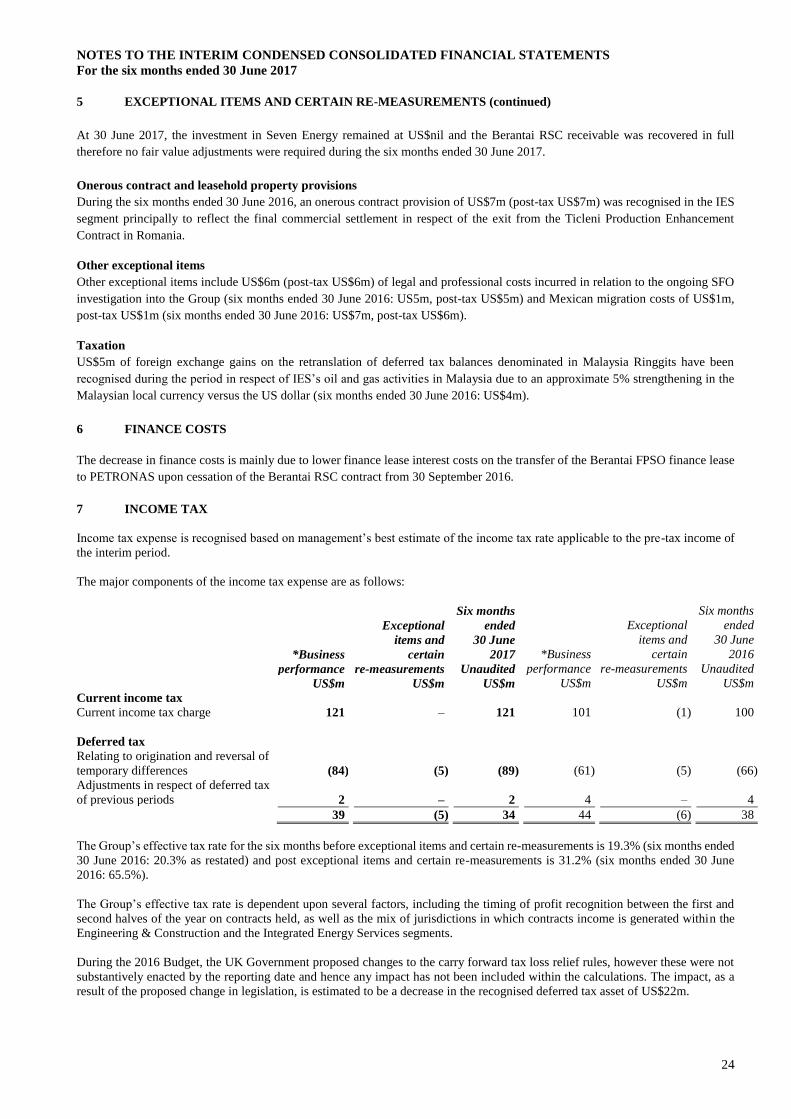
At 30 June 2017, the investment in Seven Energy remained at US$nil and the Berantai RSC receivable was recovered in full
therefore no fair value adjustments were required during the six months ended 30 June 2017.
Onerous contract and leasehold property provisions
During the six months ended 30 June 2016, an onerous contract provision of US$7m (post-tax US$7m) was recognised in the IES
segment principally to reflect the final commercial settlement in respect of the exit from the Ticleni Production Enhancement
Contract in Romania.
Other exceptional items
Other exceptional items include US$6m (post-tax US$6m) of legal and professional costs incurred in relation to the ongoing SFO
investigation into the Group (six months ended 30 June 2016: US5m, post-tax US$5m) and Mexican migration costs of US$1m,
post-tax US$1m (six months ended 30 June 2016: US$7m, post-tax US$6m).
Taxation
US$5m of foreign exchange gains on the retranslation of deferred tax balances denominated in Malaysia Ringgits have been
recognised during the period in respect of IES’s oil and gas activities in Malaysia due to an approximate 5% strengthening in the
Malaysian local currency versus the US dollar (six months ended 30 June 2016: US$4m).
6 FINANCE COSTS
The decrease in finance costs is mainly due to lower finance lease interest costs on the transfer of the Berantai FPSO finance lease
to PETRONAS upon cessation of the Berantai RSC contract from 30 September 2016.
7 INCOME TAX
Income tax expense is recognised based on management’s best estimate of the income tax rate applicable to the pre-tax income of
the interim period.
The major components of the income tax expense are as follows:
Exceptional
Six months
ended
Exceptional
Six months
ended
items and 30 June items and 30 June
*Business certain 2017 *Business certain 2016
performance re-measurements Unaudited performance re-measurements Unaudited
US$m US$m US$m US$m US$m US$m
Current income tax
Current income tax charge 121 – 121 101 (1) 100
Deferred tax
Relating to origination and reversal of
temporary differences
(84)
(5)
(89)
(61)
(5)
(66)
Adjustments in respect of deferred tax
of previous periods
2
–
2
4
–
4
39 (5) 34 44 (6) 38
The Group’s effective tax rate for the six months before exceptional items and certain re-measurements is 19.3% (six months ended
30 June 2016: 20.3% as restated) and post exceptional items and certain re-measurements is 31.2% (six months ended 30 June
2016: 65.5%).
The Group’s effective tax rate is dependent upon several factors, including the timing of profit recognition between the first and
second halves of the year on contracts held, as well as the mix of jurisdictions in which contracts income is generated within the
Engineering & Construction and the Integrated Energy Services segments.
During the 2016 Budget, the UK Government proposed changes to the carry forward tax loss relief rules, however these were not
substantively enacted by the reporting date and hence any impact has not been included within the calculations. The impact, as a
result of the proposed change in legislation, is estimated to be a decrease in the recognised deferred tax asset of US$22m.
NOTES TO THE INTERIM CONDENSED CONSOLIDATED FINANCIAL STATEMENTS
For the six months ended 30 June 2017
25
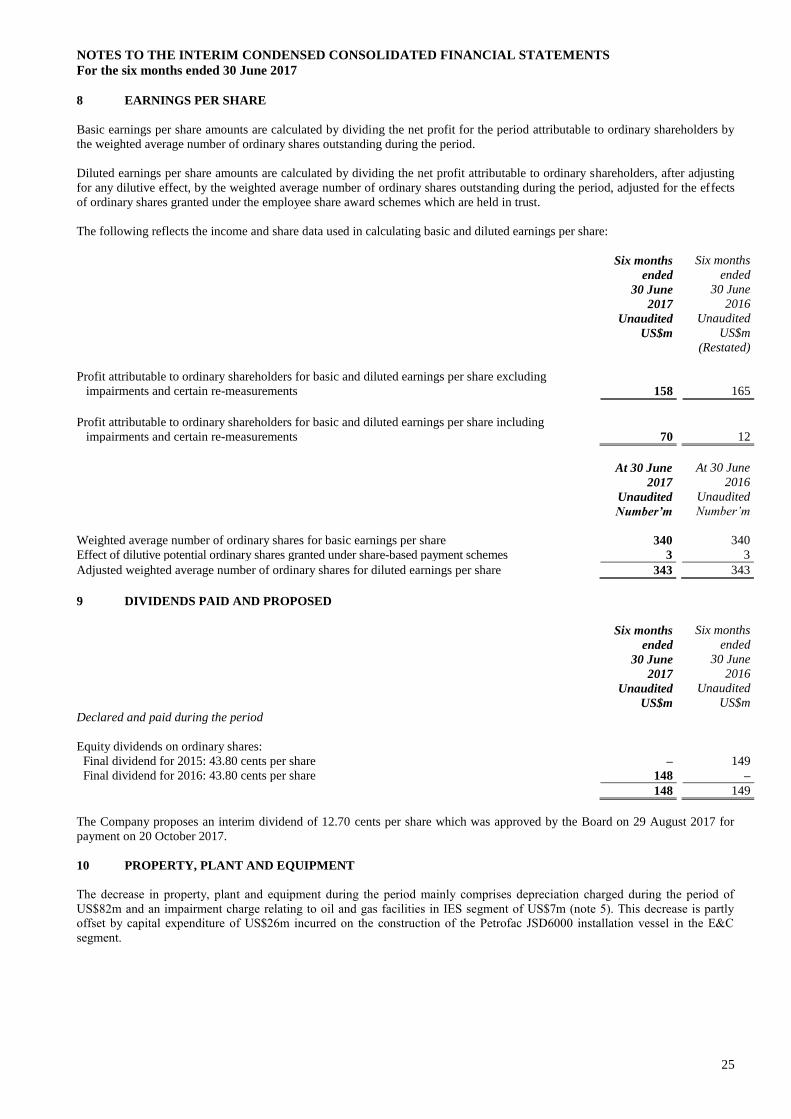
8 EARNINGS PER SHARE
Basic earnings per share amounts are calculated by dividing the net profit for the period attributable to ordinary shareholders by
the weighted average number of ordinary shares outstanding during the period.
Diluted earnings per share amounts are calculated by dividing the net profit attributable to ordinary shareholders, after adjusting
for any dilutive effect, by the weighted average number of ordinary shares outstanding during the period, adjusted for the effects
of ordinary shares granted under the employee share award schemes which are held in trust.
The following reflects the income and share data used in calculating basic and diluted earnings per share:
Six months
ended
Six months
ended
30 June
2017
30 June
2016
Unaudited Unaudited
US$m US$m
(Restated)
Profit attributable to ordinary shareholders for basic and diluted earnings per share excluding
impairments and certain re-measurements
158
165
Profit attributable to ordinary shareholders for basic and diluted earnings per share including
impairments and certain re-measurements
70
12
At 30 June
2017
At 30 June
2016
Unaudited Unaudited
Number’m Number’m
Weighted average number of ordinary shares for basic earnings per share 340 340
Effect of dilutive potential ordinary shares granted under share-based payment schemes 3 3
Adjusted weighted average number of ordinary shares for diluted earnings per share 343 343
9 DIVIDENDS PAID AND PROPOSED
Six months
ended
Six months
ended
30 June
2017
30 June
2016
Unaudited Unaudited
US$m US$m
Declared and paid during the period
Equity dividends on ordinary shares:
Final dividend for 2015: 43.80 cents per share – 149
Final dividend for 2016: 43.80 cents per share 148 –
148 149
The Company proposes an interim dividend of 12.70 cents per share which was approved by the Board on 29 August 2017 for
payment on 20 October 2017.
10 PROPERTY, PLANT AND EQUIPMENT
The decrease in property, plant and equipment during the period mainly comprises depreciation charged during the period of
US$82m and an impairment charge relating to oil and gas facilities in IES segment of US$7m (note 5). This decrease is partly
offset by capital expenditure of US$26m incurred on the construction of the Petrofac JSD6000 installation vessel in the E&C
segment.
NOTES TO THE INTERIM CONDENSED CONSOLIDATED FINANCIAL STATEMENTS
For the six months ended 30 June 2017
26
11 GOODWILL
A summary of the movement in goodwill is presented below:
30 June
2017
31 December
2016
Unaudited Audited
US$m US$m
Opening balance 72 80
Exchange difference 2 (8)
74 72
The carrying amount of goodwill allocated to each group of cash-generating units is shown below:
30 June
2017
31 December
2016
Unaudited Audited
US$m US$m
Engineering & Construction 32 32
Engineering & Production Services 42 40
74 72
12 INVESTMENTS IN ASSOCIATES / JOINT VENTURES
Associates
Joint
ventures
Total
US$m US$m US$m
As at 1 January 2016 (audited) 69 5 74
Additions 7 – 7
Share of profits 11 1 12
Dividends received (27) (1) (28)
As at 1 January 2017 (audited) 60 5 65
Share of profits 3 – 3
Dividends received (2) – (2)
Balance at 30 June 2017 (unaudited) 61 5 66
The transfer of ownership of the Berantai FPSO to PETRONAS at 30 September 2016 resulted in a higher share of associate income
and dividend receipts to the Group during 2016.
NOTES TO THE INTERIM CONDENSED CONSOLIDATED FINANCIAL STATEMENTS
For the six months ended 30 June 2017
27
13 FINANCIAL INSTRUMENTS
Classification
30 June
2017
31 December
2016
Unaudited Audited
US$m US$m
OTHER FINANCIAL ASSETS
Non-Current
Receivable from joint venture partners Loans and receivables 249 235
Forward currency contracts designated as hedges Designated as cash flow hedges 36 42
Restricted cash Loans and receivables 40 41
325 318
Current
Receivable in respect of the development of the Greater Stella
Area
Fair value through profit and loss
228
276
Receivable from joint venture partners Loans and receivables 114 179
Receivable under the Berantai RSC Fair value through profit and loss – 71
Forward currency contracts designated as hedges Designated as cash flow hedges 23 9
Forward currency contracts undesignated Fair value through profit and loss 2 5
Restricted cash Loans and receivables 8 6
375 546
OTHER FINANCIAL LIABILITIES
Non-Current
Finance lease creditors Loans and borrowings 356 336
Forward currency contracts designated as hedges Designated as cash flow hedges 6 12
362 348
Current
Finance lease creditors Loans and borrowings 165 260
Forward currency contracts designated as hedges Designated as cash flow hedges 48 88
Forward currency contracts undesignated Fair value through profit and loss 11 4
Oil derivative Designated as cash flow hedges – 2
Interest payable Fair value through profit and loss 11 14
235 368
During 2016, the cessation of the Berantai RSC was completed with PETRONAS and the outstanding Berantai RSC receivable of
US$71m at 31 December 2016, was recovered in full during the six months ended 30 June 2017.
30 June
2017
31 December
2016
Unaudited Audited
US$m US$m
Opening balance 71 357
Billings during the period – 62
Fair value loss (note 5) – (45)
Receipts during the period1 (71) (303)
– 71
1 Receipts during the period includes US$45m from non-recourse factoring (31 December 2016: US$257m).
The short-term receivable in respect of the development of the Greater Stella Area represents a loan made to the consortium partners
to fund Petrofac’s share of the development costs of the field. This short-term receivable is expected, on receipt of the Oil & Gas
Authority (OGA) approval, to be converted into a 20% equity interest in the GSA licence during the second half of 2017.
The short-term and long-term receivable from joint venture partners represents the 70% gross up on finance lease liabilities in
respect of oil and gas facilities relating to Block PM304 in Malaysia that are included 100% in the Group’s consolidated statement
of financial position. The Group’s 30% share of this finance lease liability is US$155m (31 December 2016: US$177m).
NOTES TO THE INTERIM CONDENSED CONSOLIDATED FINANCIAL STATEMENTS
For the six months ended 30 June 2017
28
13 FINANCIAL INSTRUMENTS (continued)
Restricted cash comprises deposits with financial institutions and clients securing various guarantees and performance bonds
associated with the Group’s trading activities. This cash will be released on the maturity of these guarantees and performance bonds.
Fair value measurement
The following financial instruments are measured at fair value using the hierarchy below for determination and disclosure of their
respective fair values:
Level 1: Unadjusted quoted prices in active markets for identical financial assets or liabilities
Level 2: Other valuation techniques where the inputs are based on significant observable factors
Level 3: Other valuation techniques where the inputs are based on significant unobservable market data
Set out below is a comparison of the carrying amounts and fair values of financial instruments as at:
Level Carrying amount Fair value
30 June
2017
Unaudited
31 December
2016
Audited
30 June
2017
Unaudited
31 December
2016
Audited
US$m US$m US$m US$m
Financial assets
Cash and short-term deposits Level 2 902 1,167 902 1,167
Restricted cash Level 2 48 47 48 47
Receivable under Berantai RSC Level 3 – 71 – 71
Receivable in respect of the development of the Greater Stella Area Level 3 228 276 228 276
Euro forward currency contracts – designated as cash flow hedge Level 2 56 47 56 47
Kuwaiti dinar forward currency contracts – designated as cash flow
hedge
Level 2
–
1
–
1
Sterling forward currency contracts – designated as cash flow hedge Level 2 3 3 3 3
Sterling forward currency contracts – undesignated Level 2 1 5 1 5
Kuwaiti dinar forward currency contracts – undesignated Level 2 1 – 1 –
Financial liabilities
Interest-bearing loans and borrowings
Senior notes Level 2 675 674 677 677
Term loan Level 2 300 300 300 300
Revolving credit facility Level 2 764 637 770 645
Export credit agency funding Level 2 132 129 142 140
Bank overdrafts Level 2 15 44 15 44
Finance lease creditors Level 2 521 596 521 596
Interest payable Level 2 11 14 11 14
Oil derivative Level 2 – 2 – 2
Euro forward currency contracts – designated as cash flow hedge Level 2 17 45 17 45
Malaysian ringgit forward currency contracts – designated as cash flow
hedge
Level 2
6
15
6
15
Kuwaiti dinar forward currency contracts – designated as cash flow
hedge
Level 2
27
30
27
30
Japanese yen forward currency contracts – designated as cash flow
hedge
Level 2
3
5
3
5
Sterling forward currency contracts – designated as cash flow hedge Level 2 1 5 1 5
Sterling forward currency contracts – undesignated Level 2 9 1 9 1
Euro forward currency contracts – undesignated Level 2 – 2 – 2
Kuwaiti dinar forward currency contracts – undesignated Level 2 2 1 2 1
The Group considers that the carrying amounts of trade and other receivables, work-in-progress, trade and other payables, other
current and non-current financial assets and liabilities approximate their fair values and are therefore excluded from the above table.
The fair value of the financial assets and liabilities is included at the amount at which the instrument could be exchanged in a current
transaction between willing parties, other than in a forced or liquidation sale.
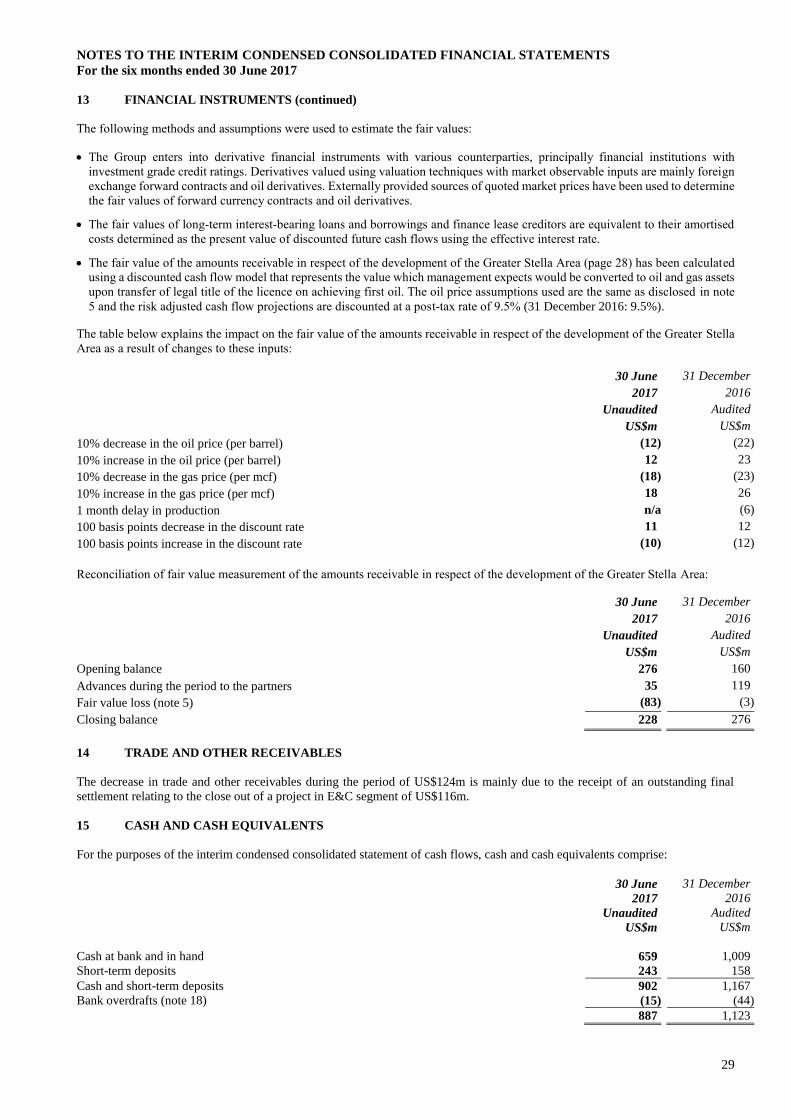
NOTES TO THE INTERIM CONDENSED CONSOLIDATED FINANCIAL STATEMENTS
For the six months ended 30 June 2017
29
13 FINANCIAL INSTRUMENTS (continued)
The following methods and assumptions were used to estimate the fair values:
• The Group enters into derivative financial instruments with various counterparties, principally financial institutions with
investment grade credit ratings. Derivatives valued using valuation techniques with market observable inputs are mainly foreign
exchange forward contracts and oil derivatives. Externally provided sources of quoted market prices have been used to determine
the fair values of forward currency contracts and oil derivatives.
• The fair values of long-term interest-bearing loans and borrowings and finance lease creditors are equivalent to their amortised
costs determined as the present value of discounted future cash flows using the effective interest rate.
• The fair value of the amounts receivable in respect of the development of the Greater Stella Area (page 28) has been calculated
using a discounted cash flow model that represents the value which management expects would be converted to oil and gas assets
upon transfer of legal title of the licence on achieving first oil. The oil price assumptions used are the same as disclosed in note
5 and the risk adjusted cash flow projections are discounted at a post-tax rate of 9.5% (31 December 2016: 9.5%).
The table below explains the impact on the fair value of the amounts receivable in respect of the development of the Greater Stella
Area as a result of changes to these inputs:
30 June
2017
31 December
2016
Unaudited
US$m
Audited
US$m
10% decrease in the oil price (per barrel) (12) (22)
10% increase in the oil price (per barrel) 12 23
10% decrease in the gas price (per mcf) (18) (23)
10% increase in the gas price (per mcf) 18 26
1 month delay in production n/a (6)
100 basis points decrease in the discount rate 11 12
100 basis points increase in the discount rate (10) (12)
Reconciliation of fair value measurement of the amounts receivable in respect of the development of the Greater Stella Area:
30 June
2017
31 December
2016
Unaudited Audited
US$m US$m
Opening balance 276 160
Advances during the period to the partners 35 119
Fair value loss (note 5) (83) (3)
Closing balance 228 276
14 TRADE AND OTHER RECEIVABLES
The decrease in trade and other receivables during the period of US$124m is mainly due to the receipt of an outstanding final
settlement relating to the close out of a project in E&C segment of US$116m.
15 CASH AND CASH EQUIVALENTS
For the purposes of the interim condensed consolidated statement of cash flows, cash and cash equivalents comprise:
30 June
2017
31 December
2016
Unaudited Audited
US$m US$m
Cash at bank and in hand 659 1,009
Short-term deposits 243 158
Cash and short-term deposits 902 1,167
Bank overdrafts (note 18) (15) (44)
887 1,123
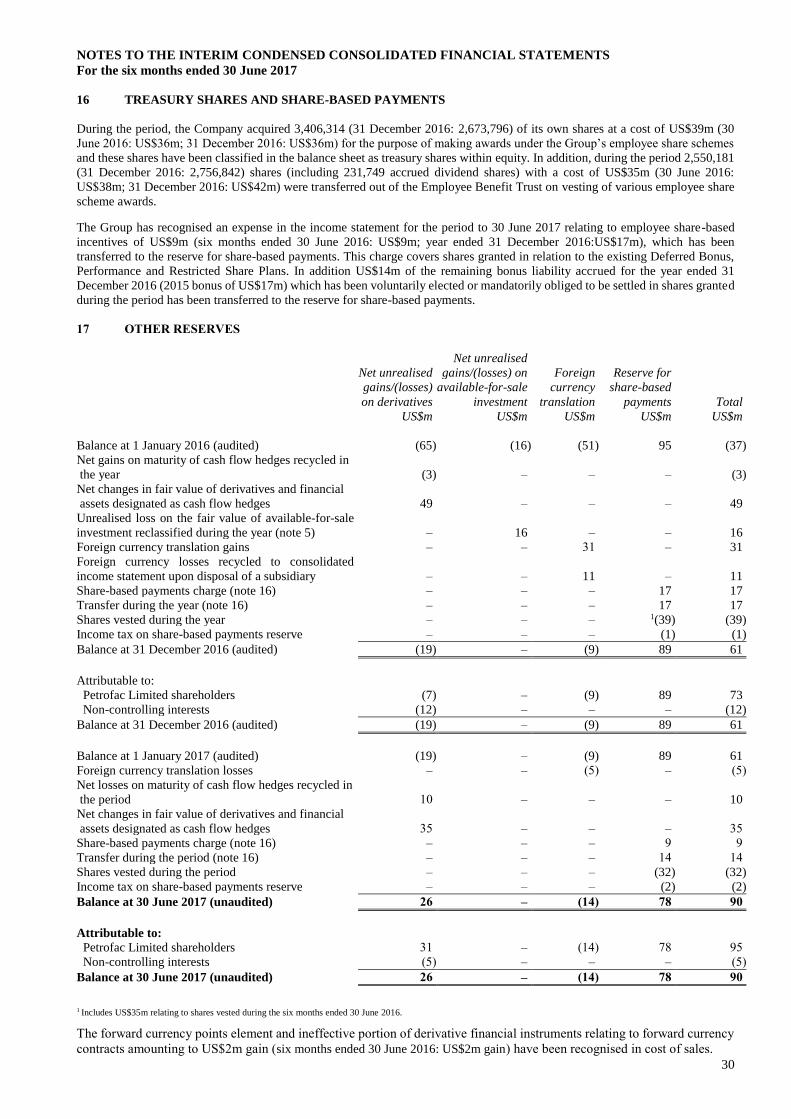
NOTES TO THE INTERIM CONDENSED CONSOLIDATED FINANCIAL STATEMENTS
For the six months ended 30 June 2017
30
16 TREASURY SHARES AND SHARE-BASED PAYMENTS
During the period, the Company acquired 3,406,314 (31 December 2016: 2,673,796) of its own shares at a cost of US$39m (30
June 2016: US$36m; 31 December 2016: US$36m) for the purpose of making awards under the Group’s employee share schemes
and these shares have been classified in the balance sheet as treasury shares within equity. In addition, during the period 2,550,181
(31 December 2016: 2,756,842) shares (including 231,749 accrued dividend shares) with a cost of US$35m (30 June 2016:
US$38m; 31 December 2016: US$42m) were transferred out of the Employee Benefit Trust on vesting of various employee share
scheme awards.
The Group has recognised an expense in the income statement for the period to 30 June 2017 relating to employee share-based
incentives of US$9m (six months ended 30 June 2016: US$9m; year ended 31 December 2016:US$17m), which has been
transferred to the reserve for share-based payments. This charge covers shares granted in relation to the existing Deferred Bonus,
Performance and Restricted Share Plans. In addition US$14m of the remaining bonus liability accrued for the year ended 31
December 2016 (2015 bonus of US$17m) which has been voluntarily elected or mandatorily obliged to be settled in shares granted
during the period has been transferred to the reserve for share-based payments.
17 OTHER RESERVES
1 Includes US$35m relating to shares vested during the six months ended 30 June 2016.
The forward currency points element and ineffective portion of derivative financial instruments relating to forward currency
contracts amounting to US$2m gain (six months ended 30 June 2016: US$2m gain) have been recognised in cost of sales.
Net unrealised
Net unrealised gains/(losses) on Foreign Reserve for
gains/(losses) available-for-sale currency share-based
on derivatives investment translation payments Total
US$m US$m US$m US$m US$m
Balance at 1 January 2016 (audited) (65) (16) (51) 95 (37)
Net gains on maturity of cash flow hedges recycled in
the year
(3)
–
–
–
(3)
Net changes in fair value of derivatives and financial
assets designated as cash flow hedges
49
–
–
–
49
Unrealised loss on the fair value of available-for-sale
investment reclassified during the year (note 5)
–
16
–
–
16
Foreign currency translation gains – – 31 – 31
Foreign currency losses recycled to consolidated
income statement upon disposal of a subsidiary
–
–
11
–
11
Share-based payments charge (note 16) – – – 17 17
Transfer during the year (note 16) – – – 17 17
Shares vested during the year – – – 1(39) (39)
Income tax on share-based payments reserve – – – (1) (1)
Balance at 31 December 2016 (audited) (19) – (9) 89 61
Attributable to:
Petrofac Limited shareholders (7) – (9) 89 73
Non-controlling interests (12) – – – (12)
Balance at 31 December 2016 (audited) (19) – (9) 89 61
Balance at 1 January 2017 (audited) (19) – (9) 89 61
Foreign currency translation losses – – (5) – (5)
Net losses on maturity of cash flow hedges recycled in
the period
10
–
–
–
10
Net changes in fair value of derivatives and financial
assets designated as cash flow hedges
35
–
–
–
35
Share-based payments charge (note 16) – – – 9 9
Transfer during the period (note 16) – – – 14 14
Shares vested during the period – – – (32) (32)
Income tax on share-based payments reserve – – – (2) (2)
Balance at 30 June 2017 (unaudited) 26 – (14) 78 90
Attributable to:
Petrofac Limited shareholders 31 – (14) 78 95
Non-controlling interests (5) – – – (5)
Balance at 30 June 2017 (unaudited) 26 – (14) 78 90
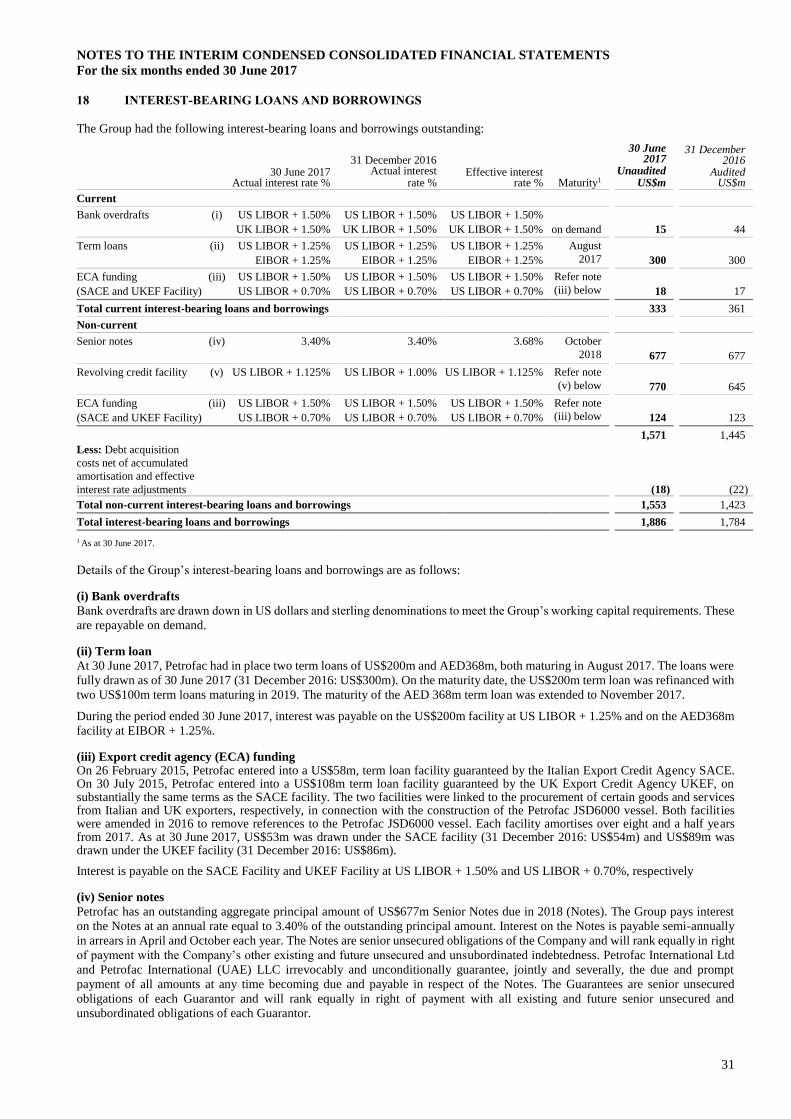
NOTES TO THE INTERIM CONDENSED CONSOLIDATED FINANCIAL STATEMENTS
For the six months ended 30 June 2017
31
18 INTEREST-BEARING LOANS AND BORROWINGS
The Group had the following interest-bearing loans and borrowings outstanding:
30 June 2017 Actual interest rate %
31 December 2016 Actual interest
rate % Effective interest
rate % Maturity1
30 June 2017
Unaudited US$m
31 December 2016
Audited US$m
Current
Bank overdrafts (i) US LIBOR + 1.50%
UK LIBOR + 1.50%
US LIBOR + 1.50%
UK LIBOR + 1.50%
US LIBOR + 1.50%
UK LIBOR + 1.50%
on demand
15
44
Term loans (ii) US LIBOR + 1.25%
EIBOR + 1.25%
US LIBOR + 1.25%
EIBOR + 1.25%
US LIBOR + 1.25%
EIBOR + 1.25%
August
2017
300
300
ECA funding
(SACE and UKEF Facility)
(iii) US LIBOR + 1.50%
US LIBOR + 0.70%
US LIBOR + 1.50%
US LIBOR + 0.70%
US LIBOR + 1.50%
US LIBOR + 0.70%
Refer note
(iii) below
18
17
Total current interest-bearing loans and borrowings 333 361
Non-current
Senior notes (iv) 3.40% 3.40% 3.68% October
2018
677
677
Revolving credit facility (v) US LIBOR + 1.125% US LIBOR + 1.00% US LIBOR + 1.125% Refer note
(v) below
770
645
ECA funding
(SACE and UKEF Facility)
(iii) US LIBOR + 1.50%
US LIBOR + 0.70%
US LIBOR + 1.50%
US LIBOR + 0.70%
US LIBOR + 1.50%
US LIBOR + 0.70%
Refer note
(iii) below
124
123
1,571 1,445
Less: Debt acquisition
costs net of accumulated
amortisation and effective
interest rate adjustments
(18)
(22)
Total non-current interest-bearing loans and borrowings 1,553 1,423
Total interest-bearing loans and borrowings 1,886 1,784
1 As at 30 June 2017.
Details of the Group’s interest-bearing loans and borrowings are as follows:
(i) Bank overdrafts
Bank overdrafts are drawn down in US dollars and sterling denominations to meet the Group’s working capital requirements. These
are repayable on demand.
(ii) Term loan
At 30 June 2017, Petrofac had in place two term loans of US$200m and AED368m, both maturing in August 2017. The loans were
fully drawn as of 30 June 2017 (31 December 2016: US$300m). On the maturity date, the US$200m term loan was refinanced with
two US$100m term loans maturing in 2019. The maturity of the AED 368m term loan was extended to November 2017.
During the period ended 30 June 2017, interest was payable on the US$200m facility at US LIBOR + 1.25% and on the AED368m
facility at EIBOR + 1.25%.
(iii) Export credit agency (ECA) funding On 26 February 2015, Petrofac entered into a US$58m, term loan facility guaranteed by the Italian Export Credit Agency SACE. On 30 July 2015, Petrofac entered into a US$108m term loan facility guaranteed by the UK Export Credit Agency UKEF, on substantially the same terms as the SACE facility. The two facilities were linked to the procurement of certain goods and services from Italian and UK exporters, respectively, in connection with the construction of the Petrofac JSD6000 vessel. Both facilities were amended in 2016 to remove references to the Petrofac JSD6000 vessel. Each facility amortises over eight and a half years from 2017. As at 30 June 2017, US$53m was drawn under the SACE facility (31 December 2016: US$54m) and US$89m was drawn under the UKEF facility (31 December 2016: US$86m).
Interest is payable on the SACE Facility and UKEF Facility at US LIBOR + 1.50% and US LIBOR + 0.70%, respectively
(iv) Senior notes
Petrofac has an outstanding aggregate principal amount of US$677m Senior Notes due in 2018 (Notes). The Group pays interest
on the Notes at an annual rate equal to 3.40% of the outstanding principal amount. Interest on the Notes is payable semi-annually
in arrears in April and October each year. The Notes are senior unsecured obligations of the Company and will rank equally in right
of payment with the Company’s other existing and future unsecured and unsubordinated indebtedness. Petrofac International Ltd
and Petrofac International (UAE) LLC irrevocably and unconditionally guarantee, jointly and severally, the due and prompt
payment of all amounts at any time becoming due and payable in respect of the Notes. The Guarantees are senior unsecured
obligations of each Guarantor and will rank equally in right of payment with all existing and future senior unsecured and
unsubordinated obligations of each Guarantor.
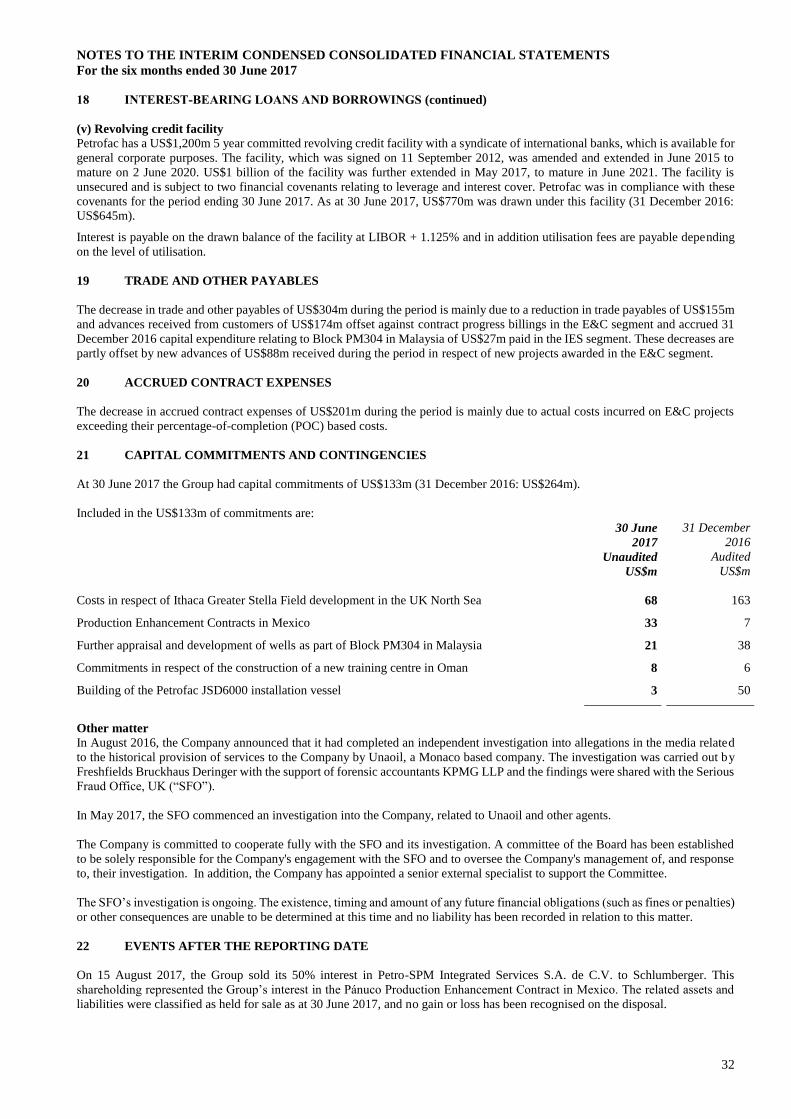
NOTES TO THE INTERIM CONDENSED CONSOLIDATED FINANCIAL STATEMENTS
For the six months ended 30 June 2017
32
18 INTEREST-BEARING LOANS AND BORROWINGS (continued)
(v) Revolving credit facility
Petrofac has a US$1,200m 5 year committed revolving credit facility with a syndicate of international banks, which is available for
general corporate purposes. The facility, which was signed on 11 September 2012, was amended and extended in June 2015 to
mature on 2 June 2020. US$1 billion of the facility was further extended in May 2017, to mature in June 2021. The facility is
unsecured and is subject to two financial covenants relating to leverage and interest cover. Petrofac was in compliance with these
covenants for the period ending 30 June 2017. As at 30 June 2017, US$770m was drawn under this facility (31 December 2016:
US$645m).
Interest is payable on the drawn balance of the facility at LIBOR + 1.125% and in addition utilisation fees are payable depending
on the level of utilisation.
19 TRADE AND OTHER PAYABLES
The decrease in trade and other payables of US$304m during the period is mainly due to a reduction in trade payables of US$155m
and advances received from customers of US$174m offset against contract progress billings in the E&C segment and accrued 31
December 2016 capital expenditure relating to Block PM304 in Malaysia of US$27m paid in the IES segment. These decreases are
partly offset by new advances of US$88m received during the period in respect of new projects awarded in the E&C segment.
20 ACCRUED CONTRACT EXPENSES
The decrease in accrued contract expenses of US$201m during the period is mainly due to actual costs incurred on E&C projects
exceeding their percentage-of-completion (POC) based costs.
21 CAPITAL COMMITMENTS AND CONTINGENCIES
At 30 June 2017 the Group had capital commitments of US$133m (31 December 2016: US$264m).
Included in the US$133m of commitments are:
30 June
2017
31 December
2016
Unaudited Audited
US$m US$m
Costs in respect of Ithaca Greater Stella Field development in the UK North Sea 68 163
Production Enhancement Contracts in Mexico 33 7
Further appraisal and development of wells as part of Block PM304 in Malaysia 21 38
Commitments in respect of the construction of a new training centre in Oman 8 6
Building of the Petrofac JSD6000 installation vessel 3 50
Other matter
In August 2016, the Company announced that it had completed an independent investigation into allegations in the media related
to the historical provision of services to the Company by Unaoil, a Monaco based company. The investigation was carried out by
Freshfields Bruckhaus Deringer with the support of forensic accountants KPMG LLP and the findings were shared with the Serious
Fraud Office, UK (“SFO”).
In May 2017, the SFO commenced an investigation into the Company, related to Unaoil and other agents.
The Company is committed to cooperate fully with the SFO and its investigation. A committee of the Board has been established
to be solely responsible for the Company's engagement with the SFO and to oversee the Company's management of, and response
to, their investigation. In addition, the Company has appointed a senior external specialist to support the Committee.
The SFO’s investigation is ongoing. The existence, timing and amount of any future financial obligations (such as fines or penalties)
or other consequences are unable to be determined at this time and no liability has been recorded in relation to this matter.
22 EVENTS AFTER THE REPORTING DATE
On 15 August 2017, the Group sold its 50% interest in Petro-SPM Integrated Services S.A. de C.V. to Schlumberger. This
shareholding represented the Group’s interest in the Pánuco Production Enhancement Contract in Mexico. The related assets and
liabilities were classified as held for sale as at 30 June 2017, and no gain or loss has been recognised on the disposal.
STATEMENT OF DIRECTORS’ RESPONSIBILITIES
33
The Directors confirm that, to the best of their knowledge, the condensed set of financial statements on pages 13 to 32 has been
prepared in accordance with IAS 34 ‘Interim Financial Reporting’, and that the interim management report on pages 1 to 12 includes
a fair review of the information required by DTR 4.2.7R and DTR 4.2.8R.
The Directors of Petrofac Limited are listed in the Petrofac Annual Report and Accounts 2016.
By the order of the Board
Ayman Asfari Alastair Cochran
Chief Executive Officer Chief Financial Officer
29 August 2017 29 August 2017
INDEPENDENT REVIEW REPORT TO PETROFAC LIMITED
Introduction
We have been engaged by Petrofac Limited (‘the Company’) to review the interim condensed consolidated financial statements in
the interim report for the six months ended 30 June 2017 which comprises the interim condensed consolidated income statement,
the interim condensed consolidated statement of comprehensive income, the interim condensed consolidated statement of financial
position, the interim condensed consolidated statement of cash flows, the interim condensed consolidated statement of changes in
equity and the related explanatory notes that have been reviewed. We have read the other information contained in the interim
report and considered whether it contains any apparent misstatements or material inconsistencies with the information in the interim
condensed consolidated financial statements.
This report is made solely to the company in accordance with guidance contained in International Standard on Review Engagements
2410 (UK and Ireland) "Review of Interim Financial Information Performed by the Independent Auditor of the Entity" issued by
the Auditing Practices Board. To the fullest extent permitted by law, we do not accept or assume responsibility to anyone other
than the company, for our work, for this report, or for the conclusions we have formed.
Directors’ Responsibilities
The interim report is the responsibility of, and has been approved by, the directors. The directors are responsible for preparing the
interim report in accordance with the Disclosure Guidance and Transparency Rules of the United Kingdom's Financial Conduct
Authority.
As disclosed in note 2, the annual financial statements of the group are prepared in accordance with International Financial
Reporting Standards (‘IFRS’). The interim condensed consolidated financial statements included in this interim report have been
prepared in accordance with International Accounting Standard 34, "Interim Financial Reporting”.
Our Responsibility
Our responsibility is to express to the Company a conclusion on the interim condensed consolidated financial statements in the
interim report based on our review.
Scope of Review
We conducted our review in accordance with International Standard on Review Engagements (UK and Ireland) 2410, "Review of
Interim Financial Information Performed by the Independent Auditor of the Entity" issued by the Auditing Practices Board for use
in the United Kingdom. A review of interim financial information consists of making enquiries, primarily of persons responsible
for financial and accounting matters, and applying analytical and other review procedures. A review is substantially less in scope
than an audit conducted in accordance with International Standards on Auditing (UK) and consequently does not enable us to obtain
assurance that we would become aware of all significant matters that might be identified in an audit. Accordingly, we do not express
an audit opinion.
Conclusion
Based on our review, nothing has come to our attention that causes us to believe that the interim condensed consolidated financial
statements in the interim report for the six months ended 30 June 2017 are not prepared, in all material respects, in accordance with
International Accounting Standard 34 and the Disclosure Guidance and Transparency Rules of the United Kingdom's Financial
Conduct Authority.
Ernst & Young LLP
London
29 August 2017
SHAREHOLDER INFORMATION
At 30 June 2017
34
Petrofac shares are traded on the London Stock Exchange using code ‘PFC.L’.
Registrar
Legal Advisers to the Company
Capita Registrars (Jersey) Limited Freshfields Bruckhaus Deringer LLP
12 Castle Street 65 Fleet Street
St Helier London EC4Y 1HS
Jersey JE23RT
Company Secretary and registered office Auditors
Intertrust Corporate Services (Jersey) Limited Ernst & Young LLP
44 Esplanade 1 More London Place
St Helier London SE1 2AF
Jersey JE4 9WG
Corporate Brokers
Corporate and Financial PR
Goldman Sachs Tulchan Communications Group
Peterborough Court 85 Fleet Street
133 Fleet Street
London EC4A 2BB
London EC4Y 1AE
JP Morgan Cazenove
25 Bank Street
Canary Wharf
London E14 5JP
Financial calendar
22 September 2017 Interim dividend record date
20 October 2017 Interim dividend payment
31 December 2017 2017 financial year end
01 March 2018 2017 full year results announcement
Dates are based on current expectations.
Copies of all announcements will be available on the Company’s website at www.petrofac.com following their release.