Embed Size (px)
Citation preview

PETROGAS GLOBALAnnual Report 2014

PETROGAS GLOBAL Annual Report 2014 3
PETROGAS GLOBALAnnual Report 2014
5
9
Chairman’s Review
The Applegreen Story
15
Directors’ Report and Financial Statements

PETROGAS GLOBAL Annual Report 2014 Chairman’s Review5
Chairman’s Review
It was a refreshing change to be able to concentrate on
growing our business
We now have great momentum in our business
and we look forward to continuing to work with
you all and hopefully we will all enjoy
a successful journey together.
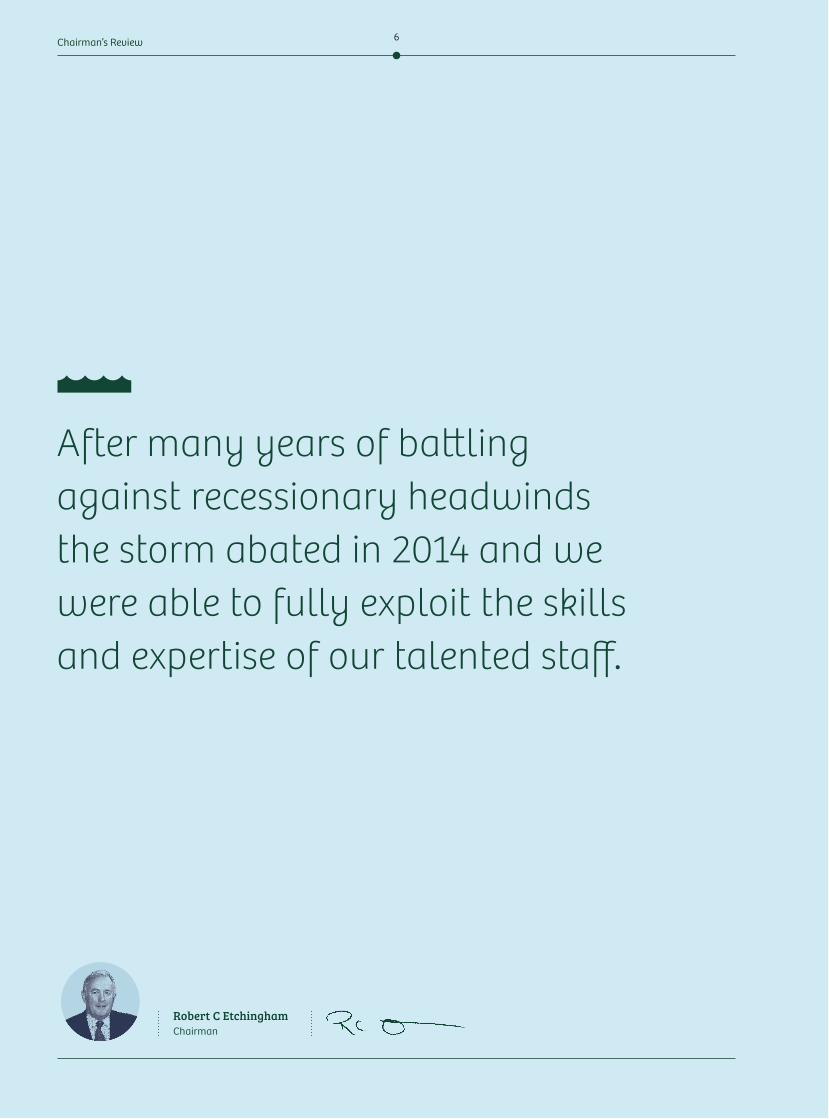
After many years of ba!ling against recessionary headwinds the storm abated in 2014 and we were able to fully exploit the skills and expertise of our talented staff.
6Chairman’s Review
Robert C EtchinghamChairman
PETROGAS GLOBAL Annual Report 2014 7
It was a year in which revenue for the Group grew by c. 18% compared to 2013 which resulted in a 20% increase in adjusted EBITDA. This was delivered through the upgrade and rebrand of 18 sites and in particular the addition of 31 new locations for the group across Ireland and the UK as well as 2 sites in a new market for the group in 2014, Long Island in the United States.
The upgrade programme comprised 10 in the Republic of Ireland and 8 in the United Kingdom. This involved the rebranding of the facility as Applegreen, significant upgrade to the internal facility and in particular the enhancement of the food offer. 17 new Subways units were added as part of this programme.
The expansion in the UK and Irish estate was made up by the following:
• Two new Motorway Service Areas (MSA) - the first opened in June on the M11 in Wicklow and the second in October on the M7 in Birdhill, Tipperary. Each of these were greenfield developments on property acquired by the Group.
• Two smaller service areas which had a significant food offer were developed and opened in Lemybrien, Co. Waterford in August and Swords in November.
• Seven Petrol Filling stations (‘PFS’) were also added in the Republic of Ireland as well as twelve new sites in the UK
• We commenced a dealer programme during the year whereby we sell fuel under our brand at sites owned by third parties and at the end of 2014 there were 8 dealer sites in operation.
A key feature of our development has been the development of the food offer within our business both through the development of partnerships with international food brands and the development of our own aCafe and Bakewell offers. At the end of 2014 in addition to our own brand food offer, which is present in the majority of our sites, we also had 12 Burger Kings, 8 Costa Coffees and 32 Subways in operation.
Chairman’s Review
Apart from the dealer project referred to above we also launched a commercial fuel card, LowFuelCard, which was well received by the market. As referred to above a further new initiative was the establishment of a small presence in Long Island, United States. This provides the group with a potential platform for expansion, in the medium term, in the north east of the United States.
Since the year end we have continued to develop and grow the business. In April we opened the first MSA in Northern Ireland on the M2 North of Belfast on one of four sites we acquired on the region’s motorway network. We have also developed two smaller service areas in the west of Ireland and added 10 other locations across Ireland, the UK and the U.S. We have also further developed our food business with the addition of 14 branded units across the estate. This included two new food offerings following the conclusion of franchise agreements with Chopstix and Greggs. Two Chopstix and four Greggs units were opened since year end.
As a business, we are fortunate to be operating at a time of unprecedented change in the forecourt industry. There are many and varied opportunities for our team to exploit and we commenced a major 'ramp up' of our activities during 2014, with a record capital investment programme. The Board continues to consider the appropriate levels of investment for future years and our options for funding them. This will be the major theme for us in 2015, as we are commi"ed to continuing to grow our earnings.
Finally on behalf of the Board I would like to thank the able and commi"ed group of employees, licensees, consultants and suppliers who have made the Applegreen business such a success over the years. We now have great momentum in our business and we look forward to continuing to work with you all and hopefully we will all enjoy a successful journey together.

PETROGAS GLOBAL Annual Report 2014 The Applegreen Story9
There are many and varied opportunities for our
team to exploit and we commenced a major
'ramp up' of our activities during 2014, with
a record capital investment programme.
The Applegreen Story
As a business, we are fortunate to be
operating at a time of unprecedented change

10The Applegreen Story
A key feature of our development has been the development of the food offer within our business.
PETROGAS GLOBAL Annual Report 2014 11 The Applegreen Story
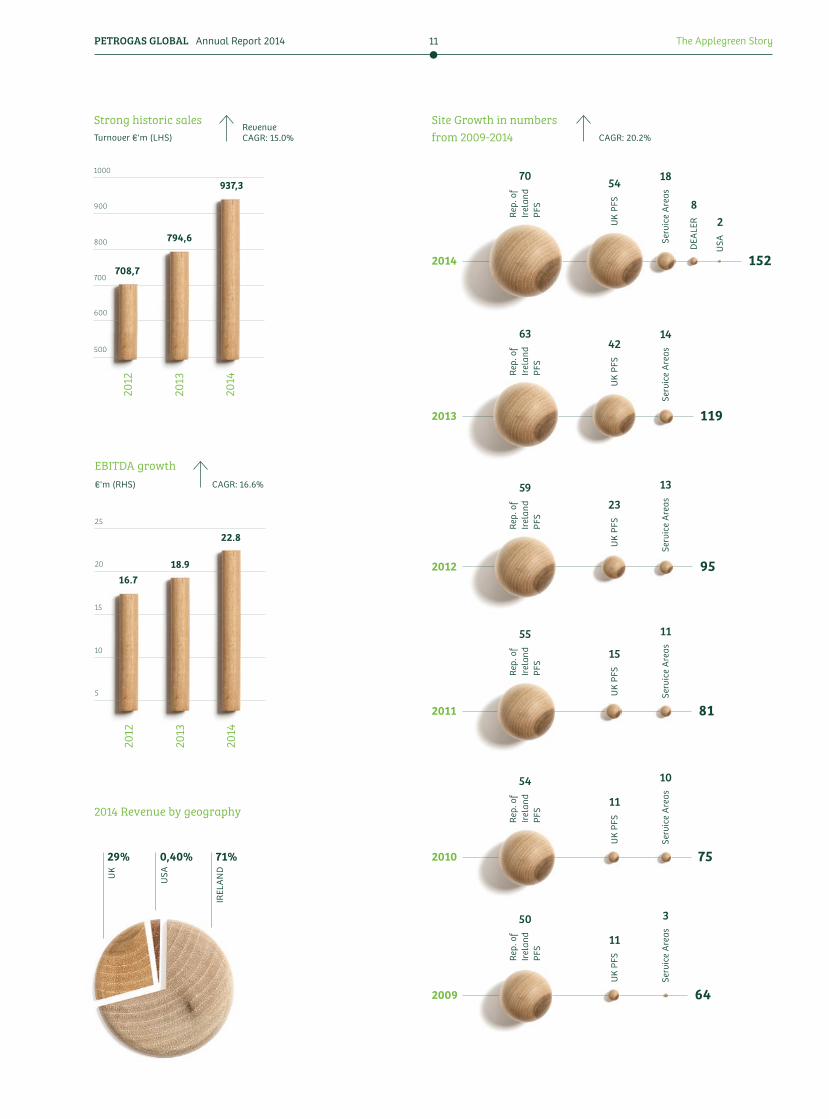
2014 Revenue by geography
71%
IREL
AN
D
29%
UK
0,40%
USA
Site Growth in numbers from 2009-2014
2014
2013
2012
2011
2010
2009
82
18
14
13
11
10
3
70 54
42
23
15
11
11
DEA
LER
USASe
rvic
e A
reas
Serv
ice
Are
asSe
rvic
e A
reas
Serv
ice
Are
asSe
rvic
e A
reas
Serv
ice
Are
as
Rep.
of
Irel
and
PFS
Rep.
of
Irel
and
PFS
Rep.
of
Irel
and
PFS
Rep.
of
Irel
and
PFS
Rep.
of
Irel
and
PFS
Rep.
of
Irel
and
PFS
UK
PFS
UK
PFS
UK
PFS
UK
PFS
UK
PFS
UK
PFS
CAGR: 20.2%
152
119
95
81
75
64
RevenueCAGR: 15.0%Turnover €'m (LHS)
Strong historic sales20
12
2013
2014
1000
900
800
700
600
500
708,7
794,6
937,3
CAGR: 16.6%€'m (RHS)
EBITDA growth
2012
2013
2014
25
20
15
10
5
18.916.7
22.8
63
59
55
54
50
12
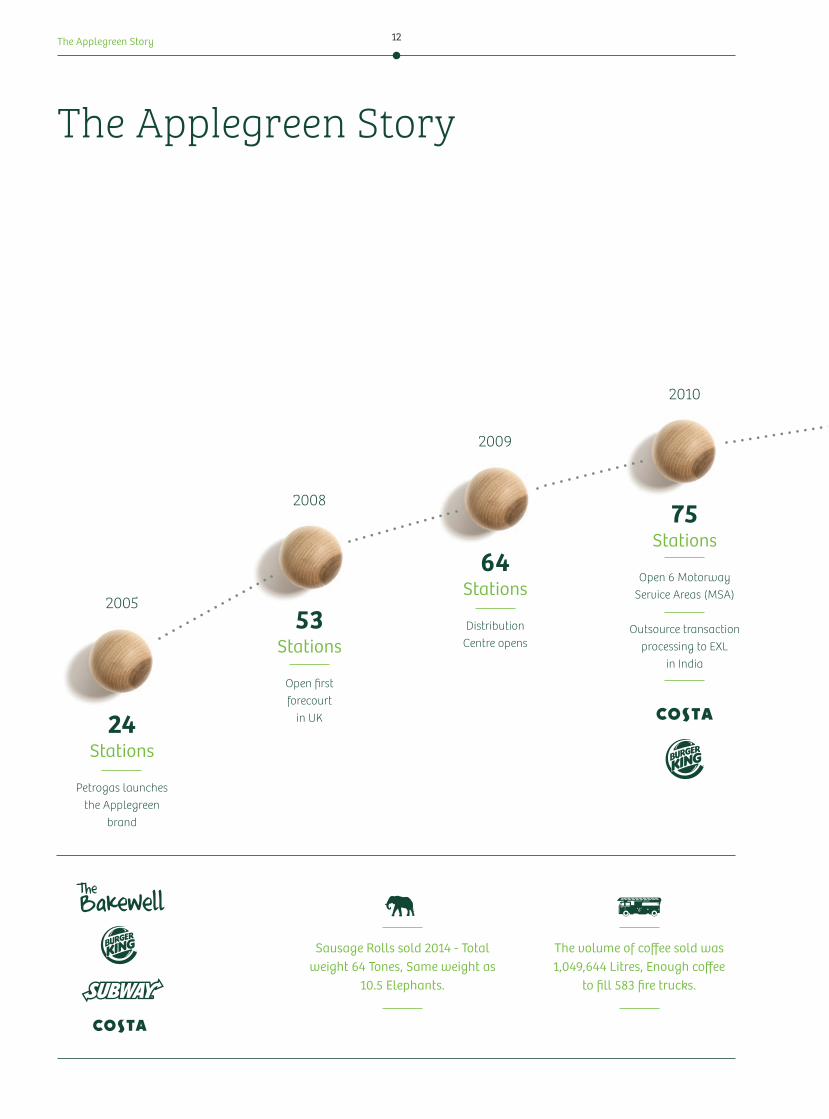
64Stations
Open 6 Motorway Service Areas (MSA)
Outsource transaction processing to EXL
in India
75Stations
Petrogas launches the Applegreen
brand
24Stations
Open first forecourt
in UK
53Stations
Distribution Centre opens
2005
2008
2009
2010
The Applegreen Story
Sausage Rolls sold 2014 - Total weight 64 Tones, Same weight as
10.5 Elephants.
The volume of coffee sold was 1,049,644 Litres, Enough coffee
to fill 583 fire trucks.
The Applegreen Story
13PETROGAS GLOBAL Annual Report 2014
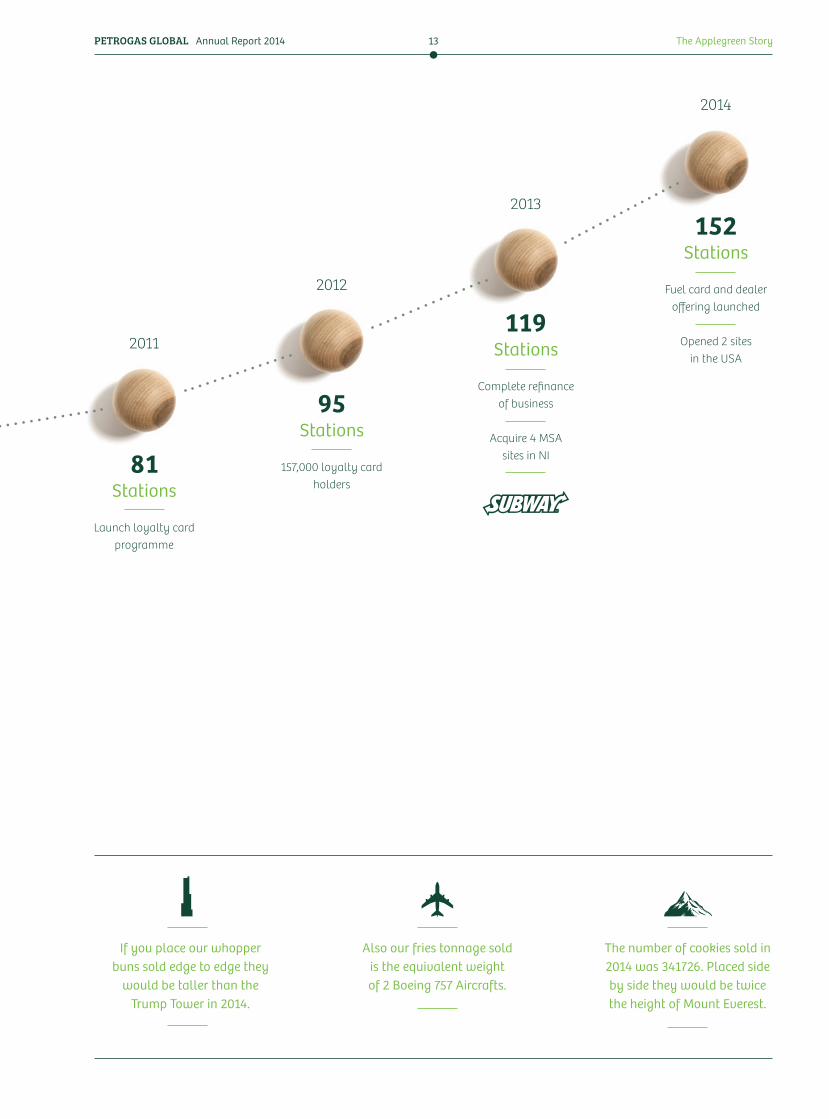
Fuel card and dealer offering launched
Opened 2 sites in the USA
152Stations
157,000 loyalty card holders
95Stations
Launch loyalty card programme
81Stations
Complete refinance of business
Acquire 4 MSAsites in NI
119Stations2011
2012
2013
2014
Also our fries tonnage sold is the equivalent weight of 2 Boeing 757 Aircrafts.
The number of cookies sold in 2014 was 341726. Placed side by side they would be twice the height of Mount Everest.
If you place our whopper buns sold edge to edge they
would be taller than the Trump Tower in 2014.
The Applegreen Story

PETROGAS GLOBAL Annual Report 2014 Directors’ Report and Financial Statements15
Directors’ Report
&Financial
Statements
Directors’ Report and Financial Statements 16
Contents
Directors’ Report / 17
Statement of Directors’ Responsibilities / 21
Independent Auditors’ Report to the Members of Petrogas Global Limited / 22
Consolidated Income Statement / 25
Consolidated Statement of Comprehensive Income / 26
Consolidated Statement of Financial Position / 27
Company Statement of Financial Position / 28
Consolidated Statement of Changes in Equity / 29
Company Statement of Changes in Equity / 30
Consolidated Statement of Cash Flows / 31
Company Statement of Cash Flows / 32
Notes to the Consolidated Financial Statements / 33
Directors and Other Information / 89
PETROGAS GLOBAL Annual Report 2014 Directors’ Report and Financial Statements17
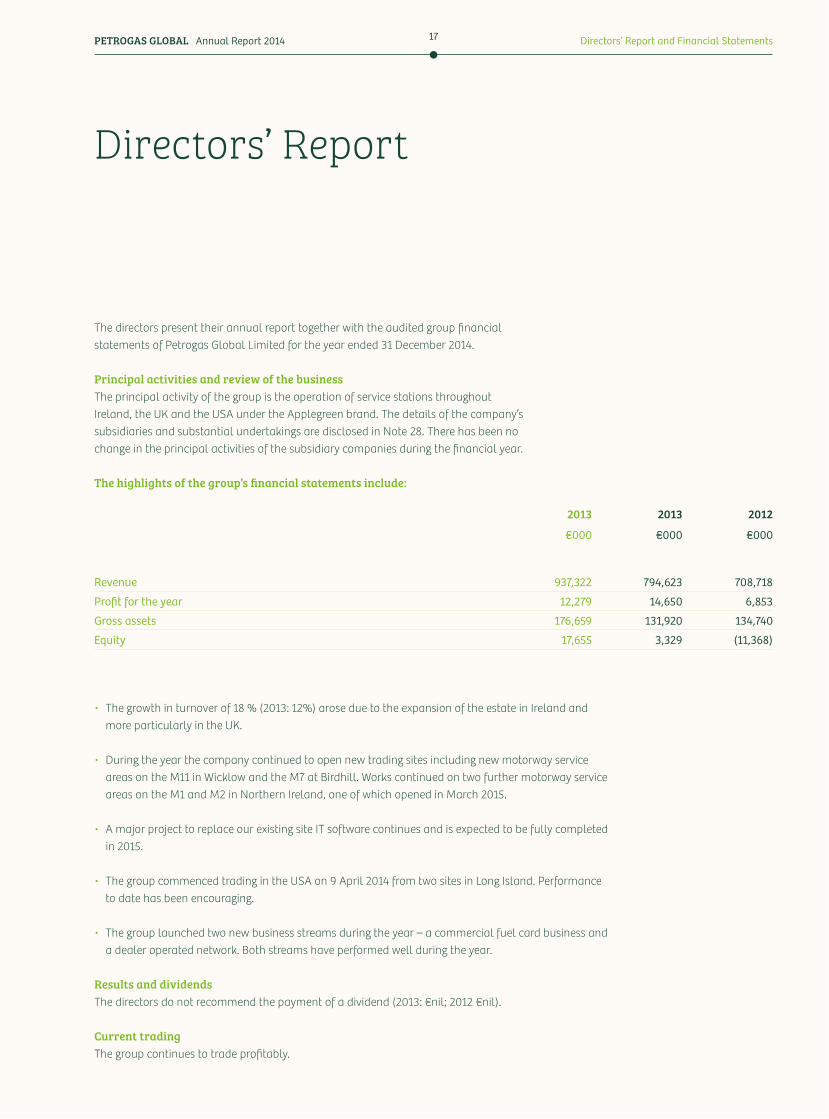
The directors present their annual report together with the audited group financial statements of Petrogas Global Limited for the year ended 31 December 2014.
Principal activities and review of the businessThe principal activity of the group is the operation of service stations throughout Ireland, the UK and the USA under the Applegreen brand. The details of the company’s subsidiaries and substantial undertakings are disclosed in Note 28. There has been no change in the principal activities of the subsidiary companies during the financial year.
The highlights of the group’s financial statements include:
• The growth in turnover of 18 % (2013: 12%) arose due to the expansion of the estate in Ireland and more particularly in the UK.
• During the year the company continued to open new trading sites including new motorway service areas on the M11 in Wicklow and the M7 at Birdhill. Works continued on two further motorway service areas on the M1 and M2 in Northern Ireland, one of which opened in March 2015.
• A major project to replace our existing site IT software continues and is expected to be fully completed in 2015.
• The group commenced trading in the USA on 9 April 2014 from two sites in Long Island. Performance to date has been encouraging.
• The group launched two new business streams during the year – a commercial fuel card business and a dealer operated network. Both streams have performed well during the year.
Results and dividendsThe directors do not recommend the payment of a dividend (2013: €nil; 2012 €nil).
Current tradingThe group continues to trade profitably.
Directors’ Report
2013 2013 2012
€000 €000 €000
Revenue 937,322 794,623 708,718
Profit for the year 12,279 14,650 6,853
Gross assets 176,659 131,920 134,740
Equity 17,655 3,329 (11,368)
Directors’ Report and Financial Statements 18
Events since the year end and future developmentsSince the year end, the group has opened four new sites in Ireland, two in the USA and one in the UK. In March 2015, the group entered into new banking arrangements with its senior lenders. These new agreements extend the maturity of the group’s debt and make additional facilities available to the group.
The group has entered into franchise arrangements with two new food offerings, Chopstix and Greggs, with the first sales taking place inMarch 2015 and April 2015 respectively.
Principal risks and uncertaintiesThe group’s general business activities may be affected by risks associated with all companies in the fuel distribution and retail sector. The group has identified the following risks specific to its business:
• The group operates in a highly competitive market, with competitors drawn from local and large scale multi-national corporations. To mitigate this risk, we focus on delivering superior service at a competitive cost to our customers. To facilitate this at a profitable level, we aim to have the best economies of scale in the industry with central purchasing and distribution.
• In the event of another economic decline the group may experience decreased customer demand.
• The group expands the business through a strategy of service station and site acquisitions and lease arrangements. The group’s growth may be hindered should it be unable to find a*ractive acquisitions or source the required financial facilities in the current banking environment.
• The storage and dispensing of hydrocarbon fuels can give rise to environmental damage and the cost of any clean-up can be considerable. The group has procedures in place to mitigate these risks, including fuel stock management and reconciliations.
• Severe weather conditions can impact average traffic volumes which would directly impact on the demand for the group’s products.
• The group operates in a highly regulated and legally stringent environment. Changes in environmental, health and safety, or governmental laws or regulations could result in significant additional costs to the group.
• Changes in the stability of financial institutions may lead to higher costs to be borne by the group. An increase in the costs associated with the group’s debt or an increase in financing costs could hinder the group’s growth.
• The financial crisis has heightened the need for effective capital management and the risk of insufficient liquidity can undermine an entity’s ability to develop and manage a robust business model. The group manages the risk of insufficient liquidity by liaising with its bankers regularly to ensure the availability of sufficient liquidity to allow the group to manage its growth aspirations effectively.
• The group currently operates in Pound Sterling and US Dollars as well as Euro. Any changes in the foreign exchange rate relative to the Euro could impact the group adversely.
Directors’ Report (Continued)
PETROGAS GLOBAL Annual Report 2014 Directors’ Report and Financial Statements19
The directors take such actions as they deem appropriate to minimise the group’s exposure to identified risks. The group’s financial risks are set out in note 24 to the financial statements.
DirectorsThe present members of the board of the company and those who held office during the year are:
Robert EtchinghamJoseph Barre#Michael O’LoughlinEugene Moore (appointed 11 February 2014)Paul Lynch (appointed 19 August 2014)Martin Southgate (appointed 11 February 2014)Brian Geraghty (appointed 19 August 2014)
In accordance with the articles of association of the company, the directors are not required to retire by rotation.
Interests of the directors/secretary in the groupDetails of the directors’ and secretary’s shareholdings, interests and transactions with the group are provided in note 28 to the financial statements.
Political donationsNo political donations were made during the current or prior year.
Books of accountThe measures taken by the directors to ensure compliance with the requirements of Section 202, Companies Act 1990, regarding proper books of account are the implementation of necessary policies and procedures for recording transactions, the employment of competent accounting personnel with appropriate expertise and the provision of adequate resources to the finance function. The books of account are maintained at the company’s head office, Block 17, Joyce Way, Parkwest, Dublin 12, and at various subsidiary offices.
AuditorsPricewaterhouseCoopers Chartered Accountants were appointed as auditors to the group during 2013. In Accordance with Section 160(2) of The Companies Acts 1963 to 2013, PricewaterhouseCoopers will continue in office.
Joseph Barrett
Paul Lynch
On behalf of the directors30 April 2015
Directors’ Report (Continued)

PETROGAS GLOBAL Annual Report 2014 Directors’ Report and Financial Statements21
Statement of Directors’ Responsibilities
The directors are responsible for preparing the Directors’ Report and the financial statements inaccordance with applicable Irish law. Under that law, the directors have elected to prepare the financial statements in accordance with International Financial Reporting Standards (IFRS) as adopted by the European Union.
Company law requires the directors to prepare financial statements for each financial year which give a true and fair view of the state of affairs of the company and of the group, and of the profit or loss of the group for that year. In preparing these financial statements, the directors are required to:
• select suitable accounting policies and then apply them consistently;
• make judgements and estimates that are reasonable and prudent;
• prepare the financial statements on the going concern basis unless it is inappropriate to presume that the company will continue in business.
The directors confirm that they have complied with the above requirements in preparing the financial statements.
The directors are responsible for keeping proper books of account that disclose with reasonable accuracy at any time the financial position of the company and enable them to ensure that the financial statements are prepared in accordance with International Financial Reporting Standards (IFRS) as adopted by the European Union and Irish statute law
comprising the Companies Acts 1963 to 2013, and the European Communities (Companies: Group Accounts) regulations 1992.
The directors are also responsible for safeguarding the assets of the company and the group and hence for taking responsible steps for the prevention and detection of fraud and other irregularities.
The directors are responsible for the maintenance and integrity of the corporate and financial information included on the company and group’s website. Legislation in Ireland governing the preparation and dissemination of financial statements may differ from legislation in other jurisdictions.
Joseph Barrett
Paul Lynch
On behalf of the directors30 April 2015
Directors’ Report and Financial Statements 22
Independent Auditors’ Report to the Members of Petrogas Global Limited
We have audited the financial statements of Petrogas Global Limited for the year ended 31 December 2014 which comprise the Consolidated Income Statement, the Consolidated Statement of Comprehensive Income, the Consolidated Statement of Financial Position, the Company Statement of Financial Position, the Consolidated Statement of Changes in Equity, the Company Statement of Changes in Equity, the Consolidated Statement of Cash Flows, the Company Statement of Cash Flows and the related notes. The financial reporting framework that has been applied in their preparation is Irish law and International Financial Reporting Standards (IFRSs) as adopted by the European Union and, as regards the parent company financial statements, as applied in accordance with the provisions of the Companies Acts 1963 to 2013.
Respective responsibilities of directors and auditorsAs explained more fully in the Directors’ Responsibilities Statement set out on page 6, the directors are responsible for the preparation of the financial statements giving a true and fair view. Our responsibility is to audit and express an opinion on the financial statements in accordance with Irish law and International Standards on Auditing (UK and Ireland). Those standards require us to comply with the Auditing Practices Board’s Ethical Standards for Auditors.
This report, including the opinions, has been prepared for and only for the company’s members as a body in accordance with Section 193 of the Companies Act, 1990 and for no other
purpose. We do not, in giving these opinions, accept or assume responsibility for any other purpose or to any other person to whom this report is shown or into whose hands it may come save where expressly agreed by our prior consent in writing.
Scope of the audit of the financial statementsAn audit involves obtaining evidence about the amounts and disclosures in the financial statements sufficient to give reasonable assurance that the financial statements are free from material misstatement, whether caused by fraud or error. This includes an assessment of: whether the accounting policies are appropriate to the group’s and the parent company’s circumstances and have been consistently applied and adequately disclosed; the reasonableness of significant accounting estimates made by the directors; and the overall presentation of the financial statements. In addition, we read all the financial and non-financial information in the Directors’ Report to identify material inconsistencies with the audited financial statements. If we become aware of any apparent material misstatements or inconsistencies we consider the implications for our report.
Opinion on financial statementsIn our opinion:
• the group financial statements give a true and fair view, in accordance with IFRSs as adopted by the European Union, of the state of the group’s affairs as at 31 December 2014 and of its profit and cash flows for the year then ended;
• the parent company financial statements give a true and fair view, in accordance with IFRSs as adopted by the European Union as applied in accordance with the provisions of the Companies Acts 1963 to 2013, of the state of the parent company’s affairs as at 31 December 2014 and cash flows for the year then ended; and
• the financial statements have been properly prepared in accordance with the requirements of the Companies Acts 1963 to 2013.
Matters on which we are required to report by the Companies Acts 1963 to 2013• We have obtained all the information
and explanations which we consider necessary for the purposes of our audit.
• In our opinion proper books of account have been kept by the parent company.
• The Company Statement of Financial Position is in agreement with the books of account.
• In our opinion the information given in the Directors’ Report is consistent with the financial statements.
• The net assets of the parent company, as stated in the Company Statement of Financial Position, are more than half of the amount of its called-up share capital and, in our opinion, on that basis there did not exist at 31 December 2014 a financial situation which under Section 40 (1) of the Companies (Amendment) Act, 1983 would require the convening of an
PETROGAS GLOBAL Annual Report 2014 Directors’ Report and Financial Statements23
extraordinary general meeting of the parent company.
Matters on which we are required to report by exceptionWe have nothing to report in respect of the provisions in the Companies Acts 1963 to 2013 which require us to report to you if, in our opinion, the disclosures of directors’ remuneration and transactions specified by law are not made.
Kevin Egan for and on behalf of PricewaterhouseCoopers Chartered Accountants and Statutory Audit Firm Dublin
30 April 2015
Independent Auditors’ Report to the Members of Petrogas Global Limited (Continued)


PETROGAS GLOBAL Annual Report 2014 Directors’ Report and Financial Statements25
Year to 31 December
Year to 31 December
Year to 31 December
Notes 2014 2013 2012
€000 €000 €000
Revenue 937,322 794,623 708,718
Cost of Sales (840,740) (718,511) (639,509)
Gross assets 96,582 76,112 69,209
Selling and distribution costs (63,903) (50,240) (45,672)
Administrative expenses (16,238) (10,761) (11,738)
Other income 8 974 670 520
Finance costs 11 (2,885) 75 (5,028)Finance income 11 417 357 428Share of loss of associates - - (441)
Profit before income tax 14,947 16,213 7,278
Income tax expense 12 (2,668) (1,563) (425)
Profit for the year 12,279 14,650 6,853
Earnings per share from continuing operations a&ributable to the owners of the parent company during the year
Earnings per share – Basic 20.47c 24.42c 11.42c
Earnings per share – Diluted 20.42c 24.42c 11.42c
Non-GAAP measure: Reconciliation of Profit before income tax to Earnings before tax, interest, depreciation and amortisation (EBITDA), net foreign exchange loss/(gain), share based payments and other non-recurring gains and losses (Adjusted EBITDA)
Profit before income tax 14,947 16,213 7,278
Depreciation 9 5,604 4,080 3,687
Amortisation 9 116 89 76
Net impairment charge 9 293 - 1,266
Net finance cost/(income) 11 2,468 (432) 4,600
EBITDA 23,428 19,950 16,907
Net foreign exchange loss/(gain) 9 (205) 601 (140)
Share based payments 29 332 - -
Profit on disposal of assets 9 (2,872) (1,621) (507)
Share of loss of associates 16 - - 441
Other non-recurring losses 9 2,093 - -
Adjusted EBITDA 22,776 18,930 16,701
Consolidated Income StatementYear ended 31 December 2014
On behalf of the directors30 April 2015 Joseph BarrettPaul Lynch
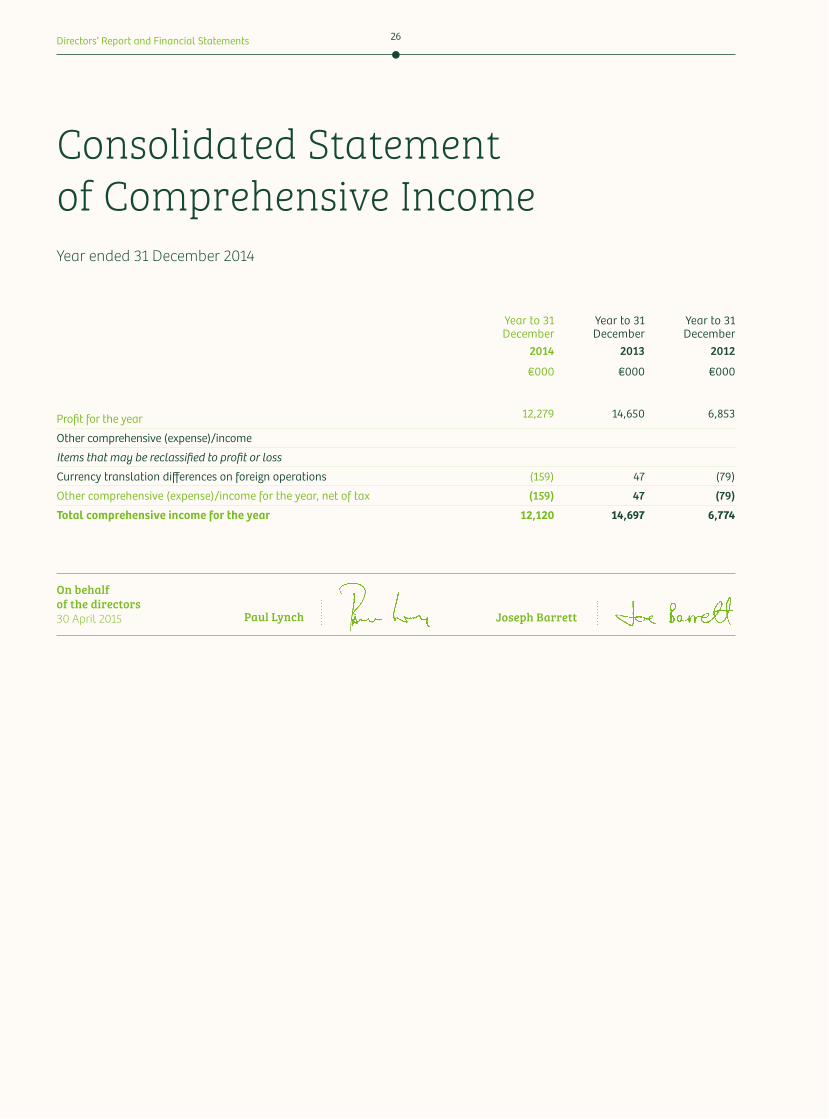
Directors’ Report and Financial Statements 26
Year to 31 December
Year to 31 December
Year to 31 December
2014 2013 2012 €000 €000 €000
Profit for the year 12,279 14,650 6,853
Other comprehensive (expense)/income
Items that may be reclassified to profit or loss
Currency translation differences on foreign operations (159) 47 (79)
Other comprehensive (expense)/income for the year, net of tax (159) 47 (79)
Total comprehensive income for the year 12,120 14,697 6,774
Consolidated Statement of Comprehensive IncomeYear ended 31 December 2014
On behalf of the directors30 April 2015 Joseph BarrettPaul Lynch
PETROGAS GLOBAL Annual Report 2014 Directors’ Report and Financial Statements27
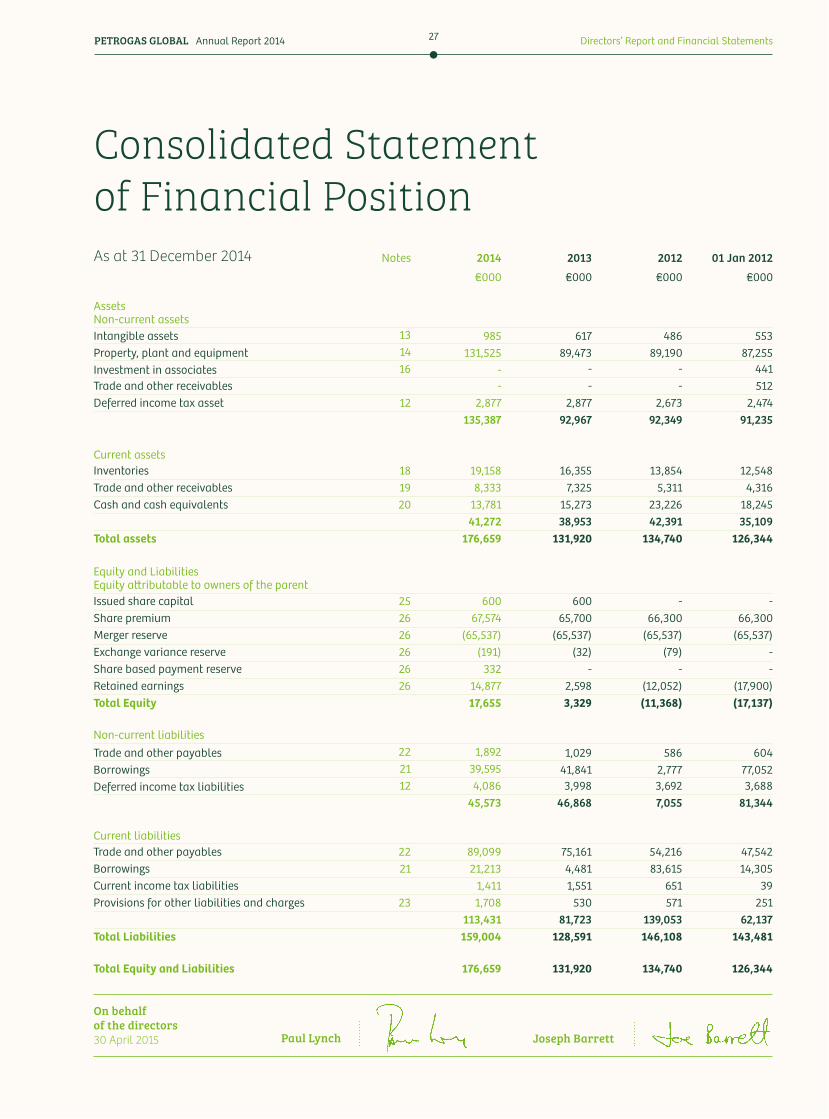
Consolidated Statement of Financial PositionAs at 31 December 2014 Notes 2014 2013 2012 01 Jan 2012
€000 €000 €000 €000
Assets Non-current assetsIntangible assets 13 985 617 486 553Property, plant and equipment 14 131,525 89,473 89,190 87,255Investment in associates 16 - - - 441Trade and other receivables - - - 512Deferred income tax asset 12 2,877 2,877 2,673 2,474
135,387 92,967 92,349 91,235
Current assetsInventories 18 19,158 16,355 13,854 12,548Trade and other receivables 19 8,333 7,325 5,311 4,316Cash and cash equivalents 20 13,781 15,273 23,226 18,245
41,272 38,953 42,391 35,109Total assets 176,659 131,920 134,740 126,344
Equity and LiabilitiesEquity a&ributable to owners of the parentIssued share capital 25 600 600 - -Share premium 26 67,574 65,700 66,300 66,300Merger reserve 26 (65,537) (65,537) (65,537) (65,537)Exchange variance reserve 26 (191) (32) (79) -Share based payment reserve 26 332 - - -Retained earnings 26 14,877 2,598 (12,052) (17,900)Total Equity 17,655 3,329 (11,368) (17,137)
Non-current liabilitiesTrade and other payables 22 1,892 1,029 586 604Borrowings 21 39,595 41,841 2,777 77,052Deferred income tax liabilities 12 4,086 3,998 3,692 3,688
45,573 46,868 7,055 81,344
Current liabilitiesTrade and other payables 22 89,099 75,161 54,216 47,542Borrowings 21 21,213 4,481 83,615 14,305Current income tax liabilities 1,411 1,551 651 39Provisions for other liabilities and charges 23 1,708 530 571 251
113,431 81,723 139,053 62,137Total Liabilities 159,004 128,591 146,108 143,481
Total Equity and Liabilities 176,659 131,920 134,740 126,344
On behalf of the directors30 April 2015 Joseph BarrettPaul Lynch

Directors’ Report and Financial Statements 28
Company Statement of Financial PositionAs at 31 December 2014
Notes 2014 2013 2012 01 Jan 2012
€000 €000 €000 €000
Assets
Non-current assetsFinancial assets 17 122,441 107,110 66,300 66,300
Deferred income tax assets 12 - 11 - -
122,441 107,121 66,300 66,300
Current assets
Trade and other receivables 19 1,959 4,048 1,005 -
1,959 4,048 1,005 -
Total assets 124,400 111,169 67,305 66,300
Equity and Liabilities
Issued share capital 25 600 600 - -
Share premium 26 67,574 65,700 66,300 66,300
Retained earnings 26 704 (85) - -
Share based payment reserve 26 332 - - -
Total Equity 69,210 66,215 66,300 66,300
Non-current liabilities
Borrowings 21 35,997 38,575 - -35,997 38,575 - -
Current liabilitiesTrade and other payables 22 364 3,767 1,005 -
Borrowings 21 18,829 2,373 - -
Current income tax liabilities - 239 - -
19,193 6,379 1,005 -
Total Liabilities 55,190 44,954 1,005 -
Total Equity and Liabilities 124,400 111,169 67,305 66,300
On behalf of the directors30 April 2015 Joseph BarrettPaul Lynch
PETROGAS GLOBAL Annual Report 2014 Directors’ Report and Financial Statements29
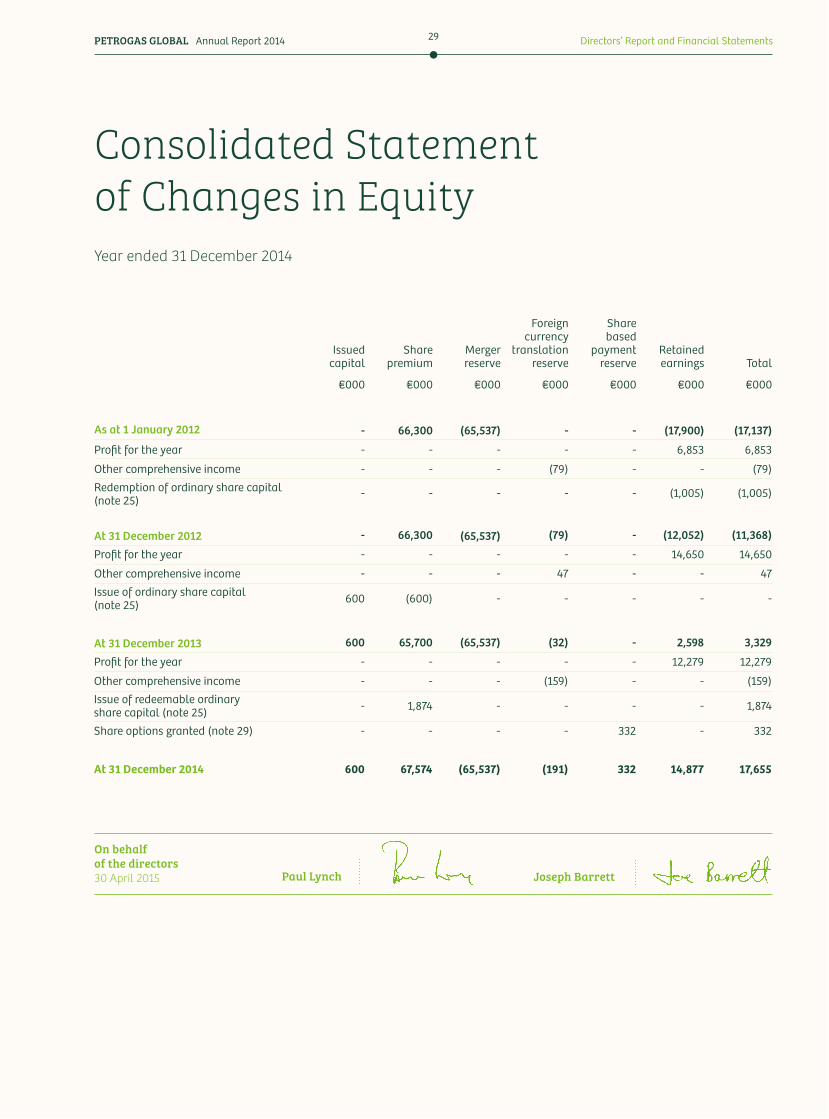
Consolidated Statement of Changes in EquityYear ended 31 December 2014
Issued capital
Share premium
Merger reserve
Foreign currency
translation reserve
Share based
payment reserve
Retainedearnings Total
€000 €000 €000 €000 €000 €000 €000
As at 1 January 2012 - 66,300 (65,537) - - (17,900) (17,137)
Profit for the year - - - - - 6,853 6,853
Other comprehensive income - - - (79) - - (79)Redemption of ordinary share capital (note 25)
- - - - - (1,005) (1,005)
At 31 December 2012 - 66,300 (65,537) (79) - (12,052) (11,368)
Profit for the year - - - - - 14,650 14,650
Other comprehensive income - - - 47 - - 47Issue of ordinary share capital (note 25) 600 (600) - - - - -
At 31 December 2013 600 65,700 (65,537) (32) - 2,598 3,329
Profit for the year - - - - - 12,279 12,279
Other comprehensive income - - - (159) - - (159)Issue of redeemable ordinary share capital (note 25) - 1,874 - - - - 1,874
Share options granted (note 29) - - - - 332 - 332
At 31 December 2014 600 67,574 (65,537) (191) 332 14,877 17,655
On behalf of the directors30 April 2015 Joseph BarrettPaul Lynch
Directors’ Report and Financial Statements 30
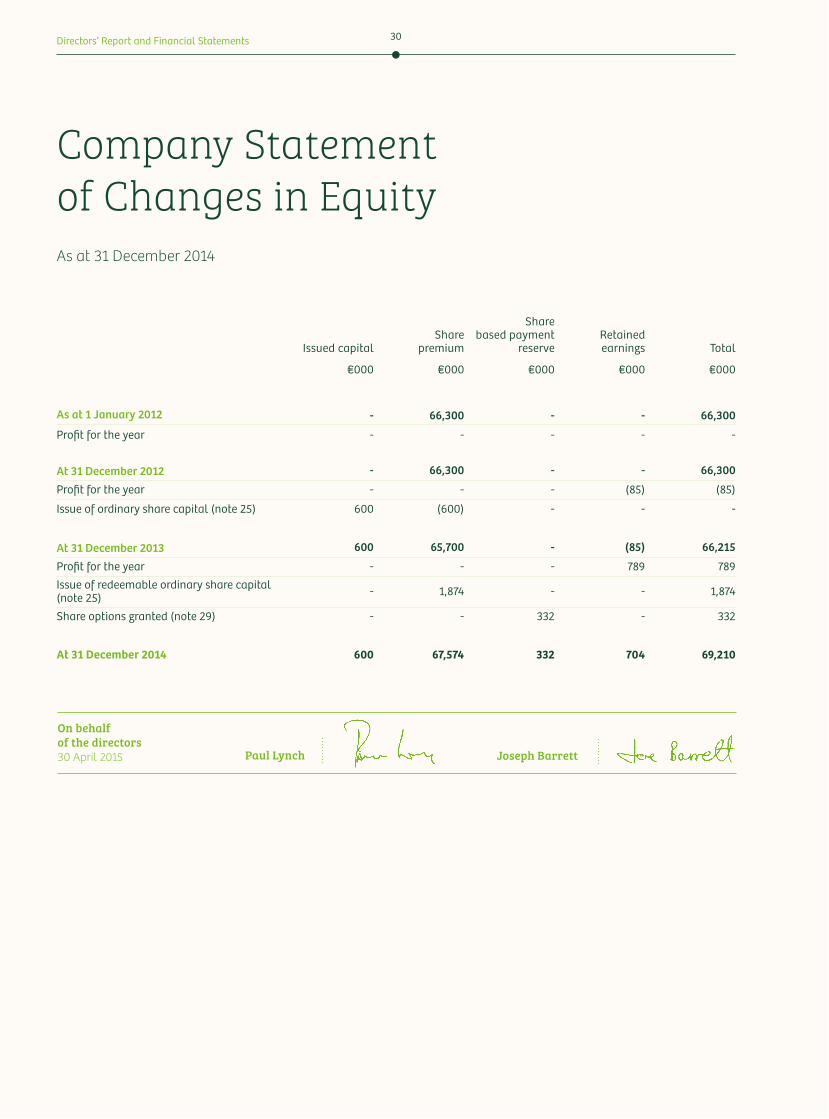
Company Statement of Changes in EquityAs at 31 December 2014
Issued capitalShare
premium
Share based payment
reserveRetainedearnings Total
€000 €000 €000 €000 €000
As at 1 January 2012 - 66,300 - - 66,300
Profit for the year - - - - -
At 31 December 2012 - 66,300 - - 66,300
Profit for the year - - - (85) (85)
Issue of ordinary share capital (note 25) 600 (600) - - -
At 31 December 2013 600 65,700 - (85) 66,215
Profit for the year - - - 789 789Issue of redeemable ordinary share capital (note 25) - 1,874 - - 1,874
Share options granted (note 29) - - 332 - 332
At 31 December 2014 600 67,574 332 704 69,210
On behalf of the directors30 April 2015 Joseph BarrettPaul Lynch
PETROGAS GLOBAL Annual Report 2014 Directors’ Report and Financial Statements31
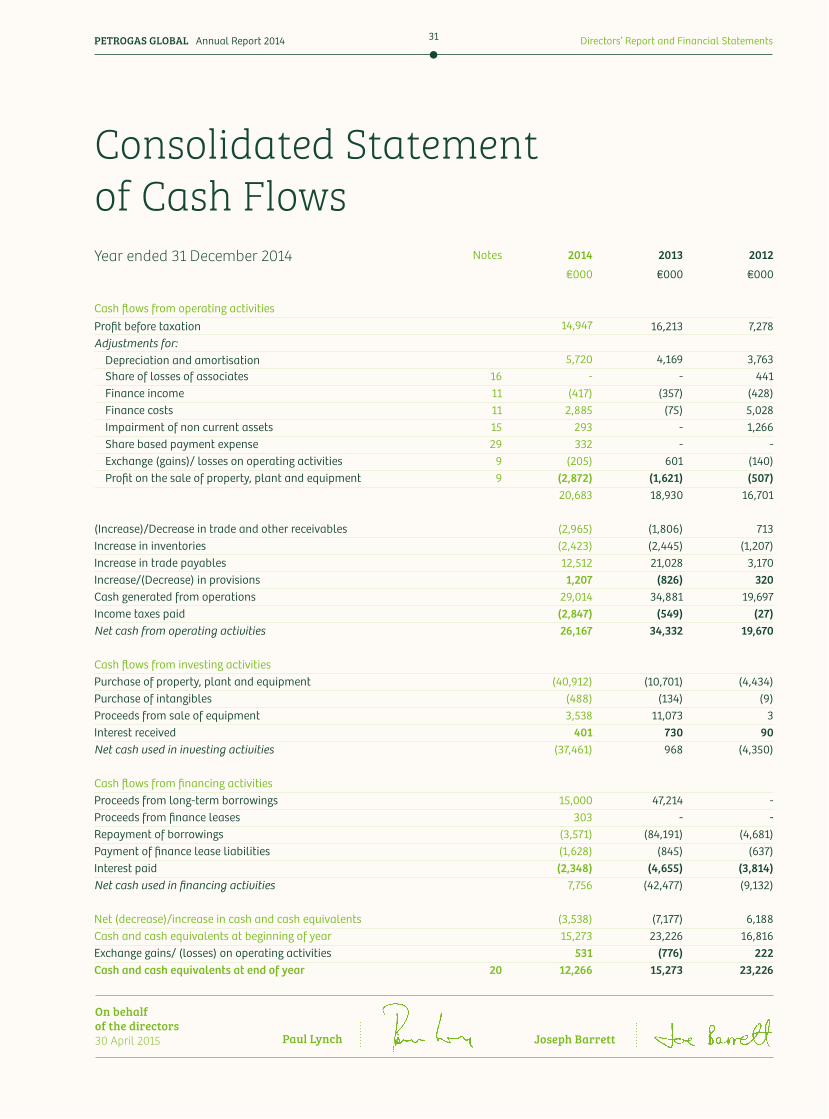
Consolidated Statement of Cash FlowsYear ended 31 December 2014 Notes 2014 2013 2012
€000 €000 €000
Cash flows from operating activitiesProfit before taxation 14,947 16,213 7,278Adjustments for: Depreciation and amortisation 5,720 4,169 3,763 Share of losses of associates 16 - - 441 Finance income 11 (417) (357) (428) Finance costs 11 2,885 (75) 5,028 Impairment of non current assets 15 293 - 1,266 Share based payment expense 29 332 - - Exchange (gains)/ losses on operating activities 9 (205) 601 (140) Profit on the sale of property, plant and equipment 9 (2,872) (1,621) (507)
20,683 18,930 16,701
(Increase)/Decrease in trade and other receivables (2,965) (1,806) 713Increase in inventories (2,423) (2,445) (1,207)Increase in trade payables 12,512 21,028 3,170Increase/(Decrease) in provisions 1,207 (826) 320Cash generated from operations 29,014 34,881 19,697Income taxes paid (2,847) (549) (27)Net cash from operating activities 26,167 34,332 19,670
Cash flows from investing activitiesPurchase of property, plant and equipment (40,912) (10,701) (4,434)Purchase of intangibles (488) (134) (9)Proceeds from sale of equipment 3,538 11,073 3Interest received 401 730 90Net cash used in investing activities (37,461) 968 (4,350)
Cash flows from financing activitiesProceeds from long-term borrowings 15,000 47,214 -Proceeds from finance leases 303 - -Repayment of borrowings (3,571) (84,191) (4,681)Payment of finance lease liabilities (1,628) (845) (637)Interest paid (2,348) (4,655) (3,814)Net cash used in financing activities 7,756 (42,477) (9,132)
Net (decrease)/increase in cash and cash equivalents (3,538) (7,177) 6,188Cash and cash equivalents at beginning of year 15,273 23,226 16,816Exchange gains/ (losses) on operating activities 531 (776) 222Cash and cash equivalents at end of year 20 12,266 15,273 23,226
On behalf of the directors30 April 2015 Joseph BarrettPaul Lynch
Directors’ Report and Financial Statements 32
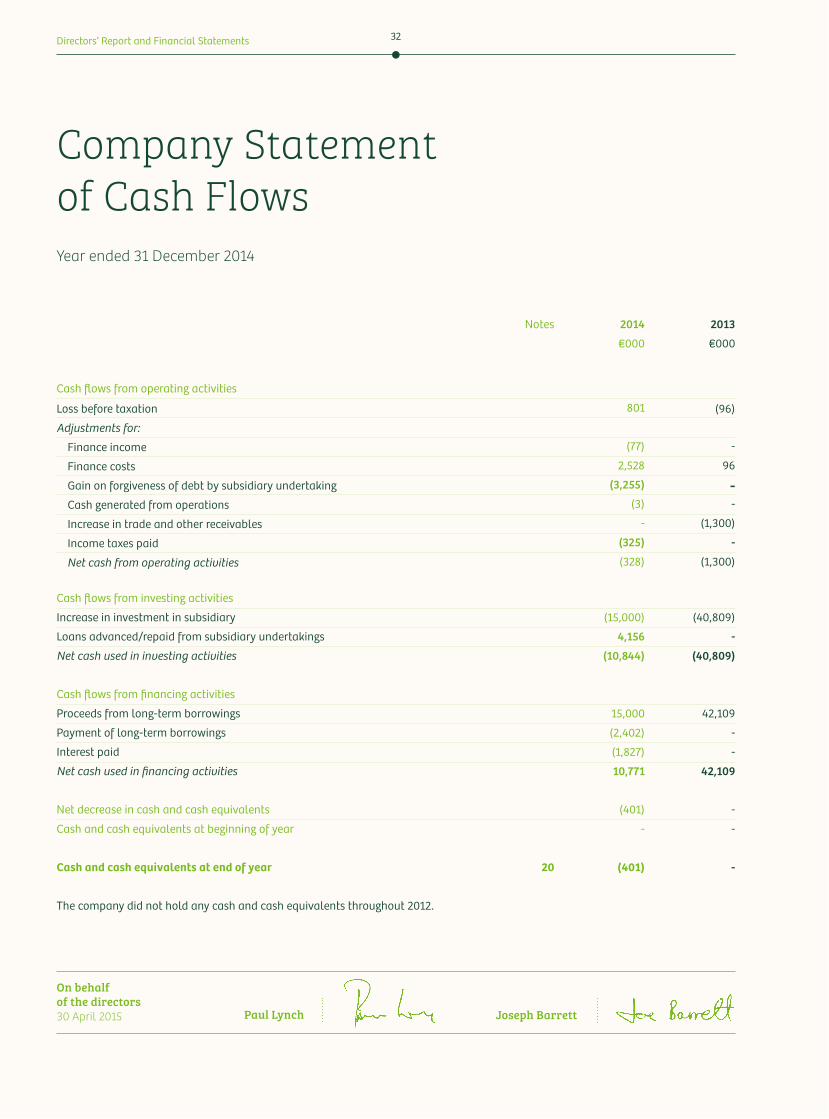
Company Statement of Cash FlowsYear ended 31 December 2014
Notes 2014 2013
€000 €000
Cash flows from operating activities
Loss before taxation 801 (96)
Adjustments for:
Finance income (77) -
Finance costs 2,528 96
Gain on forgiveness of debt by subsidiary undertaking (3,255) - Cash generated from operations (3) -
Increase in trade and other receivables - (1,300)
Income taxes paid (325) -
Net cash from operating activities (328) (1,300)
Cash flows from investing activities
Increase in investment in subsidiary (15,000) (40,809)
Loans advanced/repaid from subsidiary undertakings 4,156 -
Net cash used in investing activities (10,844) (40,809)
Cash flows from financing activities
Proceeds from long-term borrowings 15,000 42,109
Payment of long-term borrowings (2,402) -
Interest paid (1,827) -
Net cash used in financing activities 10,771 42,109
Net decrease in cash and cash equivalents (401) -
Cash and cash equivalents at beginning of year - -
Cash and cash equivalents at end of year 20 (401) -
The company did not hold any cash and cash equivalents throughout 2012.
On behalf of the directors30 April 2015 Joseph BarrettPaul Lynch
PETROGAS GLOBAL Annual Report 2014 Directors’ Report and Financial Statements33
Notes to the Consolidated Financial Statements
1. Statement of complianceThe consolidated financial statements of Petrogas Global Limited have been prepared in accordance with International Financial Reporting Standards (IFRS) and their interpretations approved by the International Accounting Standards Board (IASB) as adopted by the European Union (EU) and those parts of the Companies Acts, 1963 to 2013 applicable to companies reporting under IFRS. IFRS as adopted by the EU differ in certain respects from IFRS as issued by the IASB. Both the company and the group financial statements have been prepared in accordance with IFRS as adopted by the EU and references to IFRS hereafter should be construed as references to IFRS as adopted by the EU.
The preparation of financial statements in conformity with IFRS requires the use of certain critical accounting estimates. It also requires management to exercise its judgement in the process of applying the group’s accounting policies. The areas involving a higher degree of judgement or complexity, or areas where assumptions and estimates are significant to the consolidated financial statements are disclosed in note 3.
In presenting the parent company financial statements together with the group financial statements, the company has availed of the exemption in Section 148(8) of the Companies Act 1963 not to present its individual Income Statement and related notes that form part of the approved Company financial statements. The Company has also availed of the exemption from filing its individual Income Statement with the Registrar of Companies as permi*ed by Section 7(1A) of the Companies (Amendment) Act 1986.
The Company’s result for the financial year, determined in accordance with IFRS, is a profit for the year of €789,000 (2013: €(85,000), 2012: €nil).
2. Basis of accountingFor all periods up to and including 31 December 2013 the group prepared its financial statements in accordance with applicable Irish law and Generally Accepted Accounting Practice in Ireland including the accounting standards issued by the Financial Reporting Council and published by The Institute of Chartered Accountants in Ireland.
These are the group’s first consolidated financial statements prepared in accordance with IFRS. The accounting policies set out in note 2.2 have been applied in preparing the financial statements for the year ended 31 December 2014, the comparative information presented in these financial statements for the years ended 31 December 2013 and 31 December 2012 and in the preparation of the opening IFRS Statement of Financial Position at 1 January 2012 (the group’s date of transition). In preparing its opening IFRS Statement of Financial Position, the group has adjusted the amounts reported previously in financial statements prepared with Irish GAAP. An explanation of how the transition from Irish GAAP to IFRS has affected the group’s financial position, financial performance and cash flows is set out in note 5.
Directors’ Report and Financial Statements 34
The consolidated financial statements have been prepared on a historical cost basis. The consolidated financial statements are presented in Euro (€) and all values are rounded to the nearest thousand (€000), except where otherwise stated.
2.1 Basis of consolidationThe consolidated financial statements comprise the financial statements of the group and its subsidiaries as at 31 December 2014.
Subsidiaries are consolidated from the date of acquisition, being the date on which the group obtains control, and continue to be consolidated until the date when such control ceases. The group controls an entity when the group is exposed to, or has rights to, variable returns from its involvement with the entity, and has the ability to affect those returns through its control over the entity. Subsidiaries are accounted for using the acquisition method as at the acquisition date i.e. when control is transferred to the group. The financial statements of the subsidiaries are prepared for the same reporting period as the parent company using consistent accounting policies.
The consideration transferred for the acquisition of a subsidiary is the fair values of the assets transferred, the liabilities incurred by the former owners of the acquiree and the equity interests issued by the group. The consideration transferred includes the fair value of any asset or liability resulting from a contingent consideration arrangement. Identifiable assets acquired and liabilities and contingent liabilities assumed in a business combination are measured initially at their fair values at the acquisition date. The group recognises any non-controlling interest in the acquiree on an acquisition-by-acquisition basis, either at fair value or at the non-controlling interest’s proportionate share of the recognised amounts of the acquiree’s identifiable net assets.
Acquisition-related costs are expensed as incurred.
All intra-group balances, transactions, unrealised gains and losses resulting from intra-group transactions and dividends are eliminated in full.
Associates are all entities over which the group has significant influence. Significant influence is the power to participate in the financial and operating policy decisions of the investee, but is not control or joint control, generally accompanying a shareholding of 20-50% of the voting rights. Investments in associates are accounted for using the equity method of accounting. Under the equity method, the investment is initially recognised at cost and the carrying amount increased or decreased to recognise the investor’s share of the profit or loss of the investee after the date of acquisition.
2.2 Significant accounting policiesThe following are significant accounting policies applied by the group in preparing its consolidated financial statements:
AssociatesThe group’s share of post-acquisition profit or loss is recognised in the Income Statement, and its share of post-acquisition movements in other comprehensive income is recognised in other comprehensive income with a corresponding adjustment to the carrying amount of the investment. When the group’s share of losses in an associate equals or exceeds its equity interest in the associate and any other long term interests, the group does not recognise further losses, unless it has incurred legal or constructive obligations or made payments on behalf of the associate.
Notes to the Consolidated Financial Statements (Continued)
PETROGAS GLOBAL Annual Report 2014 Directors’ Report and Financial Statements35
The group determines at each reporting date whether there is any objective evidence that the investment in the associate is impaired. If this is the case, the group calculates the amount of impairment as the difference between the recoverable amount of the associate and its carrying value and recognises the amount adjacent to ‘share of profit / (loss)’ of associates in the Income Statement.
Profits and losses resulting from upstream and downstream transactions between the group and its associates are recognised in the group’s financial statements only to the extent of unrelated investors’ interests in the associates. Unrealised losses are eliminated unless the transaction provides evidence of an impairment of the asset transferred. Accounting policies of associates have been changed where necessary to ensure consistency with the policies adopted by the group. Investment in associates is shown separately on the group Statement of Financial Position.
TurnoverTurnover from the sale of goods in the course of ordinary activities is measured at the fair value of consideration received or receivable, excluding value added tax and net of returns, trade discounts and including duty on goods to external customers.
Revenue is recognised when the significant risks and rewards of ownership have been transferred to the customer, it is probable that economic benefits will flow to the group, the associated costs can be measured reliably, there is no continuing managerial involvement with the goods, and the amount of revenue can be measured reliably. If it is probable that discounts will be granted and the amount can be measured reliably, then the discount is recognised as a reduction of revenue as the sales are recognised.
Retail sales The group’s revenue is earned from fuel, shop and restaurant sales throughout its network of service stations in Ireland, the UK and the USA. Sales of goods are recognised when the group sells a product to the customer. Retail sales are usually in cash or by credit card. Due to the nature of the products sold, the group does not experience material levels of returns.
Gross versus net presentationWhen deciding the most appropriate basis for presenting revenue or costs of revenue, both the legal form and substance of the agreement between the group and its business partners are reviewed to determine each party’s respective role in the transaction. Where the group’s role in a transaction is that of principal, revenue is recognised on a gross basis. This requires revenue to comprise the gross value of the transaction billed to the customer, after trade discounts, with any related expenditure charged as an operating cost. Where the group’s role in a transaction is that of an agent, revenue is recognised on a net basis with revenue representing the margin earned.
Customer loyalty programmesThe group operates a customer loyalty programme whereby points are awarded on the sale of goods. Revenue is recorded at the amount of the consideration received or receivable less the fair value of the points awarded. The fair value of the points awarded is deducted from the consideration received on the initial purchase and carried forward as a liability until the points are redeemed.
Interest incomeInterest income is recognised using the effective interest rate method when it is probable that income will flow to the group. When a loan or receivable is impaired, the group reduces the carrying amount to its recoverable amount, being the estimated future cash
Notes to the Consolidated Financial Statements (Continued)
Directors’ Report and Financial Statements 36
flow discounted at the original effective interest rate of the instrument, and continues unwinding the discount as interest income. Interest income on impaired loans and receivables is recognised using the original effective interest rate.
Segmental information Operating segments are reported in a manner consistent with the internal reporting provided to the chief operating decision-maker. The chief operating decision-maker, who is responsible for allocating resources and assessing performance of the operating segments, has been identified as the board of directors that makes strategic decisions.
Going concernThe group’s forecasts and projections, taking account of reasonably possible changes in trading performance, show that the group expects to operate within the level of its current banking facilities. The directors are confident that the group has adequate resources to continue in operational existence for the foreseeable future. The group therefore continues to adopt the going concern basis in preparing its consolidated financial statements.
Foreign currenciesItems included in the financial statements of each of the group’s entities are measured using the currency of the primary economic environment in which the entity operates (the functional currency). The consolidated financial statements are presented in Euro (€), which is the group’s presentation currency.
Foreign currency transactions are translated into the functional currency using the exchange rates prevailing at the dates of the transactions or valuation where items are re-measured. Foreign exchange gains and losses resulting from the se*lement of such transactions and from the translation at year-end exchange rates of monetary assets and liabilities denominated in foreign currencies are recognised in the Income Statement.
Foreign exchange gains and losses that relate to borrowings and cash and cash equivalents are presented in the Income Statement within finance costs. All other foreign exchange gains and losses are presented in the Income Statement within administrative expenses.
The results and financial position of all the group entities that have a functional currency different from the presentation currency are translated into the presentation currency as follows:
(a) assets and liabilities for each Statement of Financial Position presented are translated at the closing rate at the date of that Statement of Financial Position;
(b) income and expenses for each Income Statement are translated at average exchange rates (unless this average is not a reasonable approximation of the cumulative effect of the rates prevailing on the transaction dates, in which case income and expenses are translated at the rate on the dates of the transactions); and
(c) all resulting exchange differences are recognised in other comprehensive income.
Property, plant & equipmentProperty, plant and equipment is stated at cost, less accumulated depreciation and accumulated impairment losses. The initial cost of an asset comprises its purchase price or construction cost plus any costs directly a*ributable to bringing the asset into the location and condition necessary for it to be capable of operating in a manner intended by management.
Notes to the Consolidated Financial Statements (Continued)
PETROGAS GLOBAL Annual Report 2014 Directors’ Report and Financial Statements37
Subsequent costs are included in the asset’s carrying amount or recognised as a separate asset, as appropriate, only when it is probable that future economic benefits associated with the item will flow to the group and the cost of the item can be measured reliably.
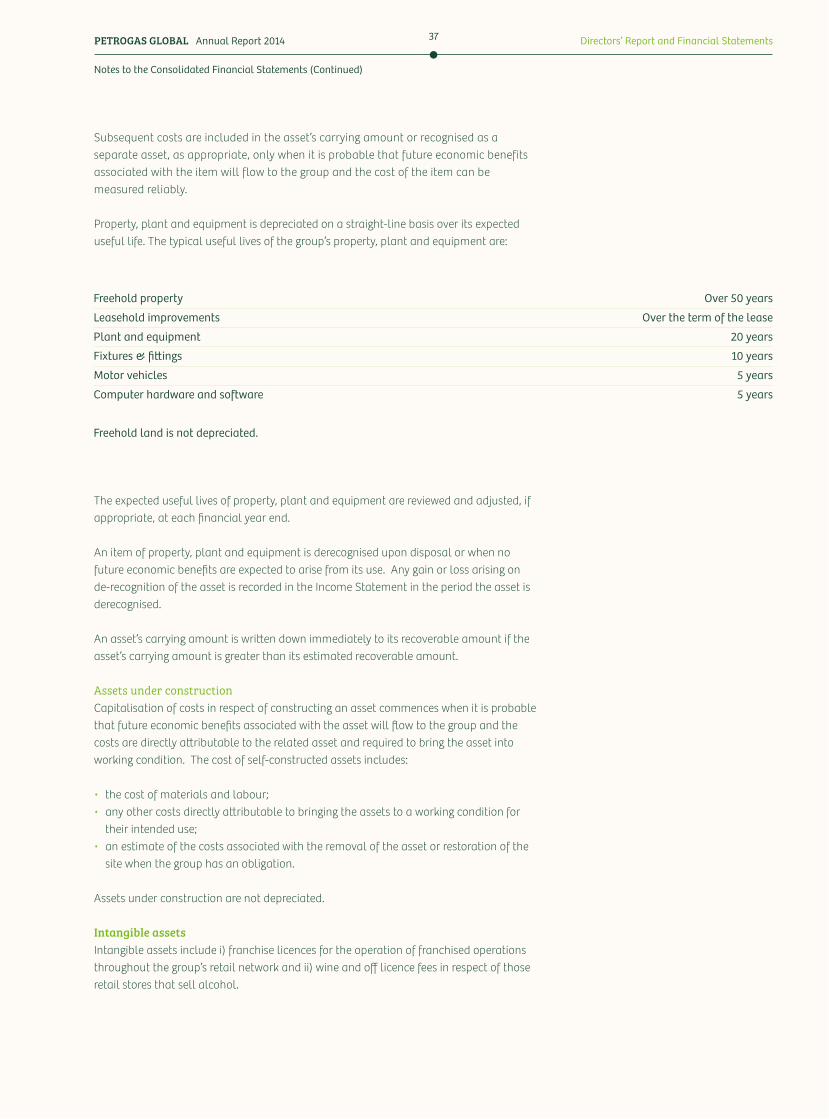
Property, plant and equipment is depreciated on a straight-line basis over its expected useful life. The typical useful lives of the group’s property, plant and equipment are:
Freehold property Over 50 years
Leasehold improvements Over the term of the lease
Plant and equipment 20 years
Fixtures & fi&ings 10 years
Motor vehicles 5 years
Computer hardware and software 5 years
Freehold land is not depreciated.
The expected useful lives of property, plant and equipment are reviewed and adjusted, if appropriate, at each financial year end.
An item of property, plant and equipment is derecognised upon disposal or when no future economic benefits are expected to arise from its use. Any gain or loss arising on de-recognition of the asset is recorded in the Income Statement in the period the asset is derecognised.
An asset’s carrying amount is wri*en down immediately to its recoverable amount if the asset’s carrying amount is greater than its estimated recoverable amount.
Assets under construction Capitalisation of costs in respect of constructing an asset commences when it is probable that future economic benefits associated with the asset will flow to the group and the costs are directly a*ributable to the related asset and required to bring the asset into working condition. The cost of self-constructed assets includes:
• the cost of materials and labour;• any other costs directly a*ributable to bringing the assets to a working condition for
their intended use;• an estimate of the costs associated with the removal of the asset or restoration of the
site when the group has an obligation.
Assets under construction are not depreciated.
Intangible assetsIntangible assets include i) franchise licences for the operation of franchised operations throughout the group’s retail network and ii) wine and off licence fees in respect of those retail stores that sell alcohol.
Notes to the Consolidated Financial Statements (Continued)
Directors’ Report and Financial Statements 38
Franchises 5-25 years
Licences 10 years
Intangible assets acquired are initially capitalised at cost and amortised using the straight-line basis over their useful lives as follows;
Impairment of non-financial assets
The carrying amounts of the group’s property, plant and equipment, and intangible assets are reviewed at each reporting date to determine whether there is any indication of impairment. If events or changes in circumstances indicate that the carrying value of property, plant and equipment, or intangible assets may not be recoverable, the group carries out an impairment test.
When testing for impairment assets are grouped together into the smallest group of assets that is largely independent of the group’s other cash generating streams. The recoverable amount in respect of the cash generating units (CGUs) is the higher of its fair value less cost of disposal and the value in use.
Value in use is determined by discounting to present value the estimated future cash flows expected to be derived from the CGU. The discount rate used is the company’s weighted average cost of capital reflecting current market assessments of the time value of money and the risks specific to the CGU.
To the extent that the carrying amount exceeds the recoverable amount, the asset is impaired and is wri*en down. Any impairment loss arising is recognised in the Consolidated Income Statement.
Prior impairments of non-financial assets (other than goodwill) are reviewed for possible reversal at each reporting date.
Financial assetsClassification The group classifies its financial assets in the following categories: at fair value through profit or loss, loans and receivables, and available for sale. The classification depends on the purpose for which the financial assets were acquired. Management determines the classification of its financial assets at initial recognition.
Loans and receivablesLoans and receivables are non-derivative financial assets with fixed or determinable payments that are not quoted in an active market. They are included in current assets, except for maturities greater than 12 months after the end of the reporting period. These are classified as non-current assets. The group’s loans and receivables comprise trade and other receivables and cash and cash equivalents in the Statement of Financial Position. Loans and receivables are initially recognised at fair value and subsequently at amortised cost using the effective interest rate method less any impairment losses.
Investments in subsidiariesInterests in subsidiary undertakings are measured at cost less provisions for impairment in value on the company Statement of Financial Position. The company carries out an impairment test if events or changes in circumstances indicate that the carrying value
Notes to the Consolidated Financial Statements (Continued)
PETROGAS GLOBAL Annual Report 2014 Directors’ Report and Financial Statements39
of the investment in a subsidiary may not be recoverable. The recoverable amount is determined by comparing the carrying value of the investment in the subsidiary against the higher of its fair value less costs to dispose and its value in use. The value in use is determined by discounting estimated future cash flows expected to be derived from the financial asset, to net present value.
Impairment of financial assets The group assesses at the end of each reporting period whether there is objective evidence that a financial asset or group of financial assets is impaired. A financial asset or a group of financial assets is impaired and impairment losses are incurred only if there is objective evidence of impairment as a result of one or more events that occurred after the initial recognition of the asset (a loss event) and that loss event (or events) has an impact on the estimated future cash flows of the financial asset or group of financial assets that can be reliably estimated.
Evidence of impairment may include indications that a debtor or a group of debtors are experiencing significant financial difficulty, default or delinquency in interest or principal payments, indicating that they will enter bankruptcy or other financial reorganisation.
For loans and receivables, the amount of the loss is measured as the difference between the asset’s carrying amount and the present value of estimated future cash flows (excluding future credit losses that have not been incurred) discounted at the financial asset’s original effective interest rate. The carrying amount of the asset is reduced and the amount of the loss is recognised in the Consolidated Income Statement. If a loan or held-to-maturity investment has a variable interest rate, the discount rate for measuring any impairment loss is the current effective interest rate determined under the contract.
If, in a subsequent period, the amount of the impairment loss decreases and the decrease can be related objectively to an event occurring after the impairment was recognised (such as an improvement in the debtor’s credit rating), the reversal of the previously recognised impairment loss is recognised in the Consolidated Income Statement.
Inventory Inventories are stated at the lower of cost and net realisable value. Cost is determined using the first-in, first-out (FIFO) method. Net realisable value is the estimated selling price in the ordinary course of business, less applicable variable selling expenses. Costs of inventories include the transfer from equity of any gains/losses on qualifying cash flow hedges for purchases of raw materials.
Cash and cash equivalents In the consolidated statement of cash flows, cash and cash equivalents includes cash in hand, deposits held at call with banks, other short-term highly liquid investments with original maturities of three months or less and bank overdrafts. In the Consolidated Statement of Financial Position, bank overdrafts are shown within borrowings in current liabilities.
Trade payablesTrade payables are obligations to pay for goods or services that have been acquired in the ordinary course of business from suppliers. Accounts payable are classified as current liabilities if payment is due within one year or less (or in the normal operating cycle of the business if longer). If not, they are presented as non current liabilities. Trade payables are initially recorded at fair value and subsequently amortised cost using the effective interest rate method.
Notes to the Consolidated Financial Statements (Continued)
Directors’ Report and Financial Statements 40
Provisions A provision is defined as a liability of uncertain timing or amount. Provisions are recognised when the group has a present legal or constructive obligation as a result of a past event, a reliable estimate of that obligation can be made and it is probable that an outflow of economic benefits will be required to se*le the obligation. Where the effect of the time value of money is material, provisions are discounted to present value, using a pre–tax discount rate that reflects current market assessments of the time value of money and the risks specific to the liability. The amortisation of any discount is recognised as a finance cost in the Income Statement. The amount of a provision is reviewed each year and amended as appropriate.
Defined contribution planThe group operates a defined contribution plan. A defined contribution plan is a post-employment benefit plan under which an entity pays fixed contributions into a separate entity. The group has no further payment obligations once the contributions have been paid. Obligations for contributions to defined contribution plans are recognised as an employee benefit expense in the Income Statement in the periods during which the related services are received. Prepaid expenses are recognised as an asset to the extent that a cash refund or a reduction in the future payments is available.
BorrowingsBorrowings are recognised initially at fair value, net of transaction costs incurred. Borrowings are subsequently carried at amortised cost using the effective interest rate method. Any difference between the proceeds (net of transaction costs) and the redemption value is recognised in the Income Statement over the period of the borrowings using the effective interest method.
Fees paid on the establishment of loan facilities are recognised as transaction costs of the loan to the extent that it is probable that some or all of the facility will be drawn down. In this case, the fee is deferred until the draw-down occurs.
General and specific borrowing costs directly a*ributable to the acquisition, construction or production of qualifying assets, which are assets that necessarily take a substantial period of time to get ready for their intended use or sale, are added to the cost of those assets, until such time as the assets are substantially ready for their intended use or sale.
Investment income earned on the temporary investment of specific borrowings pending their expenditure on qualifying assets is deducted from the borrowing costs eligible for capitalisation.
All other borrowing costs are recognised in finance costs in the period in which they are incurred.
Share based paymentsThe group launched an equity-se*led, share-based compensation plan in December 2014, under which the entity receives services from employees as consideration for equity instruments (options) of the group. The fair value of the employee services received in exchange for the grant of the options is recognised as an expense. The total amount to be expensed is determined by reference to the fair value of the options granted:
• including any market performance conditions
Notes to the Consolidated Financial Statements (Continued)
PETROGAS GLOBAL Annual Report 2014 Directors’ Report and Financial Statements41
• excluding the impact of any service and non-market performance vesting conditions and• including the impact of any non-vesting conditions.
LeasesAssets held by the group under leases which transfer to the group substantially all of the risks and rewards of ownership are classified as finance leases. On initial recognition, assets held under finance leases are included in property, plant and equipment, at the lower of fair value and the present value of the minimum lease payments. Subsequent to initial recognition, the asset is depreciated over the shorter of the lease term or its useful life and otherwise accounted for in accordance with the accounting policy applicable to that asset.
Each lease payment is allocated between the liability and finance charges. The corresponding rental obligations, net of finance charges, are included in current or non current liabilities as appropriate. The interest element of the finance cost is charged to the Income Statement over the lease period so as to produce a constant periodic rate of interest on the remaining balance of the liability for each period.
Leases in which a significant portion of the risks and rewards of ownership are retained by the lessor are classified as operating leases. Payments made under operating leases (net of any incentives received from the lessor) are charged to the Income Statement on a straight-line basis over the period of the lease.
Sale and leasebackA sale and leaseback transaction is one where the group sells an asset and immediately reacquires the use of the asset by entering into a lease with the buyer. The accounting treatment of the sale and leaseback depends upon the substance of the transaction (by applying the lease classification principles described above) and whether or not the sale was made at the asset’s fair value. For sale and finance leasebacks, any profit from the sale is deferred and amortised over the lease term. For sale and operating leasebacks, when the assets are sold at fair value, the profit or loss from the sale is recognised immediately in the Income Statement.
Taxation The tax expense for the period comprises current and deferred tax. Tax is recognised in the Income Statement, except to the extent that it relates to items recognised in other comprehensive income or directly in equity. In this case, the tax is also recognised in other comprehensive income or directly in equity, respectively.
The current income tax charge is calculated on the basis of the tax laws enacted or substantively enacted at the Statement of Financial Position date in the countries where the company and its subsidiaries operate and generate taxable income. Management periodically evaluates positions taken in tax returns with respect to situations in which applicable tax regulation is subject to interpretation. It establishes provisions where appropriate on the basis of amounts expected to be paid to the tax authorities.
Deferred income tax is recognised on temporary differences arising between the tax bases of assets and liabilities and their carrying amounts in the consolidated financial statements.
No deferred tax is recognised if the temporary difference arises from goodwill or the initial recognition of an asset or liability in a transaction that is not a business combination and, at the time of the transaction, affects neither the accounting profit nor taxable profit or loss.
Notes to the Consolidated Financial Statements (Continued)
Directors’ Report and Financial Statements 42
Deferred income tax is recognised in respect of taxable temporary differences associated with investments in associates and interests in joint ventures, except where the timing of the reversal of the temporary differences can be controlled and it is probable that the temporary differences will not reverse in the foreseeable future.
Deferred income tax assets are recognised to the extent that it is probable that taxable profit will be available against which the deductible temporary differences can be utilised. The carrying amount of deferred income tax assets is reviewed at each Statement of Financial Position date and reduced to the extent that it is no longer probable that sufficient taxable profit will be available to allow all, or part of, the deferred income tax asset to be utilised. Deferred income tax assets and liabilities are measured at the tax rates that are expected to apply in the year when the asset is realised or the liability is se*led, based on tax rates that have been enacted or substantively enacted at the Statement of Financial Position date.
Provision for a corporation tax surcharge assessable on undistributed investment income (in accordance with Section 440, Taxes Consolidation Act 1997) is provided after the time limit of 18 months has elapsed within which a dividend can be paid to avoid such surcharge.
Deferred income tax assets and liabilities are offset when there is a legally enforceable right to offset current tax assets against current tax liabilities and when the deferred income tax assets and liabilities relate to income taxes levied by the same taxation authority on either the same taxable entity or different taxable entities where there is an intention to se*le the balances on a net basis.
Share capitalOrdinary shares and redeemable ordinary shares that rank pari passu with ordinary shares, carry no preferential dividend right. Redeemable ordinary shares are redeemable only at the option of the issuer and are classified as equity.
3. Significant accounting judgements and estimatesKey assumptions concerning the future, and other key sources of estimation uncertainty, at the Statement of Financial Position date, have a significant risk of causing a material adjustment to the carrying amounts of assets and liabilities within the next financial year. The main assumptions and sources of judgement and estimation uncertainty are outlined below:
Impairment of non financial assetsThe carrying amounts of the group’s property, plant and equipment, and intangible assets are reviewed at each reporting date to determine whether there is any indication of impairment in accordance with the accounting policy set out in section 2.2 of these financial statements. The recoverable amounts of cash-generating units have been determined based on value-in-use calculations which require the use of estimates. Note 15 details the assumptions used together with an analysis of the sensitivity to changes in key assumptions.
Assets under constructionThe group incurs significant levels of development expenditure on an ongoing basis in respect of the construction of new retail sites and the refurbishment of existing retail sites. Capitalisation of costs directly a*ributable to the asset commences when the group has probable future economic benefits associated with the utilisation of the asset. The determination of the point at which probable future economic benefits associated with the development spend will flow to the group requires management judgement and
Notes to the Consolidated Financial Statements (Continued)
PETROGAS GLOBAL Annual Report 2014 Directors’ Report and Financial Statements43
is subject to ma*ers such as planning approval, revisions to planning approval and in the case of publically funded developments, preferred bidder status. Costs incurred in the period before the group determines it has access to the probable future economic benefits that will flow from the asset are expensed in the income statement.
TaxesThe calculation of the group’s total tax charge necessarily involves a degree of estimation and judgement in respect of certain items, where the tax treatment cannot be finally determined until resolution has been reached with the relevant tax authority. The final resolution of some of these items may give rise to material Income Statement and/or cash flow variances.
Assumptions are also made around the assets which qualify for capital allowances and the level of disallowable expenses and this affects the income tax calculation. Provisions may be made for uncertain exposures or recoveries, which can have an impact on both deferred and current tax. Assumptions are also made around the tax net book value of assets to which capital allowances apply, the level of capital allowances, the extent of rollover gains, indexation thereon and the tax base into which they have been rolled.
Business combinationsFor sites acquired by the group it is necessary to determine whether the substance of the transaction reflects the acquisition of a leasehold/freehold interest in a property or whether it may constitute the acquisition of a business. In the la*er case, the transaction may give rise to goodwill in the group financial statements as well as other identifiable assets and liabilities acquired as part of the acquisition.
Management consider the contract terms and the nature of each site acquired to appropriately conclude whether the sites acquired represent a business combinations or a leasehold/freehold interest in land and buildings. Management reviewed the nature of leasehold acquisitions made in 2014 and concluded they were not business combinations.
Agency versus principal relationshipsThe group evaluates its revenue streams to ensure the most appropriate basis for presenting revenue or costs of revenue is selected. The determination of whether the group is acting as agent or principal requires management judgement and is subject to ma*ers such as the substance of the trading relationship with the counterparty, the legal form and the nature of the risks transferred to the counterparty. The group has considered these requirements and has concluded that it is agent on the sale of lo*ery related products, phone cards and other similar business streams.
Lease classificationThe group enter into a significant number of property leases as part of its expansion strategy and the determination of the appropriate lease classification between finance and operating is considered a key judgment. The determination of whether lease interests represent finance or operating leases requires management judgement and is subject to ma*ers such as contract terms, duration of the lease, nature of the interest/assets leased, the conditions upon which the lease can be exited and the nature of the risks and rewards passed to the group on lease inception.
4. Standards issued but not yet effectiveThe standards and interpretations that are issued but not yet effective up to the date of issuance of the group’s financial statements are disclosed below. The group intends to adopt these standards, if applicable, when they become effective.
Notes to the Consolidated Financial Statements (Continued)
Directors’ Report and Financial Statements 44
IFRS 9 Financial InstrumentsIFRS 9 Financial Instruments reflects the final phase of the IASB’s work on the replacement of IAS 39 Financial Instruments: Recognition and Measurement and applies to the classification and measurement of financial assets and liabilities as defined in IAS 39, impairment, and the application of hedge accounting. IFRS 9 is effective from 1 January 2018 and is awaiting EU endorsement. The group is currently assessing the impact of IFRS 9.
IFRS 15 Revenue from contracts with customersIFRS 15 Revenue from Contracts with Customers will replace IAS 18 Revenue, IAS 11 Construction Contracts and related interpretations. The new standard is applicable from 1 January 2017 and is subject to EU endorsement. IFRS 15 provides a new five step model to be applied to revenue arising from contracts with customers. The principles in IFRS 15 provide a more structured approach to measuring and recognising revenue and may impact the timing and amount of revenue recognised from contracts with customers. The group is currently assessing the impact of IFRS 15.
There are no other IFRS or IFRIC interpretations that are effective subsequent to the 2014 financial year-end that would have a material impact on the results or financial position of the group.
5. First time adoption of IFRSFor financial reporting periods up to and including 31 December 2013 the group prepared its financial statements in accordance with applicable Irish law and Generally Accepted Accounting Practice in Ireland including the accounting standards issued by the Financial Reporting Council and published by The Institute of Chartered Accountants in Ireland (Irish GAAP). The financial statements for the year ended 31 December 2014 are the first prepared in accordance with IFRS as adopted by the EU. The group has adopted 1 January 2012 as the date of transition to IFRS.
The accounting policies set out in note 2.2 have been applied in preparing the financial statements for the year ended 31 December 2014, the comparative information presented in these financial statements for the years ended 31 December 2013 and 31 December 2012 and in the preparation of the opening Statement of Financial Position at 1 January 2012 (the group’s date of transition). In preparing its opening Statement of Financial Position, the group has adjusted the amounts reported previously in the financial statements prepared under Irish GAAP. An explanation of how the transition from Irish GAAP to IFRS (as adopted by the EU) has affected the group’s financial position, financial performance and cash flows is set out in the following tables and notes.
Exemptions applied Optional exemptions IFRS 1 First-time Adoption of International Financial Reporting Standards (‘IFRS 1’) allows first time adopters certain exemptions from the retrospective application of certain requirements under IFRS. The group has applied the following exemptions:
• The group has elected not to retrospectively apply IFRS 3 Business Combinations to business combinations that occurred before the transition date. Such business combinations have not been restated. Any goodwill arising on such business combinations before the Transition Date has not been adjusted from the carrying value previously reported under Irish GAAP.
• The group has availed of the exemptions in IFRS 1, whereby the deemed cost of certain items of Property, plant and equipment have been calculated as their fair values as at the transition date.
Notes to the Consolidated Financial Statements (Continued)
PETROGAS GLOBAL Annual Report 2014 Directors’ Report and Financial Statements45
• Cumulative currency translation differences for all foreign operations have been set to zero as at the transition date.
• The group has applied the transitional provisions in IAS 23 Borrowing Costs and has capitalised borrowing costs relating to all qualifying assets after the date of transition.
Mandatory exemptions Set out below are the applicable mandatory exceptions in IFRS 1 applied in the conversion from Irish GAAP to IFRS.
• Estimates - IFRS estimates as at 1 January 2012 are consistent with the estimates as at the same date made in conformity with Irish GAAP.
The other compulsory exemptions in IFRS 1 as noted below have not been applied as these are not relevant to the group:
• Derecognition of financial assets and financial liabilities• Non-controlling interests• Hedge accounting
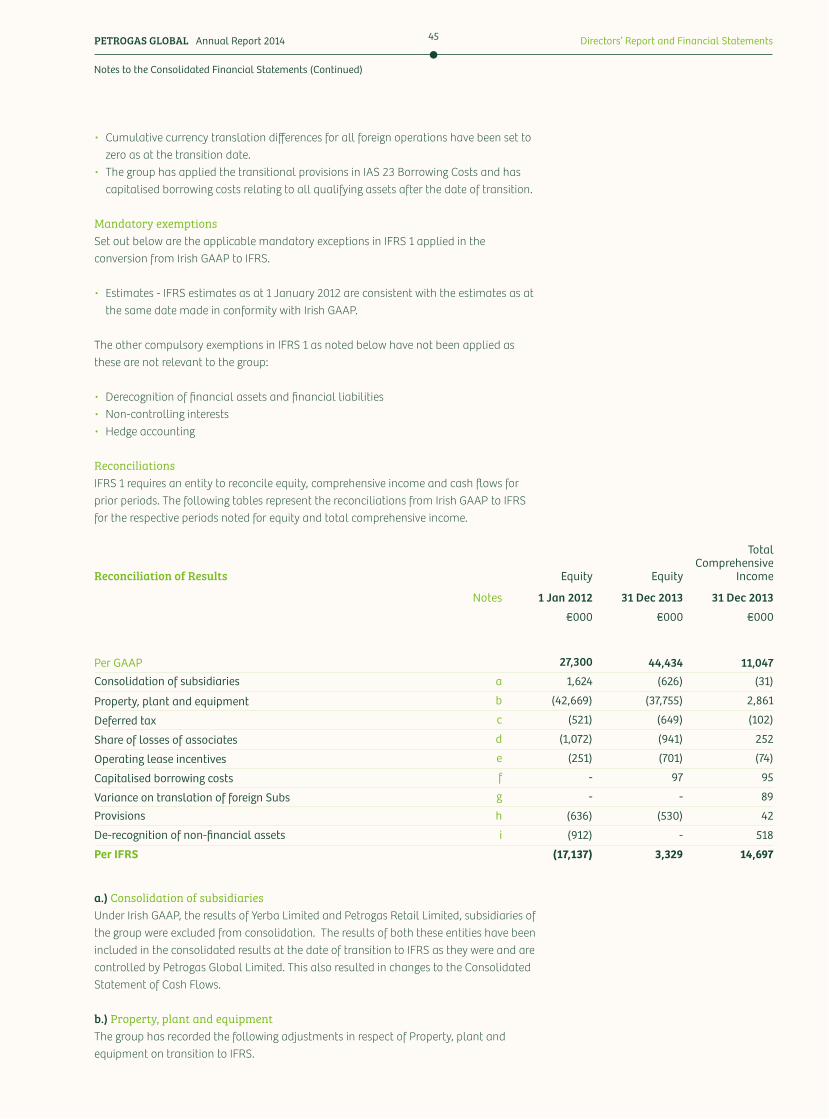
Reconciliations IFRS 1 requires an entity to reconcile equity, comprehensive income and cash flows for prior periods. The following tables represent the reconciliations from Irish GAAP to IFRS for the respective periods noted for equity and total comprehensive income.
Reconciliation of Results Equity Equity
Total Comprehensive
Income
Notes 1 Jan 2012 31 Dec 2013 31 Dec 2013
€000 €000 €000
Per GAAP 27,300 44,434 11,047Consolidation of subsidiaries a 1,624 (626) (31)
Property, plant and equipment b (42,669) (37,755) 2,861
Deferred tax c (521) (649) (102)
Share of losses of associates d (1,072) (941) 252
Operating lease incentives e (251) (701) (74)
Capitalised borrowing costs f - 97 95
Variance on translation of foreign Subs g - - 89
Provisions h (636) (530) 42
De-recognition of non-financial assets i (912) - 518
Per IFRS (17,137) 3,329 14,697
a.) Consolidation of subsidiaries Under Irish GAAP, the results of Yerba Limited and Petrogas Retail Limited, subsidiaries of the group were excluded from consolidation. The results of both these entities have been included in the consolidated results at the date of transition to IFRS as they were and are controlled by Petrogas Global Limited. This also resulted in changes to the Consolidated Statement of Cash Flows.
b.) Property, plant and equipmentThe group has recorded the following adjustments in respect of Property, plant and equipment on transition to IFRS.
Notes to the Consolidated Financial Statements (Continued)
Directors’ Report and Financial Statements 46
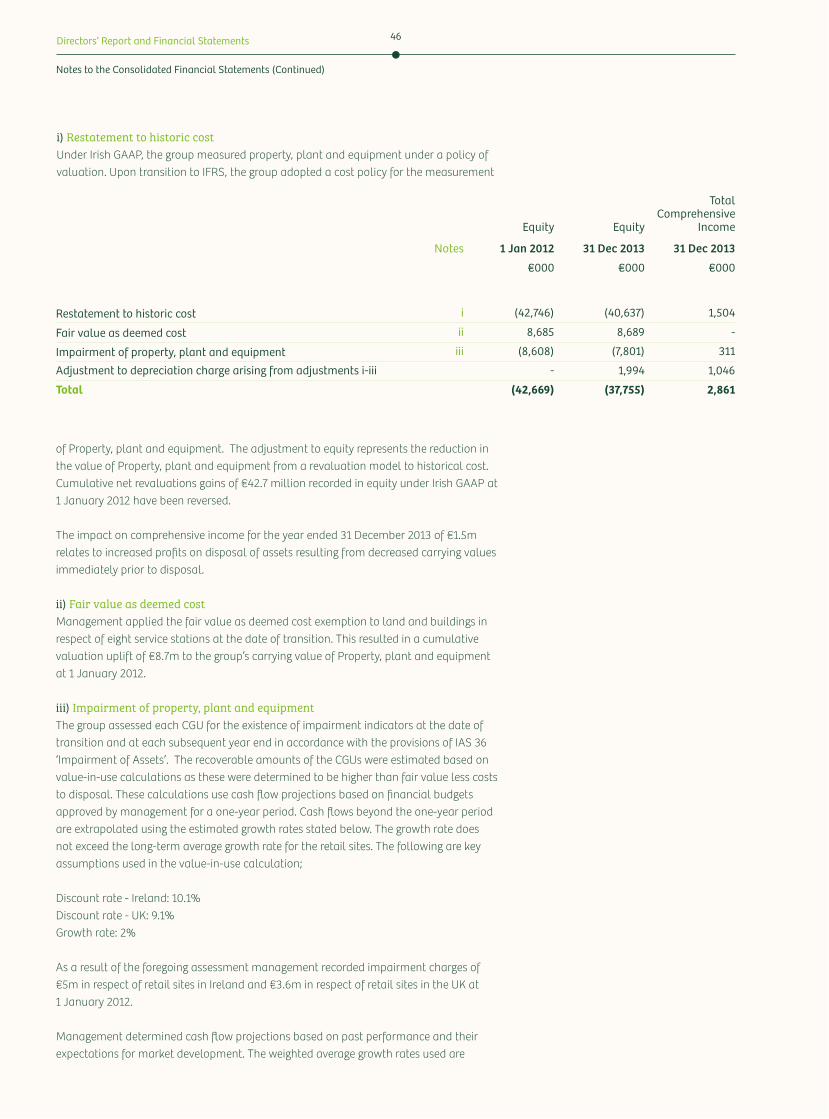
Equity Equity
Total Comprehensive
Income
Notes 1 Jan 2012 31 Dec 2013 31 Dec 2013
€000 €000 €000
Restatement to historic cost i (42,746) (40,637) 1,504
Fair value as deemed cost ii 8,685 8,689 -
Impairment of property, plant and equipment iii (8,608) (7,801) 311
Adjustment to depreciation charge arising from adjustments i-iii - 1,994 1,046
Total (42,669) (37,755) 2,861
i) Restatement to historic costUnder Irish GAAP, the group measured property, plant and equipment under a policy of valuation. Upon transition to IFRS, the group adopted a cost policy for the measurement
of Property, plant and equipment. The adjustment to equity represents the reduction in the value of Property, plant and equipment from a revaluation model to historical cost. Cumulative net revaluations gains of €42.7 million recorded in equity under Irish GAAP at 1 January 2012 have been reversed.
The impact on comprehensive income for the year ended 31 December 2013 of €1.5m relates to increased profits on disposal of assets resulting from decreased carrying values immediately prior to disposal.
ii) Fair value as deemed costManagement applied the fair value as deemed cost exemption to land and buildings in respect of eight service stations at the date of transition. This resulted in a cumulative valuation uplift of €8.7m to the group’s carrying value of Property, plant and equipment at 1 January 2012.
iii) Impairment of property, plant and equipmentThe group assessed each CGU for the existence of impairment indicators at the date of transition and at each subsequent year end in accordance with the provisions of IAS 36 ‘Impairment of Assets’. The recoverable amounts of the CGUs were estimated based on value-in-use calculations as these were determined to be higher than fair value less costs to disposal. These calculations use cash flow projections based on financial budgets approved by management for a one-year period. Cash flows beyond the one-year period are extrapolated using the estimated growth rates stated below. The growth rate does not exceed the long-term average growth rate for the retail sites. The following are key assumptions used in the value-in-use calculation;
Discount rate - Ireland: 10.1% Discount rate - UK: 9.1% Growth rate: 2%
As a result of the foregoing assessment management recorded impairment charges of €5m in respect of retail sites in Ireland and €3.6m in respect of retail sites in the UK at 1 January 2012.
Management determined cash flow projections based on past performance and their expectations for market development. The weighted average growth rates used are
Notes to the Consolidated Financial Statements (Continued)
PETROGAS GLOBAL Annual Report 2014 Directors’ Report and Financial Statements47
consistent with forecasts included in industry reports. The discount rates used reflect specific risks in relation to sites in Ireland and the UK.
A reduction in management’s cash flow projections by 10% would increase the impairment by €0.5m at 1 January 2012. If management reduced the growth rate by 10%, impairment would increase by €0.1m at 1 January 2012. An increase in the discount rate by 10% would increase impairment by €0.1m at 1 January 2012.
Impairments charges recorded under Irish GAAP have been reversed (2012: €1.7m, 2013: €0.3m). An assessment for impairment indicators was performed at the end of 2012 and 2013 in line with the requirements of IAS 36 - Impairment of Assets resulting in an impairment charge of €1.3m in 2012 (2013: €nil).
The increase in total comprehensive income for the period represents the reversal of the element of impairments that has been recorded in the GAAP profit and loss account.
c.) Deferred taxDeferred tax has been calculated in line with the requirements of IAS 12. The adjustments arising on transition to IFRS relate mainly to temporary differences between the tax base and carrying value of land and buildings arising from transition adjustments explained in note b.) above.
d.) Share of loss of associate The group’s investment in associates has been restated to comply with the requirements of IAS 28 ‘Associates’. This has resulted in the recording of the group’s share of the fair value of derivative liabilities held by the associate undertaking that had not been recognised under Irish GAAP. This increased the accumulated share of losses of associates on transition. In 2012, the share of losses of associate equalled the value of the investment (including long term loans) and so the group ceased recognising losses at this point as the group has no legal or constructive obligation to fund ongoing losses in the associate.
e.) Operating lease incentivesUnder Irish GAAP operating lease incentives are recognised as a reduction in the rental expense on a systematic basis over the shorter of the lease term and the date of the next market rent review. Under IFRS the lease incentives are recognised over the lease term resulting in an increase in the deferred rental credit and a reduction in equity on transition to IFRS on the group’s Statement of Financial Position.
f.) Capitalised borrowing costsIFRS requires that borrowing costs directly a*ributable to the acquisition, construction or production of a qualifying asset are included in the cost of the asset. Borrowing costs were not capitalised under Irish GAAP.
g.) Variance on translation of foreign subsidiariesExchange differences arising from the translation of foreign subsidiaries from their functional currency to the group’s presentation currency have been recorded in Other Comprehensive Income.
h.) ProvisionsUnder Irish GAAP, the group provided for employee bonuses in the period in which the bonuses were paid. IFRS requires bonuses to be recognised in the period in which the group has a present constructive obligation based on the employees’ performance in the financial year.
Notes to the Consolidated Financial Statements (Continued)
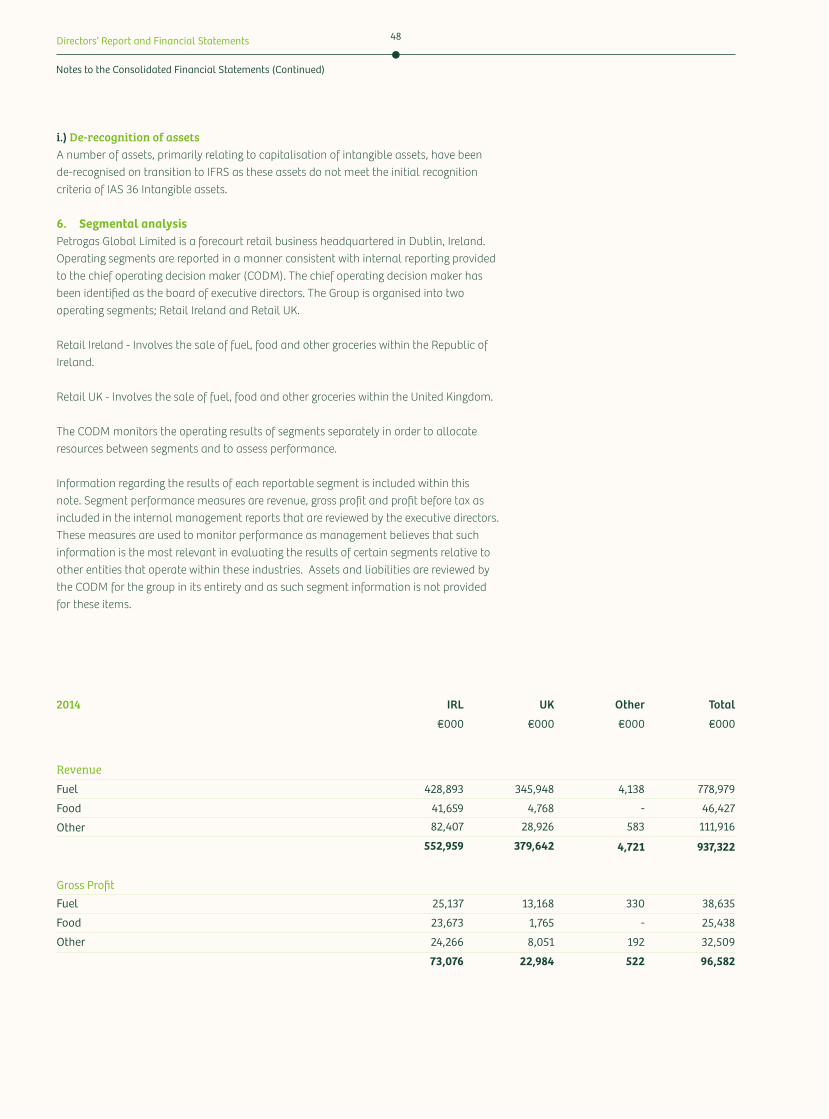
Directors’ Report and Financial Statements 48
i.) De-recognition of assetsA number of assets, primarily relating to capitalisation of intangible assets, have been de-recognised on transition to IFRS as these assets do not meet the initial recognition criteria of IAS 36 Intangible assets.
6. Segmental analysisPetrogas Global Limited is a forecourt retail business headquartered in Dublin, Ireland. Operating segments are reported in a manner consistent with internal reporting provided to the chief operating decision maker (CODM). The chief operating decision maker has been identified as the board of executive directors. The Group is organised into two operating segments; Retail Ireland and Retail UK.
Retail Ireland - Involves the sale of fuel, food and other groceries within the Republic of Ireland.
Retail UK - Involves the sale of fuel, food and other groceries within the United Kingdom.
The CODM monitors the operating results of segments separately in order to allocate resources between segments and to assess performance.
Information regarding the results of each reportable segment is included within this note. Segment performance measures are revenue, gross profit and profit before tax as included in the internal management reports that are reviewed by the executive directors. These measures are used to monitor performance as management believes that such information is the most relevant in evaluating the results of certain segments relative to other entities that operate within these industries. Assets and liabilities are reviewed by the CODM for the group in its entirety and as such segment information is not provided for these items.
2014 IRL UK Other Total
€000 €000 €000 €000
RevenueFuel 428,893 345,948 4,138 778,979
Food 41,659 4,768 - 46,427
Other 82,407 28,926 583 111,916
552,959 379,642 4,721 937,322
Gross ProfitFuel 25,137 13,168 330 38,635
Food 23,673 1,765 - 25,438
Other 24,266 8,051 192 32,509
73,076 22,984 522 96,582
Notes to the Consolidated Financial Statements (Continued)
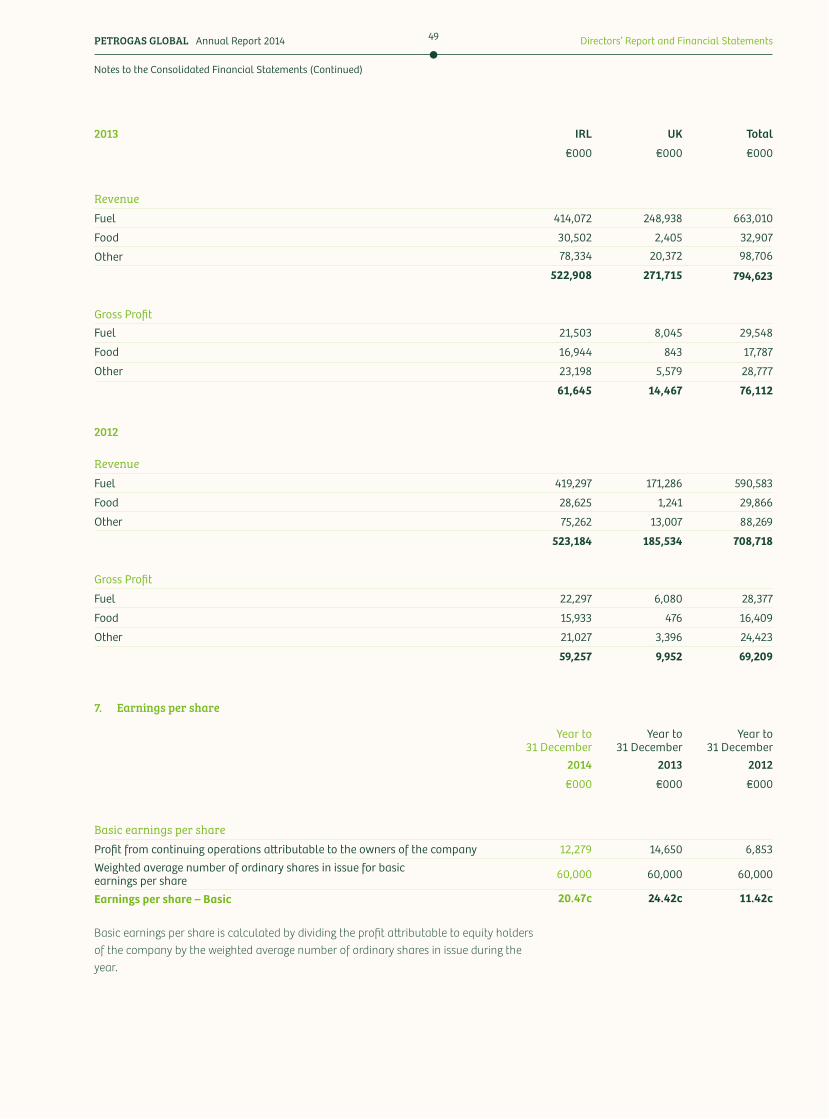
PETROGAS GLOBAL Annual Report 2014 Directors’ Report and Financial Statements49
Basic earnings per share is calculated by dividing the profit a*ributable to equity holders of the company by the weighted average number of ordinary shares in issue during the year.
7. Earnings per share
2013 IRL UK Total
€000 €000 €000
RevenueFuel 414,072 248,938 663,010
Food 30,502 2,405 32,907
Other 78,334 20,372 98,706
522,908 271,715 794,623
Gross ProfitFuel 21,503 8,045 29,548
Food 16,944 843 17,787
Other 23,198 5,579 28,777
61,645 14,467 76,112
2012
RevenueFuel 419,297 171,286 590,583
Food 28,625 1,241 29,866
Other 75,262 13,007 88,269
523,184 185,534 708,718
Gross Profit
Fuel 22,297 6,080 28,377
Food 15,933 476 16,409
Other 21,027 3,396 24,423
59,257 9,952 69,209
Year to 31 December
Year to 31 December
Year to 31 December
2014 2013 2012
€000 €000 €000
Basic earnings per shareProfit from continuing operations a&ributable to the owners of the company 12,279 14,650 6,853Weighted average number of ordinary shares in issue for basic earnings per share 60,000 60,000 60,000
Earnings per share – Basic 20.47c 24.42c 11.42c
Notes to the Consolidated Financial Statements (Continued)
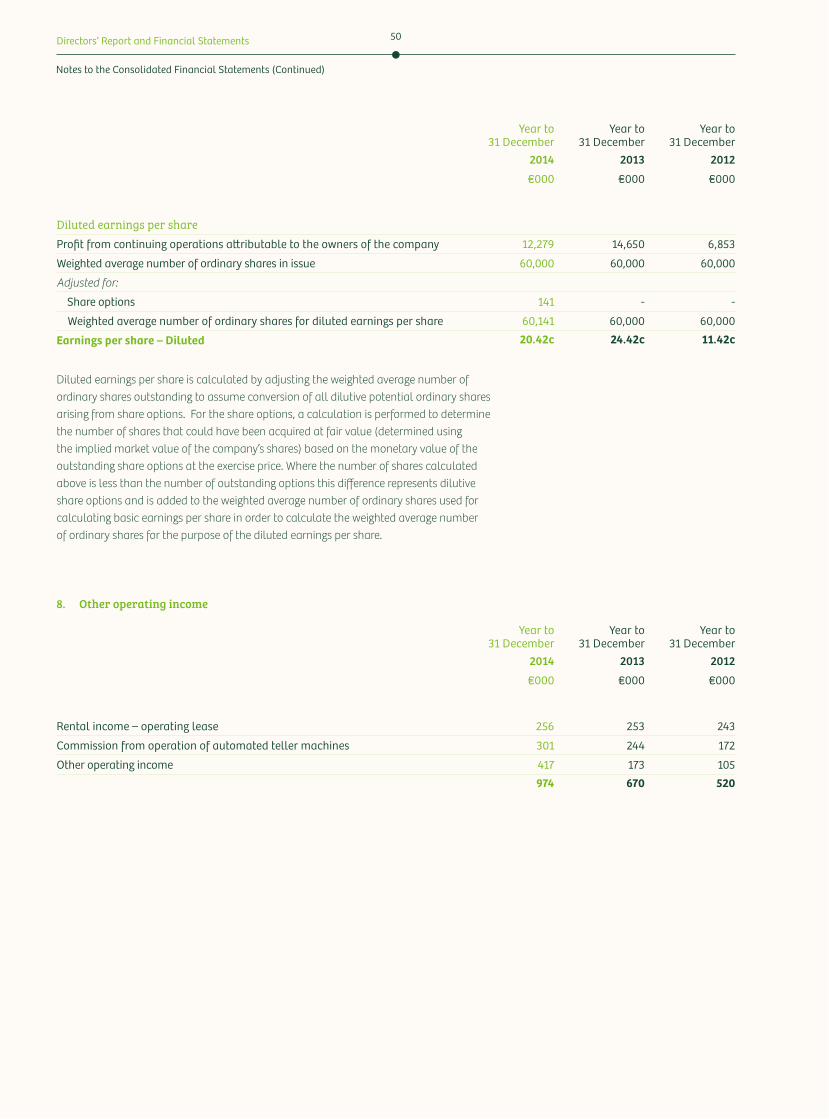
Directors’ Report and Financial Statements 50
Year to 31 December
Year to 31 December
Year to 31 December
2014 2013 2012
€000 €000 €000
Diluted earnings per shareProfit from continuing operations a&ributable to the owners of the company 12,279 14,650 6,853
Weighted average number of ordinary shares in issue 60,000 60,000 60,000
Adjusted for:
Share options 141 - -
Weighted average number of ordinary shares for diluted earnings per share 60,141 60,000 60,000
Earnings per share – Diluted 20.42c 24.42c 11.42c
Diluted earnings per share is calculated by adjusting the weighted average number of ordinary shares outstanding to assume conversion of all dilutive potential ordinary shares arising from share options. For the share options, a calculation is performed to determine the number of shares that could have been acquired at fair value (determined using the implied market value of the company’s shares) based on the monetary value of the outstanding share options at the exercise price. Where the number of shares calculated above is less than the number of outstanding options this difference represents dilutive share options and is added to the weighted average number of ordinary shares used for calculating basic earnings per share in order to calculate the weighted average number of ordinary shares for the purpose of the diluted earnings per share.
8. Other operating income
Year to 31 December
Year to 31 December
Year to 31 December
2014 2013 2012
€000 €000 €000
Rental income – operating lease 256 253 243
Commission from operation of automated teller machines 301 244 172
Other operating income 417 173 105974 670 520
Notes to the Consolidated Financial Statements (Continued)
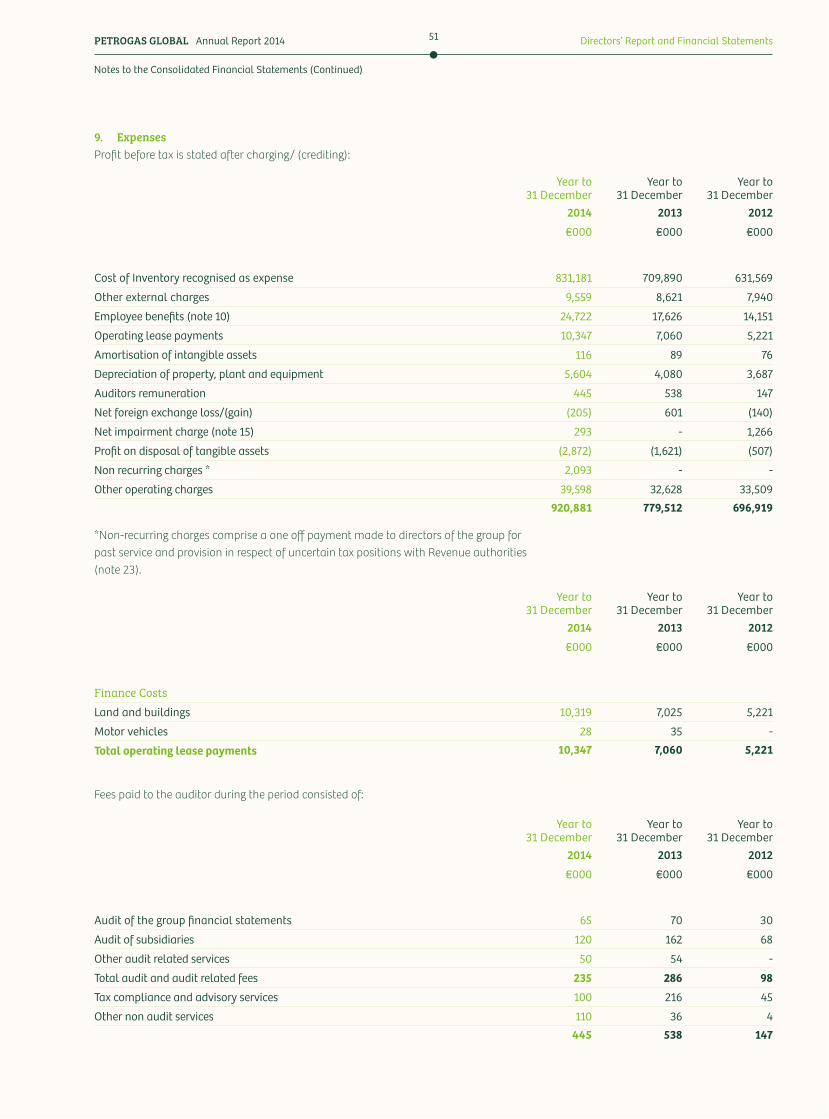
PETROGAS GLOBAL Annual Report 2014 Directors’ Report and Financial Statements51
Year to 31 December
Year to 31 December
Year to 31 December
2014 2013 2012
€000 €000 €000
Cost of Inventory recognised as expense 831,181 709,890 631,569
Other external charges 9,559 8,621 7,940
Employee benefits (note 10) 24,722 17,626 14,151
Operating lease payments 10,347 7,060 5,221
Amortisation of intangible assets 116 89 76
Depreciation of property, plant and equipment 5,604 4,080 3,687
Auditors remuneration 445 538 147
Net foreign exchange loss/(gain) (205) 601 (140)
Net impairment charge (note 15) 293 - 1,266
Profit on disposal of tangible assets (2,872) (1,621) (507)
Non recurring charges * 2,093 - -
Other operating charges 39,598 32,628 33,509920,881 779,512 696,919
Year to 31 December
Year to 31 December
Year to 31 December
2014 2013 2012
€000 €000 €000
Audit of the group financial statements 65 70 30
Audit of subsidiaries 120 162 68
Other audit related services 50 54 -
Total audit and audit related fees 235 286 98
Tax compliance and advisory services 100 216 45
Other non audit services 110 36 4445 538 147
Year to 31 December
Year to 31 December
Year to 31 December
2014 2013 2012
€000 €000 €000
Finance CostsLand and buildings 10,319 7,025 5,221
Motor vehicles 28 35 -
Total operating lease payments 10,347 7,060 5,221
*Non-recurring charges comprise a one off payment made to directors of the group for past service and provision in respect of uncertain tax positions with Revenue authorities (note 23).
Fees paid to the auditor during the period consisted of:
9. ExpensesProfit before tax is stated after charging/ (crediting):
Notes to the Consolidated Financial Statements (Continued)
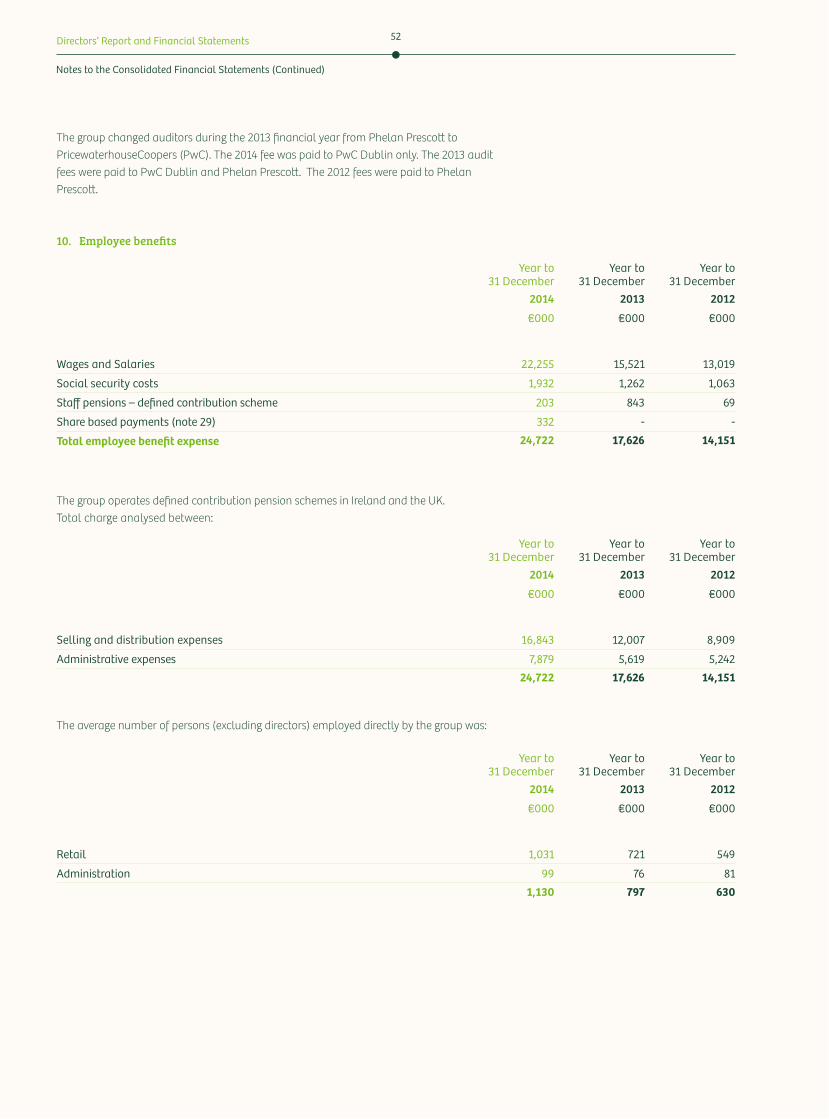
Directors’ Report and Financial Statements 52
The group changed auditors during the 2013 financial year from Phelan Presco* to PricewaterhouseCoopers (PwC). The 2014 fee was paid to PwC Dublin only. The 2013 audit fees were paid to PwC Dublin and Phelan Presco*. The 2012 fees were paid to Phelan Presco*.
10. Employee benefits
The group operates defined contribution pension schemes in Ireland and the UK. Total charge analysed between:
The average number of persons (excluding directors) employed directly by the group was:
Year to 31 December
Year to 31 December
Year to 31 December
2014 2013 2012
€000 €000 €000
Wages and Salaries 22,255 15,521 13,019
Social security costs 1,932 1,262 1,063
Staff pensions – defined contribution scheme 203 843 69
Share based payments (note 29) 332 - -
Total employee benefit expense 24,722 17,626 14,151
Year to 31 December
Year to 31 December
Year to 31 December
2014 2013 2012
€000 €000 €000
Selling and distribution expenses 16,843 12,007 8,909
Administrative expenses 7,879 5,619 5,24224,722 17,626 14,151
Year to 31 December
Year to 31 December
Year to 31 December
2014 2013 2012
€000 €000 €000
Retail 1,031 721 549
Administration 99 76 811,130 797 630
Notes to the Consolidated Financial Statements (Continued)
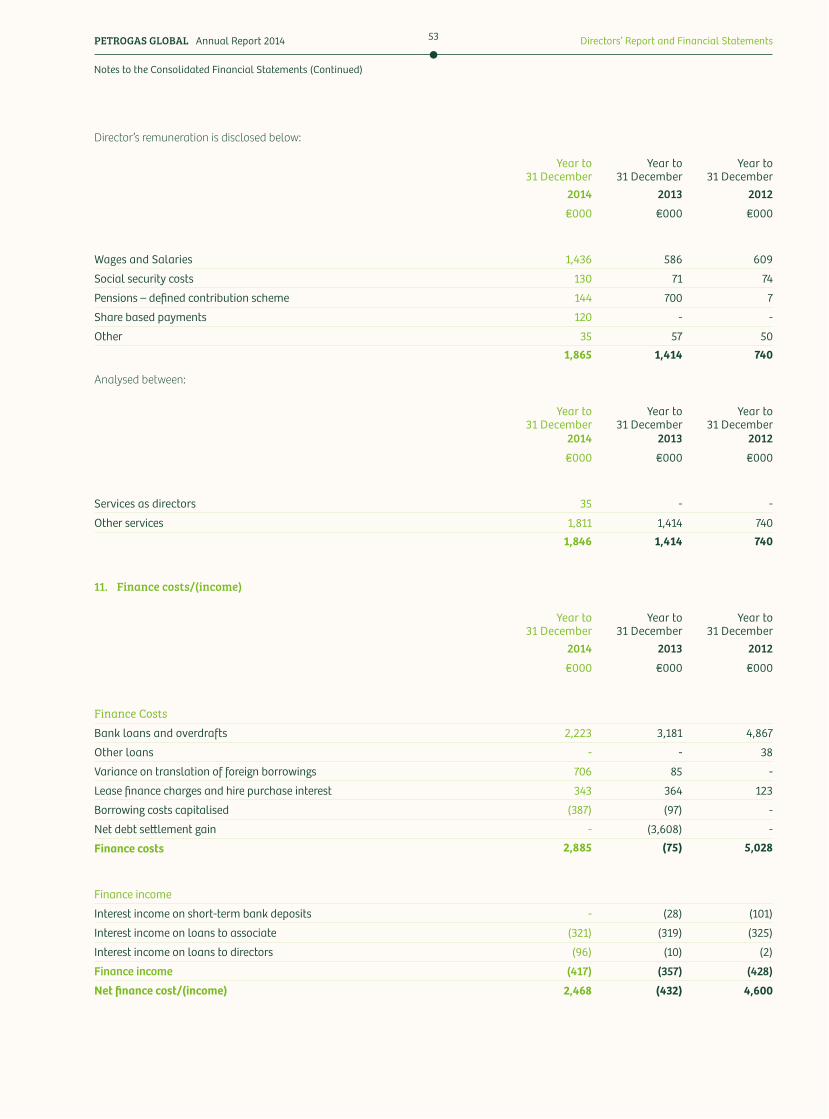
PETROGAS GLOBAL Annual Report 2014 Directors’ Report and Financial Statements53
Director’s remuneration is disclosed below:
Analysed between:
Year to 31 December
Year to 31 December
Year to 31 December
2014 2013 2012
€000 €000 €000
Wages and Salaries 1,436 586 609
Social security costs 130 71 74
Pensions – defined contribution scheme 144 700 7
Share based payments 120 - -
Other 35 57 501,865 1,414 740
Year to 31 December
Year to 31 December
Year to 31 December
2014 2013 2012
€000 €000 €000
Services as directors 35 - -
Other services 1,811 1,414 7401,846 1,414 740
Year to 31 December
Year to 31 December
Year to 31 December
2014 2013 2012
€000 €000 €000
Finance CostsBank loans and overdrafts 2,223 3,181 4,867
Other loans - - 38
Variance on translation of foreign borrowings 706 85 -
Lease finance charges and hire purchase interest 343 364 123
Borrowing costs capitalised (387) (97) -
Net debt se&lement gain - (3,608) -
Finance costs 2,885 (75) 5,028
Finance income
Interest income on short-term bank deposits - (28) (101)
Interest income on loans to associate (321) (319) (325)
Interest income on loans to directors (96) (10) (2)
Finance income (417) (357) (428)
Net finance cost/(income) 2,468 (432) 4,600
11. Finance costs/(income)
Notes to the Consolidated Financial Statements (Continued)
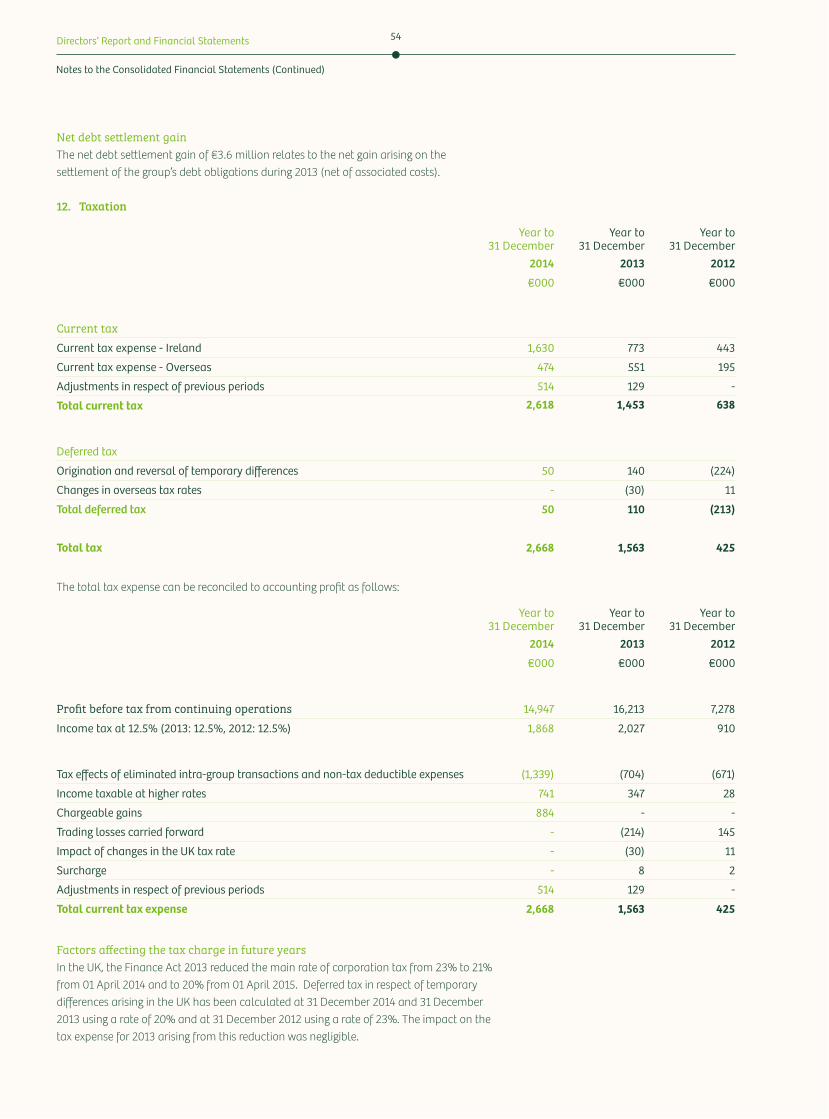
Directors’ Report and Financial Statements 54
Net debt settlement gainThe net debt se*lement gain of €3.6 million relates to the net gain arising on the se*lement of the group’s debt obligations during 2013 (net of associated costs).
12. Taxation
The total tax expense can be reconciled to accounting profit as follows:
Factors affecting the tax charge in future yearsIn the UK, the Finance Act 2013 reduced the main rate of corporation tax from 23% to 21% from 01 April 2014 and to 20% from 01 April 2015. Deferred tax in respect of temporary differences arising in the UK has been calculated at 31 December 2014 and 31 December 2013 using a rate of 20% and at 31 December 2012 using a rate of 23%. The impact on the tax expense for 2013 arising from this reduction was negligible.
Year to 31 December
Year to 31 December
Year to 31 December
2014 2013 2012
€000 €000 €000
Current taxCurrent tax expense - Ireland 1,630 773 443
Current tax expense - Overseas 474 551 195
Adjustments in respect of previous periods 514 129 -
Total current tax 2,618 1,453 638
Deferred tax
Origination and reversal of temporary differences 50 140 (224)
Changes in overseas tax rates - (30) 11
Total deferred tax 50 110 (213)
Total tax 2,668 1,563 425
Year to 31 December
Year to 31 December
Year to 31 December
2014 2013 2012
€000 €000 €000
Profit before tax from continuing operations 14,947 16,213 7,278
Income tax at 12.5% (2013: 12.5%, 2012: 12.5%) 1,868 2,027 910
Tax effects of eliminated intra-group transactions and non-tax deductible expenses (1,339) (704) (671)
Income taxable at higher rates 741 347 28
Chargeable gains 884 - -
Trading losses carried forward - (214) 145
Impact of changes in the UK tax rate - (30) 11
Surcharge - 8 2
Adjustments in respect of previous periods 514 129 -
Total current tax expense 2,668 1,563 425
Notes to the Consolidated Financial Statements (Continued)
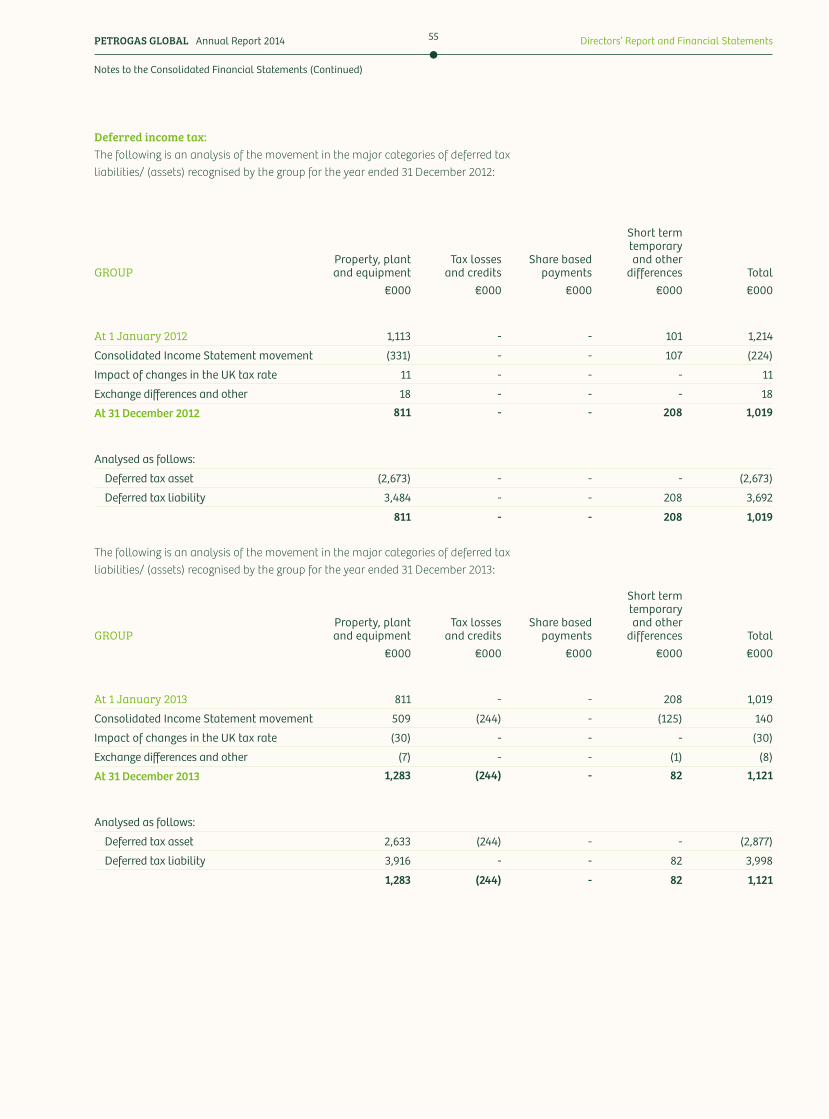
PETROGAS GLOBAL Annual Report 2014 Directors’ Report and Financial Statements55
GROUPProperty, plant and equipment
Tax losses and credits
Share based payments
Short term temporary and other
differences Total€000 €000 €000 €000 €000
At 1 January 2012 1,113 - - 101 1,214
Consolidated Income Statement movement (331) - - 107 (224)
Impact of changes in the UK tax rate 11 - - - 11
Exchange differences and other 18 - - - 18
At 31 December 2012 811 - - 208 1,019
Analysed as follows:
Deferred tax asset (2,673) - - - (2,673)
Deferred tax liability 3,484 - - 208 3,692
811 - - 208 1,019
GROUPProperty, plant and equipment
Tax losses and credits
Share based payments
Short term temporary and other
differences Total€000 €000 €000 €000 €000
At 1 January 2013 811 - - 208 1,019
Consolidated Income Statement movement 509 (244) - (125) 140
Impact of changes in the UK tax rate (30) - - - (30)
Exchange differences and other (7) - - (1) (8)
At 31 December 2013 1,283 (244) - 82 1,121
Analysed as follows:
Deferred tax asset 2,633 (244) - - (2,877)
Deferred tax liability 3,916 - - 82 3,998
1,283 (244) - 82 1,121
Deferred income tax:The following is an analysis of the movement in the major categories of deferred tax liabilities/ (assets) recognised by the group for the year ended 31 December 2012:
The following is an analysis of the movement in the major categories of deferred tax liabilities/ (assets) recognised by the group for the year ended 31 December 2013:
Notes to the Consolidated Financial Statements (Continued)

Directors’ Report and Financial Statements 56
GROUPProperty, plant and equipment
Tax losses and credits
Share based payments
Short term temporary and other
differences Total€000 €000 €000 €000 €000
At 1 January 2014 1,283 (244) - 82 1,121
Consolidated Income Statement movement 158 - (23) (85) 50
Exchange differences and other 40 - - (2) 38
At 31 December 2014 1,481 (244) (23) (5) 1,209
Analysed as follows:
Deferred tax asset (2,610) (244) (23) - (2,877)
Deferred tax liability 4,091 - - (5) 4,086
1,481 (244) (23) (5) 1,209
COMPANYProperty, plant and equipment
Tax losses and credits
Share based payments
Short term temporary and other
differences Total€000 €000 €000 €000 €000
At 1 January 2013 - - - - -
Consolidated Income Statement movement - - - (11) (11)
At 31 December 2013 - - - (11) (11)
Analysed as follows:
Deferred tax asset - - - (11) (11)
Deferred tax liability - - - - -
- - - (11) (11)
The following is an analysis of the movement in the major categories of deferred tax liabilities/ (assets) recognised by the group for the year ended 31 December 2014:
The following is an analysis of the movement in the major categories of deferred tax liabilities/ (assets) recognised by the company for the year ended 31 December 2013:
Notes to the Consolidated Financial Statements (Continued)
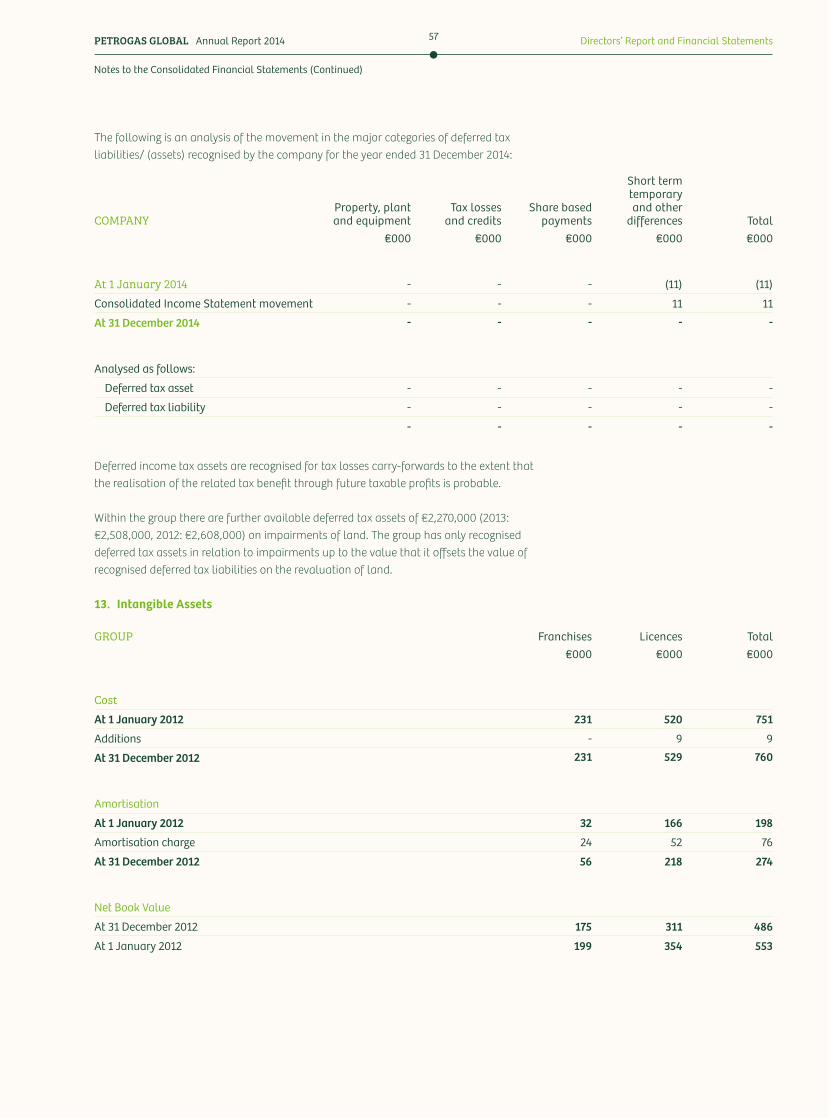
PETROGAS GLOBAL Annual Report 2014 Directors’ Report and Financial Statements57
COMPANYProperty, plant and equipment
Tax losses and credits
Share based payments
Short term temporary and other
differences Total€000 €000 €000 €000 €000
At 1 January 2014 - - - (11) (11)
Consolidated Income Statement movement - - - 11 11
At 31 December 2014 - - - - -
Analysed as follows:
Deferred tax asset - - - - -
Deferred tax liability - - - - -
- - - - -
GROUP Franchises Licences Total€000 €000 €000
CostAt 1 January 2012 231 520 751
Additions - 9 9
At 31 December 2012 231 529 760
Amortisation
At 1 January 2012 32 166 198
Amortisation charge 24 52 76
At 31 December 2012 56 218 274
Net Book Value
At 31 December 2012 175 311 486
At 1 January 2012 199 354 553
The following is an analysis of the movement in the major categories of deferred tax liabilities/ (assets) recognised by the company for the year ended 31 December 2014:
Deferred income tax assets are recognised for tax losses carry-forwards to the extent that the realisation of the related tax benefit through future taxable profits is probable.
Within the group there are further available deferred tax assets of €2,270,000 (2013: €2,508,000, 2012: €2,608,000) on impairments of land. The group has only recognised deferred tax assets in relation to impairments up to the value that it offsets the value of recognised deferred tax liabilities on the revaluation of land.
13. Intangible Assets
Notes to the Consolidated Financial Statements (Continued)
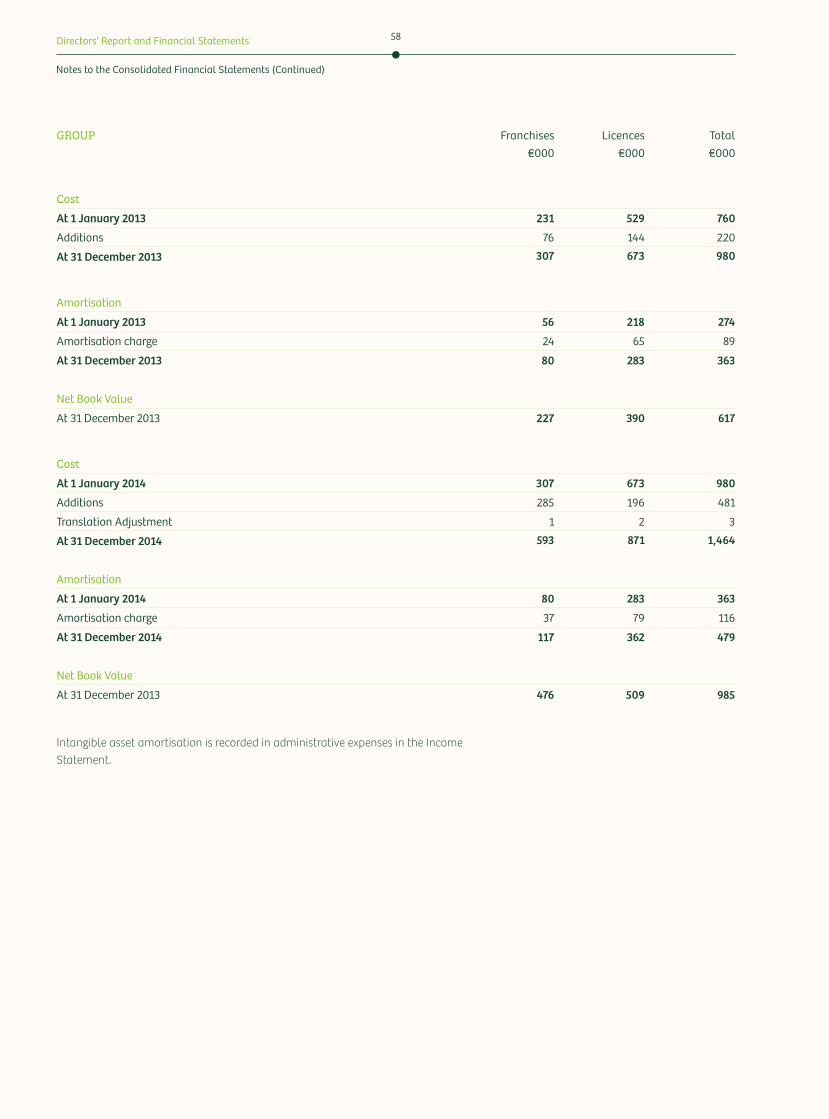
Directors’ Report and Financial Statements 58
GROUP Franchises Licences Total€000 €000 €000
CostAt 1 January 2013 231 529 760
Additions 76 144 220
At 31 December 2013 307 673 980
Amortisation
At 1 January 2013 56 218 274
Amortisation charge 24 65 89
At 31 December 2013 80 283 363
Net Book Value
At 31 December 2013 227 390 617
CostAt 1 January 2014 307 673 980
Additions 285 196 481
Translation Adjustment 1 2 3
At 31 December 2014 593 871 1,464
Amortisation
At 1 January 2014 80 283 363
Amortisation charge 37 79 116
At 31 December 2014 117 362 479
Net Book Value
At 31 December 2013 476 509 985
Intangible asset amortisation is recorded in administrative expenses in the Income Statement.
Notes to the Consolidated Financial Statements (Continued)
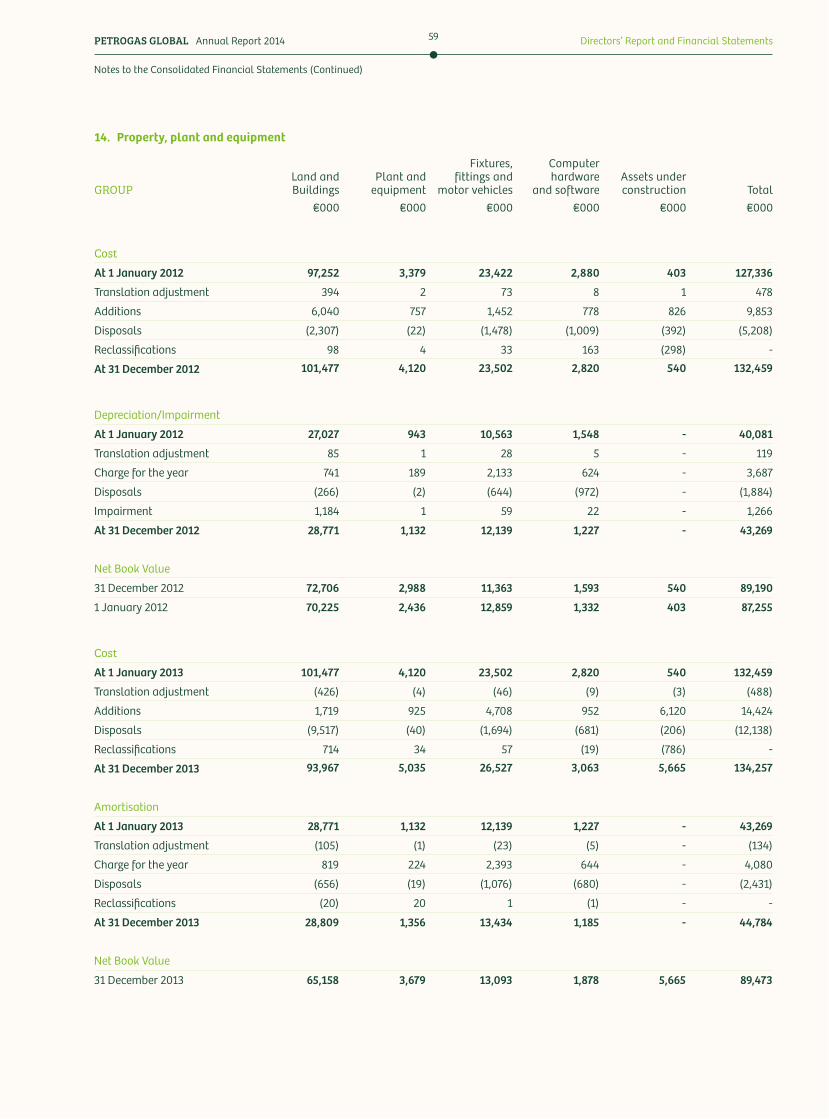
PETROGAS GLOBAL Annual Report 2014 Directors’ Report and Financial Statements59
GROUPLand and Buildings
Plant and equipment
Fixtures, fittings and
motor vehicles
Computer hardware
and softwareAssets under construction Total
€000 €000 €000 €000 €000 €000
CostAt 1 January 2012 97,252 3,379 23,422 2,880 403 127,336
Translation adjustment 394 2 73 8 1 478
Additions 6,040 757 1,452 778 826 9,853
Disposals (2,307) (22) (1,478) (1,009) (392) (5,208)
Reclassifications 98 4 33 163 (298) -
At 31 December 2012 101,477 4,120 23,502 2,820 540 132,459
Depreciation/Impairment
At 1 January 2012 27,027 943 10,563 1,548 - 40,081
Translation adjustment 85 1 28 5 - 119
Charge for the year 741 189 2,133 624 - 3,687
Disposals (266) (2) (644) (972) - (1,884)
Impairment 1,184 1 59 22 - 1,266
At 31 December 2012 28,771 1,132 12,139 1,227 - 43,269
Net Book Value
31 December 2012 72,706 2,988 11,363 1,593 540 89,190
1 January 2012 70,225 2,436 12,859 1,332 403 87,255
CostAt 1 January 2013 101,477 4,120 23,502 2,820 540 132,459
Translation adjustment (426) (4) (46) (9) (3) (488)
Additions 1,719 925 4,708 952 6,120 14,424
Disposals (9,517) (40) (1,694) (681) (206) (12,138)
Reclassifications 714 34 57 (19) (786) -
At 31 December 2013 93,967 5,035 26,527 3,063 5,665 134,257
Amortisation
At 1 January 2013 28,771 1,132 12,139 1,227 - 43,269
Translation adjustment (105) (1) (23) (5) - (134)
Charge for the year 819 224 2,393 644 - 4,080
Disposals (656) (19) (1,076) (680) - (2,431)
Reclassifications (20) 20 1 (1) - -
At 31 December 2013 28,809 1,356 13,434 1,185 - 44,784
Net Book Value
31 December 2013 65,158 3,679 13,093 1,878 5,665 89,473
14. Property, plant and equipment
Notes to the Consolidated Financial Statements (Continued)
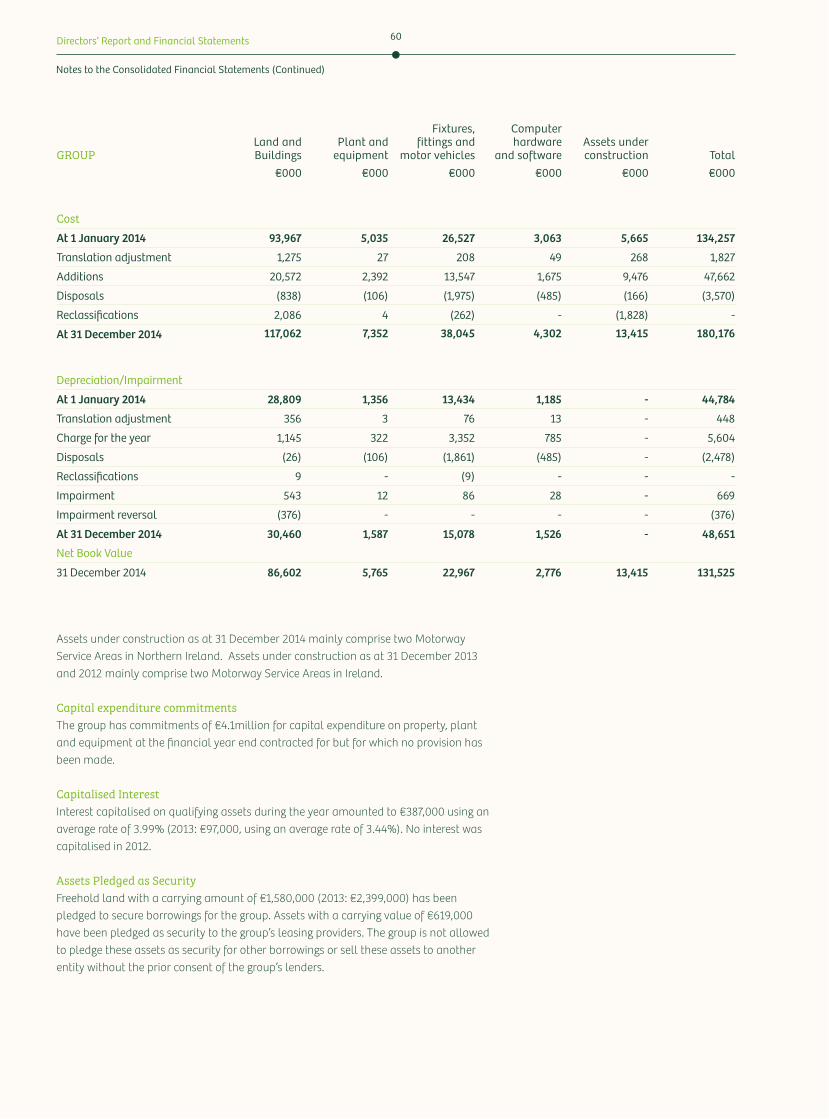
Directors’ Report and Financial Statements 60
GROUPLand and Buildings
Plant and equipment
Fixtures, fittings and
motor vehicles
Computer hardware
and softwareAssets under construction Total
€000 €000 €000 €000 €000 €000
CostAt 1 January 2014 93,967 5,035 26,527 3,063 5,665 134,257
Translation adjustment 1,275 27 208 49 268 1,827
Additions 20,572 2,392 13,547 1,675 9,476 47,662
Disposals (838) (106) (1,975) (485) (166) (3,570)
Reclassifications 2,086 4 (262) - (1,828) -
At 31 December 2014 117,062 7,352 38,045 4,302 13,415 180,176
Depreciation/Impairment
At 1 January 2014 28,809 1,356 13,434 1,185 - 44,784
Translation adjustment 356 3 76 13 - 448
Charge for the year 1,145 322 3,352 785 - 5,604
Disposals (26) (106) (1,861) (485) - (2,478)
Reclassifications 9 - (9) - - -
Impairment 543 12 86 28 - 669
Impairment reversal (376) - - - - (376)
At 31 December 2014 30,460 1,587 15,078 1,526 - 48,651
Net Book Value
31 December 2014 86,602 5,765 22,967 2,776 13,415 131,525
Assets under construction as at 31 December 2014 mainly comprise two Motorway Service Areas in Northern Ireland. Assets under construction as at 31 December 2013 and 2012 mainly comprise two Motorway Service Areas in Ireland.
Capital expenditure commitmentsThe group has commitments of €4.1million for capital expenditure on property, plant and equipment at the financial year end contracted for but for which no provision has been made.
Capitalised InterestInterest capitalised on qualifying assets during the year amounted to €387,000 using an average rate of 3.99% (2013: €97,000, using an average rate of 3.44%). No interest was capitalised in 2012.
Assets Pledged as SecurityFreehold land with a carrying amount of €1,580,000 (2013: €2,399,000) has been pledged to secure borrowings for the group. Assets with a carrying value of €619,000 have been pledged as security to the group’s leasing providers. The group is not allowed to pledge these assets as security for other borrowings or sell these assets to another entity without the prior consent of the group’s lenders.
Notes to the Consolidated Financial Statements (Continued)
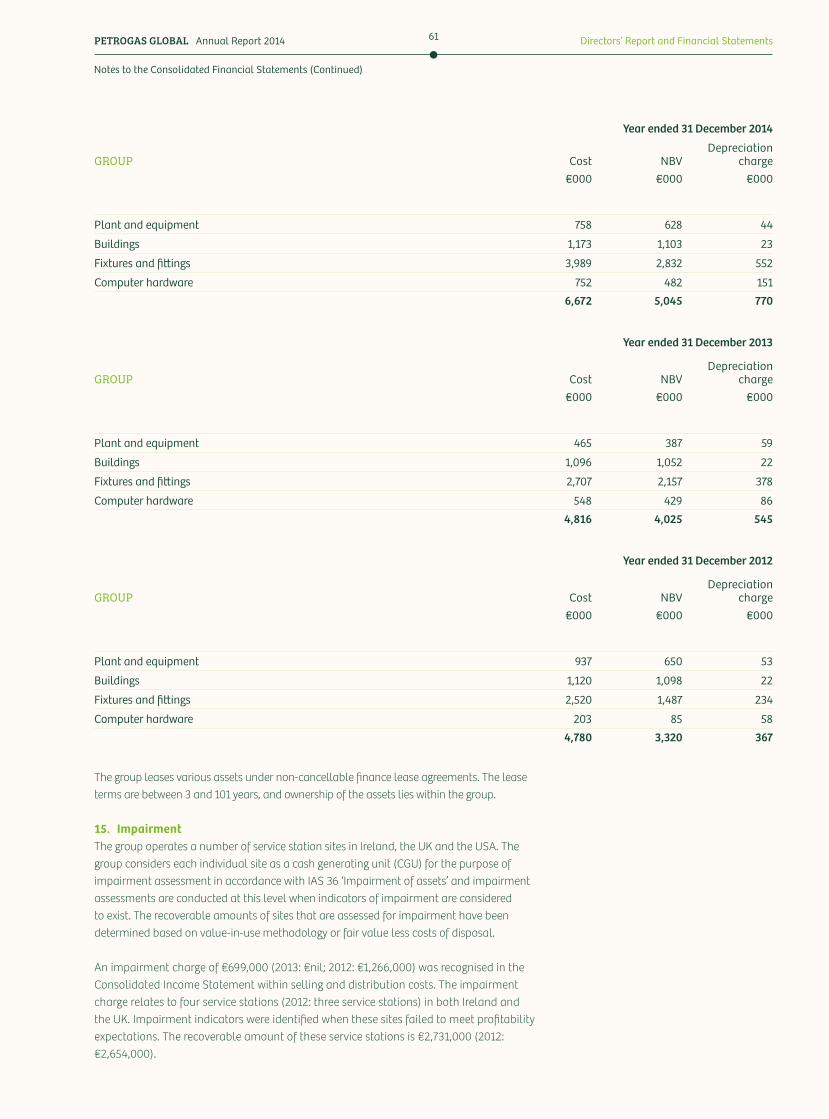
PETROGAS GLOBAL Annual Report 2014 Directors’ Report and Financial Statements61
Year ended 31 December 2014
GROUP Cost NBVDepreciation
charge€000 €000 €000
Plant and equipment 758 628 44
Buildings 1,173 1,103 23
Fixtures and fi&ings 3,989 2,832 552
Computer hardware 752 482 1516,672 5,045 770
Year ended 31 December 2013
GROUP Cost NBVDepreciation
charge€000 €000 €000
Plant and equipment 465 387 59
Buildings 1,096 1,052 22
Fixtures and fi&ings 2,707 2,157 378
Computer hardware 548 429 864,816 4,025 545
Year ended 31 December 2012
GROUP Cost NBVDepreciation
charge€000 €000 €000
Plant and equipment 937 650 53
Buildings 1,120 1,098 22
Fixtures and fi&ings 2,520 1,487 234
Computer hardware 203 85 584,780 3,320 367
The group leases various assets under non-cancellable finance lease agreements. The lease terms are between 3 and 101 years, and ownership of the assets lies within the group.
15. ImpairmentThe group operates a number of service station sites in Ireland, the UK and the USA. The group considers each individual site as a cash generating unit (CGU) for the purpose of impairment assessment in accordance with IAS 36 ‘Impairment of assets’ and impairment assessments are conducted at this level when indicators of impairment are considered to exist. The recoverable amounts of sites that are assessed for impairment have been determined based on value-in-use methodology or fair value less costs of disposal.
An impairment charge of €699,000 (2013: €nil; 2012: €1,266,000) was recognised in the Consolidated Income Statement within selling and distribution costs. The impairment charge relates to four service stations (2012: three service stations) in both Ireland and the UK. Impairment indicators were identified when these sites failed to meet profitability expectations. The recoverable amount of these service stations is €2,731,000 (2012: €2,654,000).
Notes to the Consolidated Financial Statements (Continued)
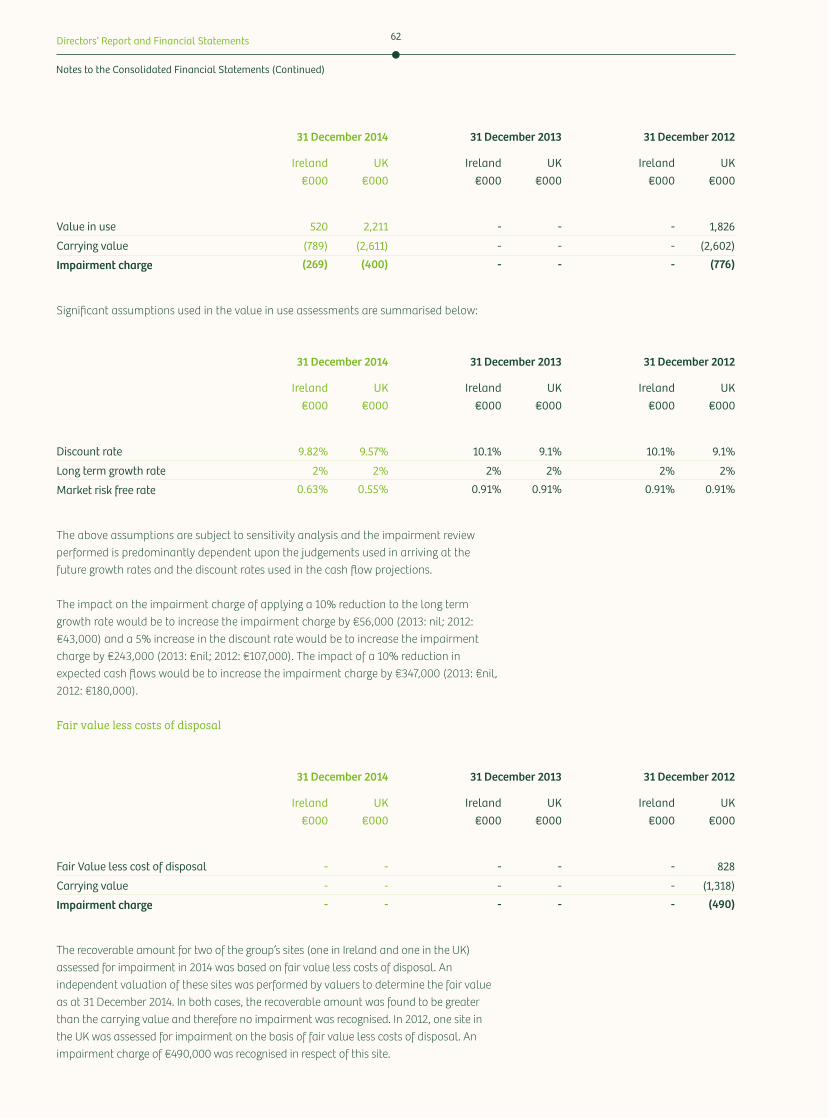
Directors’ Report and Financial Statements 62
31 December 2014 31 December 2013 31 December 2012
Ireland UK Ireland UK Ireland UK€000 €000 €000 €000 €000 €000
Value in use 520 2,211 - - - 1,826
Carrying value (789) (2,611) - - - (2,602)
Impairment charge (269) (400) - - - (776)
31 December 2014 31 December 2013 31 December 2012
Ireland UK Ireland UK Ireland UK€000 €000 €000 €000 €000 €000
Discount rate 9.82% 9.57% 10.1% 9.1% 10.1% 9.1%
Long term growth rate 2% 2% 2% 2% 2% 2%
Market risk free rate 0.63% 0.55% 0.91% 0.91% 0.91% 0.91%
31 December 2014 31 December 2013 31 December 2012
Ireland UK Ireland UK Ireland UK€000 €000 €000 €000 €000 €000
Fair Value less cost of disposal - - - - - 828
Carrying value - - - - - (1,318)
Impairment charge - - - - - (490)
Significant assumptions used in the value in use assessments are summarised below:
The above assumptions are subject to sensitivity analysis and the impairment review performed is predominantly dependent upon the judgements used in arriving at the future growth rates and the discount rates used in the cash flow projections.
The impact on the impairment charge of applying a 10% reduction to the long term growth rate would be to increase the impairment charge by €56,000 (2013: nil; 2012: €43,000) and a 5% increase in the discount rate would be to increase the impairment charge by €243,000 (2013: €nil; 2012: €107,000). The impact of a 10% reduction in expected cash flows would be to increase the impairment charge by €347,000 (2013: €nil, 2012: €180,000).
Fair value less costs of disposal
The recoverable amount for two of the group’s sites (one in Ireland and one in the UK) assessed for impairment in 2014 was based on fair value less costs of disposal. An independent valuation of these sites was performed by valuers to determine the fair value as at 31 December 2014. In both cases, the recoverable amount was found to be greater than the carrying value and therefore no impairment was recognised. In 2012, one site in the UK was assessed for impairment on the basis of fair value less costs of disposal. An impairment charge of €490,000 was recognised in respect of this site.
Notes to the Consolidated Financial Statements (Continued)
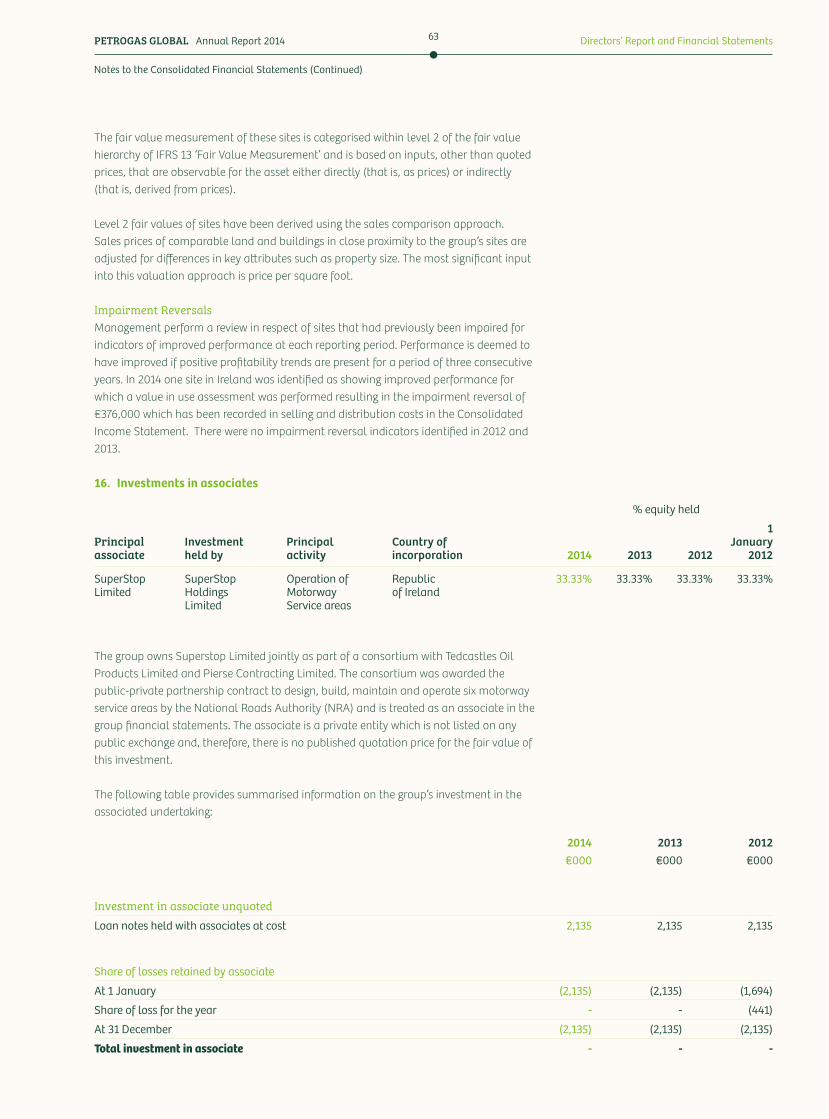
PETROGAS GLOBAL Annual Report 2014 Directors’ Report and Financial Statements63
The fair value measurement of these sites is categorised within level 2 of the fair value hierarchy of IFRS 13 ‘Fair Value Measurement’ and is based on inputs, other than quoted prices, that are observable for the asset either directly (that is, as prices) or indirectly (that is, derived from prices).
Level 2 fair values of sites have been derived using the sales comparison approach. Sales prices of comparable land and buildings in close proximity to the group’s sites are adjusted for differences in key a*ributes such as property size. The most significant input into this valuation approach is price per square foot.
Impairment ReversalsManagement perform a review in respect of sites that had previously been impaired for indicators of improved performance at each reporting period. Performance is deemed to have improved if positive profitability trends are present for a period of three consecutive years. In 2014 one site in Ireland was identified as showing improved performance for which a value in use assessment was performed resulting in the impairment reversal of €376,000 which has been recorded in selling and distribution costs in the Consolidated Income Statement. There were no impairment reversal indicators identified in 2012 and 2013.
16. Investments in associates
The group owns Superstop Limited jointly as part of a consortium with Tedcastles Oil Products Limited and Pierse Contracting Limited. The consortium was awarded the public-private partnership contract to design, build, maintain and operate six motorway service areas by the National Roads Authority (NRA) and is treated as an associate in the group financial statements. The associate is a private entity which is not listed on any public exchange and, therefore, there is no published quotation price for the fair value of this investment.
The following table provides summarised information on the group’s investment in the associated undertaking:
% equity held
Principalassociate
Investmentheld by
Principalactivity
Country ofincorporation 2014 2013 2012
1 January
2012
SuperStopLimited
SuperStopHoldingsLimited
Operation ofMotorwayService areas
Republic of Ireland
33.33% 33.33% 33.33% 33.33%
2014 2013 2012€000 €000 €000
Investment in associate unquotedLoan notes held with associates at cost 2,135 2,135 2,135
Share of losses retained by associate
At 1 January (2,135) (2,135) (1,694)
Share of loss for the year - - (441)
At 31 December (2,135) (2,135) (2,135)
Total investment in associate - - -
Notes to the Consolidated Financial Statements (Continued)
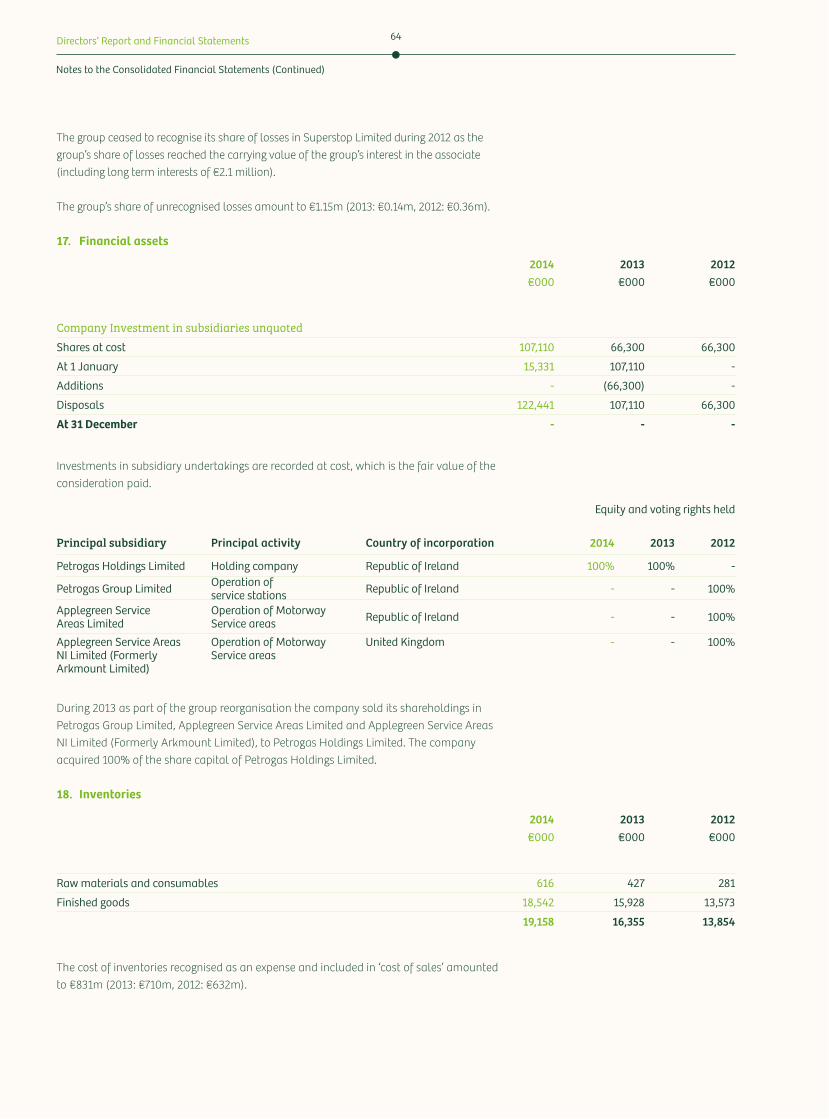
Directors’ Report and Financial Statements 64
The group ceased to recognise its share of losses in Superstop Limited during 2012 as the group’s share of losses reached the carrying value of the group’s interest in the associate (including long term interests of €2.1 million).
The group’s share of unrecognised losses amount to €1.15m (2013: €0.14m, 2012: €0.36m).
17. Financial assets
2014 2013 2012€000 €000 €000
Company Investment in subsidiaries unquotedShares at cost 107,110 66,300 66,300
At 1 January 15,331 107,110 -
Additions - (66,300) -
Disposals 122,441 107,110 66,300
At 31 December - - -
Investments in subsidiary undertakings are recorded at cost, which is the fair value of the consideration paid.
The cost of inventories recognised as an expense and included in ‘cost of sales’ amounted to €831m (2013: €710m, 2012: €632m).
During 2013 as part of the group reorganisation the company sold its shareholdings in Petrogas Group Limited, Applegreen Service Areas Limited and Applegreen Service Areas NI Limited (Formerly Arkmount Limited), to Petrogas Holdings Limited. The company acquired 100% of the share capital of Petrogas Holdings Limited.
18. Inventories
Equity and voting rights held
Principal subsidiary Principal activity Country of incorporation 2014 2013 2012
Petrogas Holdings Limited Holding company Republic of Ireland 100% 100% -
Petrogas Group Limited Operation of service stations Republic of Ireland - - 100%
Applegreen Service Areas Limited
Operation of Motorway Service areas Republic of Ireland - - 100%
Applegreen Service Areas NI Limited (Formerly Arkmount Limited)
Operation of Motorway Service areas
United Kingdom - - 100%
2014 2013 2012€000 €000 €000
Raw materials and consumables 616 427 281
Finished goods 18,542 15,928 13,573
19,158 16,355 13,854
Notes to the Consolidated Financial Statements (Continued)
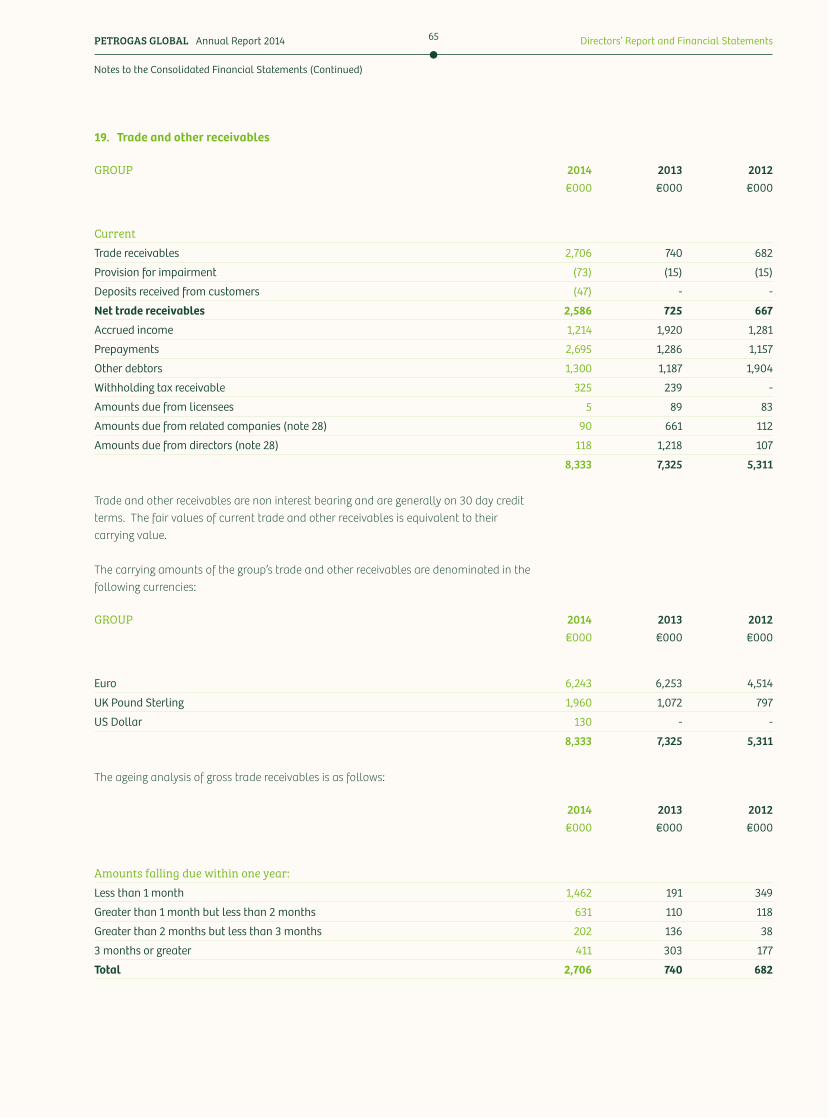
PETROGAS GLOBAL Annual Report 2014 Directors’ Report and Financial Statements65
GROUP 2014 2013 2012€000 €000 €000
CurrentTrade receivables 2,706 740 682
Provision for impairment (73) (15) (15)
Deposits received from customers (47) - -
Net trade receivables 2,586 725 667
Accrued income 1,214 1,920 1,281
Prepayments 2,695 1,286 1,157
Other debtors 1,300 1,187 1,904
Withholding tax receivable 325 239 -
Amounts due from licensees 5 89 83
Amounts due from related companies (note 28) 90 661 112
Amounts due from directors (note 28) 118 1,218 107
8,333 7,325 5,311
2014 2013 2012€000 €000 €000
Amounts falling due within one year:Less than 1 month 1,462 191 349
Greater than 1 month but less than 2 months 631 110 118
Greater than 2 months but less than 3 months 202 136 38
3 months or greater 411 303 177
Total 2,706 740 682
GROUP 2014 2013 2012€000 €000 €000
Euro 6,243 6,253 4,514
UK Pound Sterling 1,960 1,072 797
US Dollar 130 - -
8,333 7,325 5,311
Trade and other receivables are non interest bearing and are generally on 30 day credit terms. The fair values of current trade and other receivables is equivalent to their carrying value.
The carrying amounts of the group’s trade and other receivables are denominated in the following currencies:
The ageing analysis of gross trade receivables is as follows:
19. Trade and other receivables
Notes to the Consolidated Financial Statements (Continued)
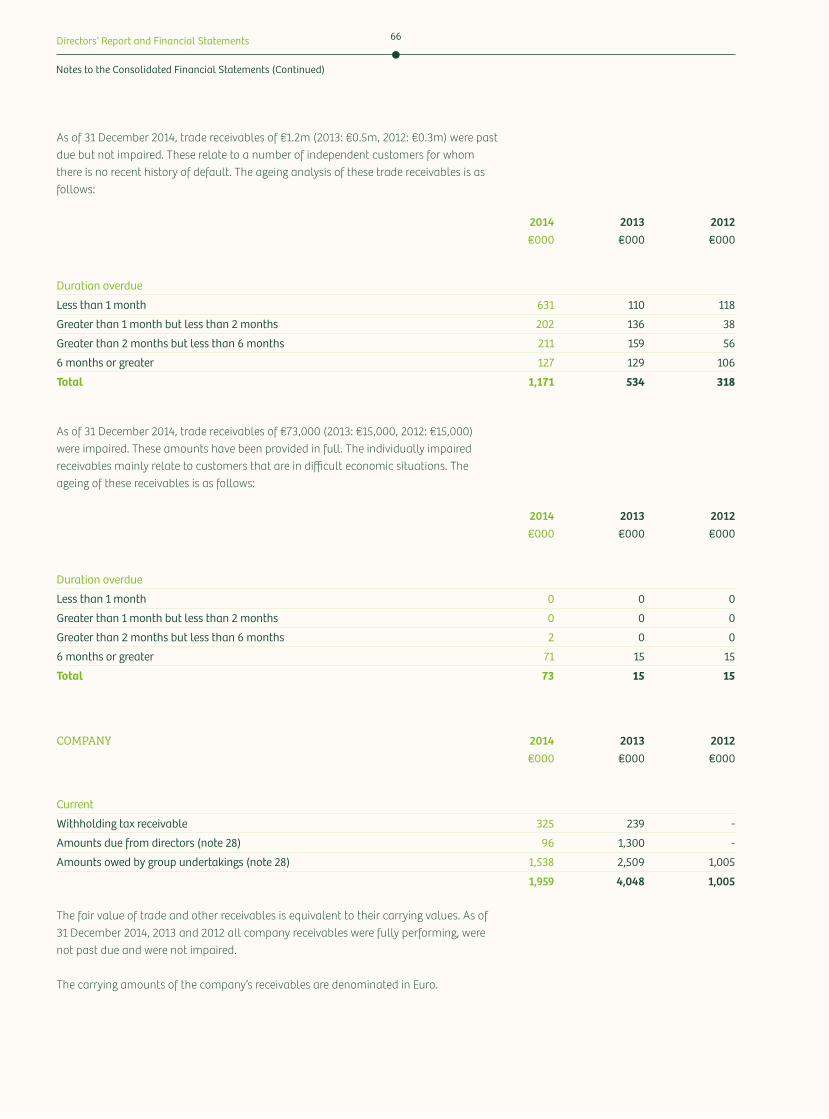
Directors’ Report and Financial Statements 66
As of 31 December 2014, trade receivables of €1.2m (2013: €0.5m, 2012: €0.3m) were past due but not impaired. These relate to a number of independent customers for whom there is no recent history of default. The ageing analysis of these trade receivables is as follows:
As of 31 December 2014, trade receivables of €73,000 (2013: €15,000, 2012: €15,000) were impaired. These amounts have been provided in full. The individually impaired receivables mainly relate to customers that are in difficult economic situations. The ageing of these receivables is as follows:
The fair value of trade and other receivables is equivalent to their carrying values. As of 31 December 2014, 2013 and 2012 all company receivables were fully performing, were not past due and were not impaired.
The carrying amounts of the company’s receivables are denominated in Euro.
2014 2013 2012€000 €000 €000
Duration overdue
Less than 1 month 631 110 118
Greater than 1 month but less than 2 months 202 136 38
Greater than 2 months but less than 6 months 211 159 56
6 months or greater 127 129 106
Total 1,171 534 318
2014 2013 2012€000 €000 €000
Duration overdue
Less than 1 month 0 0 0
Greater than 1 month but less than 2 months 0 0 0
Greater than 2 months but less than 6 months 2 0 0
6 months or greater 71 15 15
Total 73 15 15
COMPANY 2014 2013 2012€000 €000 €000
Current
Withholding tax receivable 325 239 -
Amounts due from directors (note 28) 96 1,300 -
Amounts owed by group undertakings (note 28) 1,538 2,509 1,005
1,959 4,048 1,005
Notes to the Consolidated Financial Statements (Continued)
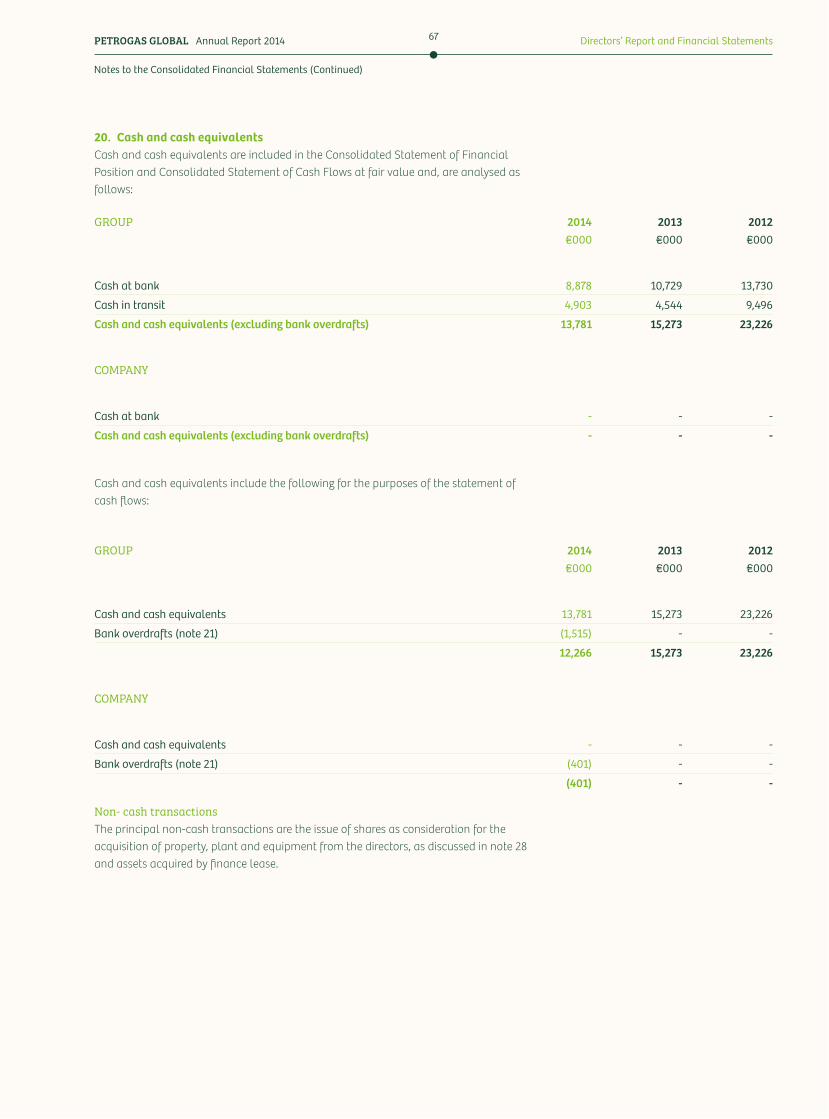
PETROGAS GLOBAL Annual Report 2014 Directors’ Report and Financial Statements67
20. Cash and cash equivalentsCash and cash equivalents are included in the Consolidated Statement of Financial Position and Consolidated Statement of Cash Flows at fair value and, are analysed as follows:
Non- cash transactionsThe principal non-cash transactions are the issue of shares as consideration for the acquisition of property, plant and equipment from the directors, as discussed in note 28 and assets acquired by finance lease.
Cash and cash equivalents include the following for the purposes of the statement of cash flows:
GROUP 2014 2013 2012€000 €000 €000
Cash at bank 8,878 10,729 13,730
Cash in transit 4,903 4,544 9,496
Cash and cash equivalents (excluding bank overdrafts) 13,781 15,273 23,226
COMPANY
Cash at bank - - -
Cash and cash equivalents (excluding bank overdrafts) - - -
GROUP 2014 2013 2012€000 €000 €000
Cash and cash equivalents 13,781 15,273 23,226
Bank overdrafts (note 21) (1,515) - -
12,266 15,273 23,226
COMPANY
Cash and cash equivalents - - -
Bank overdrafts (note 21) (401) - -
(401) - -
Notes to the Consolidated Financial Statements (Continued)
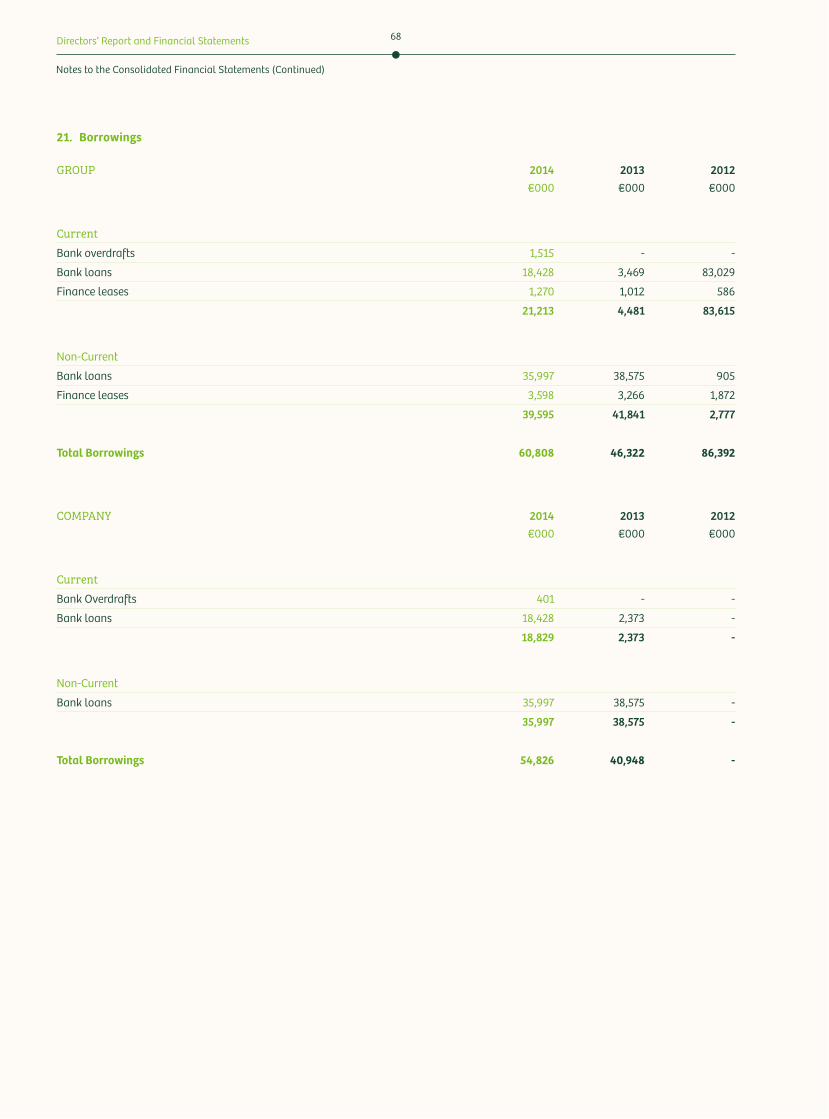
Directors’ Report and Financial Statements 68
GROUP 2014 2013 2012€000 €000 €000
CurrentBank overdrafts 1,515 - -
Bank loans 18,428 3,469 83,029
Finance leases 1,270 1,012 586
21,213 4,481 83,615
Non-Current
Bank loans 35,997 38,575 905
Finance leases 3,598 3,266 1,872
39,595 41,841 2,777
Total Borrowings 60,808 46,322 86,392
COMPANY 2014 2013 2012€000 €000 €000
CurrentBank Overdrafts 401 - -
Bank loans 18,428 2,373 -
18,829 2,373 -
Non-Current
Bank loans 35,997 38,575 -
35,997 38,575 -
Total Borrowings 54,826 40,948 -
21. Borrowings
Notes to the Consolidated Financial Statements (Continued)
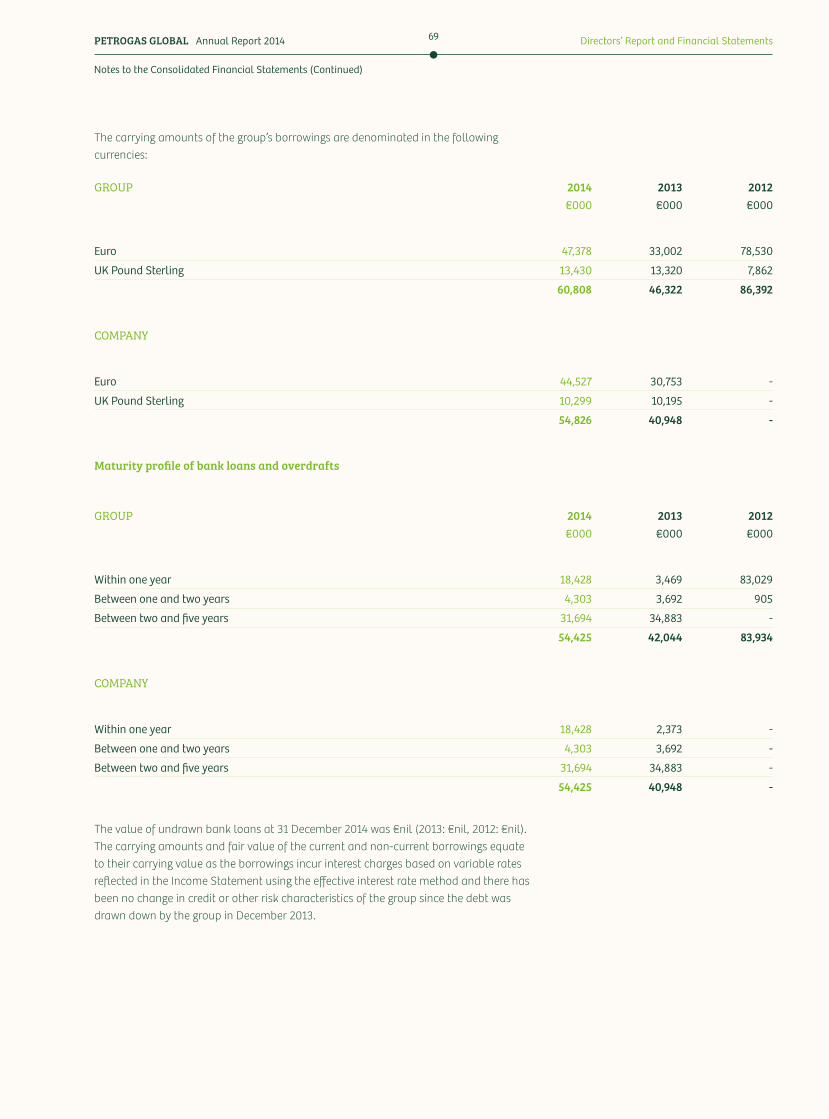
PETROGAS GLOBAL Annual Report 2014 Directors’ Report and Financial Statements69
GROUP 2014 2013 2012€000 €000 €000
Euro 47,378 33,002 78,530
UK Pound Sterling 13,430 13,320 7,862
60,808 46,322 86,392
COMPANY
Euro 44,527 30,753 -
UK Pound Sterling 10,299 10,195 -
54,826 40,948 -
GROUP 2014 2013 2012€000 €000 €000
Within one year 18,428 3,469 83,029
Between one and two years 4,303 3,692 905
Between two and five years 31,694 34,883 -
54,425 42,044 83,934
COMPANY
Within one year 18,428 2,373 -
Between one and two years 4,303 3,692 -
Between two and five years 31,694 34,883 -
54,425 40,948 -
The carrying amounts of the group’s borrowings are denominated in the following currencies:
The value of undrawn bank loans at 31 December 2014 was €nil (2013: €nil, 2012: €nil). The carrying amounts and fair value of the current and non-current borrowings equate to their carrying value as the borrowings incur interest charges based on variable rates reflected in the Income Statement using the effective interest rate method and there has been no change in credit or other risk characteristics of the group since the debt was drawn down by the group in December 2013.
Maturity profile of bank loans and overdrafts
Notes to the Consolidated Financial Statements (Continued)
Directors’ Report and Financial Statements 70
Bank overdraftsBank overdrafts are short term financing and are repayable on demand. The group has access to overdraft facilities totalling €5m and £1.7m.
Bank Loans in existence at 31 December 2013 & 31 December 2014Bank LoansGroup and company bank borrowings are stated net of unamortised issue costs of €1m (2013: €1.25m). These issue costs were incurred in respect of the new five year senior debt facility entered into in December 2013. Additional fees were incurred during 2014 in relation to the drawdown of a second tranche of funding.
These costs together with the interest expense are allocated to the Income Statement over the five year term of the facility using the effective interest rate method.
As part of the group refinancing that occurred during 2013, new long term loan finance was obtained from Ulster Bank Ireland and Allied Irish Bank Plc. Finance totalling €32m and £8.5m was obtained with all loan facilities due to mature in 2019. As part of these loan facilities the group capitalised €1.3m of borrowing costs. All facilities are on floating rate terms based on Euribor for loans denominated in Euro and Libor for loans denominated in Pound Sterling.
Bank Loans in existence at 31 December 2012Bank of Scotland (Ireland)The group held loans in both Euro and Pound Sterling with Bank of Scotland (Ireland) with maturities ranging from 2012-2028. The group se*led all of these loans with Bank of Scotland (Ireland) during 2013 with no balance remaining outstanding at the end of 2013.
IBRCThe group held loans denominated in Euro and Sterling with Anglo Irish Bank. These loans were transferred to the Irish Bank Resolution Corporation Limited (IBRC). The group successfully repurchased these loans during 2013.
ACC Bank PlcThe group held loans denominated in Euro with ACC Bank Plc. These loans matured and were fully repaid in 2013.
Guarantees and securityAs security for loans advanced by Ulster Bank Ireland and Allied Irish Bank Plc, the following charges have been granted:
(i) Debenture or equivalent over all material group subsidiaries
(ii) Fixed charge on shares in all material subsidiaries
In addition joint and several guarantees of the obligations of the borrower by Petrogas Global Limited and seven other group companies have been granted.
During 2013 the group fully discharged its debt with IBRC, ACC Bank Plc, and Bank of Scotland (Ireland) and all related security was released.
Notes to the Consolidated Financial Statements (Continued)
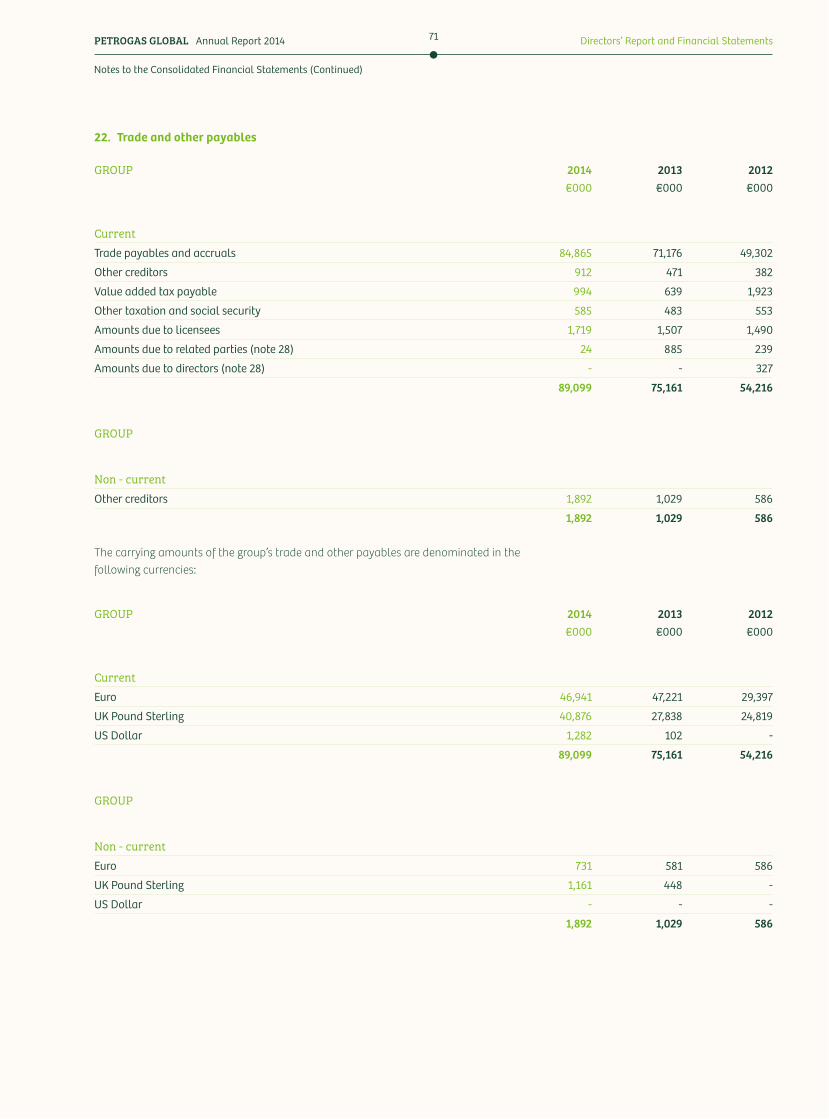
PETROGAS GLOBAL Annual Report 2014 Directors’ Report and Financial Statements71
GROUP 2014 2013 2012€000 €000 €000
CurrentTrade payables and accruals 84,865 71,176 49,302
Other creditors 912 471 382
Value added tax payable 994 639 1,923
Other taxation and social security 585 483 553
Amounts due to licensees 1,719 1,507 1,490
Amounts due to related parties (note 28) 24 885 239
Amounts due to directors (note 28) - - 327
89,099 75,161 54,216
GROUP
Non - currentOther creditors 1,892 1,029 586
1,892 1,029 586
GROUP 2014 2013 2012€000 €000 €000
CurrentEuro 46,941 47,221 29,397
UK Pound Sterling 40,876 27,838 24,819
US Dollar 1,282 102 -
89,099 75,161 54,216
GROUP
Non - currentEuro 731 581 586
UK Pound Sterling 1,161 448 -
US Dollar - - -
1,892 1,029 586
22. Trade and other payables
The carrying amounts of the group’s trade and other payables are denominated in the following currencies:
Notes to the Consolidated Financial Statements (Continued)
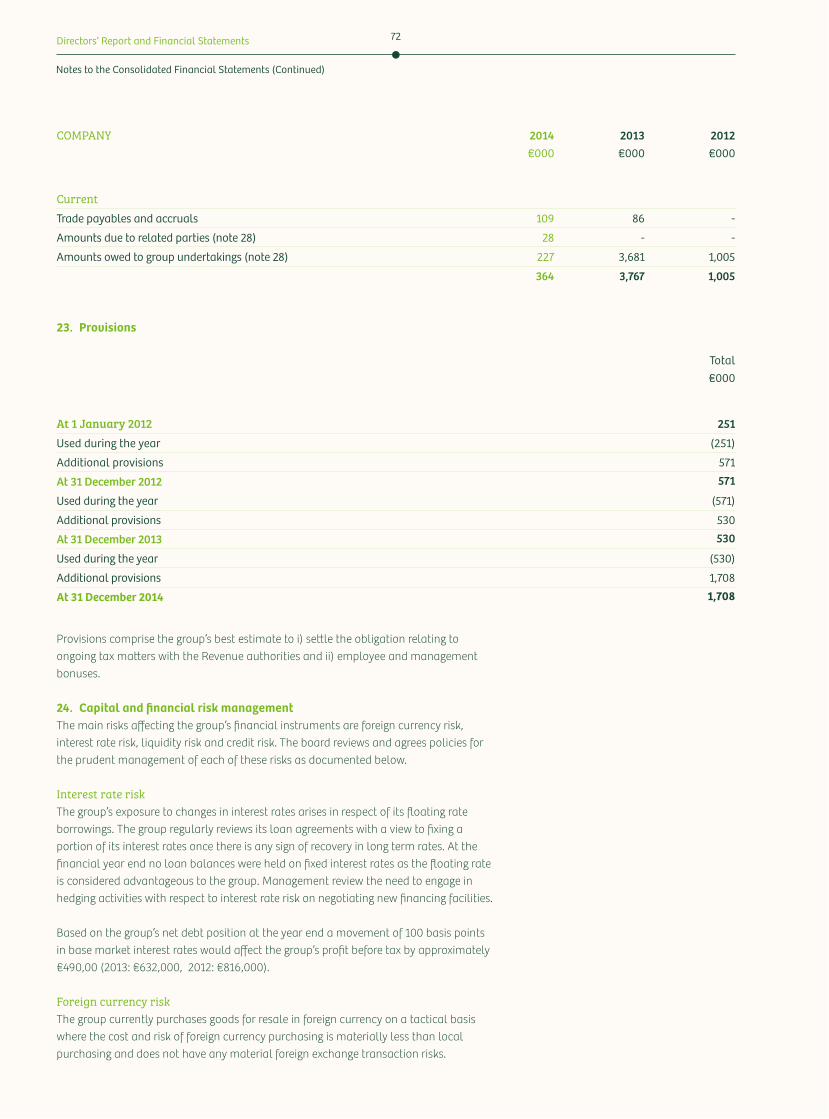
Directors’ Report and Financial Statements 72
COMPANY 2014 2013 2012€000 €000 €000
CurrentTrade payables and accruals 109 86 -
Amounts due to related parties (note 28) 28 - -
Amounts owed to group undertakings (note 28) 227 3,681 1,005
364 3,767 1,005
Total€000
At 1 January 2012 251
Used during the year (251)
Additional provisions 571
At 31 December 2012 571
Used during the year (571)
Additional provisions 530
At 31 December 2013 530
Used during the year (530)
Additional provisions 1,708
At 31 December 2014 1,708
23. Provisions
Provisions comprise the group’s best estimate to i) se*le the obligation relating to ongoing tax ma*ers with the Revenue authorities and ii) employee and management bonuses.
24. Capital and financial risk managementThe main risks affecting the group’s financial instruments are foreign currency risk, interest rate risk, liquidity risk and credit risk. The board reviews and agrees policies for the prudent management of each of these risks as documented below.
Interest rate riskThe group’s exposure to changes in interest rates arises in respect of its floating rate borrowings. The group regularly reviews its loan agreements with a view to fixing a portion of its interest rates once there is any sign of recovery in long term rates. At the financial year end no loan balances were held on fixed interest rates as the floating rate is considered advantageous to the group. Management review the need to engage in hedging activities with respect to interest rate risk on negotiating new financing facilities.
Based on the group’s net debt position at the year end a movement of 100 basis points in base market interest rates would affect the group’s profit before tax by approximately €490,00 (2013: €632,000, 2012: €816,000).
Foreign currency riskThe group currently purchases goods for resale in foreign currency on a tactical basis where the cost and risk of foreign currency purchasing is materially less than local purchasing and does not have any material foreign exchange transaction risks.
Notes to the Consolidated Financial Statements (Continued)
PETROGAS GLOBAL Annual Report 2014 Directors’ Report and Financial Statements73
The group’s activities in the UK and USA are conducted primarily in their local currencies. Variances affecting operational activities in this regard are reflected in operating costs or in costs of sales in the Income Statement in the year in which they arise. The principal foreign exchange risk is translation arising from fluctuations in the Euro value of the groups’ investments in Sterling and US Dollars. The group manages its borrowings where practical and cost effective, to partially hedge the foreign currency assets. Hedging is done using currency borrowings in the same currency as the assets held by the operations using the borrowings.
A portion of the company’s borrowings are denominated in Pounds Sterling and carried in Euro in the Statement of Financial Position. A movement of 10% in exchange rates would change the carrying value of borrowings by €1,030,000 (2013: €1,020,000, 2012: €nil).
Credit risk Credit risk arising in the context of the group’s operations is not significant with the total bad debt provision at the Statement of Financial Position date amounting to 2.6% of gross trade receivables (2013: 2%, 2012: 2%). Customer credit risk is managed centrally according to established policies, procedures and controls. Customer credit quality is assessed in line with strict credit rating criteria and credit limits established where appropriate. Outstanding customer balances are regularly monitored and a review for indicators of impairment (evidence of financial difficulty of the customer, payment default, breach of contract etc.) is carried out at each reporting date. Significant balances are reviewed individually while smaller balances are grouped and assessed collectively.
Receivables balances are in general unsecured and non-interest-bearing.
Cash and cash equivalents give rise to credit risk on amounts due from counterparty financial institutions (stemming from their insolvency or a downgrade in their credit ratings). Dealings are restricted to those banks with the relevant combination of geographic presence and investment grade rating. The Group continually monitors the credit ratings of its counterparties and the credit exposure to each counterparty.
The maximum exposure arising in the event of default on the part of the counterparty (including insolvency) is the carrying value of the relevant financial instrument.
At the Statement of Financial Position date there were no significant concentrations of credit risk.
Liquidity riskThe group’s policy in relation to liquidity and cash flow risk is to ensure sufficient resources are available from cash balances or cash flows so that all obligations can be met when they fall due. To achieve this, the group operates a demand deposit account for excess cash, as it is continuously redeveloping and incurring capital expenditure on service stations, and managing working capital peaks and troughs for trading seasonality and timing of payments.
The tables below summarise the maturity profile of the group’s financial liabilities at 31 December 2014, 31 December 2013 and 31 December 2012, based on contractual undiscounted payments, including interest:
Notes to the Consolidated Financial Statements (Continued)
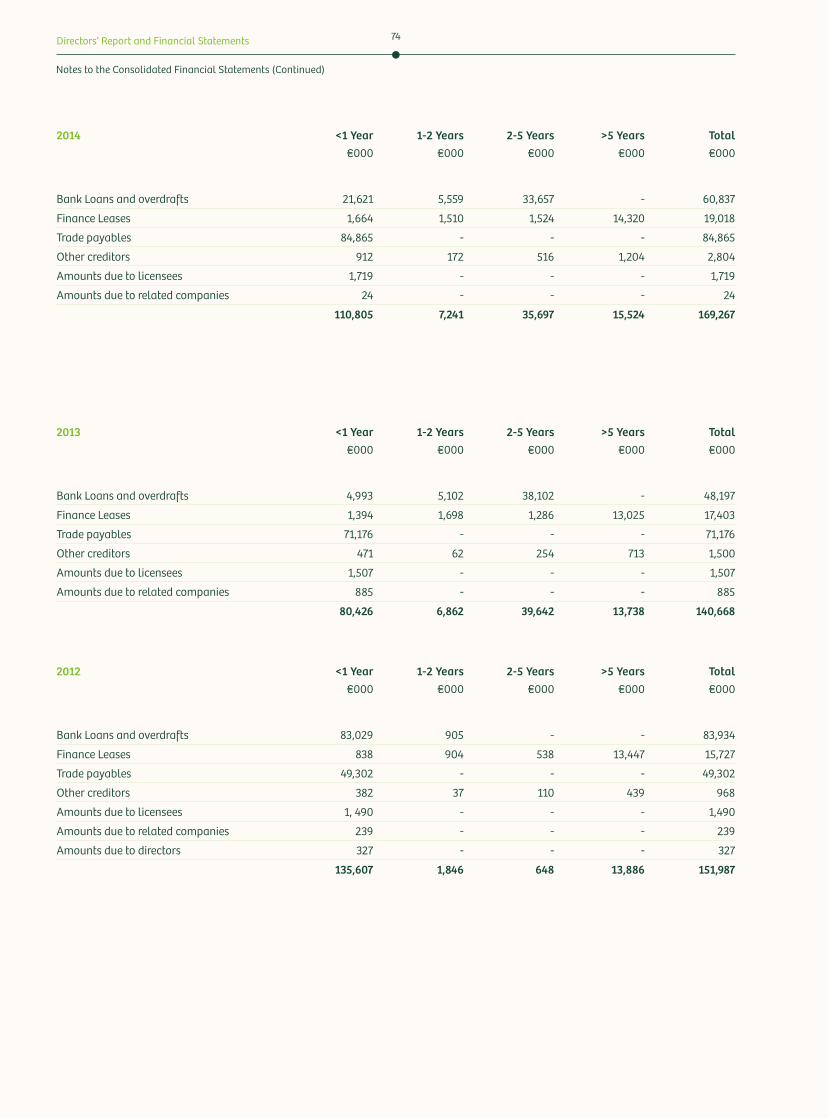
Directors’ Report and Financial Statements 74
2014 <1 Year 1-2 Years 2-5 Years >5 Years Total€000 €000 €000 €000 €000
Bank Loans and overdrafts 21,621 5,559 33,657 - 60,837
Finance Leases 1,664 1,510 1,524 14,320 19,018
Trade payables 84,865 - - - 84,865
Other creditors 912 172 516 1,204 2,804
Amounts due to licensees 1,719 - - - 1,719
Amounts due to related companies 24 - - - 24
110,805 7,241 35,697 15,524 169,267
2013 <1 Year 1-2 Years 2-5 Years >5 Years Total€000 €000 €000 €000 €000
Bank Loans and overdrafts 4,993 5,102 38,102 - 48,197
Finance Leases 1,394 1,698 1,286 13,025 17,403
Trade payables 71,176 - - - 71,176
Other creditors 471 62 254 713 1,500
Amounts due to licensees 1,507 - - - 1,507
Amounts due to related companies 885 - - - 885
80,426 6,862 39,642 13,738 140,668
2012 <1 Year 1-2 Years 2-5 Years >5 Years Total€000 €000 €000 €000 €000
Bank Loans and overdrafts 83,029 905 - - 83,934
Finance Leases 838 904 538 13,447 15,727
Trade payables 49,302 - - - 49,302
Other creditors 382 37 110 439 968
Amounts due to licensees 1, 490 - - - 1,490
Amounts due to related companies 239 - - - 239
Amounts due to directors 327 - - - 327
135,607 1,846 648 13,886 151,987
Notes to the Consolidated Financial Statements (Continued)
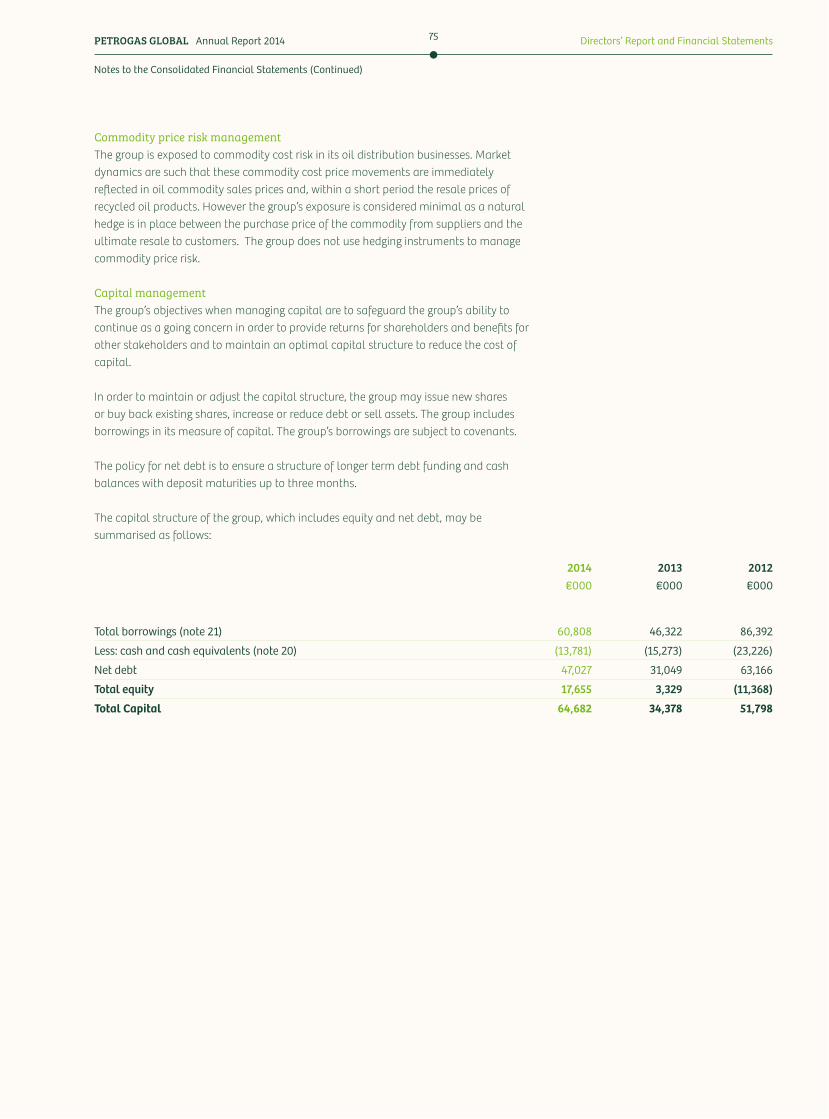
PETROGAS GLOBAL Annual Report 2014 Directors’ Report and Financial Statements75
Commodity price risk managementThe group is exposed to commodity cost risk in its oil distribution businesses. Market dynamics are such that these commodity cost price movements are immediately reflected in oil commodity sales prices and, within a short period the resale prices of recycled oil products. However the group’s exposure is considered minimal as a natural hedge is in place between the purchase price of the commodity from suppliers and the ultimate resale to customers. The group does not use hedging instruments to manage commodity price risk.
Capital managementThe group’s objectives when managing capital are to safeguard the group’s ability to continue as a going concern in order to provide returns for shareholders and benefits for other stakeholders and to maintain an optimal capital structure to reduce the cost of capital.
In order to maintain or adjust the capital structure, the group may issue new shares or buy back existing shares, increase or reduce debt or sell assets. The group includes borrowings in its measure of capital. The group’s borrowings are subject to covenants.
The policy for net debt is to ensure a structure of longer term debt funding and cash balances with deposit maturities up to three months.
The capital structure of the group, which includes equity and net debt, may be summarised as follows:
2014 2013 2012€000 €000 €000
Total borrowings (note 21) 60,808 46,322 86,392
Less: cash and cash equivalents (note 20) (13,781) (15,273) (23,226)
Net debt 47,027 31,049 63,166
Total equity 17,655 3,329 (11,368)
Total Capital 64,682 34,378 51,798
Notes to the Consolidated Financial Statements (Continued)
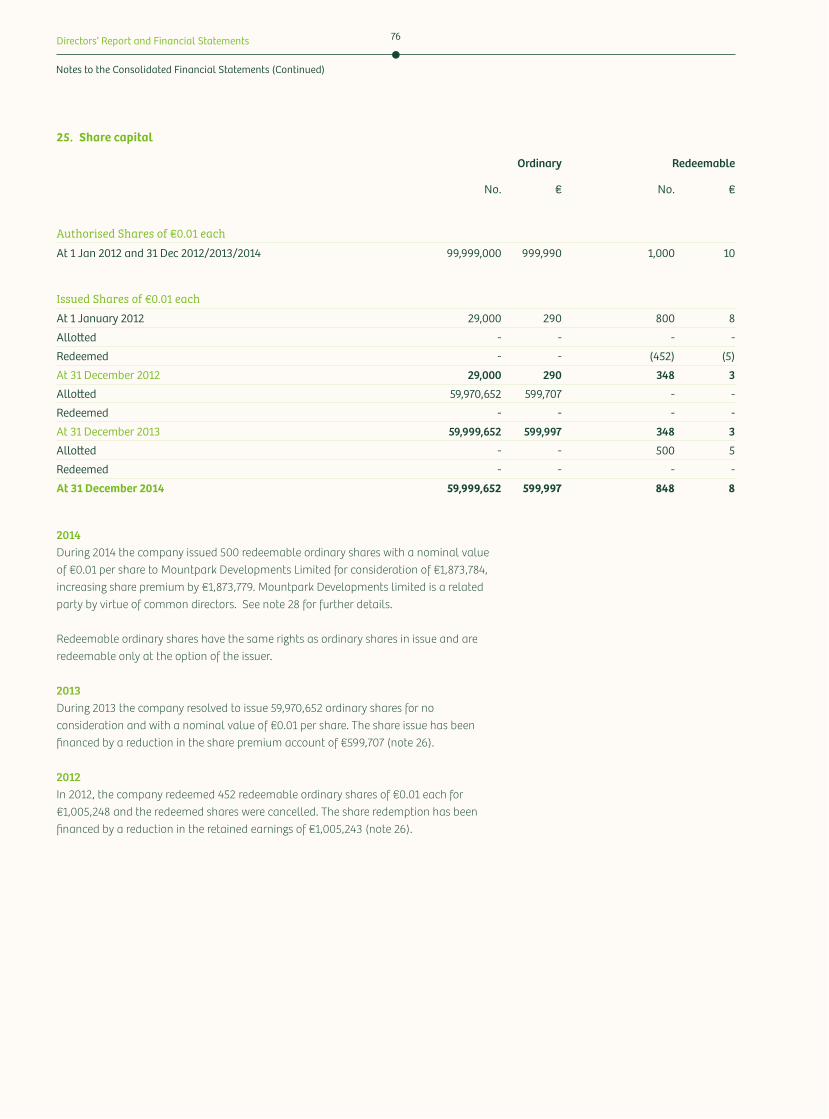
Directors’ Report and Financial Statements 76
Ordinary Redeemable
No. € No. €
Authorised Shares of €0.01 eachAt 1 Jan 2012 and 31 Dec 2012/2013/2014 99,999,000 999,990 1,000 10
Issued Shares of €0.01 eachAt 1 January 2012 29,000 290 800 8
Allo&ed - - - -
Redeemed - - (452) (5)
At 31 December 2012 29,000 290 348 3Allo&ed 59,970,652 599,707 - -
Redeemed - - - -
At 31 December 2013 59,999,652 599,997 348 3Allo&ed - - 500 5
Redeemed - - - -
At 31 December 2014 59,999,652 599,997 848 8
25. Share capital
2014During 2014 the company issued 500 redeemable ordinary shares with a nominal value of €0.01 per share to Mountpark Developments Limited for consideration of €1,873,784, increasing share premium by €1,873,779. Mountpark Developments limited is a related party by virtue of common directors. See note 28 for further details.
Redeemable ordinary shares have the same rights as ordinary shares in issue and are redeemable only at the option of the issuer.
2013During 2013 the company resolved to issue 59,970,652 ordinary shares for no consideration and with a nominal value of €0.01 per share. The share issue has been financed by a reduction in the share premium account of €599,707 (note 26).
2012In 2012, the company redeemed 452 redeemable ordinary shares of €0.01 each for €1,005,248 and the redeemed shares were cancelled. The share redemption has been financed by a reduction in the retained earnings of €1,005,243 (note 26).
Notes to the Consolidated Financial Statements (Continued)
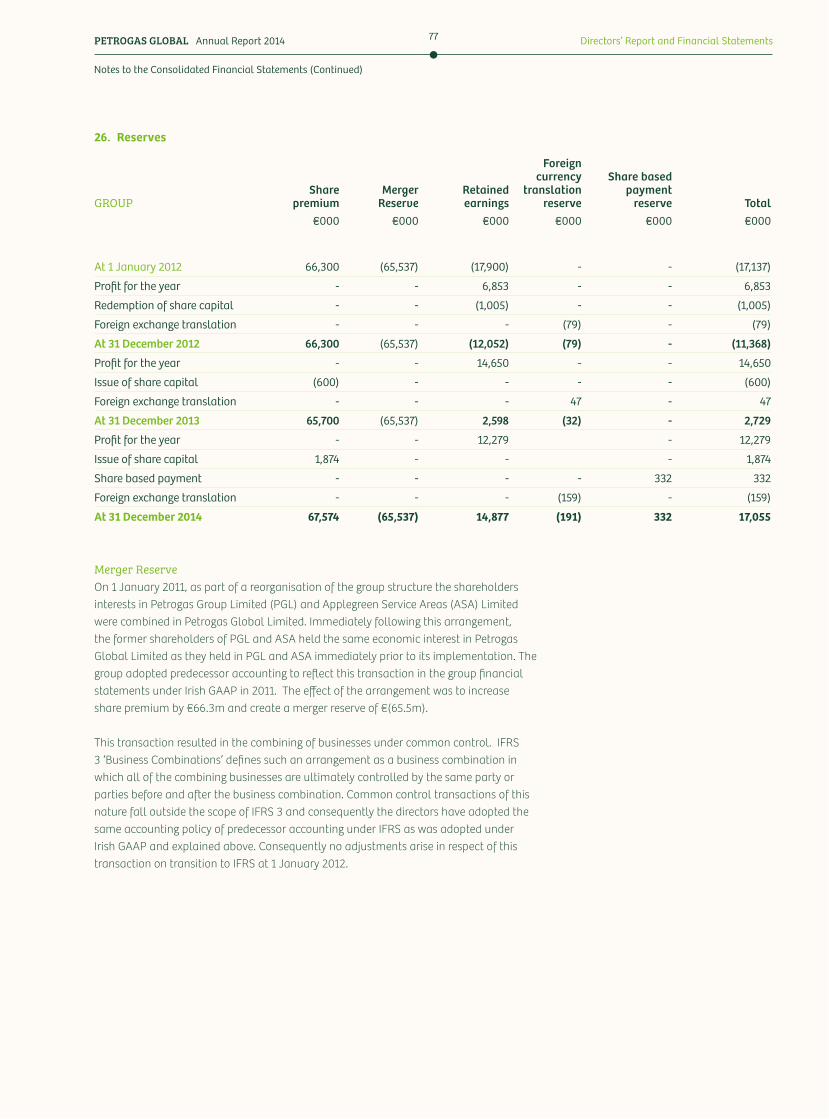
PETROGAS GLOBAL Annual Report 2014 Directors’ Report and Financial Statements77
Merger ReserveOn 1 January 2011, as part of a reorganisation of the group structure the shareholders interests in Petrogas Group Limited (PGL) and Applegreen Service Areas (ASA) Limited were combined in Petrogas Global Limited. Immediately following this arrangement, the former shareholders of PGL and ASA held the same economic interest in Petrogas Global Limited as they held in PGL and ASA immediately prior to its implementation. The group adopted predecessor accounting to reflect this transaction in the group financial statements under Irish GAAP in 2011. The effect of the arrangement was to increase share premium by €66.3m and create a merger reserve of €(65.5m).
This transaction resulted in the combining of businesses under common control. IFRS 3 ‘Business Combinations’ defines such an arrangement as a business combination in which all of the combining businesses are ultimately controlled by the same party or parties before and after the business combination. Common control transactions of this nature fall outside the scope of IFRS 3 and consequently the directors have adopted the same accounting policy of predecessor accounting under IFRS as was adopted under Irish GAAP and explained above. Consequently no adjustments arise in respect of this transaction on transition to IFRS at 1 January 2012.
26. Reserves
GROUPShare
premiumMerger
ReserveRetained earnings
Foreign currency
translation reserve
Share based payment
reserve Total€000 €000 €000 €000 €000 €000
At 1 January 2012 66,300 (65,537) (17,900) - - (17,137)
Profit for the year - - 6,853 - - 6,853
Redemption of share capital - - (1,005) - - (1,005)
Foreign exchange translation - - - (79) - (79)
At 31 December 2012 66,300 (65,537) (12,052) (79) - (11,368)
Profit for the year - - 14,650 - - 14,650
Issue of share capital (600) - - - - (600)
Foreign exchange translation - - - 47 - 47
At 31 December 2013 65,700 (65,537) 2,598 (32) - 2,729
Profit for the year - - 12,279 - 12,279
Issue of share capital 1,874 - - - 1,874
Share based payment - - - - 332 332
Foreign exchange translation - - - (159) - (159)
At 31 December 2014 67,574 (65,537) 14,877 (191) 332 17,055
Notes to the Consolidated Financial Statements (Continued)

Directors’ Report and Financial Statements 78
COMPANYShare
premiumRetained earnings
Share based
payment reserve Total
€000 €000 €000 €000
At 1 January 2012 and at 31 December 2012 66,300 - - 66,300
Loss for the year - (85) - (85)
Issue of share capital (600) - - (600)
At 31 December 2013 65,700 (85) - 65,615
Loss for the year - 789 - 789
Issue of share capital 1,874 - - 1,874
Share based payment cost - - 332 332
At 31 December 2014 67,574 704 332 68,610
2014 2013 2012€000 €000 €000
Land and buildingsDue within one year 11,455 8,291 5,294
Due after one year but not more than five years 45,776 37,556 20,972
Due after five years 135,813 112,159 61,784
Total operating lease commitments 193,044 158,006 88,050
27. Commitments and contingencies
Operating lease commitmentsThe group leases various buildings and sites for use across the group’s retail operations. These leases are non-cancellable operating leases with varying terms, escalation clauses, incentives and renewal rights. Future minimum rentals payable under non-cancellable operating leases, on an undiscounted basis, are as follows:
Finance lease commitmentsThe group has finance leases and hire purchase contracts for various items of property, plant and equipment. These leases have terms of renewal but no purchase options or escalation clauses. Renewals are at the option of the specific entity holding the lease. The future minimum lease payments, and their associated present values, payable under finance leases and hire purchase contracts are as follows:
Notes to the Consolidated Financial Statements (Continued)
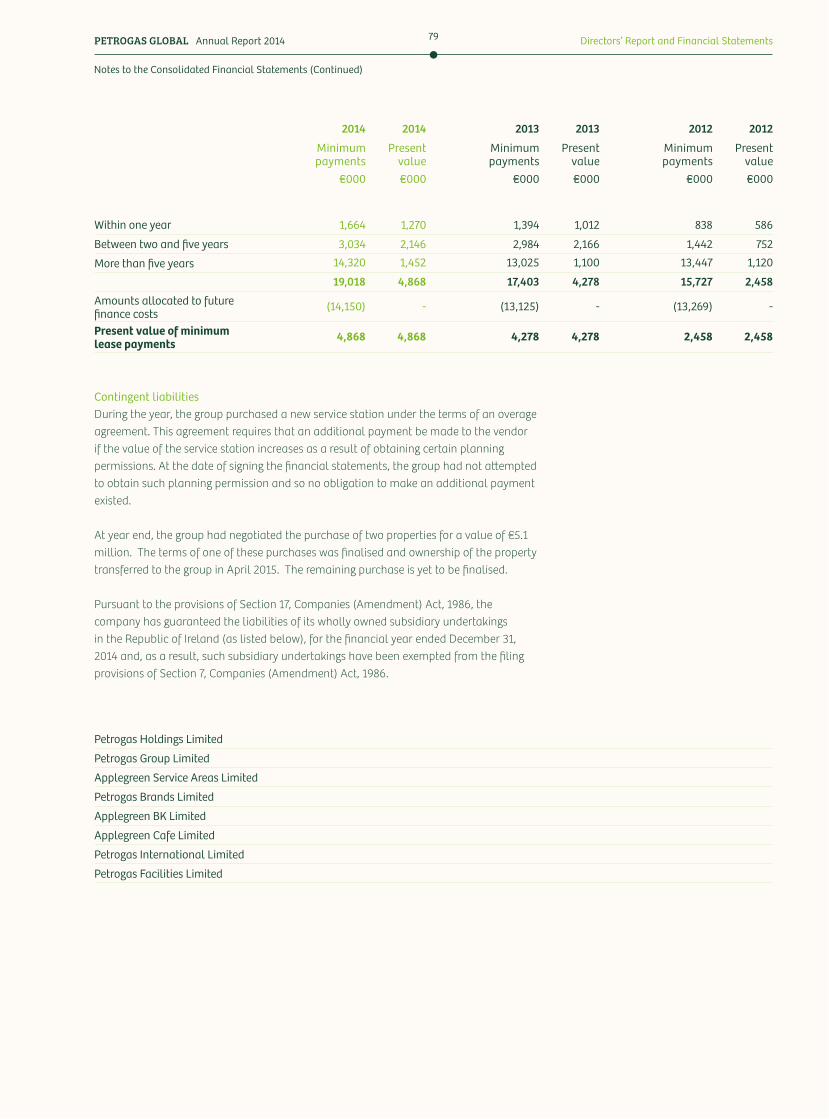
PETROGAS GLOBAL Annual Report 2014 Directors’ Report and Financial Statements79
Contingent liabilitiesDuring the year, the group purchased a new service station under the terms of an overage agreement. This agreement requires that an additional payment be made to the vendor if the value of the service station increases as a result of obtaining certain planning permissions. At the date of signing the financial statements, the group had not a*empted to obtain such planning permission and so no obligation to make an additional payment existed.
At year end, the group had negotiated the purchase of two properties for a value of €5.1 million. The terms of one of these purchases was finalised and ownership of the property transferred to the group in April 2015. The remaining purchase is yet to be finalised.
Pursuant to the provisions of Section 17, Companies (Amendment) Act, 1986, the company has guaranteed the liabilities of its wholly owned subsidiary undertakings in the Republic of Ireland (as listed below), for the financial year ended December 31, 2014 and, as a result, such subsidiary undertakings have been exempted from the filing provisions of Section 7, Companies (Amendment) Act, 1986.
2014 2014 2013 2013 2012 2012
Minimum payments
Present value
Minimum payments
Present value
Minimum payments
Present value
€000 €000 €000 €000 €000 €000
Within one year 1,664 1,270 1,394 1,012 838 586
Between two and five years 3,034 2,146 2,984 2,166 1,442 752
More than five years 14,320 1,452 13,025 1,100 13,447 1,120
19,018 4,868 17,403 4,278 15,727 2,458
Amounts allocated to future finance costs
(14,150) - (13,125) - (13,269) -
Present value of minimum lease payments 4,868 4,868 4,278 4,278 2,458 2,458
Petrogas Holdings Limited
Petrogas Group Limited
Applegreen Service Areas Limited
Petrogas Brands Limited
Applegreen BK Limited
Applegreen Cafe Limited
Petrogas International Limited
Petrogas Facilities Limited
Notes to the Consolidated Financial Statements (Continued)
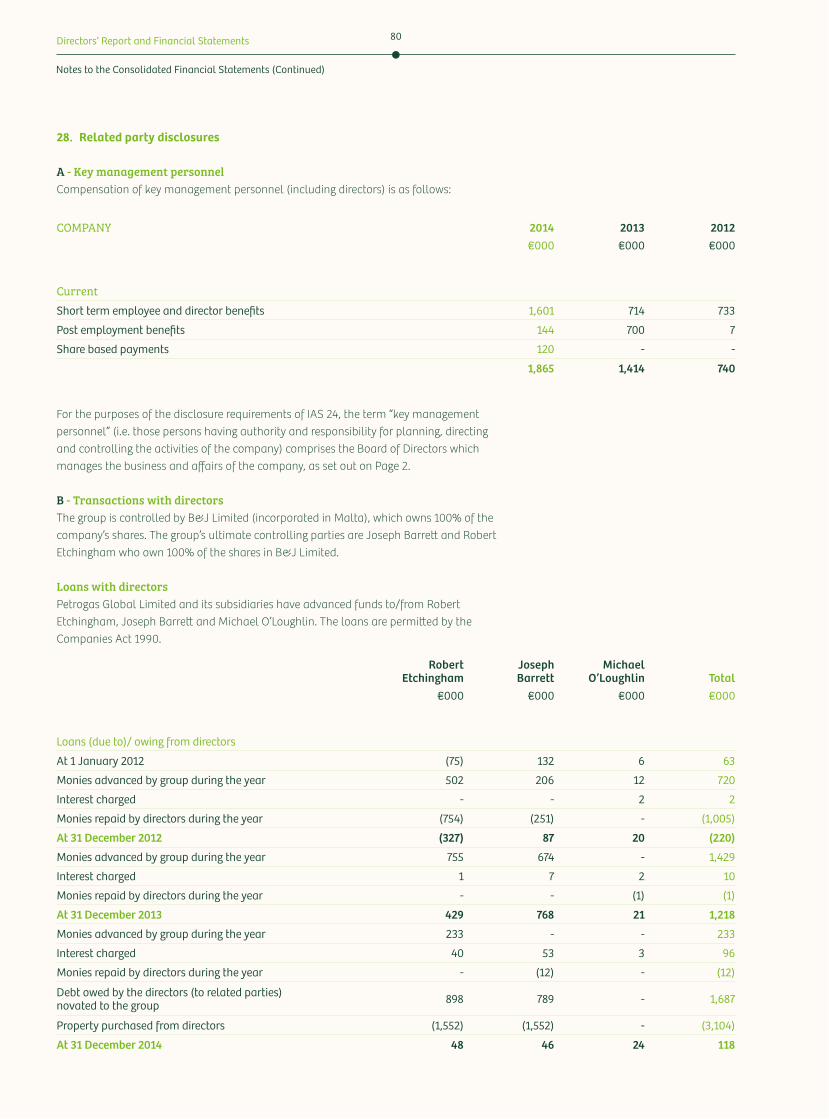
Directors’ Report and Financial Statements 80
28. Related party disclosures
A - Key management personnel Compensation of key management personnel (including directors) is as follows:
COMPANY 2014 2013 2012€000 €000 €000
CurrentShort term employee and director benefits 1,601 714 733
Post employment benefits 144 700 7
Share based payments 120 - -
1,865 1,414 740
For the purposes of the disclosure requirements of IAS 24, the term “key management personnel” (i.e. those persons having authority and responsibility for planning, directing and controlling the activities of the company) comprises the Board of Directors which manages the business and affairs of the company, as set out on Page 2.
B - Transactions with directorsThe group is controlled by B&J Limited (incorporated in Malta), which owns 100% of the company’s shares. The group’s ultimate controlling parties are Joseph Barre* and Robert Etchingham who own 100% of the shares in B&J Limited.
Loans with directorsPetrogas Global Limited and its subsidiaries have advanced funds to/from Robert Etchingham, Joseph Barre* and Michael O’Loughlin. The loans are permi*ed by the Companies Act 1990.
RobertEtchingham
Joseph Barrett
MichaelO’Loughlin Total
€000 €000 €000 €000
Loans (due to)/ owing from directors
At 1 January 2012 (75) 132 6 63
Monies advanced by group during the year 502 206 12 720
Interest charged - - 2 2
Monies repaid by directors during the year (754) (251) - (1,005)
At 31 December 2012 (327) 87 20 (220)
Monies advanced by group during the year 755 674 - 1,429
Interest charged 1 7 2 10
Monies repaid by directors during the year - - (1) (1)
At 31 December 2013 429 768 21 1,218
Monies advanced by group during the year 233 - - 233
Interest charged 40 53 3 96
Monies repaid by directors during the year - (12) - (12)
Debt owed by the directors (to related parties) novated to the group 898 789 - 1,687
Property purchased from directors (1,552) (1,552) - (3,104)
At 31 December 2014 48 46 24 118
Notes to the Consolidated Financial Statements (Continued)
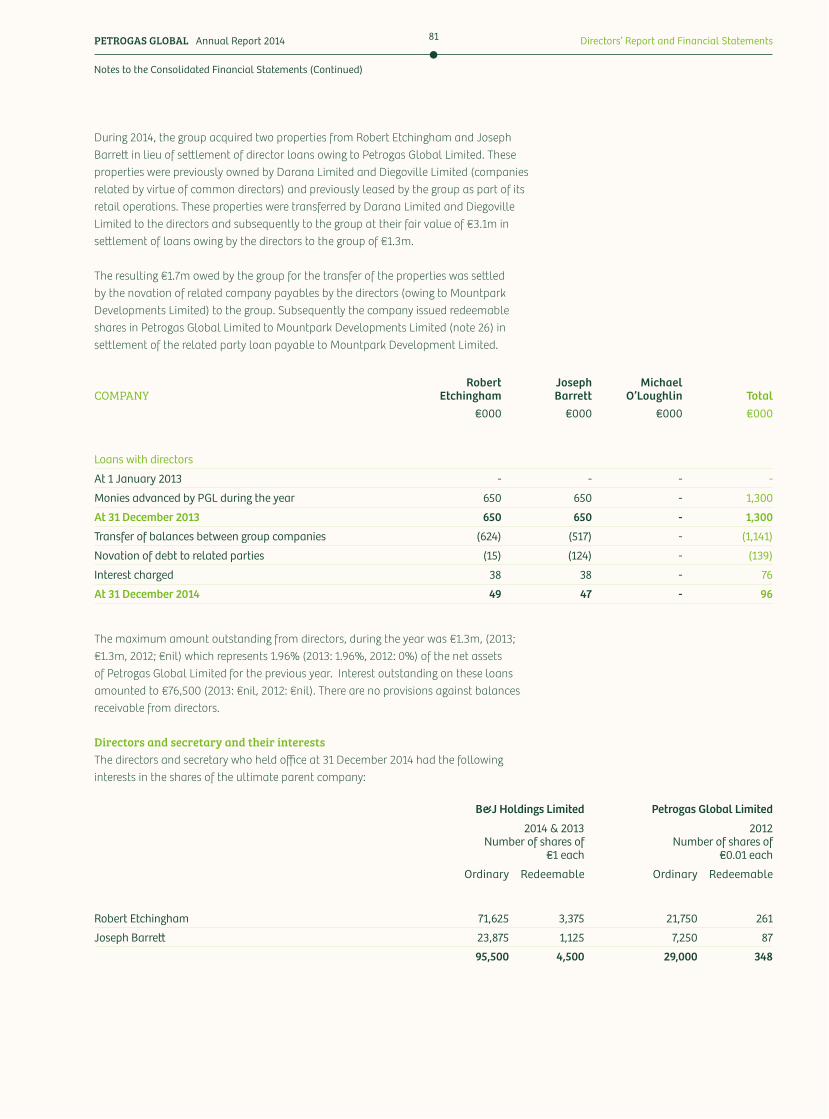
PETROGAS GLOBAL Annual Report 2014 Directors’ Report and Financial Statements81
During 2014, the group acquired two properties from Robert Etchingham and Joseph Barre* in lieu of se*lement of director loans owing to Petrogas Global Limited. These properties were previously owned by Darana Limited and Diegoville Limited (companies related by virtue of common directors) and previously leased by the group as part of its retail operations. These properties were transferred by Darana Limited and Diegoville Limited to the directors and subsequently to the group at their fair value of €3.1m in se*lement of loans owing by the directors to the group of €1.3m.
The resulting €1.7m owed by the group for the transfer of the properties was se*led by the novation of related company payables by the directors (owing to Mountpark Developments Limited) to the group. Subsequently the company issued redeemable shares in Petrogas Global Limited to Mountpark Developments Limited (note 26) in se*lement of the related party loan payable to Mountpark Development Limited.
The maximum amount outstanding from directors, during the year was €1.3m, (2013; €1.3m, 2012; €nil) which represents 1.96% (2013: 1.96%, 2012: 0%) of the net assets of Petrogas Global Limited for the previous year. Interest outstanding on these loans amounted to €76,500 (2013: €nil, 2012: €nil). There are no provisions against balances receivable from directors.
Directors and secretary and their interestsThe directors and secretary who held office at 31 December 2014 had the following interests in the shares of the ultimate parent company:
COMPANYRobert
EtchinghamJoseph
BarrettMichael
O’Loughlin Total€000 €000 €000 €000
Loans with directors
At 1 January 2013 - - - -
Monies advanced by PGL during the year 650 650 - 1,300
At 31 December 2013 650 650 - 1,300
Transfer of balances between group companies (624) (517) - (1,141)
Novation of debt to related parties (15) (124) - (139)
Interest charged 38 38 - 76
At 31 December 2014 49 47 - 96
B&J Holdings Limited Petrogas Global Limited
2014 & 2013 Number of shares of €1 each
2012 Number of shares of €0.01 each
Ordinary Redeemable Ordinary Redeemable
Robert Etchingham 71,625 3,375 21,750 261
Joseph Barre& 23,875 1,125 7,250 87
95,500 4,500 29,000 348
Notes to the Consolidated Financial Statements (Continued)

Directors’ Report and Financial Statements 82
The ultimate parent company of the group changed during 2013 (note 31). All shares held by directors in 2013 and 2014 were in B&J Holdings Limited and all were beneficially held. All shares held by the directors in 2012 were in Petrogas Global Limited.
The directors and secretary who held office at 31 December 2014 had the following interests in share options of Petrogas Global Limited.
C - AssociatesPetrogas Group Limited owns Superstop Limited jointly as part of a consortium with Tedcastles Oil Products Limited and Pierse Contracting Limited. The consortium was awarded the public-private partnership contract to design, build, maintain and operate six motorway service areas by the National Roads Authority (NRA) and is treated as an associate in the group financial statements. Petrogas Group Limited has unsecured loan notes in Superstop (Holdings) Limited of €2.1m. For details of the group’s investment in associated undertakings see Note 16. Other debtors include an amount of €600,494 (2013: €680,310, 2012: €961,978) relating to interest receivable on these loan notes.
Included in cost of sales is an amount of €2.9m (2013: €2.8m, 2012: €2.6m) paid to Superstop Limited, a wholly owned subsidiary of Superstop (Holdings) Limited, in respect of the revenue share due by the operator for the Motorway Service Areas. At 31 December 2014 there was a balance of €194,814 (2013: €127,237, 2012: €63,263) due to Superstop Limited in relation to outstanding revenue share.
Included in “other debtors” is an amount of €118,268 (2013: €118,268, 2012: €512,465) advanced to Superstop Limited as per the terms of the operating and maintenance agreement.
Selling and distribution costs include a credit of €88,751 (2013: €946,267, 2012: €nil) receivable from Superstop Limited for maintenance work carried out by the group at the motorway service areas. Trade debtors include a receivable of €216,187 (2013: €nil, 2012: €nil) in relation to these works.
D - Other related parties
GroupThe group conducted transactions and held balances with certain related parties during the year. Details of these related parties are disclosed below.
Petrogas Global Limited
Number of share options
2014
Eugene Moore 1,000,000
Michael O’Loughlin 1,000,000
Paul Lynch 1,000,000
3,000,000
Notes to the Consolidated Financial Statements (Continued)
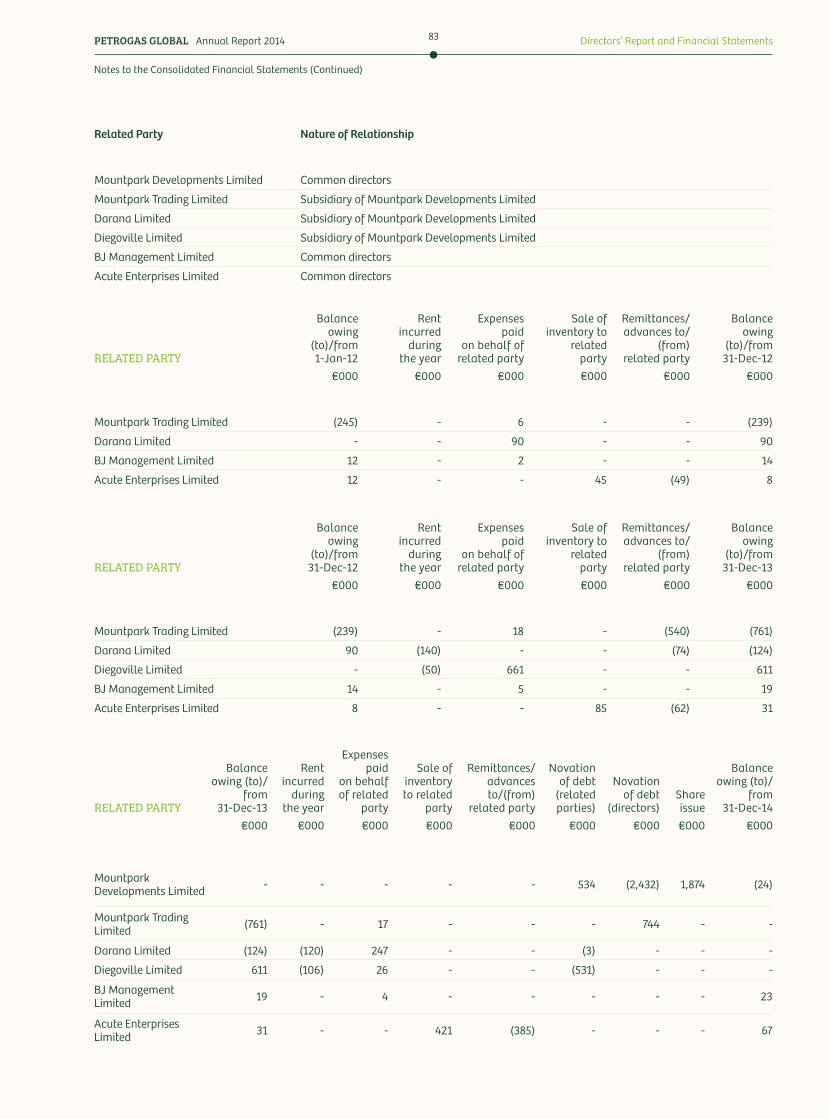
PETROGAS GLOBAL Annual Report 2014 Directors’ Report and Financial Statements83
Related Party Nature of Relationship
Mountpark Developments Limited Common directors
Mountpark Trading Limited Subsidiary of Mountpark Developments Limited
Darana Limited Subsidiary of Mountpark Developments Limited
Diegoville Limited Subsidiary of Mountpark Developments Limited
BJ Management Limited Common directors
Acute Enterprises Limited Common directors
RELATED PARTY
Balance owing
(to)/from 31-Dec-12
Rent incurred
duringthe year
Expenses paid
on behalf of related party
Sale of inventory to
related party
Remittances/ advances to/
(from) related party
Balance owing
(to)/from 31-Dec-13
€000 €000 €000 €000 €000 €000
Mountpark Trading Limited (239) - 18 - (540) (761)
Darana Limited 90 (140) - - (74) (124)
Diegoville Limited - (50) 661 - - 611
BJ Management Limited 14 - 5 - - 19
Acute Enterprises Limited 8 - - 85 (62) 31
RELATED PARTY
Balance owing (to)/
from 31-Dec-13
Rent incurred
duringthe year
Expenses paid
on behalf of related
party
Sale of inventory to related
party
Remittances/ advances to/(from)
related party
Novation of debt
(related parties)
Novation of debt
(directors)Share issue
Balance owing (to)/
from 31-Dec-14
€000 €000 €000 €000 €000 €000 €000 €000 €000
Mountpark Developments Limited - - - - - 534 (2,432) 1,874 (24)
Mountpark Trading Limited (761) - 17 - - - 744 - -
Darana Limited (124) (120) 247 - - (3) - - -
Diegoville Limited 611 (106) 26 - - (531) - - -
BJ Management Limited 19 - 4 - - - - - 23
Acute Enterprises Limited 31 - - 421 (385) - - - 67
RELATED PARTY
Balance owing
(to)/from 1-Jan-12
Rent incurred
duringthe year
Expenses paid
on behalf of related party
Sale of inventory to
related party
Remittances/ advances to/
(from) related party
Balance owing
(to)/from 31-Dec-12
€000 €000 €000 €000 €000 €000
Mountpark Trading Limited (245) - 6 - - (239)
Darana Limited - - 90 - - 90
BJ Management Limited 12 - 2 - - 14
Acute Enterprises Limited 12 - - 45 (49) 8
Notes to the Consolidated Financial Statements (Continued)
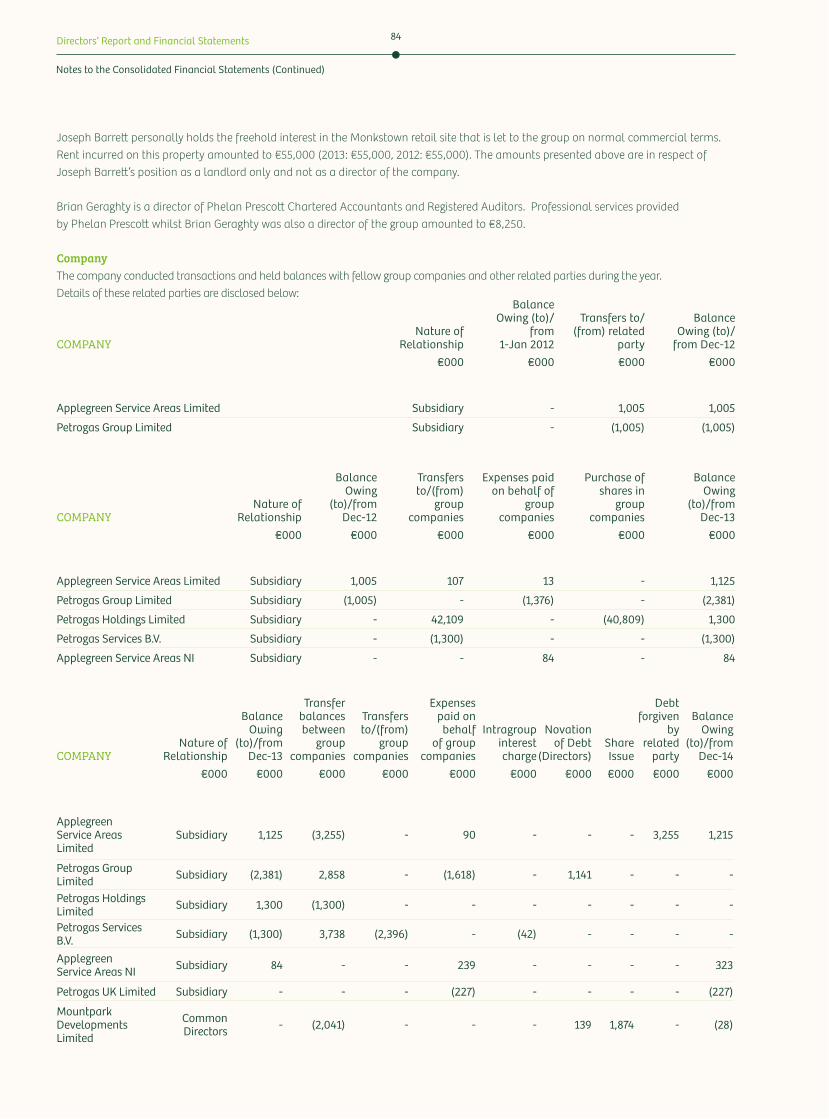
Directors’ Report and Financial Statements 84
Joseph Barre* personally holds the freehold interest in the Monkstown retail site that is let to the group on normal commercial terms. Rent incurred on this property amounted to €55,000 (2013: €55,000, 2012: €55,000). The amounts presented above are in respect of Joseph Barre*’s position as a landlord only and not as a director of the company.
Brian Geraghty is a director of Phelan Presco* Chartered Accountants and Registered Auditors. Professional services provided by Phelan Presco* whilst Brian Geraghty was also a director of the group amounted to €8,250.
Company The company conducted transactions and held balances with fellow group companies and other related parties during the year. Details of these related parties are disclosed below:
COMPANYNature of
Relationship
Balance Owing (to)/
from 1-Jan 2012
Transfers to/(from) related
party
Balance Owing (to)/
from Dec-12€000 €000 €000 €000
Applegreen Service Areas Limited Subsidiary - 1,005 1,005
Petrogas Group Limited Subsidiary - (1,005) (1,005)
COMPANYNature of
Relationship
BalanceOwing
(to)/fromDec-12
Transfersto/(from)
groupcompanies
Expenses paidon behalf of
groupcompanies
Purchase ofshares in
groupcompanies
BalanceOwing
(to)/fromDec-13
€000 €000 €000 €000 €000 €000
Applegreen Service Areas Limited Subsidiary 1,005 107 13 - 1,125
Petrogas Group Limited Subsidiary (1,005) - (1,376) - (2,381)
Petrogas Holdings Limited Subsidiary - 42,109 - (40,809) 1,300
Petrogas Services B.V. Subsidiary - (1,300) - - (1,300)
Applegreen Service Areas NI Subsidiary - - 84 - 84
COMPANYNature of
Relationship
BalanceOwing
(to)/from Dec-13
Transferbalancesbetween
groupcompanies
Transfersto/(from)
groupcompanies
Expenses paid on
behalfof group
companies
Intragroupinterestcharge
Novationof Debt
(Directors)ShareIssue
Debtforgiven
byrelated
party
BalanceOwing
(to)/fromDec-14
€000 €000 €000 €000 €000 €000 €000 €000 €000 €000
Applegreen Service Areas Limited
Subsidiary 1,125 (3,255) - 90 - - - 3,255 1,215
Petrogas Group Limited Subsidiary (2,381) 2,858 - (1,618) - 1,141 - - -
Petrogas Holdings Limited Subsidiary 1,300 (1,300) - - - - - - -
Petrogas Services B.V. Subsidiary (1,300) 3,738 (2,396) - (42) - - - -
Applegreen Service Areas NI Subsidiary 84 - - 239 - - - - 323
Petrogas UK Limited Subsidiary - - - (227) - - - - (227)
Mountpark Developments Limited
CommonDirectors - (2,041) - - - 139 1,874 - (28)
Notes to the Consolidated Financial Statements (Continued)
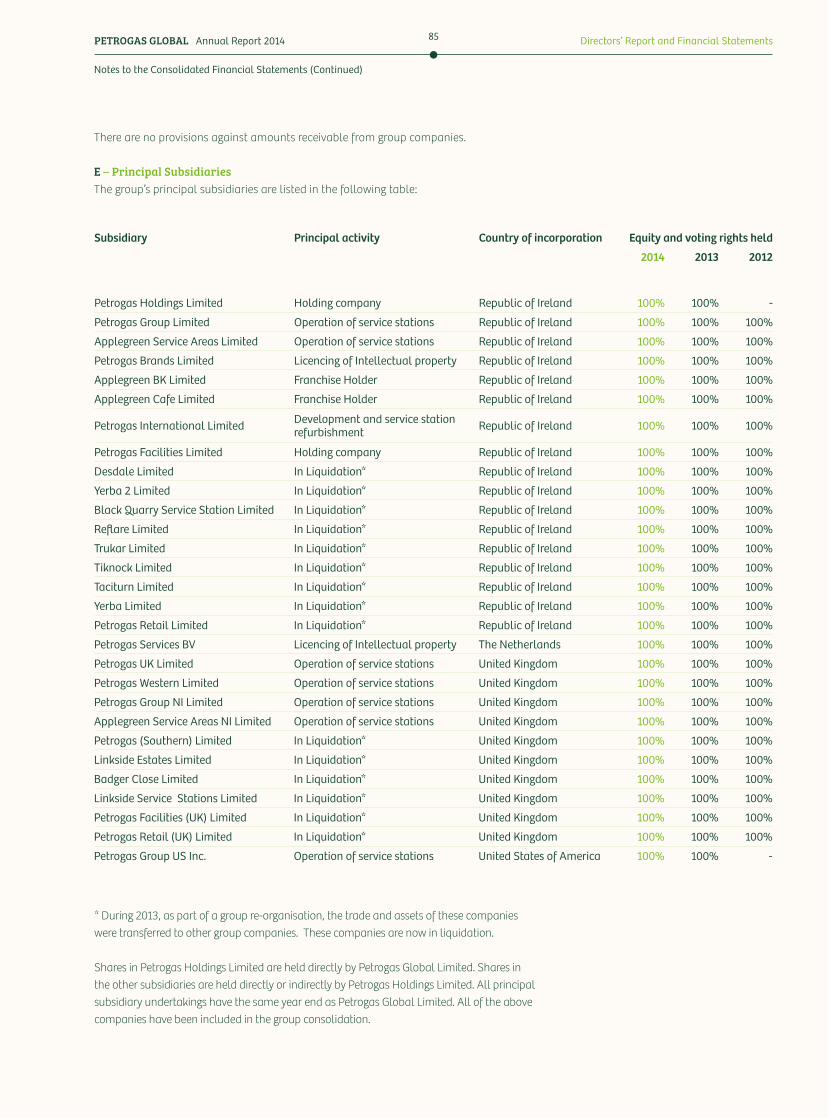
PETROGAS GLOBAL Annual Report 2014 Directors’ Report and Financial Statements85
* During 2013, as part of a group re-organisation, the trade and assets of these companies were transferred to other group companies. These companies are now in liquidation.
Shares in Petrogas Holdings Limited are held directly by Petrogas Global Limited. Shares in the other subsidiaries are held directly or indirectly by Petrogas Holdings Limited. All principal subsidiary undertakings have the same year end as Petrogas Global Limited. All of the above companies have been included in the group consolidation.
Subsidiary Principal activity Country of incorporation Equity and voting rights held
2014 2013 2012
Petrogas Holdings Limited Holding company Republic of Ireland 100% 100% -
Petrogas Group Limited Operation of service stations Republic of Ireland 100% 100% 100%
Applegreen Service Areas Limited Operation of service stations Republic of Ireland 100% 100% 100%
Petrogas Brands Limited Licencing of Intellectual property Republic of Ireland 100% 100% 100%
Applegreen BK Limited Franchise Holder Republic of Ireland 100% 100% 100%
Applegreen Cafe Limited Franchise Holder Republic of Ireland 100% 100% 100%
Petrogas International Limited Development and service station refurbishment Republic of Ireland 100% 100% 100%
Petrogas Facilities Limited Holding company Republic of Ireland 100% 100% 100%
Desdale Limited In Liquidation* Republic of Ireland 100% 100% 100%
Yerba 2 Limited In Liquidation* Republic of Ireland 100% 100% 100%
Black Quarry Service Station Limited In Liquidation* Republic of Ireland 100% 100% 100%
Reflare Limited In Liquidation* Republic of Ireland 100% 100% 100%
Trukar Limited In Liquidation* Republic of Ireland 100% 100% 100%
Tiknock Limited In Liquidation* Republic of Ireland 100% 100% 100%
Taciturn Limited In Liquidation* Republic of Ireland 100% 100% 100%
Yerba Limited In Liquidation* Republic of Ireland 100% 100% 100%
Petrogas Retail Limited In Liquidation* Republic of Ireland 100% 100% 100%
Petrogas Services BV Licencing of Intellectual property The Netherlands 100% 100% 100%
Petrogas UK Limited Operation of service stations United Kingdom 100% 100% 100%
Petrogas Western Limited Operation of service stations United Kingdom 100% 100% 100%
Petrogas Group NI Limited Operation of service stations United Kingdom 100% 100% 100%
Applegreen Service Areas NI Limited Operation of service stations United Kingdom 100% 100% 100%
Petrogas (Southern) Limited In Liquidation* United Kingdom 100% 100% 100%
Linkside Estates Limited In Liquidation* United Kingdom 100% 100% 100%
Badger Close Limited In Liquidation* United Kingdom 100% 100% 100%
Linkside Service Stations Limited In Liquidation* United Kingdom 100% 100% 100%
Petrogas Facilities (UK) Limited In Liquidation* United Kingdom 100% 100% 100%
Petrogas Retail (UK) Limited In Liquidation* United Kingdom 100% 100% 100%
Petrogas Group US Inc. Operation of service stations United States of America 100% 100% -
There are no provisions against amounts receivable from group companies.
E – Principal SubsidiariesThe group’s principal subsidiaries are listed in the following table:
Notes to the Consolidated Financial Statements (Continued)
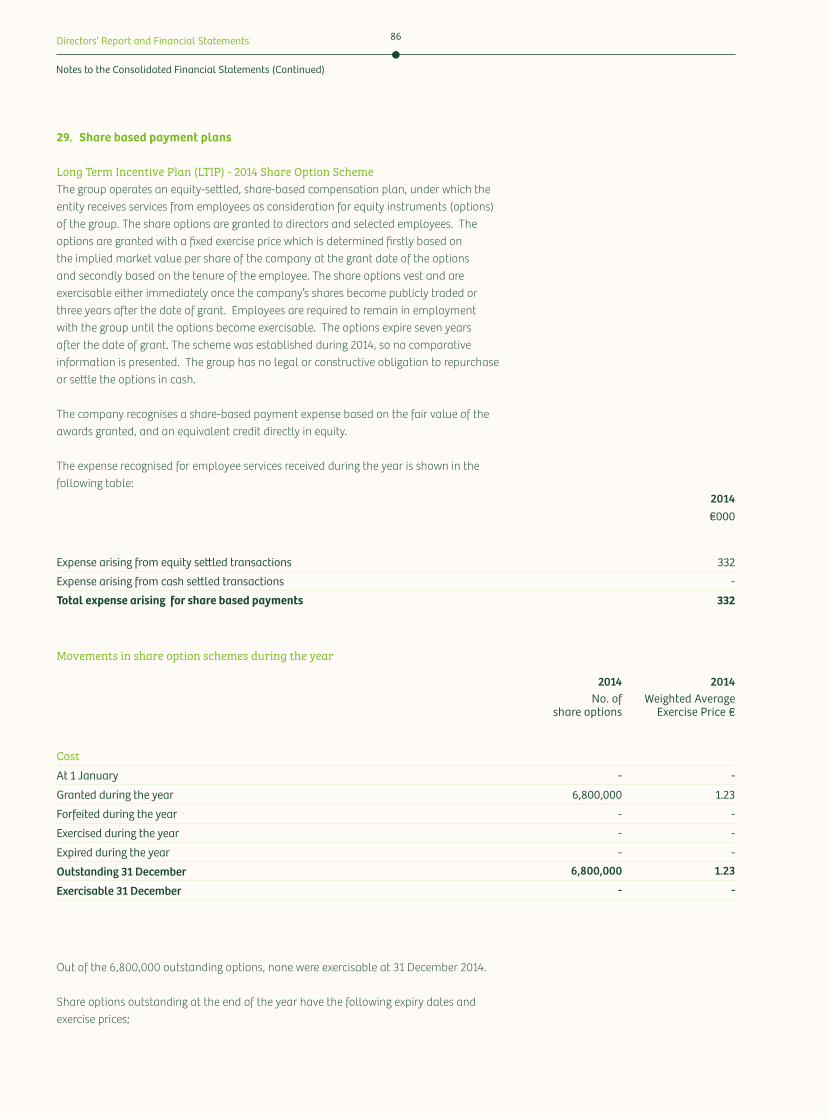
Directors’ Report and Financial Statements 86
29. Share based payment plans
Long Term Incentive Plan (LTIP) - 2014 Share Option Scheme The group operates an equity-se*led, share-based compensation plan, under which the entity receives services from employees as consideration for equity instruments (options) of the group. The share options are granted to directors and selected employees. The options are granted with a fixed exercise price which is determined firstly based on the implied market value per share of the company at the grant date of the options and secondly based on the tenure of the employee. The share options vest and are exercisable either immediately once the company’s shares become publicly traded or three years after the date of grant. Employees are required to remain in employment with the group until the options become exercisable. The options expire seven years after the date of grant. The scheme was established during 2014, so no comparative information is presented. The group has no legal or constructive obligation to repurchase or se*le the options in cash.
The company recognises a share-based payment expense based on the fair value of the awards granted, and an equivalent credit directly in equity.
The expense recognised for employee services received during the year is shown in the following table:
Out of the 6,800,000 outstanding options, none were exercisable at 31 December 2014.
Share options outstanding at the end of the year have the following expiry dates and exercise prices;
Movements in share option schemes during the year
2014€000
Expense arising from equity se&led transactions 332
Expense arising from cash se&led transactions -
Total expense arising for share based payments 332
2014 2014No. of
share optionsWeighted Average
Exercise Price €
CostAt 1 January - -
Granted during the year 6,800,000 1.23
Forfeited during the year - -
Exercised during the year - -
Expired during the year - -
Outstanding 31 December 6,800,000 1.23
Exercisable 31 December - -
Notes to the Consolidated Financial Statements (Continued)
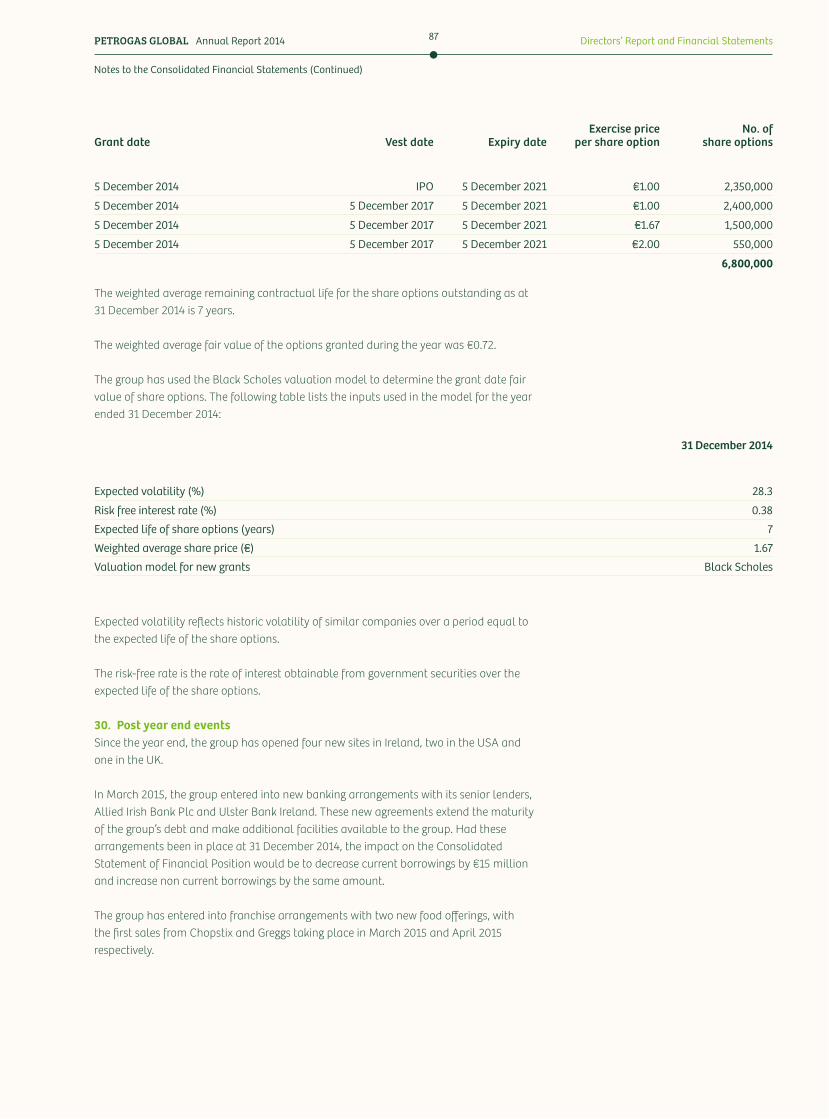
PETROGAS GLOBAL Annual Report 2014 Directors’ Report and Financial Statements87
The weighted average remaining contractual life for the share options outstanding as at 31 December 2014 is 7 years.
The weighted average fair value of the options granted during the year was €0.72.
The group has used the Black Scholes valuation model to determine the grant date fair value of share options. The following table lists the inputs used in the model for the year ended 31 December 2014:
Expected volatility reflects historic volatility of similar companies over a period equal to the expected life of the share options.
The risk-free rate is the rate of interest obtainable from government securities over the expected life of the share options.
30. Post year end eventsSince the year end, the group has opened four new sites in Ireland, two in the USA and one in the UK.
In March 2015, the group entered into new banking arrangements with its senior lenders, Allied Irish Bank Plc and Ulster Bank Ireland. These new agreements extend the maturity of the group’s debt and make additional facilities available to the group. Had these arrangements been in place at 31 December 2014, the impact on the Consolidated Statement of Financial Position would be to decrease current borrowings by €15 million and increase non current borrowings by the same amount.
The group has entered into franchise arrangements with two new food offerings, with the first sales from Chopstix and Greggs taking place in March 2015 and April 2015 respectively.
Grant date Vest date Expiry dateExercise price
per share optionNo. of
share options
5 December 2014 IPO 5 December 2021 €1.00 2,350,000
5 December 2014 5 December 2017 5 December 2021 €1.00 2,400,000
5 December 2014 5 December 2017 5 December 2021 €1.67 1,500,000
5 December 2014 5 December 2017 5 December 2021 €2.00 550,000
6,800,000
31 December 2014
Expected volatility (%) 28.3
Risk free interest rate (%) 0.38
Expected life of share options (years) 7
Weighted average share price (€) 1.67
Valuation model for new grants Black Scholes
Notes to the Consolidated Financial Statements (Continued)
Directors’ Report and Financial Statements 88
31. Ultimate controlling partyOn 18 December 2013 B&J Holdings Limited, a company registered in Malta, acquired the entire share capital of Petrogas Global Limited from Robert Etchingham and Joseph Barre*, and subsequently became the immediate controlling party of Petrogas Global Limited.
Robert Etchingham and Joseph Barre* wholly own the shares in B&J Holdings Limited and are consequently the ultimate controlling parties of Petrogas Global Limited.
Petrogas Global Limited, for the Year ended 31 December 2014 is the smallest group to consolidate these financial statements. B&J Holdings Limited is the largest group to consolidate these financial statements. Copies of the Petrogas Global Limited financial statements can be obtained from Block 17, Joyce Way, Parkwest, Dublin 12.
32. Approval of financial statementsThe Board of Directors approved and authorised for issue the financial statements in respect of the year ended 31 December 2014 on the 28th April 2015.
Notes to the Consolidated Financial Statements (Continued)

PETROGAS GLOBAL Annual Report 2014 Directors’ Report and Financial Statements89
Board of Directors
Robert Etchingham Joseph Barre* Michael O’Loughlin Eugene Moore Paul Lynch Martin Southgate Brian Geraghty
Secretary and Registered Office
Joseph Barre&Block 17 Joyce Way Parkwest Dublin 12 Ireland
Company Number:
491702
Auditors
PricewaterhouseCoopersChartered Accountants and Registered Auditors One Spencer Dock North Wall Quay Dublin 1Ireland
Solicitors
Eugene F CollinsTemple Chambers 3 Burlington Road Dublin 4Ireland
Bankers
Ulster bankGeorge’s Quay Dublin 2Ireland
AIBBank Centre BallsbridgeDublin 4Ireland
Directors and Other Information
Directors’ Report and Financial Statements 90
Concept, graphic design, layout and illustrations by: biográfica
Handcrafted wooden objectsand photography by:Rafael García
Printed in Madrid, Spain by:TF Artes Gráficas