Embed Size (px)
Citation preview

PETROLEUM SOURCE ROCK POTENTIAL OF SUBMARINE FAN AND DELTAIC CENOZOIC SEQUENCES OF WESTERN SABAH AND
SARAWAK, MALAYSIA
TOGUNWA SERIFAT OLAYINKA
DEPARTMENT OF GEOLOGY FACULTY OF SCIENCE
UNIVERSITY OF MALAYA KUALA LUMPUR
2015
PETROLEUM SOURCE ROCK POTENTIAL OF SUBMARINE FAN AND DELTAIC CENOZOIC SEQUENCES OF WESTERN SABAH AND
SARAWAK, MALAYSIA
TOGUNWA SERIFAT OLAYINKA
DISSERTATION SUBMITTED IN FULFILMENT OF THE
REQUIREMENTS FOR THE DEGREE OF
MASTER OF SCIENCE
DEPARTMENT OF GEOLOGY
FACULTY OF SCIENCE
UNIVERSITY OF MALAYA
KUALA LUMPUR
2015

UNIVERSITY OF MALAYA
ORIGINAL LITERARY WORK DECLARATION
Name of Candidate: Togunwa Serifat Olayinka (I.C/Passport No: A05191256)
Registration/Matric No: SGR120088
Name of Degree: Master of Science
Title of Project Paper/Research Report/Dissertation/Thesis:
PETROLEUM SOURCE ROCK POTENTIAL OF SUBMARINE FAN AND
DELTAIC CENOZOIC SEQUENCES OF WESTERN SABAH AND SARAWAK,
MALAYSIA
Field of Study: Petroleum Geology/ Geochemistry
I do solemnly and sincerely declare that:
(1) I am the sole author/writer of this Work;
(2) This Work is original;
(3) Any use of any work in which copyright exists was done by way of fair dealing
and for permitted purposes and any excerpt or extract from, or reference to or
reproduction of any copyright work has been disclosed expressly and
sufficiently and the title of the Work and its authorship have been acknowledged
in this Work;
(4) I do not have any actual knowledge nor do I ought reasonably to know that the
making of this work constitutes an infringement of any copyright work;
(5) I hereby assign all and every rights in the copyright to this Work to the
University of Malaya (“UM”), who henceforth shall be owner of the copyright in
this Work and that any reproduction or use in any form or by any means
whatsoever is prohibited without the written consent of UM having been first
had and obtained;
(6) I am fully aware that if in the course of making this Work I have infringed any
copyright whether intentionally or otherwise, I may be subject to legal action or
any other action as may be determined by UM.
Candidate’s Signature Date:
Subscribed and solemnly declared before,
Witness’s Signature Date:
Name: Dr.Wan Hasiah Abdullah
Designation: Professor and Supervisor
iii
ABSTRACT
The study area is in the northwest Borneo which extends between Sarawak and Sabah,
Malaysia. This research present geochemical and petrographical data from outcrop
samples distributed in the northern part of Sarawak and western part of Sabah, which are
considered amongst areas with many uncertainties in terms of hydrocarbon prospectivity.
A total number of sixty samples were analyzed to evaluate the organic matter content,
hydrocarbon generating potential, kerogen type, thermal maturity, source input and
depositional conditions. The samples were collected from fluvio-deltaic deposits (Meligan,
Belait, Miri, Lambir, Tukau formations) and deep water turbidites sediments (West
Crocker and Temburong formations) of Eocene to Miocene age. Most of the deltaic
sequences samples contain above average levels of organic matter content (TOC >1 wt. %)
and possess fair to good hydrocarbon generating potential. The samples from the
deepwater turbiditic sequences show poor to fair organic matter content and hydrocarbon
generating potential except for few samples from West Crocker formation with
significantly higher values of TOC. Based on the dominance of Type III and Type III/IV
kerogen within these formations that are supported by low Hydrogen Index (HI) values in
the range of 20-150 mg/g HC, as well as low atomic hydrogen to carbon ratios (H/C <1),
and pyrolysis-gas chromatography (Py-GC) fingerprints displaying dominance of aromatic
compounds over n-alkane/alkene doublets, all of which suggest ability to generate gas
rather than oil. However, presence of oil prone Type II/III kerogen is observed in the
slump deposits within the West Crocker Formation. The thermal maturity assessment
based on pyrolysis Tmax and vitrinite reflectance (VR) indicate an immature to very early
mature stage for hydrocarbon generation amongst the Belait, Lambir, Miri and Tukau
formations. On the other hand, the West Crocker, Temburong, and Meligan formations are
generally mature to late mature corresponding to peak oil and gas generation stages.
Distribution of n-alkanes and isoprenoids indicate land derived organic matter source input

iv
that were preserved under alternating oxidizing and reducing conditions for all of the
studied sequences. This is further supported by palynofacies assemblages (abundance of
woody fragments), low total sulphur (TS) content, and based on the source and redox
sensitive trace elements such as V, Ni, Cr, Co, Sc concentrations and their ratios.

v
ABSTRAK
Kawasan kajian adalah terletak di BaratLaut pulau Borneo yang bersempadanan antara
Sarawak dan Sabah, Malaysia. Kajian geokimia dan data daripada sample batuan
singkapan, taburan petrografi di kawasan bahagian Utara Sarawak dan Barat Sabah
mempunyai banyak ketidakpastian dari segi prospektiviti hidrokarbon. Sebanyak 60
sample dianalisa untuk menilai kandungan bahan organik, potensi penjanaan hidrokarbon,
jenis kerogen, kematangan terma, sumber bahan organik, dan keadaan semasa pengenapan.
Pengutipan sampel dilakukan daripada enapan fluvial-delta (Meligan, Belait, Miri, Lambir,
Tukau formation) dan sedimen turbidit laut dalam (West Crocker and Temburong
Formation) yang dalam lingkungan umur Eosene ke Miosene. Kebanyakkan sampel dari
jujukan delta adalah diatas purata kandungan bahan organik (TOC> 1 wt.%) dan
mempunyai potensi penjanaan hidrokarbon dari sederhana ke bagus. Sampel dari jujukan
turbidit laut dalam menunjukkan potensi kurang ke sederhana kandungan bahan organik
serta penjanaan hidrokarbon kecuali beberapa sampel dari Formasi Crocker Barat. Jenis
kerogen adalah ditakrifkan dalam jenis III dan III/IV, yang mana menyokong nilai HI yang
rendah (dalam lingkungan 20-150 mg / g HC), nibah H/C yang rendah (H< 1), kandungan
aromatic yang dominan berbanding kembaran n-alkenes/alkanes pada data PyGC
semuanya menunjukkan keupayaan menjana gas berbanding minyak.
Walaubagaimanapun, kewujudan jenis II/III di dalam Formasi Crocker Barat menunjukan
potensi penjanaan minyak dari sedimen tersebut. Penilaian kematangan terma daripada
pirolisis Tmax dan pantulan vitrinit (VR) menunjukaan sampel berada pada tahap tidak
matang ke awal matang untuk penjanaan hidrokarbon pada Formasi Belait, Lambir, Miri
and Tukau. Selain itu, Formasi Crocker Barat, Temburong, dan Meligan secara
keseluruhannya adalah matang ke lewat matang yang sejajar dengan kemuncak penjanaan
minyak dan gas. Taburan n-alkanes dan isoprenoid menunjukan keadaan sedimen semasa

vi
kemasukkan bahan organic adalah pertengahan antara oksid-tidak oksid bagi kesemua
jujukan yang dikaji. Penemuan ini juga turut disokong oleh data palynologi yang
mempunyai kandudugan bahan kayuan yang tinggi, kandungan sulphur yang rendah, serta
kandungan punca dan unsur surih redox yang rendah.

vii
ACKNOWLEDGEMENTS
The thesis compiled here is the result of immense support provided by individuals whose
inspiration, ideas, time, funding, and love were instrumental in its completion.
I want to thank my supervisor Prof. Wan Hasiah for tremendous guidance throughout my
research process and writing. I am also grateful to Prof. Felix Tongkul and Dr. Meor
Hakif for helping out during fieldwork. Thank you for sharing your knowledge with me. A
deep sense of gratitude to my committee members, Dr. Ralph Kugler, Dr. Joe Lambiase
and Dr. Aqeel Ashraf for their constructive comments and guidance. My sincere thanks
also go to Dr. Mohammed Hakimi for his help and guidance during my research.
I am grateful to University of Malaya for providing facilities to complete this research and
IPPP for providing research grant No. PG043-2013A. Many thanks to Mr. Khairul Azlan
for his technical support of SRA operation and maintenance, and to Mr. Yousif Makeen
and Mr. Baleid Hatem for their help in sample preparation and analysis. I want to
acknowledge the entire faculty and staffs of the Department of Geology, for technical and
administrative support.
I am especially thankful for my best friend Dr. Olumide Ayodele, for intellectual and
moral support, encouragement and inspiration. Thank you for keeping life normal and
reminding me of the important things in life. A special thank you to Susan, Salvation,
Shirin, Samah and Taofeekat for all their contributions to the success of this research. I
express my deepest gratitude to all my family members. Thank you for your love, patience,
support and for always believing in me. My most special thanks to Engr. Kayode Adebisi
for supporting me this far. With a family like you, every goal is within reach, and no dream
is too big. I thank God for His blessings to make all these happen.

viii
TABLE OF CONTENTS
Page no.
Abstract…………………………………………………………………………………….iii
Abstrak ……………………………………………………………………………………v
Acknowledgements………………………………………………………………………..vi
List of Figures……………………………………………………………………………...xi
List of Tables……………………………………………………………………………..xiii
List of Plates………………………………………………………………………………xiv
List of Appendices…………………………………………………………………………xv
CHAPTER 1: INTRODUCTION ...................................................................................... 1
1.1 Background ............................................................................................................. 1
1.2 Problem Statement .................................................................................................. 2
1.3 Objectives ................................................................................................................ 3
1.4 Study Area ............................................................................................................... 3
CHAPTER 2 : GEOLOGICAL FRAMEWORK ............................................................. 7
2.1 Regional Geological Setting ................................................................................... 7
2.2.1 Tectonic Evolution .............................................................................................. 9
2.2.1.1 Paleocene to Eocene ........................................................................................ 9
2.2.1.2 Oligocene to Early Miocene .......................................................................... 11
2.2.1.3 Early Miocene to Middle Miocene ................................................................ 12
2.2.1.4 Late Miocene to Pliocene ............................................................................... 13
2.2.2 Lithostratrigraphy .............................................................................................. 13
2.2.2.1 West Crocker Formation ................................................................................ 14
2.2.2.2 Temburong Formation .................................................................................. 15
2.2.2.3 Meligan Formation ........................................................................................ 15
2.2.2.4 Belait Formation .......................................................................................... 16
2.2.3 Petroleum System Overview of Western Sabah………………………………17
2.2.3.1 Source Rocks ................................................................................................. 17
2.2.3.2 Reservoirs, Traps and Seals ........................................................................... 18
2.3 GENERAL GEOLOGY OF NORTHWEST SARAWAK .............................. 20
2.3.1 Tectonic Evolution ................................................................................................ 20
2.3.2 Lithostratigraphy .................................................................................................. 21
2.3.2.1 Lambir Formation .......................................................................................... 21
2.3.2.2 Miri Formation ............................................................................................... 21

ix
2.3.2.3 Tukau Formation ........................................................................................... 22
2.3.3 Petroleum System Overview ............................................................................. 22
2.3.3.1 Source Rocks ................................................................................................. 22
2.3.3.2 Reservoirs Traps and Seals ............................................................................ 23
CHAPTER 3: REVIEW OF SOURCE ROCK EVALUATION PRINCIPLE ........... 24
3.1 Petroleum Source Rock Evaluation ...................................................................... 24
3.1.1 Quantity of Organic Matter ............................................................................... 26
3.1.2 Genetic Potential ............................................................................................... 27
3.1.3 Quality of Organic Matter ................................................................................. 27
3.1.4 Thermal Maturation ........................................................................................... 29
3.2 Molecular Geochemistry ....................................................................................... 31
3.2.1 Source Input and Depositional Conditions Indicators ....................................... 31
3.2.2 Thermal Maturity Indicators.............................................................................. 34
3.3 Trace Elements application in paleoredox conditions .......................................... 35
CHAPTER 4: METHODOLOGY ................................................................................... 38
4.1 Introduction ........................................................................................................... 38
4.2 Fieldwork and Sampling ....................................................................................... 38
4.3 Petrological Analyses ............................................................................................ 42
4.3.1 Polished Block Preparation ............................................................................... 42
4.3.2 Vitrinite Reflectance Measurement ................................................................... 42
4.3.3 Maceral Analysis ............................................................................................... 42
4.3.4 Palynofacies Analysis ........................................................................................ 43
4.4 Geochemical Analyses .......................................................................................... 43
4.4.1 Source Rock Analysis ....................................................................................... 43
4.4.2 Bitumen Extraction ............................................................................................ 43
4.4.3 Liquid Column Chromatography ...................................................................... 44
4.4.4 Gas Column Chromatography-Mass Spectrometry .......................................... 44
4.4.5 Kerogen Isolation .............................................................................................. 45
4.4.6 Open Pyrolysis-Gas Chromatography (Py-GC) ................................................ 45
4.4.7 Elemental Analysis (TS, and CHN) .................................................................. 46
4.4.8 Inductively Plasma Mass Spectrometry (ICP-MS) ........................................... 46
CHAPTER 5: RESULTS .................................................................................................. 47
5.1 Introduction ........................................................................................................... 47
5.2 Lithofacies Description ......................................................................................... 47
5.2.1 Tukau Formation ............................................................................................... 47
5.2.2 Miri Formation .................................................................................................. 51
5.2.3 Lambir Formation .............................................................................................. 55
5.2.4 Belait Formation ................................................................................................ 60

x
5.2.5 Meligan Formation ............................................................................................ 63
5.2.6 Temburong Formation ....................................................................................... 63
5.2.7 West Crocker Formation ................................................................................... 68
5.2.8 Undifferentiated Formation ............................................................................... 71
5.3 Organic Petrographic Data .................................................................................... 72
5.3.1 Maceral Analysis ............................................................................................... 72
5.3.2 Palynofacies analysis ......................................................................................... 76
5.3.3 Vitrinite Reflectance .......................................................................................... 79
5.4 Organic Geochemistry .......................................................................................... 79
5.4.1 Extractable Organic Matter and Hydrocarbonn Yield....................................... 81
5.4.2 Total Organic Carbon ........................................................................................ 81
5.4.3 Pyrolysis ............................................................................................................ 85
5.4.3.1 Source Rock Analysis .................................................................................... 85
5.4.3.2 Py-GC ............................................................................................................ 86
5.4.4 Elemental Analytical Data ................................................................................. 93
5.4.5 Molecular Composition ..................................................................................... 93
5.4.5.1 n-alkanes and isoprenoids .............................................................................. 93
5.4.5.2 Phenanthrene and alkyl derivatives ............................................................... 96
5.5 Trace elements distributions ................................................................................. 96
CHAPTER 6: DISCUSSION .......................................................................................... 108
6.1 Introduction ......................................................................................................... 108
6.2 Source Rock Evaluation ...................................................................................... 108
6.2.1 Organic matter richness and hydrocarbon generative potential ...................... 108
6.2.2 Bulk kerogen Characteristics……………….. ................................................112
6.2.3 Thermal Maturity of Organic Matter ............................................................... 119
6.2.4 Prospect for Liquid Hydrocarbon Generation………………………………..123
6.3 Source of Organic Matter and Depositional Conditions ..................................... 126
6.3.1. Palynofacies Indicators .................................................................................... 126
6.3.2 Molecular Indicators for Source Input and Depositional Conditions .............. 127
6.3.3. Elemental Indicators ........................................................................................ 130
6.3.4 Trace Elements ................................................................................................ 133
CHAPTER 7: CONCLUSIONS ..................................................................................... 138
REFERENCES ................................................................................................................. 140
LIST OF PUBLICATIONS…………………………………………………………….160
APPENDICES…………………………………………………………………………..161

xi
LIST OF FIGURES
Page No
Figure 1.1. Satellite image shows the Borneo Island, and highlighted are the location of the
study area (in red rectangles). ................................................................................................ 5
Figure 1.2. Geological map of Borneo showing the distributions of the studied formations
(Hall, 2002) ............................................................................................................................ 6
Figure 2.1. (a) Schematic cross sections across the NW Borneo collisional margin during
the Late Cretaceous and Oligocene to Miocene…………………………………………..10
Figure 2.2. The amalgamated tectono-stratigraphic terranes of northwest Borneo (Tjia,
2012) .................................................................................................................................... 19
Figure 2.3. Simplified stratigraphy of the offshore and onshore sediments of western Sabah
and northern Sarawak (West Baram Delta) with principal unconformities………......19
Figure 4.1.Simplified geological map showing sampling location in areas within western
Sabah and northern Sarawak …………………………………………………….39
Figure 4.2. Flowchart of the methods adopted in this study………………………………46
Figure 5.1.Sedimentary Log of Tukau Formation…………………………….............49
Figure 5.2. Sedimentary Log of Miri Formation………………………………………53
Figure 5.3. Sedimentary Log of Lambir Formation……………………………………58
Figure 5.4. Summary Log of Belait Formation in Batu Luang showing wide range of
depositional environments ................................................................................................... 63
Figure 5.5 Sedimentary Log of Meligan Formation………………………………….64
Figure 5.6. Sedimentary log of Temburong Formation……………………………………66
Figure 5.7. Sedimentary log of West Crocker Formation in Locality (145) KK, popularly
known as the kingfisher outcrop…………………………………………………………..69
Figure 5.8. Map showing distribution of vitrinite reflectance in the western Sabah and
northern Sarawak studied formations……………………………………………………80
Figure 5.9. Concentrations of EOM fractions in the studied samples……………………82
Figure 5.10. Pyrograms of the studied formations showing quality of kerogen………..89
Figure 5.11. Representative m/z 85 fragmentogram showing the distribution of n-alkanes
and isoprenoids…………………………………………………………………………….99
Figure 5.12. m/z 178 +192 fragmentograms showing the distribution of phenanthenes (P)
and methyl-phenanthrenes (MP) in the studied formations……………...........................103
Figure 6.1. Plot of total organic carbon (TOC) versus hydrocarbon yield (S2) showing the
hydrocarbon generatie potential of the studied deltaic and submarine fan samples……..110
Figure 6.2. TOC versus hydrocarbon yield plot showing source rock richness and
hydrocarbon potential……………………………………………………………………111
xii
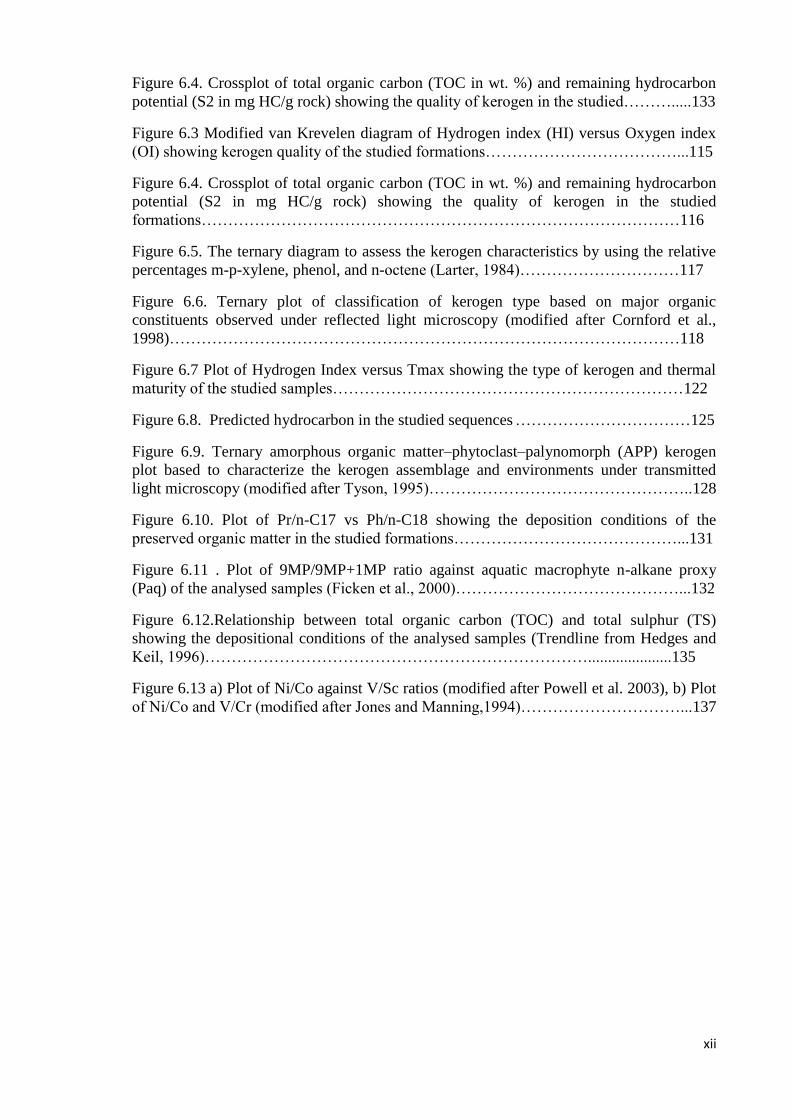
Figure 6.4. Crossplot of total organic carbon (TOC in wt. %) and remaining hydrocarbon
potential (S2 in mg HC/g rock) showing the quality of kerogen in the studied……….....133
Figure 6.3 Modified van Krevelen diagram of Hydrogen index (HI) versus Oxygen index
(OI) showing kerogen quality of the studied formations………………………………...115
Figure 6.4. Crossplot of total organic carbon (TOC in wt. %) and remaining hydrocarbon
potential (S2 in mg HC/g rock) showing the quality of kerogen in the studied
formations………………………………………………………………………………116
Figure 6.5. The ternary diagram to assess the kerogen characteristics by using the relative
percentages m-p-xylene, phenol, and n-octene (Larter, 1984)…………………………117
Figure 6.6. Ternary plot of classification of kerogen type based on major organic
constituents observed under reflected light microscopy (modified after Cornford et al.,
1998)……………………………………………………………………………………118
Figure 6.7 Plot of Hydrogen Index versus Tmax showing the type of kerogen and thermal
maturity of the studied samples…………………………………………………………122
Figure 6.8. Predicted hydrocarbon in the studied sequences ……………………………125
Figure 6.9. Ternary amorphous organic matter–phytoclast–palynomorph (APP) kerogen
plot based to characterize the kerogen assemblage and environments under transmitted
light microscopy (modified after Tyson, 1995)…………………………………………..128
Figure 6.10. Plot of Pr/n-C17 vs Ph/n-C18 showing the deposition conditions of the
preserved organic matter in the studied formations……………………………………...131
Figure 6.11 . Plot of 9MP/9MP+1MP ratio against aquatic macrophyte n-alkane proxy
(Paq) of the analysed samples (Ficken et al., 2000)……………………………………...132
Figure 6.12.Relationship between total organic carbon (TOC) and total sulphur (TS)
showing the depositional conditions of the analysed samples (Trendline from Hedges and
Keil, 1996)……………………………………………………………….....................135
Figure 6.13 a) Plot of Ni/Co against V/Sc ratios (modified after Powell et al. 2003), b) Plot
of Ni/Co and V/Cr (modified after Jones and Manning,1994)…………………………...137

xiii
LIST OF TABLES
Page No
Table 3.1. Generative potential, kerogen type, expelled products and thermal maturity of
source rock (Peters and Cassa, 1994)…………………………………………………….32
Table 4.1 Lithological description and location of the studied formations samples. ……..40
Table 5.1. Organic petrology results including palynofacies (under transmitted light (%),
kerogen composition (under reflected light (%) and thermal maturity indicators (vitrinite
reflectance measurements (%Ro)………………………………………………….............73
Table 5.2. Extractable organic matter and hydrocarbon yield from the studied samples…83
Table 5.3 Bulk geochemical characteristics (TOC content , pyrolysis) of the studied
formations………………………………………………………………………………….87
Table 5.4. TOC and elemental analysis data of the studied formations…………………..94
Table 5.5. Source and maturity parameters derived from n-alkanes, isoprenoids and
phenanthrenes……………………………………………………………………………...97
Table 5.6. Trace elements concentrations and ratios in the studied samples. ……………106

xiv
LIST OF PLATES
Page No
Plate 5.1. Field observation in studied Tukau Formation outcrop………………………..50
Plate 5.2 : Field observation in studied Miri Formation outcrop…………………………54
Plate 5.3: Field observation in Lambir Formations……………………………………….59
Plate 5.4. Field Observation of Belait Formation in Batu Luang part of Klias Peninsula...62
Plate 5.5. Field Observation of Meligan Formation in Sipitang area ……………………..65
Plates 5.6. Field observation in Temburong Formation…………………………………...67
Plate 5.7. Field observation in West Crocker Formation…………………………………70
Plate 5.8. Field Observations of the undifferentiated Formations………………………...71
Plate 5.9. Photomicrograph of common maceral constituents of the studied northwest
Sarawak formations………………………………………………………………………74
Plate 5.10. Photomicrograph of common maceral constituents of the studied in western
Sabah………………………………………………………………………………………75
Plate 5.11. Common palynofacies types in the studied formations………………………..78
xv
LIST OF APPENDICES
Page No
Appendix A: Vitrinite Reflectance Data and Histograms……………………………161
Appendix B: Py-GC Pyrogram Quantitative Data………………………………………173

1
CHAPTER 1
INTRODUCTION
1.1 Background
The Cenozoic sedimentary basins of the NW Borneo margin covers an area of over
260,000 km2 encompassing both onshore and offshore Sarawak, Brunei and Sabah
(Morrison and Lee, 2003). Hydrocarbon exploration started onshore in the late 1800’s with
the first discovery (the Miri Field) being made in 1910 (Rijks 1981, Tan et al.1999;
Morrison and Lee, 2003). Subsequent discoveries transformed the margin into a prolific
hydrocarbon region with the most significant provinces being the Central Luconia and
Baram Delta. The recent discovery of Adong Kecil West in Sarawak reported to produce
over 440 barrels of crude oil per day and 11.5 million standard cubic feet of gas per day
(PETRONAS, 2013). Combined discovered reserves for the margin now exceed 20 billion
barrels of oil equivalent (Sandal, 1996; PETRONAS, 1999, Morrison and Lee, 2003).
To date, the NW Borneo petroleum system has never been truly defined despite
prolific hydrocarbon occurrence, often fraught by the inability to identify discrete source
intervals. The economic importance of the NW Borneo margin combined with academic
interest in the complex geology has resulted in a considerable body of research on the
region, much of which is excellently summarized by previous workers (e.g. Abdul Jalil and
Mohd Jamaal, 1992; Azlina Anuar and Abdul Jalil, 1997, 1999; Wan Hasiah, 1999;
Abdullah, 2003; Morrison and Lee, 2003; PETRONAS, 1999; Anuar and Hoesni, 2008;
Hakimi et.al, 2013) yet the source of the oils is still under debate. The scant geological and
geochemical evidence for the origin of oils suggests that terrigenous organic matter is the
most likely source (e.g. Azlina Anuar and Kinghorn, 1994; Madon and Abolins, 1999;
Algar, 2012). Although such disseminated land plant debris is conventionally considered to
2
be gas-prone, the search for the oil prone source rock is still inconclusive. Prelimnary study
on the deep water (submarine fan) sequence in western Sabah revealed the occurrence of a
substantial hydrogen-rich (oil prone) stringers of allochthonous terrestrial-derived organic
matter as reported by Algar (2012). However there has been no direct study on the
petroleum source rock potential of the onshore deepwater and deltaic sequences in western
Sabah and northern Sarawak to possibly indicate their contribution to the hydrocarbon
accumulations in NW Borneo. Therefore this study is aimed at evaluating the petroleum
source rock potential of West Crocker and Temburong (Submarine Fan), Meligan, Belait,
Lambir, Miri and Tukau (Deltaic) formations in Sabah and Sarawak which may likely
provide relevant information for better understanding of the petroleum system, especially
the roles these sedimentary units played in the generation and expulsion of hydrocarbon in
the NW Borneo basins.
Estimation of hydrocarbon source potential by characterization of the dispersed
organic matter or kerogen using geochemical and petrological techniques has become an
integral part of hydrocarbon exploration in frontier basins (Tissot and Welte, 1984; Hunt,
1996; Peters et al., 2005). This involves identifying the potential source rocks, measuring
the total amount of organic matter present, the type and quality of the organic matter and
the level of thermal maturity attained (Hunt, 1996; Peters et al., 2005). In addition, the
understanding of organic matter source input, preservation and depositional conditions
help to determine the evolution of organic matter and tectonic setting (Peters et al., 2005).
1.2 Problem Statement
Based on summary of the previous work, various geological and geochemical
studies have been done in the NW Borneo especially in the offshore area with little to no
investigation of potential source rocks in the onshore area. Few geochemical studies
carried out in the onshore area are limited to basic geochemical methods with little to no

3
information on hidden potentials of the studied sequences. Therefore, this research will
provide better understanding on the variation and quality of organic matter, source input
and depositional conditions as well as the thermal maturation for hydrocarbon generation
and expulsion by integrating geochemistry and petrology.
1.3 Objectives
The main objective of this study is to show the hydrocarbon potentiality of the
selected Cenozoic formations in parts of western Sabah and northern Sarawak that will be
performed by;
i. Evaluating the type and quantity of organic matter contents within the studied
formations.
ii. Assessing the source input and depositional conditions of the organic matter.
iii. Determine the level of maturity of the existing organic matters in the studied
formations and their potential for hydrocarbon generation.
1.4 Study Area
The study area is located in western Sabah and northernwest Sarawak (Figure 1.1)
and is bounded by latitude from N2.00 and longitude E116.30. The major outcrop locations
are in Klias Peninsula, Sipitang, Kota Kinabalu and South Miri areas. The distribution of
the studied formations is shown in Figure 1.2.
The Klias Peninsula is a prominent rectangular geomorphic feature (~1500 km2)
that juts abruptly from the NE-trending shoreline of Sabah between Brunei Bay and the
small Papar River delta (Cullen, 2010). This region developed as a Neogene foreland basin
and its modern coastline study can serve as an analogue for clastic depositional systems
ancient foreland basins. Belait Formation and Setap Shale are widely distributed in this
area.
4
The Sipitang area of western Sabah consists mainly of hilly to steep terrain trending
north-south with narrow valleys. A number of rivers such as Sungai Long Pa Sia, Sungai
Mai drain the area and flow into the Sungai Padas. The geology of Sipitang area as studied
by Wilson (1964) consist of the Crocker, Temburong and Melingan formations with
Quaternary alluvial deposits of riverine terraces and recent riverine alluvia occur in the
valleys. The geomorphology of the area consists of almost vertically dipping sandstones
and shales forming a dip slope and face slope in a step-like morphology (Paramanthan,
1998).
The landscape of Kota Kinabalu (KK) forms the foothill part of the Crocker Range.
A remarkable geologic feature of this area in western Sabah is the wide distribution of
turbidites of the Crocker Formation. These are interbedded sandstone and shale
sedimentary rocks deposited in a deepwater basin (submarine fan) during the latest Eocene
(37 Ma) through to the earliest Miocene (21 Ma) with thickness up to 1,000m (Crevello,
2006). The Crocker turbidites are also exposed on islands offshore KK, and extend
offshore western Sabah below the Miocene-Quaternary deltaic sediments (Tongkul, 1989).
The Lambir, Miri and Tukau Formation are well exposed in the South of Miri along
Miri-Bintulu and Miri-Bekenu roads. The three formations are interfingering
stratigraphically and belong to the Miocene West Baram delta system (Hutchison, 2005).
The West Baram Delta is characterized by the deposition of a northwestward prograding
delta since Middle Miocene times.

5
Figure 1.1. Satellite image shows the Borneo Island, and highlighted are the location of the study areas (in red rectangles).

6
Figure 1.2. Geological map of Borneo showing the distributions of the deltaic and deep
water sequences in the study areas (after Hall, 2002).

7
CHAPTER 2
GEOLOGICAL FRAMEWORK
2.1 Regional Geological Setting
The principal features of the geological evolution of NW Borneo are summarized in
Hinz et al. (1989), Hutchison (1996a, 1996b), Milsom et al. (1997), PETRONAS (1999),
Hutchison et al. (2000), Hall and Nichols(2002), Morley et al. (2003), Morley and Back
(2008), Hall et al. (2008), Hesse et al., 2009 . NW Borneo was built from the Mesozoic to
Holocene, and records a complex plate tectonic history involving oceanic and continental
crust (Figure 2.1). Convergence between a proto‐South China Sea plate and the Luconia
“block”, and NW Borneo led to the Cenozoic development of a heterogeneous collisional
margin: the NW Borneo collisional margin. During Oligocene–early Miocene times, the
South China Sea was opened by seafloor spreading. With the opening of the South China
Sea, the thinned continental crust of the Dangerous Grounds region was rifted away from
the southern margin of China (e.g.Hinz and Schlüter, 1985; Taylor and Hayes, 1983; Briais
et al., 1993). On the southeastern side of the Dangerous Grounds, Hinz and Schlüter (1985)
interpreted an older region of oceanic crust, the proto–South China Sea. During the
Paleogene, this proto–South China Sea closed, most likely due to a SE-directed subduction
beneath NW Borneo. Following complete subduction of the proto–South China Sea
oceanic crust, continental crust of the Dangerous Grounds region was partially subducted
beneath the Crocker Formation basin of NW Borneo in the latest early Miocene before its
buoyancy locked the system (James, 1984; Levell, 1987; Hazebroek and Tan, 1993;
Hutchison, 1996a, 1996b; Sandal, 1996; Hall, 1996; Milsom et al., 1997). Subsequently,
northern Borneo experienced significant compressional deformation, as documented
onshore in folded sedimentary units of late early Miocene to middle Miocene ages (e.g.,
Sandal, 1996; Morley et al., 2003; Back et al., 2001, 2005, 2008), as well as offshore in

8
folded and thrusted middle Miocene to present-day shelf and slope sequences (e.g., Levell,
1987; Hinz et al., 1989; Hazebroek and Tan, 1993; Morley et al., 2003; Ingram et al.,
2004). On the shallow NW Borneo shelf, late Neogene compression coincided with the
development of major synsedimentary normal faults and the up to 10-km-thick late
Neogene deltaic overburden (Hesse et al., 2009). This “thin-skinned” extensional
deformation was superimposed on deep-seated compressional structures and generated,
particularly in the southern part of the NW Borneo shelf, a multitude of complex tectonic
features that resulted in the reactivation of major thrusts as normal faults and the inversion
of synsedimentary normal faults (Morley et al., 2003). The complex interference of
extensional and compressional features ceased in the vicinity of the shelf break, beyond
which a purely compressional fold-and-thrust belt developed (Hesse et al., 2009).
The coastal and offshore regions of the NW Borneo collisional margin are divided
into two basins: the Sarawak and Sabah basins (Hall and Morley, 2004; Tjia, 2012) (Figure
2.2). The NW‐SE trending West Baram Line, thought to be a transform fault related to
the ancient subduction zone, divides the two basins (Agostinelli et al., 1990; King et al.,
2010) The West Baram Line is considered to have separated the deposition of
predominantly carbonate sediments in the Sarawak Basin and siliciclastic sediments in the
Sabah Basin (Madon et al., 1999). Uplift and deformation of the inboard areas of the NW
Borneo collisional margin continued to the latest Cenozoic and has significantly influenced
the depositional systems and structure of the two basins (Madon, 1999a; Morley et al.,
200).The West Baram Line presently divides active W‐WNW directed convergence in
the Sabah Basin from smaller amounts of S-SW directed convergence in the Sarawak
Basin (Figure 2.2), as demonstrated by recent Global Positioning System measurements
(Simons et al., 2007).

9
The Sarawak Basin is situated onshore and near coast regions from the West Baram
Line east of Miri, to the western extent of the Malaysian province Sarawak and offshore
for approximately 400 km (King et al., 2010). The Sabah Basin is located NE of the West
Baram Line to the most northern tip of Borneo, extending from onshore to approximately
200 km offshore, where it is bounded by the NW Borneo Trough (King et al., 2010).
2.2 General Geology of Western Sabah
2.2.1 Tectonic Evolution
In this study, the review on the general geology of western Sabah has been grouped
into Paleocene to Eocene, Oligocene to Early Miocene, Early Miocene to Middle Miocene,
and Late Miocene to Pliocene.
2.2.1.1 Paleocene to Eocene
The Paleogene regional tectonic setting of Sabah is very complex with
southeasterly subduction of the proto-South China Sea in NW Borneo (Hall 1996),
followed by a period of continued deposition of deep marine Rajang Group turbidites. The
Rajang Group is a widespread association of Late Cretaceous to Eocene deep water
mudstones and turbiditic sandstones which include the Sapulut, Trusmadi and East Crocker
formations. All are thought to have been deposited in the large NE-SW trending Crocker
Basin and all are highly deformed with tight isoclinal folds and thrusts (Hutchison, 1996a).

10
Figure 2.1. (a) Schematic cross sections across the NW Borneo collisional margin during
the Late Cretaceous and Oligocene to Miocene, illustrating the subduction of the proto‐South China Sea plate beneath the Crocker‐Rajang Accretionary Complex (King et al.,
2010). (b) A schematic map illustrating the plate configuration at the NW Borneo
collisional margin during the Eocene to Miocene (after King et al., 2010)
Figure 2.2. The amalgamated tectono-stratigraphic terranes of northwest Borneo (afterTjia,
2012).

11
The Palaeogene was therefore a period of continued deposition of deep marine
turbidites.The strongly deformed turbiditic Rajang Group is interpreted as a part of an
accretionary prism related to southeasterly subduction of the proto-South China Sea in the
NW Borneo.The Late Eocene tectonic deformation is characterized by folding, thrusting
and regional uplift related to the collision of the Luconia Continental Block against NW
Borneo (Sarawak Orogeny; Hutchison, 1996a). An unconformity within the succession of
Palaeogene turbidites between the Middle and Upper Eocene is inferred by Rangin et al.
(1990) on the evidence of reworking of nannofossils and Hutchison (1996a) also argues
that the West Crocker Formation includes detritus from uplifted and eroded Rajang Group
and East Crocker Formation rocks. Hutchison (1996a) refer to this uplift as the ‘Sarawak
orogeny’ and suggest it was probably driven by collision along the northern Borneo margin
at this time. The unconformity is generally difficult to recognize in outcrop in Sabah
because of similarities in lithologies either side of it and the strong Neogene deformation.
2.2.1.2 Oligocene to Early Miocene
Following the Late Eocene deformation, uplift and erosion of the Rajang Fold-
Thrust Belt provided a source of sediment for the Borneo trough to the NW and also the
SE where material was deposited in deep water setting as the West Crocker and
Temburong Formations in western Sabah. The fold-thrust belt of the West Crocker
Formation, which is well exposed in western Sabah, represents the accretionary complex
related to continued southeasterly subduction of the proto-South China Sea in the NW
Borneo (Balaguru and Nichols, 2004). Southward directed movement of the NW Sabah
continental plate linked to the opening of the South China Sea resulted in the initial uplift
of the Temburong and West Crocker formations. Barckhausen & Roeser, (2004)
reinterpreted paleomagnetic data and concluded that the sea floor spreading in the South
China Sea, which began at 32 Ma, had already ceased by 20 Ma. This indicates that
12
subduction ceased in the Early Miocene as opposed to the previously interpreted Middle
Miocene (Brias et al. 1993) when the Dangerous Grounds micro-continental fragments
collided with NW Borneo (Hutchison et al., 2000). This predates the timing of the Sabah
Orogeny including the earlier 20 Ma timing proposed by Balaguru & Hall (2003), and it
coincides with the Base Miocene Unconformity (BMU) in Sabah. The Early Miocene (22-
20 Ma) deformation is a major tectonic event involving the formation of the Sabah
mélanges significant uplift and erosion; patches of Burdigalian limestone formed during
this uplift. This period was followed by a change in depositional environment from deep-
water clastics to a shallow-water deltaic setting called the Meligan Delta (Stage III). To the
south, shallow marine sediments of the Meligan Formation and shale- dominant Setap
Formation were deposited. However to the north, deep marine clastic deposition continued
(Kudat Formation). Prior to impending intensed deformation, widespread carbonates were
deposited manifesting initial uplift of Crocker Fold-Thust Belt (Leong,1999). All of
offshore Sabah was under slope- to deep-marine conditions during Early Miocene to early
Middle Miocene time.
2.2.1.3 Early Miocene to Middle Miocene
Arc-continent collision in the northern Borneo between the Cagayan Arc and
Palawan Continental Block (Rangin, 1991) created another Middle Miocene Unconformity
(MMU, 15.5 Ma) which marks the Deep Regional Unconformity (DRU) in onshore and
offshore Sabah. This significant Middle Miocene unconformity separates the Meligan
Delta from the overlying middle to late Miocene Champion Delta (Stage IV-ABC). This
stage generally is characterized by coastal aggradation and progradation sequences
comprising the onshore outcrop equivalents of the Belait Formation of NW Sabah. The
Stage IVA is a widespread regressive lower coastal plain to marginal marine (deltaic to
shoreface) succession, whereas the Stage IVB is a major transgressive sequence of

13
offshore marine deposits. The Stage IVC is a major regressive sequence with widespread
coastal to shallow marine and deep-water deposits followed by a period of prolonged sea-
level lowstand. The Belait Formation is dominated by fluvio-deltaic sandstones with
laterally equivalent coastal plain to marine sandstone successions that comprise the topsets
of the Champion Delta depositional system. Outcrop studies indicate that the Champion
Delta is a complex NW prograding delta system with stacked sequences (from bottom to
top) of fluvial sands, marginal marine (estuarine & deltaic) and shoreface deposits (van
Hattum et al., 2006; Lambiase and Ovinda, 2006; Hall et al., 2008; Lambiase and Cullen,
2013).
2.2.1.4 Late Miocene to Pliocene
The late Miocene Shallow Regional Unconformity (SRU) separates the Champion
Delta sequence from the younger Baram Delta (Stage IV-DEFG) succession (Balaguru and
Hall, 2003) this most prominent unconformity in Sabah coincides with significant regional
uplift and erosion. Stage IV (DEFG) of the Late Miocene to Pliocene is composed of
stacked fluvio-deltaic sequence of the Baram Delta System with equivalent offshore shales
and deep-water turbidite deposits. The late Miocene to Pliocene was a period of active
regression with moderate aggradation punctuated by short periods of minor transgression.
The deposits include the onshore equivalent of the Liang Formation of NW Sabah and
Brunei that unconformably overlie the Belait and Seria formations. The Liang formation
also consists of fluvial sandstones and conglomerates, marginal marine sediments and
shoreface sandstones and shales (Hutchison, 1996a; 2005).
2.2.2 Lithostratrigraphy
The stratigraphic subdivision of western Sabah is based on correlation of
uncomformities recognized in the Tertiary of the west Sabah mainland and the adjacent
offshore (Figure 2.3). The sedimentary sequences in between these unconformities are

14
informally called ‘Stages’ (Bol and van Hoorn, 1980; Gartrell et.al., 2011) in the offshore
and formations in the onshore (Hall, 2013).
2.2.2.1 West Crocker Formation
The West Crocker formation is an informal name for distinguishing the western and
northwestern outcrops of a Paleogene succession in northwest Borneo that constitutes the
sand rich Crocker Formation (Hutchison et al., 2000; Lambiase et.al. 2008).The studied
West Crocker Formation outcrops in Kota Kinabalu and Sipitang areas of Sabah. The
formation comprises predominantly turbidites and other deepmarine sediments of
Oligocene-Early Miocene age (Wilson, 1964). They are generally well-deformed,
imbricated and thrusted (Tongkul, 1989; Leong, 1999).This essentially siliciclastic
succession has been interpreted as flysh, turbidites submarine fans, and/or “mass-flow”
deposits (e.g. Hutchison, 2005; Crevello, 2006; Jackson et al., 2009; Algar et al., 2011) of
a foreland basin that developed along the Oligocene-Miocene subduction zone along the
NW Sabah margin. The West Crocker formation lies directly below the Top Crocker
Uncomformity of van Hattum et al. (2013). The TCU has previously been correlated in
different ways with unconformities offshore, typically in sequences deposited above the
Crocker Fan (van Hattum et al., 2013). This profound angular unconformity that was
generated during an orogenic event that uplifted Paleogene and older rocks and marks the
transition from that uplift to the rapid subsidence that accompanied deposition of the thick
overlying Neogene shallow marine clastic succession. In the offshore, this unconformity
was identified by earlier workers (e.g. Bol and van Hoorn, 1980, Levell, 1987 and
Hazebroek and Tan, 1993) as an unconformity below the Miocene hydrocarbon-producing
strata of NW Borneo, but was left unnamed (van Hattum, 2013).

15
2.2.2.2 Temburong Formation
The Temburong Formation firstly introduced by Brondijk (1962) and then revised
by Wilson (1964). This formation is dominantly argillaceous, characterized by rhythmic
repetition of siltstone and shale, and some rare lenticles of limestone. The formation is
remarkably uniform in lithology, being mainly a flysch deposit, with common
intercalations of slightly calcareous pelagic shale (Wilson, 1964; Hutchison, 2005). Wilson
(1964) has described some turbidite sedimentary structures in the siltstones, such as graded
bedding and flute and groove casts which can be seen in the eastern Brunei and south of
Beaufort, Sabah. Over two decade several studies have been conducted on the Temburong
Formation and can be concluded that this formation has been deposited in deep marine
environment by weak turbidity currents as a flysch deposits (Wilson, 1964; Madon, 1997).
The age of the formation ranges from Oligocene to Lower Miocene based on planktic
foraminiferal assemblage (Wilson, 1964).
The Temburong formation has been interpreted to be the coeval shaly equivalent of
the Crocker Formation and has been long recognized as a thick succession of turbidites
with northwared-directed paleocurrents that was deposited in response to collisional
tectonics associated with Late Cretaceous to early Miocene rifting in the South China Sea
(Stauffer, 1967; Wilson, 1964; Tan and Lamy, 1990; Hutchison, 1996). The rock units are
made of irregular rhythmic repetition of steeply dipping interbedded turbidite sandstone
and partially metamorphosed black shales (Hutchison, 1996; 2005).
2.2.2.3 Meligan Formation
The Meligan Formation (Middle Oligocene - Early Miocene) is a lithostratigraphic
unit which belongs to a proto-Champion delta (Meligan Delta). The formation is deeply
truncated at the present day surface, and only preserved from erosion in the centres of a
number of synclines, in the Temburong area of Brunei Darussalam and in adjacent

16
Sarawak and Sabah (Sandal, 1996; Hutchison, 2005). The Meligan Formation consists
dominantly of white-grey, thick bedded, well cemented, frequently cross-bedded medium
to coarse grained sandstones. Sandstones belonging to the Meligan Formation were
possibly deposited in delta plain and braided river environments (Hutchison, 2005).
In Sabah the Meligan Formation unconformably overlies the West Crocker
Formation (Liechti et al., 1960). The base of the Meligan Formation is generally
conformable with the partly older Setap Shale Formation, and locally the two formations
interfinger (Liechti et al., 1960; van Hattum et al., 2013). The Meligan and Temburong
Formations are both truncated at a semi-regional unconformity of Early Miocene age (Top
Crocker Unconformity; TCU). This unconformity grades into a conformable contact over a
relatively short distance in basinward direction, as is also demonstrated on seismic from
offshore northwest Sabah (Sandal, 1996; van Hattum et al., 2013).
2.2.2.4 Belait Formation
The Belait Formation is dominantly sandstone succession with interbedded shales
and coals of middle Miocene age. This formation is part of the petroleum bearing
succession of the Champion delta in NW Borneo. It has been interpreted as coastal and
coastal plain deposits from a range of sedimentary environments associated with a
relatively large delta (Wilford, 1961, Curiale et al., 2000, Lambiase 2000). Facies
associations suggest that much of the Belait Formation was deposited in structurally-
controlled, tide dominated coastal embayments and an open marine coastline well exposed
in Klias Peninsula. Fluvial, tidal and shore face sandstones dominate the Belait Formation
and the exposed coals are closely associated with tidal and fluvial deposits suggesting
deposition in coastal swamps (Madon, 1997; Hutchison, 2005; Tan, 2010; Lambiase and
Tulot, 2013).
17
2.2.3 Petroleum System Overview of Western Sabah
Hydrocarbons in the offshore equivalent of the study area are found in mainly in
the Stages IVA, IVC, and IVD (Leong,1999; Figure 2.3). There are minor occurrences in
other stratigraphic units, including Stage III (e.g. at SE Collins). The occurrence of
onshore oil seepages in the NW Sabah Province is evidence for a viable petroleum system
in the vicinity of the study area although, is still relatively poorly explored (Leong and
Azlina, 1999).
2.2.3.1 Source Rocks
Hydrocarbons in the Sabah Basin are very similar in composition and could have
originated from source rocks rich in mainly terrigeneous organic matter (Scherer, 1980;
Abdul Jalil and Mohd Jamaal, 1992; Azlina Anuar and Abdul Jalil, 1997). The source
rocks are most likely within the Post-DRU (Stage IV) sequences as the pre-DRU deep
marine shales are generally lean and thermally over-mature (Leong and Azlina, 1999).
Widespread erosion of the NW Sabah margin during the early Middle Miocene and the
extensive outbuilding of the stage IV siliciclastic wedge, resulted in deposition of source
beds that are rich in terrigeneous organic matter, interbedded with sand prone reservoir
facies (Mazlan et al., 1999). Source rock preservation in the Sabah basin is the result of the
high input of terrigeneous organic matter and high sedimentation rates and seemingly not
due to anoxicity (Azlina Anuar and Abdul Jali, 1997). Coaly and carbonaceous shales are
the most prolific source rocks in the Sabah basin because of the abundance in large
volumes (>2000m thick in some areas) and are closely interbedded with sandstones which
act as migration conduits for hydrocarbon migration once the saturation threshold is
reached. This efficiency in expulsion allows liquid hydrocarbons to leave the source rocks,
as opposed to being retained and converted to gas (Mazlan et al., 1999).

18
2.2.3.2 Reservoirs, Traps and Seals
The hydrocarbon reservoirs in the Sabah Basin are predominantly siliciclastic.
Good quality reservoirs are formed by coastal to fluvio-marine and stacked shallow marine
sandstones. Also, the marine turbidites in stages IVC/IVD also form thick, high –quality
reservoirs (Leong and Azlina, 1999). Carbonate reservoirs, although a minor component,
have fair to excellent reservoir quality. These carbonate mounds and reefs occur on the
Kudat Platform in the Northern Sabah Province. Most of the hydrocarbons occur in
complex wrench-induced faulted anticlines, rollover anticlines associated with deltaic
growth faults, and other fault-related closures.The main structural traps in the western
Sabah are fault propagation folds and fold anticlines (Scherer, 1980). The hydrocarbons
migrations are generally through faults and intrabedding movement (Nor Azidin et al.,
2011). The seal in NW Sabah is mainly provided by intraformational shale and mudstone
with effective top and flank seals in many proven accumulations (Erb West, Kinabalu, St
Joseph). In some places, shale filled slump scars and shale diapirs act as seal (Leong and
Azlina, 1999).

19
Figure 2.3. Simplified stratigraphy of the offshore and onshore sediments of western Sabah
and northern Sarawak (West Baram Delta) with principal unconformities (after Leichti,
1960; Rijks, 1981; Hall, 2013; Gartrell et al., 2011; ). Pliocene Unconformity (PLU),
Shallow Regional Unconformity (SRU), Deep Regional Unconformity (DRU), and the Top
Crocker Unconformity (TCU) otherwise called Base Miocene Unconformity (BMU).

20
2.3 General Geology of Northwest Sarawak
2.3.1 Tectonic Evolution
The Baram Delta Province is roughly in triangular shape, extends offshore and
onshore in northeast-southwest direction lying on both sides of northwestern Sarawak and
western Sabah including Brunei water. Towards southwest, the province extends into the
northeastern coastal area of Sarawak, which is named as West Baram Delta (Tan et al.,
1999). West Baram Line is marked as western margin of the Baram Delta. It separates the
delta from the old Balingian and Central Luconia Provinces to the west. Morris Fault –
Jerudong Line is the eastern margin of the Baram Delta and it separates the delta from the
older, intensely tectonised Inboard Belt of offshore NW Sabah (Figure 2.1). The West
Baram Delta is characterized by the deposition of a northwestward prograding delta since
Middle Miocene times. Growing in sedimentary section thickness was accompanied by
growth faulting trending in NE-SW direction towards the west of Baram Delta (Madon,
1999; Tan et al., 1999).
Following an Early Miocene tectonic event, uplift and erosion were accompanied
by the deposition of a thick pile of clastic sediments which prograde seaward. Periods of
delta outbuilding were separated by rapid transgressions, represented by marine shale
intervals that form the base of eight sedimentary cycles in the offshore (Tan et al., 1999).
The regressive sequences of each depositional cycle grade northwestwards from coastal-
fluviomarine sands to neritic, marine shales (Tan et al., 1999; Hutchison,, 2005). Since the
Middle Miocene, the Baram Delta has been subsiding relative to the more stable Central
Luconia and Balingina provinces to the west (Tan et al., 1999).

21
2.3.2 Lithostratigraphy
The Neogene formations crop out in onshore northwest Sarawak to form an
integral part of the clastic wedge passing laterally basinward into the Setap Shale
Formation. Their stratigraphic relationships are depicted in Figure 2.3
2.3.2.1 Lambir Formation
The Lambir Formation of middle Miocene age consists predominantly of
sandstones and alternating shales with minor limestone and marl in some places (Liechti
et al., 1960; Tan et. al., 1999; Haile and Ho, 2014). They are increasingly less
consolidated towards the upper part of the formation, which consists of sandstone
alternating with shales and clays, partly coarse grained or gritty, with quartz pebbles
(Leichti et al., 1960). The formation is made up of tidal facies rich in carbonaceous
materials in the form of coaly debris and laminations as observed in the Lambir Hills
area. The Lambir Formation interfingers with Miri and Tukau formations (Rijk, 1981;
Hutchison, 2005) as shown the Figure 2.3.and it has a slightly diachronous transitional
contact with the underlying Setap Shale (Tan et al., 1999).
2.3.2.2 Miri Formation
The Miri Formation of middle Miocene age is a siliciclastic succession of
coarsening upwards clay-sand packages that is restricted to the coastal area between
Miri city in Sarawak basin and Jerudong in Brunei. The studied outcrops are located
within the coastal part of Miri city. The Miri Formation are the uplifted part of the
subsurface, oil-bearing sedimentary strata of the Miri oilfield possibly corresponds to
upper Cycle IV to Cycle V of the offshore stratigraphic units (Tan et al. 1999; Warnier
et al, 2011). Based on lithological differences and micropaleontology, the Miri
Formation was subdivided into Lower Miri which consists of interbedded shale and
sandstone overlying the Setap Shale Formation, and Upper Miri which is characterised

22
by irregular sandstone and shale alternations (Tan et.al.1999; Hutchison, 2005; Warnier
et al, 2011).
2.3.2.3 Tukau Formation
The sedimentary rocks of the Tukau Formation belong to the age range between
Late Miocene and Early Pliocene and conformably overlie the Lambir Formation near
Sungai Liku in the eastern Lambir Hill. The Tukau Formation is preserved in a
relatively simple synclinal structure dissected by strike–slip fault systems and consists
of both clay and sandstone beds (Nagarajan et al., 2013). They are made up of mainly
fluvial deposits with characteristics including lenticular-shaped channels present at the
lower and upper parts of the succession and composed of medium to coarse grained
sandstone (Kessler, 2010; Nagarajan et al., 2013). The absence of brackish water forms
of foraminifers, presence of lignite layers and amber balls in layered strata suggested
that the Tukau Formation was possibly deposited in a upper coastal plain (Hutchison,
2005).
2.3.3 Petroleum System Overview
2.3.3.1 Source Rocks
No distinct source rock interval that gives rise to oil accumulated has been
identified in the West Baram Delta. In contrast with the majority of the world’s deltas
which are mostly built upon passive margins, the West Baram Delta is deposited on an
actively subducting margin located offshore NW Borneo (Anuar and Hoesni, 2008).
Rapid clastic influx, due to the Middle Miocene uplift and subsequent erosion of the
Sabah and Sarawak landmass, with simultaneous space creation led to the accumulation
of the West Baram Delta’s 8-9km thick depositional sequence of predominantly
terrigenous origin (Tan et al., 1999). The source of the West Baram Delta hydrocarbons
was intuitively subscribed to Type III land-derived kerogen. Information from offshore

23
exploration concluded that the West Baram delta oils were generated from land –
derived organic materials deposited and preserved in a deltaic setting. These source
rocks began accumulating during the Late Miocene with the deposition of Middle and
Upper Cycle V sediments and continued into the Pliocene with the deposition of Cycle
VI sediments. Mainly humic to mixed, landplant-derived organic material, dispersed
within the early-mid Miocene mudstones and sandstones is thought to constitute the
source rocks for the oil and gas (Anuar and Hoesni,2008).
2.3.3.2 Reservoirs Traps and Seals
During the overall regressive Cycles V to VIII times a thick sequence of
regressive coastal plain and fluvio-marine sediments with generally good reservoir
characteristics were deposited (Rijks, 1981; Seah et al., 1987). The principal reservoirs
are beach sands, coastal barriers sands and shallow neritic sand -sheets deposited in a
coastal environment and channel sands belonging to the deltaic coastal plain
environment of deposition (Rijks,1981). The economic floor is at a shallower depth in
the southern part of the Baram Delta Province, where erosion has removed the thick
overburden and tectonism has increased the intensity of diagenesis (Rijks, 1981; Tan et
al., 1999).
In the Baram Delta Province hydrocarbon accumulations are predominantly
found to be present in fault dipclosed structures (Tan et al., 1999). Although a large
portion of the hydrocarbons is trapped by later faults, the major growth faults form the
principal trapping mechanism. This is due to their synsedimentary origin and the very
large throws which can place a thick paralic (sand/shale) down thrown block sequence
against a fully marine shale sequence in the upthrown block. This juxtaposition of sands
against shales appears to be the critical factor for the sealing of the faults.

24
CHAPTER 3
REVIEW OF SOURCE ROCK EVALUATION PRINCIPLE
3.1 Petroleum Source Rock Evaluation
A petroleum source rock may be defined as fined grained sediment that has
generated and expelled enough hydrocarbons to form an accumulation of oil and gas
while potential source rock is one that is not mature to generate petroleum in its natural
setting but will form significant quantities of petroleum when required thermal maturity
is attained (Hunt, 1996; Hunt et al., 2002). Accurate evaluation of the hydrocarbon
generation potential of source rocks is essential for hydrocarbon accumulation
assessment in a petroleum system (Hunt, 1996). The petroleum potential of any source
rock is evaluated by determining the organic matter richness (quantity), type (quality)
and thermal maturity of organic matter contained in such rock. There is no single
petrological or geochemical parameter that is universally accepted as an accurate
measure of the petroleum source potential thus the need to integrate petrology and
geochemistry.
The quantity and quality of organic matter (OM) preserved during diagenesis
and level of thermal maturity eventually establishes the petroleum-generative potential
of the source rock (Demaison and Moore, 1980; Emerson, 1985; Meyers, 1997). The
profusion and distinctiveness of OM is associated with the environment of deposition.
The OM may be autochthonous (originated in the water column above or within the
sediments in which it is burried) or allochthonous (foreign to the environment of
deposition). The autochthonous OM may include phytoplankton (diatoms and algae),
bacteria, zooplankton, corals and sponges while allochthonous OM is sourced from
terrestrial plants and animals debris, spores and pollens transported by air or water to
deposition place (Hunt, 1996).

25
The three major domains of life include archaea, eubacteria (prokaryotes) and
eukarya (eukaryotes or higher organisms) that contribute OM to the carbon cycle on
Earth. The OM in sedimentary rocks is microscopically heterogeneous. Its chemical
composition is related to biological activity, sedimentation and diagenetic processes.
The preservation of OM is favored by anaerobic conditions and rapid sedimentation
rate. Most petroleum is produced from source rocks sediments preserved in anoxic to
dysoxic/suboxic environment since they hold more hydrogen rich OM than do oxic
sediments. Sediments are classified as oxic, dysoxic, suboxic and anoxic based on the
oxygen contents of the overlying water. Anoxic environments are formed from the lack
of water circulation below the photic zone in marine or lacustrine sediments (Peters et
al., 2005).
Thermal maturity demonstrates the extent of heat-driven reactions that change
sedimentary OM into petroleum. For example, kerogen in fine-grained source rocks can
be transformed thermally to oil and gas, which migrate to coarser-grained reservoir
rocks. Early diagenetic processes, convert bacterial and plant debris in sediments to
kerogen (insoluble particulate OM) and bitumen (extractable OM). Thermal processes
usually related with burial then convert part of this OM to petroleum and, ultimately, to
gas and graphite (Peters et al., 2005).
It is thought that both kerogen and oil are unstable during catagenesis and
progressively decompose to pyrobitumen and gases (e.g. Tissot and Welte, 1984; Hunt,
1996). Crude oil and gas originate by direct thermal decomposition of kerogen and also
hydrocarbons in oils crack thermally and produce gas and condensate in the earth
(Mango, 1991). Potential source rocks consist of ample amounts of the proper type of
dispersed kerogen to generate significant amounts of petroleum but are not yet
thermally mature. A potential source rock turns into an effective source rock only at the
appropriate level of thermal maturity (Peters et al., 2005).

26
3.1.1 Quantity of Organic Matter
The quantity of organic matter (OM) in source rocks is usually expressed as the
total organic carbon (TOC). TOC is a measure of the organic richness of a rock, i.e. it is
the quantity of organic carbon (both kerogen and bitumen) in a rock sample (Jarvie,
1991; Peters and Cassa, 1994; Peters et al., 2005). Three factors are mainly responsible
for the organic contents of sediments namely the primary biological productivity, OM
preservation and deposition rate of OM versus minerals (Tissot and Welte, 1984).
It is not easy to define the minimum level of TOC a formation must contain in
order to qualify as a source sequence. Source qualities are dependent not only on the
amount of OM, but also on the type of OM, maturity etc. In general, the higher the TOC
value, the better is the source potential. According to published data (e.g., Tissot and
Welte. 1984; Peters and Moldowan, 1993; Hunt, 1996) minimum values of TOC for
potential source rocks are 0.5% for shales and 0.3% for carbonates. Average values for
shaly source rocks world-wide are 1.5% to 2%, for carbonates approximately 0.6%
(Tissot and Welte, 1984).
Samples with TOC values exceeding these limits should be analyzed further, as
TOC values alone do not necessarily characterize the potential to generate oil/gas. TOC
only establish the amount of OM, not the category of OM. Very high levels of TOC can
be due to dead carbon. TOC values of 10% or more in coaly sediments are common, but
data from subsequent pyrolysis (and organic petrology) sometimes indicate that a major
proportion of the organic material is “dead” i.e. Reworked and not capable of generating
hydrocarbons any more. Differences in maceral distributions play a crucial role; a
sample with 2% TOC in which the OM is predominantly vitrinite, is a much poorer
source than a sample with the same amount of TOC in which the OM consists of Type-I
and Type-II kerogen mixture.

27
3.1.2 Genetic Potential
The total amount of hydrocarbons present in source rocks is S1 + S2 which
represents the genetic potential (GP) and allows a semi-quantitative evaluation of
potential source rocks based on Rock-Eval analysis. It characterizes the total amount of
hydrocarbons which can be released during maturation. S1 corresponds to the fraction of
the genetic potential which has been effectively transformed into hydrocarbons. S2
represents the potential which has not yet generated hydrocarbons. Thus S1 + S2
articulated in milligram hydrocarbons per gram of rock, is an evaluation of the genetic
potential. The high genetic potential (>2 mg HC/g rock) suggest oil prone source rock
whereas low values (generally <2 mg HC/g rock) indicates gas prone source rock
(Dyman et al., 1996; Ehinola et al., 2008).
The percent of bitumen in sediments, also called extractable organic matter
(EOM) can be used to assess the source rock generative potential. A low percentage
<0.05 % indicates poor potential; 0.05-0.1 % stands for fair and 0.1-0.2 % for good
whereas 0.2-0.4 % for very good and >0.4 represents excellent quality source rock
(Peters and Cassa, 1994).
3.1.3 Quality of Organic Matter
The organic matter in a potential source rock must be capable of generating
petroleum. Kerogens capable of generating hydrocarbons are derived from both marine
and terrestrial sources. Kerogen can be classified based on chemical composition and
visual properties. Macerals are the individual organic components making up kerogen
and they are classified by optical properties determined by organic petrology. The four
maceral groups are liptinite or exinite, vitrinite, and inertinite. The groups are
determined by the type of organic material that the macerals are derived from. Organic
geochemical techniques are used to classify kerogen into four types, I, II, III, and IV.
28
These four types are based on chemical composition and the relative amounts of carbon,
Hydrogen, and oxygen present in the sample. Relatively high hydrogen contents in
kerogen correspond to greater oil-generating potential. During burial and resulting
thermal maturation as oil and gas form/crack from the source rock, the kerogen becomes
depleted in hydrogen and oxygen relative to carbon. The amount of petroleum generated
and expelled from a source rock increases as the atomic hydrogen-to-carbon (H/C) ratio
of the organic matter increases (Hunt, 1996). Thus, the most useful classifications of
kerogen types are based on hydrogen, carbon, and oxygen compositions of the organic
matter.
Type I kerogen has high atomic hydrogen-to-carbon atomic (H/C) ratio (~1.5)
and low atomic oxygen-to-carbon (O/C) ratio (<0.1) (Peters and Moldowan, 1993). It is
predominately composed of the most hydrogen-rich organic matter known in the
geologic record. The organic matter is often structureless (amorphous) alginite of algal
or bacterial origin. Petrographically Type I kerogens consist mostly of liptinite
macerals, with trace to minor amounts of vitrinite and inertinite sometimes present.
Type II kerogen has high atomic H/C (1.2 – 1.5) and low O/C ratios compared to Types
III and IV (Peters and Moldowan, 1993). It originates from mixtures of zooplankton,
phytoplankton, and bacterial debris in marine sediments. Type II kerogens are
dominated by liptinite macerals with lesser amounts of vitrinite and inertinite. Type II
kerogens account for most petroleum source rocks (Peters and Moldowan, 1993). Type
III kerogen has low H/C (<1.0) and high O/C (up to ~0.3) (Peters and Moldowan,
1993). Such low hydrogen content in organic matter is associated with polyaromatic
compounds and derived mostly from higher plants. The chemical composition of Type
III kerogen is equivalent to vitrinite, telinite, collinite, huminite, and so-called humic or
woody kerogen. It produces natural gas and occasionally associated condensate if the
thermal maturation is adequate. Type IV kerogen has low H/C (=0.5) and relatively high

29
O/C (0.2 – 0.3). Type IV kerogen is predominantly oxidized organic matter and is
hydrogen-poor.
The Hydrogen Index (HI) is the ratio of the S2 to TOC of the rock, expressed as
mg hydrocarbon per g TOC. The HI is the chief source parameter used in the
quantitative modeling of phase and volume of the generated hydrocarbons (Pepper and
Corvi, 1995; Arfaoui et al., 2007). The marine organisms and algae are generally
comprised of lipid and protein-rich OM, where the ratio of hydrogen to carbon is
elevated compared to land plants. The Oxygen Index (OI) is the ratio of the S3 to TOC
of the rock, expressed as mg CO2 per gram of TOC. The OI is a factor that shows a
relationship with the ratio of oxygen to carbon, which is high for remains of land plants
and inert organic material than in marine sediments.
The HI versus OI plot is broadly employed to classify the dominant type of OM
in potential source rocks (Bordenave et al., 1993; Schwark et al., 2009) and is reliable
indicator of kerogen type (Peters and Cassa, 1994). The HI vs. Tmax plot can substitute
HI vs. OI plot when the reliability of S3 results is doubtful (Espitalie et al., 1984). The
different kerogen types produced from source rocks can be obtained from HI or S2/S3
ratio (Peters, 1986). The samples with the HI values >250, 150-250 and <150 milligram
hydrocarbon per gram of rock are classify the OM as Type II (liptinite), Type II-III
(mixed) and Type III (humic) respectively (Yensepbayev et al., 2010).Type I (algal)
kerogen generally possess HI values >600 mg HC/g TOC (Peters and Cassa,1994).
3.1.4 Thermal Maturation
When sedimentary organic matter is buried in basins it is exposed to
increasingly higher subsurface temperatures. It is generally accepted that, following
diagenesis, thermal maturation or catagenesis is the predominant process by which
economic quantities of hydrocarbons are produced from the kerogen in source rocks

30
(Hunt, 1996). At temperatures of approximately 60°C and higher, the thermal
degradation of kerogen yields hydrocarbons under reducing conditions (Hunt, 1996).
Type I and II kerogens generate most of the world's oil when subjected to burial
temperatures between 60°C and 160°C. Type III kerogen generates natural gas,
condensate, and waxy oil. Type IV kerogen generates small quantities of methane (CH4)
and carbon dioxide (CO2). Most oil expulsion occurs within this burial temperature
range too, when the organic matter is in the “oil window”. Petroleum expulsion from
the source rocks is very inefficient; roughly 85% of the hydrocarbons generated in a
mature source rock are retained within the micropores of the fine-grained sediments
(Hunt,1996). These hydrocarbons are eventually cracked to natural gas as temperatures
increase beyond the oil widow. Three levels of maturity are recognized by petroleum
geochemists, early, peak, and late mature. Hunt (1996) “Postmature for oil is mature for
the gas window. Between one-half to two-thirds of thermogenic gas forms during the
thermal cracking of previously generated oil in both source rocks and in reservoir rocks
and in coal.
The Tmax parameter is considered a very reliable indicator of thermal maturity
of Type II and Type III kerogens, but not for Type I (Espitalie, 1986).The chemical
changes that occur within the kerogen are reflected in the changing optical properties of
the microscopically recognizable constituents (Peters and Cassa, 1994). Changes in the
reflectance of vitrinite-like components express the increasing aromatization of the
kerogen and decreasing H/C as hydrocarbons are released due thermal rupturing of C-C
and C-heteroatom bonds, in much the same way as vitrinite reflectance changes with
increasing coalification (Teichmüller et al., 1998). Espitalie (1986) demonstrated good
correlations between the Tmax parameter derived by Rock-Eval Pyrolysis and vitrinite
reflectance (VR) for organic matter of Type II and III, up to a VR of 1.5% (after this the
S2 peak disappears and Tmax cannot be determined). Bostick (1979) showed that the

31
optical properties of vitrinite from finely dispersed organic matter in sedimentary rocks
could be used to assess thermal maturity. Vitrinites are maceral group derived from
terrigeneous higher plants. Vitrinite reflectance is a widely used indicator of thermal
stress since it extends over a longer maturity range than any other indicator (Hunt et al.,
2002). Vitrinite reflectance can be used to assess thermal maturity in types II and III but
cannot be used for type I kerogen due to absence of vitrinite. Vitrinite reflectance values
for main phase of oil generation ranges from 0.6-1.35%Ro and values greater than
1.35% indicate dry gas generation (Peter and Cassa,1994; Taylor et al., 1998).
3.2 Molecular Geochemistry
The use of biomarkers and non-biomarker compounds as indicators of organic
matter source input, paleoenvironment and thermal maturity has been widely accepted
(Mackenzie et al., 1984; Simoneit, 2004; Peters et al., 2005; Hakimi et.al. 2012).
Biomarker or geochemical fossils are organic compounds found in geosphere whose
structure can be unambiguously linked to their biological origin, despite the possibility
of some structural alteration due to diagenetic or other processes (Peters et al., 2005;
Adedosu et al., 2012). Polycyclic aromatic hydrocarbons (PAH) are a suite of organic
compounds that are ubiquitous in sediments. The possible source of PAH may be oil,
coal, air-transported particles combustion of fossil fuel, plant material, algae and
bacteria or diagenesis (Pereira et. al., 1999).
3.2.1 Source Input and Depositional Conditions Indicators
n-Alkanes are widely distributed in various plants and other organisms and
areprobably the most exploited class of biomarkers (Philp, 1985).Waxes present in
higher plants have significant concentrations of long chain homologues of n-alkanes in
C22-C36 region with a pronounced odd/even carbon number predominance and their
occurrence reveals the land plant input (Eglinton and Hamilton, 1967; Tulloch, 1976;

32
Table 3.1. Generative potential, kerogen type, expelled products and thermal maturity of
source rock (Peters and Cassa, 1994).
Potential (Quantity)
Petroleum
Potential
TOC
(wt.%)
S1 S2 Bitumen Hydrocarbons
(ppm) (wt.%) (ppm)
Poor 0-0.5 0-0.5 0-2.5 0-0.05 0-500 0-300
Fair 0.5-1 0.5-1 2.5-5 0.05-0.10 500-1000 300-600
Good 1-4 1-2 5-10 0.10-0.20 1000-2000 600-1200
Very Good 2-4 2-4 10-20 0.20-0.40 2000-4000 1200-2400
Excellent >4 >4 >20 >0.40 >4000 >2400
Kerogen (Quality)
Kerogen Type Kerogen
Composition
HI
(mg HC/g
TOC)
S2/S3 Atomic H/C Main Expelled
Product at
Peak Maturity
I amorphous/alginite >600 >15 >1.5 Oil
II liptinite 300-600 10-15 1.2-1.5 Oil
II/III liptinite/vitrinite 200-300 5-10 1.0-1.2 Oil &Gas
III vitrinite 50-200 1-5 0.7-1.0 Gas
IV inertinite <50 <1 <0.7 None
Maturation
Maturity Tmax PI Ro (%)
Immature <435 <0.10 0.2-0.6
Early Mature 435-445 0.10-0.15 0.6-0.65
Peak Mature 445-450 0.25-0.40 0.65-0.9
Late Mature 450-470 >0.40 0.9-1.35
Post mature >470 - >1.35

33
Gogou et al., 2000). Microbial n-alkanes typically indicate a smooth distribution of
carbon numbers whereas those resulting from terrestrial source have a noticeable
prevalence of the odd carbon numbered compounds, especially in the range of C25, C27,
C29 compounds (Tissot and Welte, 1984). Similarly algal input will be characterized by
n-alkanes in the C16-C18 region of the chromatogram. The predominance of n-C22
suggests a hypersaline depositional environment and an even/odd preponderance is
indicative of a highly reducing environment.The relative proportion of terrestrial versus
aquatic OM in crude oils or sediment extracts can be identified by using terrigenous-
aquatic ratio (TAR). The higher values reflect high relative profusion of terrestrial
compared to aquatic OM (Bourbonniere and Meyers, 1996).
TAR = (nC27 + nC29 + nC31)/(nC15 + nC17 + nC19)
The ratio must be used carefully as it is sensitive to secondary alteration processes like
maturation and biodegradation. Moreover, certain non-marine algae (e.g. Botryococcus
braunii) may contribute to C27-C31 n-alkanes (Moldowan et al., 1985; Derenne et al.,
1988). However TAR measurements are significant to estimate changes in contribution
of land versus aquatic flora in immature samples (e.g. Meyers, 1997).
The most copious source of pristane (C19) and phytane (C20) is the phytol side
chain of chlorophyll in phototrophic organisms and bacteriochlorophyll in purple
sulphur bacteria (e.g. Brooks et al., 1969; Powell, 1988). The Pr/Ph ratio can be applied
to ascertain redox conditions of sediments throughout the deposition period under the
supposition that both pristane and phytane were derive from phytol side chain of
chlorophyll. Low values of this ratio (Pr/Ph <1) in crude oils and extracts indicate
anoxic environment of deposition (Didyk et al., 1978; Tissot and Welte, 1984; Hunt,
1996; Harris et al., 2004; Peters et al., 2005), particularly when accompanied by high
prophyrin and sulfur contents, while Pr/Ph >1 designate oxic deposition (Didyk et al.,

34
1978). The Pr/Ph ratio may undergo an increase under the influence of thermal maturity
due to cracking of phytane compared to pristane or preferential net production of the
former over the latter (Peters et al., 2005).
3.2.2 Thermal Maturity Indicators
Pristane/n-C17 and phytane/n-C18 ratios decrease with thermal maturity since
cracking produces more n-alkanes from kerogen (Tissot et al., 1971). These
isoprenoid/n-alkanes ratios can be used to assess thermal maturity of oils and bitumens.
However, OM input (Alexander et al., 1981) and secondary processes can affect these
ratios. So, it is recommended to use the ratio (Pr + nC17)/ (Ph + nC18) instead of using
Pr/nC17 and Ph/nC18 as it is supposed to be least effected by maturation process
(Alexander et al., 1981). Biodegradation increases these ratios because of preferential
removal of n-alkanes prior to isoprenoids (Peters et al., 2005).
The comparative profusion of odd versus even carbon numbered n-alkanes; CPI
(Bray and Evans, 1961) and OEP (Scalan and Smith, 1970) can be used to estimate
thermal maturity levels of petroleum. CPI or OEP values significantly above or below
1.0 indicate thermally immature OM. Values of 1.0 propose, but not prove, that the
crude oil or rock extract is thermally mature. CPI or OEP values below 1.0 are unusual
and typify low-maturity oils or bitumen from carbonate (Peters et al., 2005).
Bray and Evans (1961) infer that a source rock is thermally mature when it has
generated enough hydrocarbons to bring down the odd/even ratio of C25-to-C33 n-
paraffin to the ratio in crude oil, which is about 0.9 to 1.3. Values of CPI will initially

35
be >1 but will be inclined towards a final value of 1 with increasing maturity. Sediments
from purely marine source show CPI value of 1 at all depths while land plants input
enhanced the range up to about 20. High CPI values above 1.5 always pass on to
relatively immature samples. Low CPI values, though, do not essentially mean higher
maturity; they can also be indicative of OM deficient in terrestrial input.
Alkylated polycyclic aromatic hydrocarbons (PAHs) have received attention as
indicators of thermal maturity (Budzinski et al., 1995). Throughout the oil window,
aromatic maturity indicators are thought to be more sensitive to maturity effects than
many biomarker maturity parameters (Alexander et al., 1986). A variety of aromatic
maturity parameters have been proposed on the basis of ratios of the relative
concentration of more thermally stable isomers to less stable ones (Radke and Welte,
1983; Bastow et al., 2000). Several maturity ratios involving phenanthrenes have been
developed over the years and used to assess thermal maturity ((Alexander et. al., 1985;
Radke et al., 1986, 1998; Bastow et al., 1998). Phenanthrene maturity parameters are
based on the greater stability of 3-methyl phenanthrene and 2-methylphenanthrene
compared to 9-methylphenanthrene and 1-methylphenanthrene (Radke and Welte,
1983). The methyl phenanthrene index (MPI) proposed by Radke is a widely used
molecular maturity parameter and depends on the relative stability of the isomers
(Radke and Welte, 1983).
3.3 Trace Elements application in paleoredox conditions
Redox-sensitive trace element (TE) concentrations or ratios are among the most
widely used indicators of redox conditions in modern and ancient sedimentary systems
(e.g., Jones and Manning, 1994, Wignall, 1994; Alberdi-Genolet and Tocco, 1999; Akinlua
et. al., 2010; Adegoke et al., 2014). Elements providing good potential for palaeo-redox
determination are those which are predicted or observed as being more insoluble in anoxic

36
water, which can be expected to be enriched relative to detrital inputs in normal oxic
sediments.
The presence of trace elements in the organic matter depends mainly on the
following factors (Tribovillard et al. 2006): (1) metals used in metabolic processes of
living organisms (biogenic elements), (2) the pH and Eh of the sedimentary
environment, especially the existence of sulfate-reducing conditions, (3) metals in the
sedimentary environment; this is related to the chemical composition of the fluid phase
interacting with the sediments during diagenesis, (4) the mineralogy of the sedimentary
rock (carbonate or siliciclastic), especially the type and amount of clay minerals of
which the clays from the smectite group (expanding clays) have the largest sorption
capacity, (5) the type of organic matter related to the presence of functional groups that
can form organometallic complexes. The last three points are very important for the
distribution of trace elements in a system comprising a sulphide phase, organic matter,
and clay minerals.
Tribovillard et al. (2006) indicated that the trace elements, like V, Ni, Cr, Cu,
and Mo, can be used as paleoredox proxies for paleoenvironmental analysis. These
redox-sensitive trace elements tend to be more soluble under oxidizing conditions and
less soluble under reducing conditions, resulting in authigenic enrichment in oxygen-
depleted sedimentary facies (Tribovillard et al., 2006). Under reducing conditions,
sedimentary accumulations of these trace elements may be hosted by various phases,
e.g., metal sulfides, in solid solution in pyrite, insoluble oxides and oxyhydroxides,
phosphate, sulfate, organometallic complexes and adsorbed onto organic or mineral
surfaces (Tribovillard et al., 2006). In addition, with no postdepositional replenishment
of oxidizing agents, sulfides are stable and the elements engaged in or co-precipitated
with (iron-) sulfides typically do not move during diagenesis (Tribovillard et al., 2006).
As a result, the more reducing condition in depositional environments, the more

37
enrichment of these trace elements in sedimentary rocks. The enrichment of these trace
elements can be used as paleoredox proxies to indicate the reducing conditions in
depositional environments.
Lewan and Maynard (1982), Lewan (1984) reported that source rock type and
depositional environment have a profound effect on the predicted levels of nickel in the
source rocks. This implies that the source depositional environment determines the
proportion of vanadium to nickel in crude oil. It has been proved that high V/Ni ratio is
associated with anoxic palaeoenvironment of deposition ((Lewan, 1984) whilst both
V/Ni and Co/Ni ratios have been shown to be anoxic/oxic related parameters (Jones and
Manning,1994).The concentrations and ratios of trace metals such as V, Ni and Co are
of particular importance in trace metal geochemistry. These ratios are used in the
determination of source rocks types, depositional environment and maturation of crude
oils. This is because these ratios remain unchanged irrespective of digenetic and in –
reservoir alteration (Lewan, 1984; Barwise, 1990).

38
CHAPTER 4
METHODOLOGY
4.1 Introduction
This chapter discusses the methods adopted in this research to achieve the
proposed objectives. This includes fieldwork and laboratory studies. The laboratory
studies are categorized into petrological and geochemical analyses performed on sandy
and shaly sediments of the Cenozoic sequences within the study areas.
4.2 Fieldwork and Sampling
Fieldwork exercise was carried out in Klias Peninsula, Kota Kinabalu, Beaufort
and Sipitang areas of western Sabah and South Miri area of Sarawak. The locations of
representative outcrops were plotted on the map (Figure 4.1) with the aid of a Global
Positioning System (GPS) and assignment to typical Formation was based on published
information from past workers (e.g Tongkul, 1994; Jackson et al. 2009, Hutchison,
2005; Tan, 2010; Wannier et al., 2011). Sedimentary logging was limited to well
preserve exposures and photographs were taken for illustration purposes. Sampling was
done very carefully to avoid contamination and weathered samples were avoided in the
field. The samples description is shown in Table 4.1.

39
Figure 4.1 Simplified geological map showing sampling location in areas within western Sabah and northern Sarawak

40
Table 4.1 Lithological description and location of the studied formations samples.
Formation Sample Coordinates Locality Lithology
Northwest Sarawak
WE
ST
BA
RA
M D
EL
TA
Lambir
L-02-SS 4° 11.271' N 114° 2.437' E
Miri
Bintulu
Road
Carbonaceous Sandstone
L-03-SH 4° 11.271' N 114° 2.437' E Mudstone
L-04-SS 4° 11.271' N 114° 2.437' E Mudstone
L-05-SS 4° 11.230' N 114° 2.399' E Carbonaceous Sandstone
L-06-SH 4° 11.230' N 114° 2.399' E Carbonaceous Sandstone
L-07-SH 4° 11.215' N 114° 2.410' E Mudstone
L-09-SH 4° 11.215' N 114° 2.410' E Mudstone
L-10-SH 4° 11.190' N 114° 2.195' E Mudstone
L-11-SH 4° 11.190' N 114° 2.195' E Mudstone
L-14-SH 4° 11.190' N 114° 2.195' E Mudstone
Miri
M-01-SH 4° 11.618' N 113°50.778' E
Miri-
Bintulu
Coastal
Road
Mudstone
M-02-SH 4° 11.618' N 113° 50.778' E Mudstone
M-03-SH 4° 12.718' N 113°53.661' E Mudstone
M-04-SH 4° 12.718' N 113°53.661' E Mudstone
M-05-SH 4° 12.718' N 113°53.661' E Mudstone
M-06-SH 4° 12.718' N 113°53.661' E Mudstone
M-07-SH 4° 12.718' N 113 53.661' E Mudstone
M-08-SS 4° 15.193' N 113°54.227' E Carbonaceous Sandstone
M-09-SH 4° 15.193' N 113°54.227' E Mudstone
M-10-SS 4° 15.193' N 113°54.227' E Carbonaceous Sandstone
Tukau
T-01-SS 4° 15.519' N 114°2.156' E
Miri-
Bintulu
Road
Carbonaceous Sandstone
T-02-SH 4° 15.519' N 114°2.156' E Mudstone
T-03-SH 4° 15.519' N 114°2.156' E Mudstone
T-04-SH 4° 15.519' N 114°2.156' E Mudstone
T-06-SH 4° 15.519' N 114°2.156' E Mudstone
T-07-SH 4° 15.519' N 114°2.156' E Mudstone
T-08-SH 4° 15.519' N 114°2.156' E Mudstone
T-09-SH 4° 15.519' N 114°2.156' E Mudstone
T-10-SS 4° 15.519' N 114°2.156' E Carbonaceous Sandstone
T-12-SH 4° 15.519' N 114°2.156' E Mudstone
CH
AM
PIO
N D
EL
TA
Western Sabah
Belait
BL-A2-SH 5° 52.415' N 115°52.573'E
Batu
Luang
Mudstone
BL-A3-SH 5° 52.415' N 115°52.573'E Carbonaceous mudstone
BL-A5-SS 5° 52.415' N 115°52.573'E Organic laminated
sandstone
BL-A6-SS 5° 52.415' N 115°52.573'E Sandstone
BL-A7-SH 5° 52.415' N 115°52.573'E Mudstone
BL-A8-SS 5° 52.415' N 115°52.573'E Carbonaceous sandstone
BL-B1-SH 5° 52.365' N 115°52.520'E Mudstone
BL-C2-SH 5° 52.350' N 115°52.475'E Mudstone associated with
coal
ME
LIG
AN
DE
LT
A
Meligan
ME-130B-SH 5° 02 .157' N 115° 32.355'E
Sipitang
Mudstone
ME-130C-SS 5° 02.157' N 115° 32.355’E Carbonaceous sandstone
ME-130F-SH 5° 02.157' N 115° 32.355'E mudstone
ME-133A-SS 5° 00.651' N 115° 33.254'E Carbonaceous sandstone
ME-133C-SH 5° 00.651' N 115° 33.254'E mudstone
ME-134A-SH 5° 00.651' N 115° 33.254'E Coaly mudstone

41
Table 4.1 Lithological description and location of the studied formations samples
(continuation)
Formation Sample Coordinates Locality Lithology
SU
BM
AR
INE
FA
N
Temburong TE-137A-SH 4° 30.212' N 115° 40.254'E
Sipitang-
Tenom
Dark shale
TE-137B-SS 4° 30.212' N 115° 40.254'E Sandstone
TE-138-SH 4° 35.156' N 115° 42.210'E Dark shale
TE-139-SH 4° 58.147' N 115° 42.054'E Dark shale
TE-139-SS 4° 58.147' N 115° 42.054'E Sandstone
TE-140-SH 4° 58.124' N 115° 42.054'E Dark shale
West
Crocker
WC-129B-SH 5° 02.376' N 115° 30.998'E
Sipitang
Dark shale
WC-129E-MTD 5° 02.376' N 115° 30.998'E Slump deposit (silty)
WC-129D-MTD 5° 02.376' N 115° 30.998'E Slump deposit(shaly)
WC-129F-MTD 5° 02.376' N 115° 30.998'E Slump deposit (sandy)
WC-135B-SST 4° 59.835' N 115° 34.441'E Carbonaceous sandstone
WC-144A-MTD 5° 46.563' N 116° 01.333'E
Kota
Kinabalu
Slump deposit (sandy)
WC-144B-SH 5° 46.563' N 116° 01.333'E Dark shale
WC-145A-SST 6° 02.527' N 116° 08.486'E Sandstone
WC-145B-MTD 6° 02.527' N 116° 08.486'E Slump deposit (sandy)
WC-145C-SH 6° 02.527' N 116° 08.486'E Dark shale
Undifferentiated
Formation
UD-01-SS 5°45.951' N 115°45.961'E Batu
Liting
Carbonaceous sandstone
UD-02-SS 5°45.951' N 115°45.961'E Laminated sandstone

42
4.3 Petrological Analyses
Organic petrographic analyses used in this study involved the use of a LEICA CTR
6000 photometry microscope. The main objective of this technique is to provide
information about the maceral composition, vitrinite reflectance and fluorescence
characteristics of the dispersed organic matter in order to assess the type, maturity and
source input of organic matter within the studied sequences.
4.3.1 Polished Block Preparation
Rock samples were crushed into small pieces (2-3mm) using pastel and mortar.
Samples then were, embedded in 30 mm diameter latex moulds with liquid epoxy resin and
hardened for 48 hours at 30°C. Samples were then gradually ground with 350 (coarse), 550
(intermediate), 800 (fine), 1200 (very fine) abrasive powder and finally polished with 1μm
alumina powder-deagglomerate, 0.3 μm alumina powder-deagglomerate, and 0.04 μm OP-
S suspension solution for final polishing.
4.3.2 Vitrinite Reflectance Measurement
Measurement of vitrinite reflectance was carried on polished blocks under reflected
white light, with x50 oil immersion objectives using immersion oil with a refractive index
(ne) of 1.518 at 23°C. A sapphire glass standard with 0.589% reflectance value was used
for calibration. Reflectance measurements were determined in the random mode (Rrand)
on vitrinite maceral at a wavelength of 546 nm, and the values reported were arithmetic
means of at least 25 measurements per sample.
4.3.3 Maceral Analysis
The maceral analysis procedure was carried out in reflected white light and
fluorescence mode using 50x oil immersion objectives. Semiquantitative analysis was
carried out to estimate maceral abundance in dispersed organic matter in the shaly and
sandy samples. Fluorescence microscopy was carried out to identify the liptinite macerals.

43
4.3.4 Palynofacies Analysis
Palynofacies analysis consisted of observations of isolated kerogen under
transmitted light microscopy to identify different organic matter type. A count of 200
organic matter particles was carried out for each slide to document changes in the
frequency of organic matter and to calculate their percentage frequency according to Nøhr-
Hansen (1989).
4.4 Geochemical Analyses
Geochemical techniques were used to determine the type, abundance and thermal
maturity of organic matter as well as source input and depositional conditions.
4.4.1 Source Rock Analysis
The rock samples were crushed to less than 200 mesh and analysed using (SRA-
Weatherboard)-TOC/TPH instrument (equivalent to Rock Eval equipment) to identify the
organic matter richness, kerogen type and maturation for the preserved organic matter.
Pyrolysis analysis was performed on approximately 50-100 mg crushed samples, which
were heated to 600°C in a helium atmosphere and measured several parameters such as S1,
S2, S3 and temperature of maximum pyrolysis yield (Tmax). TOC was also determined
using the SRA instrument. Hydrogen index (HI), oxygen index (OI), production yield
(PY), and production index (PI) were calculated as described by Espitalie et al. (1977) and
Peters and Cassa (1994).
4.4.2 Bitumen Extraction
Fine powdered rock samples were measured and placed in the pre-extracted
thimble capped with pre-extracted cotton wool. Samples were subsequently extracted in a
Soxhlet Apparatus for 72 hours using an azeotropic mixture of dichloromethane and
methanol in (93:7) ratio. Metallic copper was added into the flask during the extraction
process to remove the elemental sulphur and anti-bumping granules was added to avoid

44
burst out. After that, the solvent was removed through evaporation process by the use of
Rotary evaporator under low pressure. The recovered fractions were air dried and the
weight was measured and recorded as the extractable organic matter (EOM).
4.4.3 Liquid Column Chromatography
The extractable organic matter (EOM) was separated into saturated and aromatic
hydrocarbons and polar compounds (NSO compounds) by column chromatography on
neutral alumina over silica gel. Chromatographic column (length/width ratio 50:1) was
slurry packed with activated silica gel and aluminum oxide using petroleum ether.
Aliphatic, Aromatic and NSO fractions were eluted with petroleum ether (100 ml),
dichloromethane (100ml), and methanol (50 ml) respectively. The solvent was distilled off
using rotary evaporator to about 3 ml and thereafter transferred into a weighed clean vial.
The remaining solvent was removed under nitrogen gas flow at temperature below 50°C.
4.4.4 Gas Column Chromatography-Mass Spectrometry
Gas Chromatography - Mass Spectrometry (GC-MS) was used to analyze the
aliphatic and aromatic hydrocarbon fractions of the samples. The saturated fractions were
dissolved in hexane while the aromatic fractions were dissolved in dichloromethane
(DCM) and analyzed by GC-MS. The analyses were performed on an Agilent Gas
Chromatograph 6890N combined with 5975 Inert Mass Selective Detector. The GC
temperature was programmed from 40°C to 300°C (30 min hold) at 4 °C min−1 in an oven
for 95 minutes. The injected fractions were vaporized and mixed with helium as a carrier
gas. The separated compounds were transferred to the source of the mass spectrometer
where they were ionized by an electron beam. Data were acquired and processed using
Agilent ChemStation software.

45
4.4.5 Kerogen Isolation
Extracted rock samples were treated with hydrofluoric acid (48-68%) to remove the
silicates. The samples were left overnight to ensure the clastic fraction was completely
removed and subsequently diluted with distilled water until neutral pH is reached. The
sample was treated with a concentrated hot bath of hydrochloric acid, 1:1 (HCl: distil
water) to remove any remnants of carbonates. Samples were allowed to cool and were then
diluted with distilled water until a neutal pH is reached and transferred to a centrifuge tube.
A mizture of ZnBr (1kg: 370ml distilled water) with specific gravity 2.2 was prepared and
then poured into the centrifuge tube and was left overnight. The floated kerogen was
pipetted and washed with distilled water.
4.4.6 Open Pyrolysis-Gas Chromatography (Py-GC)
The Pyrolysis analysis was carried out using a Frontier Lab Pyrolyser System
which can perform thermal desorption from 40 to 300°C and pyrolysis at 600°C. The
system is coupled to an inert (quartz and Ultra ALLOY-5) column fitted to an Agilent GC
chromatography equipped with a flame ionization detector. The pyrolysis products were
trapped after passing through GC column and released over the range 300-600 °C at (25
°C/min). Identification of peaks based on reference chromatograms was done manually
with Agilent ChemStation software and comparison to published data (e.g., Abdullah,
1999; Dembicki, 2009; Hakimi and Abdullah, 2013).
4.4.7 Elemental Analysis (TS, and CHN)
Total Sulphur (TS) was measured on whole rock by combustion in an induction
furnace in a flow of oxygen, using a LECO carbon –analyser IR112. Whole rock and
selected isolated kerogen samples were subsequently analysed on a Perkin-Elmer 2400
Series CHNS/O Analyzer at the Department of Chemistry to determine carbon (C),
hydrogen (H), and nitrogen (N) ratios.

46
4.4.8 Inductively Plasma Mass Spectrometry (ICP-MS)
Concentrations of trace elements were determined using an Agilent Technologies
7500 Series Inductively-coupled plasma mass spectrometer (ICP-MS). The samples were
pulverized into fine powder and prepared for the analysis by Microwave-assisted digestion
as outlined by Pi et al. (2013). Anton 3000 microwave oven was used for the Microwave
assisted digestion, and the chemicals used comprise a mixture of HNO3, HF and HClO4.
HF was neutralized by fresh addition of HClO4 to the sample solution and evaporated to
near dryness. 10 ml of 5 M HNO3 was further added and the solution was slowly digested
at low temperature. The obtained sample solution was diluted with deionized water to 50
ml in a volumetric flask and were diluted a further 5-fold for ICP-MS analysis. The
minimum detection limit of the equipment is less than 1 ppb. Results were corrected to the
weight of bulk rock, and analytical precision for trace element concentration was better
than 5%.
Figure 4.2. Flowchart of the methods adopted in this study.

47
CHAPTER 5
RESULTS
5.1 Introduction
This chapter presents the results obtained from geochemical and petrological study
carried out on the samples collected from western Sabah and northwest Sarawak
representing the Tukau, Miri, Lambir, Belait, Meligan, Temburong and West Crocker
formations. This chapted also discusses the lithofacies observed in the field.
5.2 Lithofacies Description
The lithologic log used to characterize the lithofacies of the analysed samples at the
outcrop locations are shown in Figs. 5.1-5.7. The visited outcrops were assigned to the
already established formations by previous workers. Detailed logging was not carried out
especially in the western Sabah areas beacause much detailed sedimentological
information has been recorded by previous workers (e.g. Tongkul, 1994; William et al.,
2003; Jackson et al. 2009, Hutchison, 2005; Tan, 2010). Selected sedimentological logs are
presented in this section to describe the main lithofacies of the studied formations.
5.2.1 Tukau Formation
The Tukau Formation is well exposed in the Sungai Ukong area, in South Miri
District. Three lithofacies associations were identified which includes fluvial channel,
crevasse splay and flood plain associations.
Fluvial Channel facies association is characterized by structureless massive and
trough cross stratified sandstone facies with small scale trough cross stratification that is
often associated with parallel lamination at the top of the sequence and erosive base. Flood
plain facies association is characterized by carbonaceous mudstone and sandstone facies
with dispersed organic matter in the form of amber. Amber is fossilized resin or gum

48
produced by plants. The association of amber in the Tukau sandstone and mudstone
indicate terrestrial origin which suggests that there was a swamp close by to the
sedimentary environment. The Crevasse Splay facies association is characterized by
parallel laminated sandstones with mudstones interbeds. . This lamination indicates an
abrupt change in energy in the channels where the fine grained sediments in suspensions
are deposited as lamina.
From field observations (Plate 5.1) and lithofacies analysis, it is apparent that the
Tukau sequence in the study area was deposited by means of tractive processes by a river
system. This indicates a fluviatile environment of deposition. This fluviatile environment is
further supported by the presence of sedimentary structures and total absence of marine
fossils as described in the stratigraphic log section (Figure 5.1). The sedimentary structures
present are channels, graded beddings, cross beddings and laminations which were formed
in a fluvial environment especially a meandering stream.

49
Figure 5.1 Log of Tukau Formation at Sungai Ukong Locality
Facies Description Facies Association/
Environment
Parallel laminated
sandstone.
Bioturbation is absent
Crevasse Splay
Carbonaceous sandstone
and mudstones associated
with resins. Bioturbation is
absent
Flood plain
Parallel laminated and
cross stratified sandstone.
Bioturbation is absent
Crevasse Splay
Massive mudstone Flood plain
Parallel and cross stratified
sandstone with erosive
base.
Bioturbation is absent
Fluvial Channel
Carbonaceous mudstone.
Bioturbation is absent
Flood plain
Paralllel laminated
sandtone
Crevasse Splay
Massive structureless
sandstone
Fluvial Channel
Carbonaceous mudstone
with plant rootlets
Flood plain
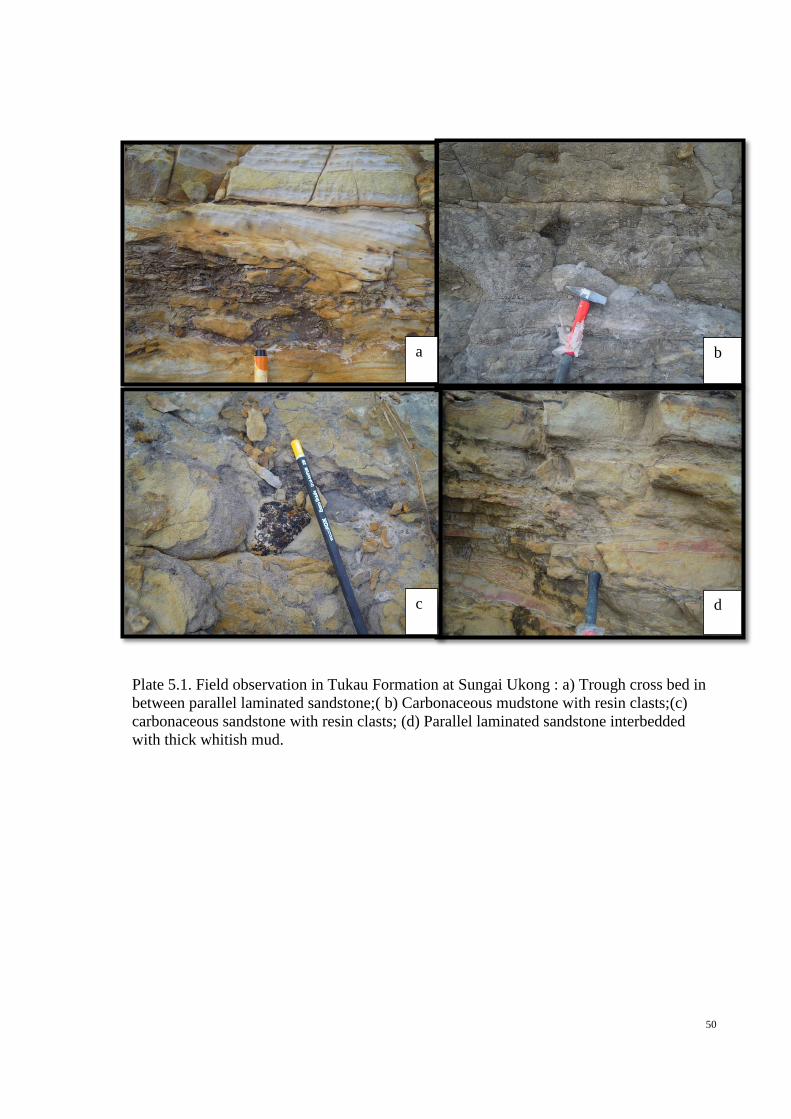
50
a b
c d
Plate 5.1. Field observation in Tukau Formation at Sungai Ukong : a) Trough cross bed in
between parallel laminated sandstone;( b) Carbonaceous mudstone with resin clasts;(c)
carbonaceous sandstone with resin clasts; (d) Parallel laminated sandstone interbedded
with thick whitish mud.

51
5.2.2 Miri Formation
The studied Miri Formation is well exposed in the coastal part of Miri-Bitulu
coastal road. Nine facies were recognized from the studied Miri Formation and
characterized based on the integration of sedimentological and field observations. These
facies have been grouped into four facies association which are intertidal, tidal channel,
bay head delta, and shore face lithofacies associations.
The identified bay head delta facies association is characterized by massive gravely
sandstone facies with abundant lignite clasts. The bay-head delta is the zone where fluvial
processes are dominant. As the river flow enters the central lagoon it decelerates and
sediment is deposited. The form and processes of a bay-head delta will be those of a river-
dominated delta because the tidal effect is minimal and the barrier protects the central
lagoon from strong wave energy (Dalrymple et al, 1992). A coarsening-up, progradational
succession will be formed, with channel and overbank facies building out over sands
deposited at the channel mouth, which in turn overlies fine-grained deposits of the central
lagoon. The estuarine association which is made up of tidal channel and intertidal facies
associations is characterised by distinct and diagnostic tidal signatures –tidal dune cross
bedding with mud draped cosets and foresets including mud couplets, bidirectional
(herringbone) cross bedding, rhythmic stratifications, and wave bedding. The tidal
estuarine deposits represent the early phase of a significant relative seal level rise, and
possibly reflect a southward migration of the paleo Miri shoreline. This phase is also
characterized by great wave actions coinciding with abrupt sea level rising, which resulted
in the deposition of several tempestites (subtidal sandwaves) at estuary mouth. The
shoreface association is represented by hummocky cross stratified sandstones, bioturbabted
sandstones and associated mudstones. They must have been developed as a result of
complete drowning event of the estuarine system which represents the final phase of
transgressive system. According to previous works, shallow marine deposits in the south

52
Miri area represents the upper portion of the exposed Miri Formation, which was possibly
deposited during stable high and slowly falling sea level (Tan et al., 1999; Lesslar and
Wannier 2001; Abeida et al., 2005).
Based on the facies analysis, trace fossils,and sedimentary structures the
environment of deposition of the studied Miri Formation is shallow marine (lower
shoreface) to tide dominated estuary. The tide-dominated estuary system of the Miri
Formation has been interpreted as open-end tide-dominated estuary includes a variety of
sub-environments; tidal channels and bars of estuary mouth, estuarine-upper flow regime
sand flat, and restricted tidal flats. The estuarine succession has been interpreted to have
been formed during an early transgressive event, representing the lower portion of the
investigated Miri section (Tan et al., 1999; Hutchison, 2005). The shallow marine deposits
combined to form coarsening-upward, wave-and storm parasequence sets, which were
formed during late transgressive event (offshore transition and lower shoreface) which is in
agreement with Abeida et al. (2005).

53
Figure 5.2. Summarised Log of identified facies in the studied Miri Formation at the
coastal areas of Miri.
Facies Description Facies Association/
Environment
Very coarse sandstone
associated with coal.
Bioturbation is absent
Bay Head Delta
Coarse sandstone associated
with coal. Bioturbation is absent
Bay Head Delta
Sand dominated heterolithic
sequence showing wavy
bedding. Biotubation is minor
Intertidal
Fine to medium grained
sandstone associated with cross
ripples and herringbone
stratification. Bioturbation is
moderate
Subtidal
Sand dominated heterolithic
sequence. Bioturbation is minor
Intertidal
Fine to coarse sandstone with
coal and mudclast. Bioturbation
is minor. Erodes into lower
mudstone
Tidal Channel
Hummocky cross stratified
sandstone
Shoreface

54
Plate 5.2 Field observation in studied Miri Formation at outcrops along Miri-Bintulu
coastal road: a) ripple drift feature in sand dominated heterolithic sequence .b) Hummocky
cross stratification in sand bed (highlighted by black arrow).c) mud drapes associated with
trough cross bed facies.d) Fine grained sandstone with mud clast in outcrop. e) bi
directional current sedimentation displayed by herringbone in studied Miri Formation
outcrop.
a b
c d
e f
d

55
5.2.3 Lambir Formation
The studied Lambir Formation is located in Lambir Hills National park area and
Miri-Bitulu coastal road. Nine lithofacies were identified from the outcrops of the Lambir
Formation based on the lithology, sedimentary structures, trace fossils and bed geometry
which includes laminated mudstone facies, nodular mudstone facies, carbonaceous facies,
heterolithic sequences, and cross laminated facies. These lithofacies has been grouped into
intertidal, subtidal, tidal channel and fluvial channel facies associations.
The intertidal mudflat is an environment where there is more deposition of muds
through suspension than bedload deposition and is associated with parallel laminated
mudstones and nodular mudstones. The parallel laminated mudstone facies is characterized
by light grey to light brown mudstone with light grey silty laminations of few centimeters
thick. The boundaries of the mudstone and silty laminations are characterized by minor
trace fossils. Nodular mudstone facies is grey in color with nodular siderite concretion and
lack of biotubation toward the base. The texture varies from structureless mainly thicker
beds, through weakly to strongly laminated very fine sand streaked towards the upper part
of the bedding. Siderite concretions within the mudstone layer associates with this facies
(Figure 5.3). Siderite concretion formed from the chemical precipitation of iron in a
reducing environment. Chemical precipitation of iron and carbonate were preferred in a
limited amount of water and oxygen circulation which is isolated for the formation of
siderite nodules (Pearson, 2005). It may indicate abundance of iron present in the area.
This facies suggest a short-lived phase of low energy condition during which mud and silt
were deposited alternately by slack water and current wave action respectively.
The intertidal mix-flat indicates alternation of bedload transport during current flow
and the settling of suspended load during periods of slack waters, a short period during
high or low tide when the current changes direction makes mud to settle from suspension.
This is associated with heterolithic sequences which are characterized by regular
56
alternation of sandstone and mudstone with wavy bedding. The thickness of the sandstone
range from 5cm-30cm, especially in sand dominated heterolithic sequence. The sand
dominated heterolithic sequence consists of thin, horizontal fine grained sand and silt
layers alternating with clay layers and characterized by dispersed to lamination of organic
debris. The sand fraction is more than 50%.
The subtidal environment is associated with parallel laminated sandstones, trough
cross stratified sandstones with mud drapes, and ripple cross laminated sandstones. The
fining upward parallel laminated sandstone facies sequence is characterized by parallel
laminations at the upper part, faint trough cross stratification was observed in the lower
part of the sequence. Trace fossils increases from bottom to top. Minor amount of
carbonaceous layers are present and occur as thin laminations. Discontinuous mud drapes
occur in the sandstone as well. Tiny holes can be found as a result of weathering and the
lamination can be wavy due to relief. Trough cross stratified sandstone facies is
characterized by light brown, fine –medium grained sandstone with medium scale trough
cross bedding, blocky and with a sharp base. The thickness of this facies is up to several
meters across. Thin mud and lignite laminations are common throughout with coal clasts.
Trace fossils with irregular margins filled with muds or organic matter are abundant.
Trough cross bedding are formed by the migration of subaqueous dunes. This bedforms
could be deposited by tidal influenced channels at the outer margin. They were deposited
during periods when bedload movement ceased. The hardened muds were ripped off
fromthe surface and formed detrital mud clasts when the tidal environment were
reactivated. Ripple cross laminated sandstone facies is dominated by climbing
assymetrical ripple lamina and thin muddy lamina. It is often found in the upper section
associated with planar and cross laminated beds. The presence of ripple lamination
indicated the environment was exposed to seasonal flooding.

57
Tidal Channel is associated with inclined heterolithic strata characterised by
alternating sandstone/mudrock; sandstone beds (25-40cm) thick with ripples, horizontal
lamination, wavy bedding, some cross beds; tops of beds can have straight crested
symmetrical ripples. Laminated silt beds are (1–10 cm) thick; sandstone makes up 20–90%
fine to lower medium sand. Burrows are abundant. Surfaces are inclined up to 12 degrees.
Some part of the surfaces is overlain by continuous mud drapes. This suggests deposition
in a tidal point bar part of the channel.
Fluvial channel deposit is characterized by massive lunate trough cross bedded
sandstone with scouring and erosive base into the underlying mudstones. In some part
shows normal grading with no structure observed which might be due to weathering.
The proposed depositional environment for the studied Lambir formation is a tide
dominated estuary. An estuary is the marine influenced portion of a drowned valley
(Dalrymple et al. 1992). A drowned valley is the seaward portion of a river valley that
becomes flooded with seawater when there is a relative rise in sea level. Tide dominated
estuaries receive sediment both from river at the head of the estuary, and from the adjacent
shelf by tidal currents. The depositional environment interpretation is in good agreement
with previous workers (e.g Tan et al., 1999; Kessler, 2000).
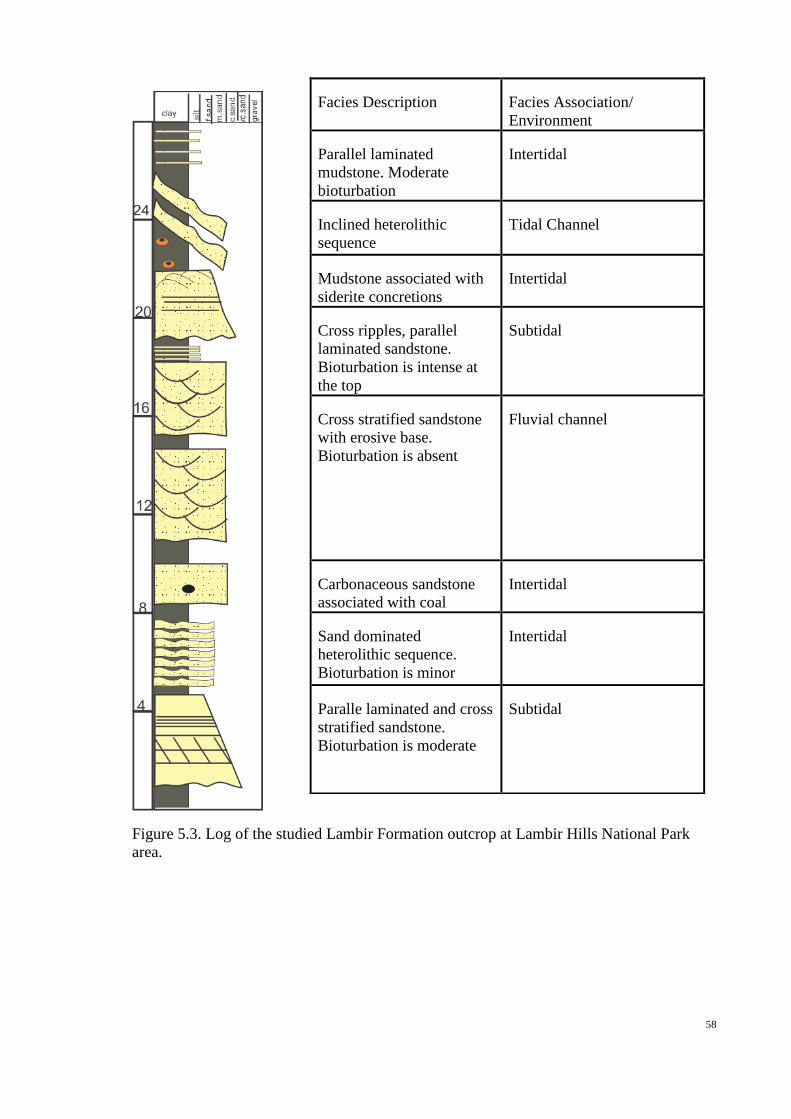
58
Figure 5.3. Log of the studied Lambir Formation outcrop at Lambir Hills National Park
area.
Facies Description Facies Association/
Environment
Parallel laminated
mudstone. Moderate
bioturbation
Intertidal
Inclined heterolithic
sequence
Tidal Channel
Mudstone associated with
siderite concretions
Intertidal
Cross ripples, parallel
laminated sandstone.
Bioturbation is intense at
the top
Subtidal
Cross stratified sandstone
with erosive base.
Bioturbation is absent
Fluvial channel
Carbonaceous sandstone
associated with coal
Intertidal
Sand dominated
heterolithic sequence.
Bioturbation is minor
Intertidal
Paralle laminated and cross
stratified sandstone.
Bioturbation is moderate
Subtidal
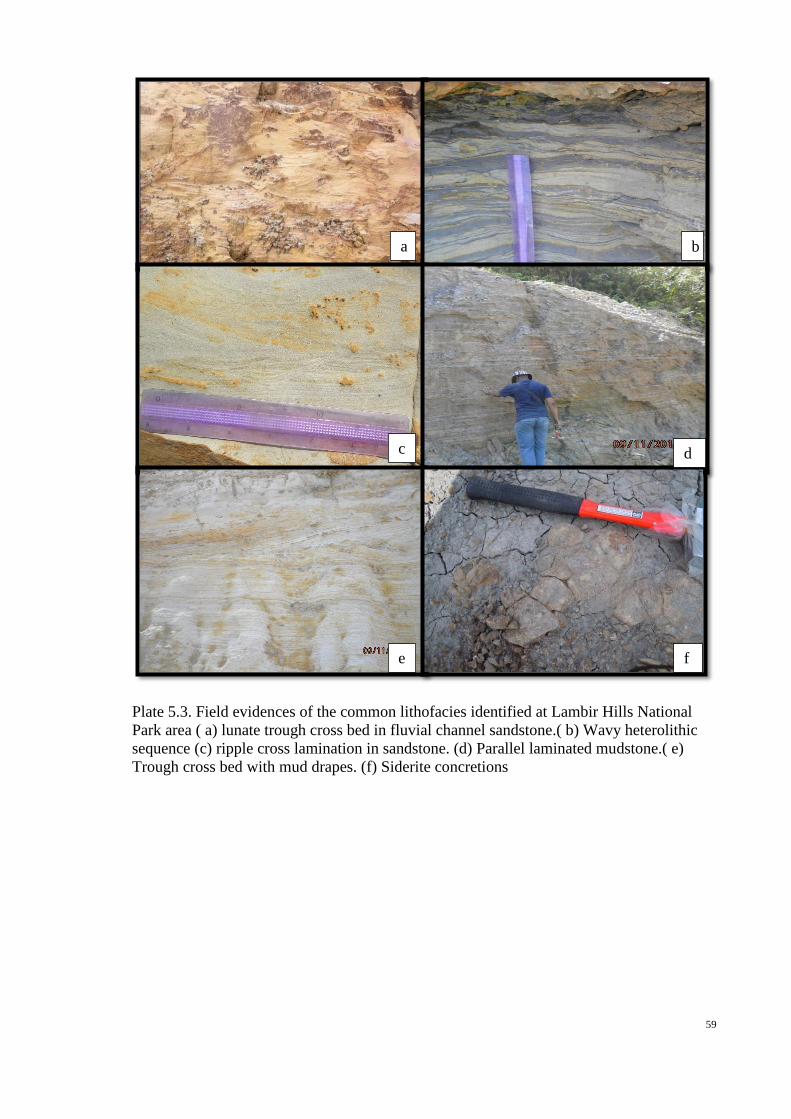
59
Plate 5.3. Field evidences of the common lithofacies identified at Lambir Hills National
Park area ( a) lunate trough cross bed in fluvial channel sandstone.( b) Wavy heterolithic
sequence (c) ripple cross lamination in sandstone. (d) Parallel laminated mudstone.( e)
Trough cross bed with mud drapes. (f) Siderite concretions
a b
c d
e f
60
5.2.4 Belait Formation
The Belait Formation in western Sabah has been well studied and interpreted as the
product of one relatively large deltaic system, the Champion Delta (e.g. Hutchison, 2005;
Tan, 2010; Lambiase and Cullen, 2013)
The lithofacies of the Belait Formation consist of sandstones, mudstones and
conglomerates associate with coal debris. Batu Luang section includes a wide range of
environments in the vertical succession (Fig 5.4) ranging from fluvial channel, distributary
channels and tidal flats. The fluvial deposits consist of conglomerate with lenses of
sandstone and mudstones. No trace fossils were found in the conglomerates. The poorly
sorted clast supported conglomerates with sub-angular to rounded clasts in a matrix of fine
sand and mud is also associated with coaly debris (Figure 5.4) . The preserved section
above the fluvial deposits as seen in the Batu Luang section is interpreted as deltaic
deposits comprising distributary channels, mouth bar sands, interdistributary deposits and
prodelta sediments. The prodelta shale associated with coaly debris is capped with tidal flat
sediments. Tidal flat deposits is associated with parallel laminated sandstones, sand
dominated heterolithics, cross beddings with mud drapes. Distributary channels are
associated with cross bedded and parallel laminated sandstones with gravely lag base.
Interdistributary bay consists of thick bedded mudstone with thin layer of fine sandstone.
Mouth bar is associated with parallel-laminated and massive fine sandstones. Bioturbation
is common in the coastal plain deposits.

61
Figure 5.4. Summary Log of Belait Formation in Batu Luang showing wide range of
depositional environments
Facies Description Facies Association/
Environment
Trough crossbedded sandstone. Bioturbation is
sparse
Distributary Channels
Interbedded thin sandstone and thick mudstone.
Bioturbation is sparse
Tidal Flat
Heavily bioturbated sandstone (Ophiomorpha)
Wavy heterolithic sequence
Channelized sandstone with mud clasts Tidal Channel
Massive mudstone with coaly tree trunk Prodelta
Parallel laminated sandstone with heavy
bioturbation at the base
Mouth Bar
Channelized sandstone eroding the lower
mudstone
Trough cross bedded sandstone . Bioturbation is
sparse
Distributary Channels
Parallel laminated sandstone. Bioturbation is
heavy
Trough cross bedded sandstone
Interbedded thin sandstone and thick mudstone.
Bioturbation is moderate
Interdistributary Bay Deposit
Unexposed
Thick Mudstone with thin beds of coarse to fine
sandstone. Associated with coal and resins.
Bioturbation is absent
Flood plain
Very coarse sandstone to grain supported
conglomerate. Associated with coal.
Bioturbation is absent
Fluvial Channel (Braided
Stream)

62
a
b c
d e
f g
Plate 5.4. Field Observation of Belait Formation in Batu Luang part of Klias Peninsula; a)
outcrop view ; b) tidal flat deposits; c) cross bedded distributary channel; d)
interdistributary bay deposit; e) braided stream deposit with coal lenses; f) prodelta deposit
(associated with allochthonous tree trunks) ; g) gravelly base of distributary channels.

63
5.2.5 Meligan Formation
There are many descriptions for the typical Meligan Formation (e.g Hutchison.
2005; Tan, 2010). For this study, Meligan Formation was identified based on description
with reference to Hutchison (2005). The characteristics of Meligan Formation was
discussed in Section 2.2.2.3.
The studied Meligan Formation outcrop that is exposed in major quarries in
Sipitang area consists of massive sandstones and shales, laminated mudstones, organic
rich-laminated sandstones and mudstones associated with siderite concretions. These facies
are interpreted to be associated with lower delta plain. There is a suspected facies transition
from the shallow marine Setap Shale to Meligan Formation which is characterized by
onlapping and change in dip direction as observed in Sabah Forestry Quarry (Fig.5.5).
This facies transition in the Early Miocene has been well described by previous workers
(e.g Hall, 2013; Lambiase and Cullen, 2013).
5.2.6 Temburong Formation
The Temburong Formation commonly refered to as the muddy facies transition of
the West Crocker Formation is exposed in the Sipitang –Tenom areas of Sabah (Hutchison,
2005). The outcrops are not well preserved due to the low resistance shales. The beds are
steeply dipping and calcite veins are common, thus suggests brittle deformation in the
Temburong Formation.
The lithofacies consists of dominantly thick shale and interbeded with thin
sandstones. This section shows less turbiditic structure.The prevalent Bourma Sequences
are Td and Te (massive mudstone and parallel laminated fine sandstones). This rock
sequence is interpreted as a distal (outer lobe) of a submarine fan. The deep water
environment interpretation is also supported by the presence of Paleodictyon ichnofossils
and other neritics burrow tracks (Plate 5.6).

64
Figure 5.5 Log of Meligan Formation/Setap Shale? at SFI quarry in Sipitang.
Facies Description Facies Association
/Environment
Massive structureless
sandstone
Channels
Interbedded mudstone and
thin sandtone
Flood Plain?
Parallel laminated
sandstone
Levees
Massive mudstone
associated with siderite
concretions
Swamp?
Interbedded mudstone and
sandstone
Levees
Massive structureless
sandstone onlapping into
the lower mudstone
Channels
Massive Mudstone
Different dip angle
Shallow Marine?
Setap Shale?

65
Plate 5.5. Field Observation of Meligan Formation in Sipitang area. a) Outcrop view of
steeply dipping sandstone and mudstones beds; b) laminated sandstone with abundant
carbonaceous materials (full view); c) laminated sandstone with abundant carbonaceous
materials (close view); d) mudstone with abundant sideritic concretions.
a
a
a
b
c d
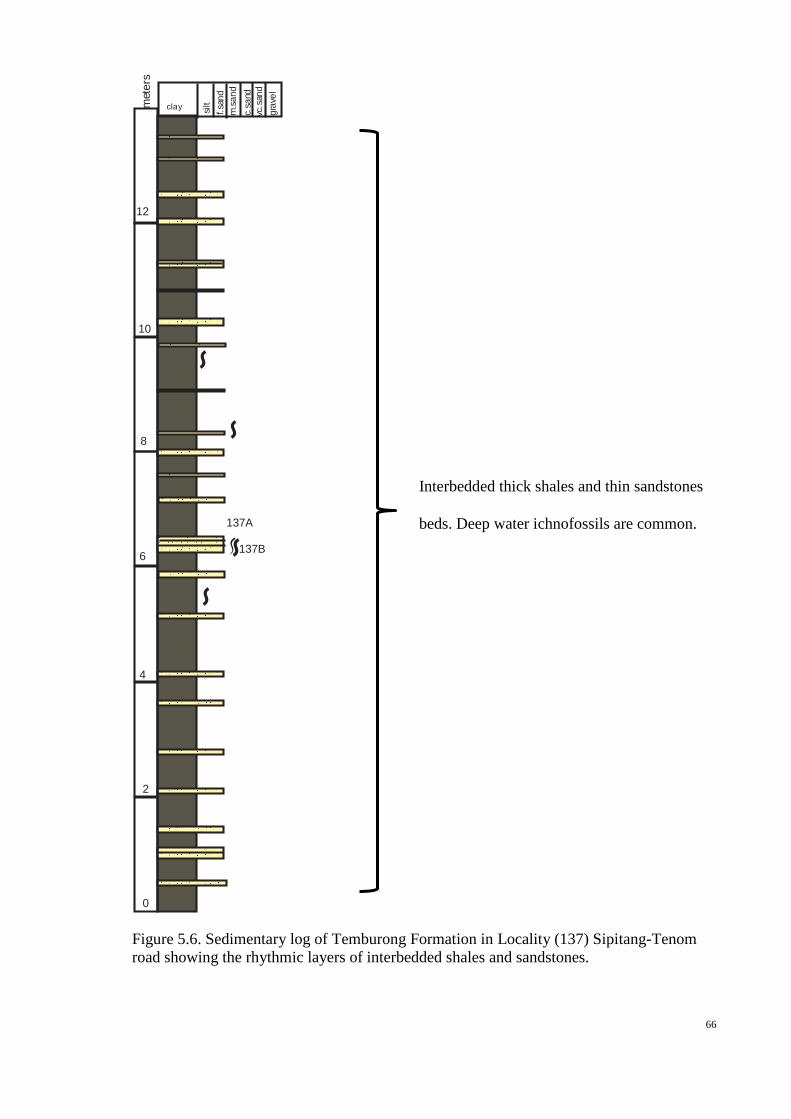
66
Figure 5.6. Sedimentary log of Temburong Formation in Locality (137) Sipitang-Tenom
road showing the rhythmic layers of interbedded shales and sandstones.
137A
137B
2
0
4
6
8
10
12
clay silt
f.sa
nd
m.s
and
c.sa
nd
vc.s
and
gra
vel
met
ers
Interbedded thick shales and thin sandstones
beds. Deep water ichnofossils are common.

67
Plates 5.6. Field observation in Locality (137) Sipitang-Tenom road representing the
Temburong Formation; a) Outcrop view of steeply dipping thick shale and thin sandstone
beds; b) laminated sandstone; c)Paleodictyon ichnofossils and burrows tracks bed; d)
vertical and horizontal burrows in shale beds ;e) brittle deformation in the shales.
a
b c
d e
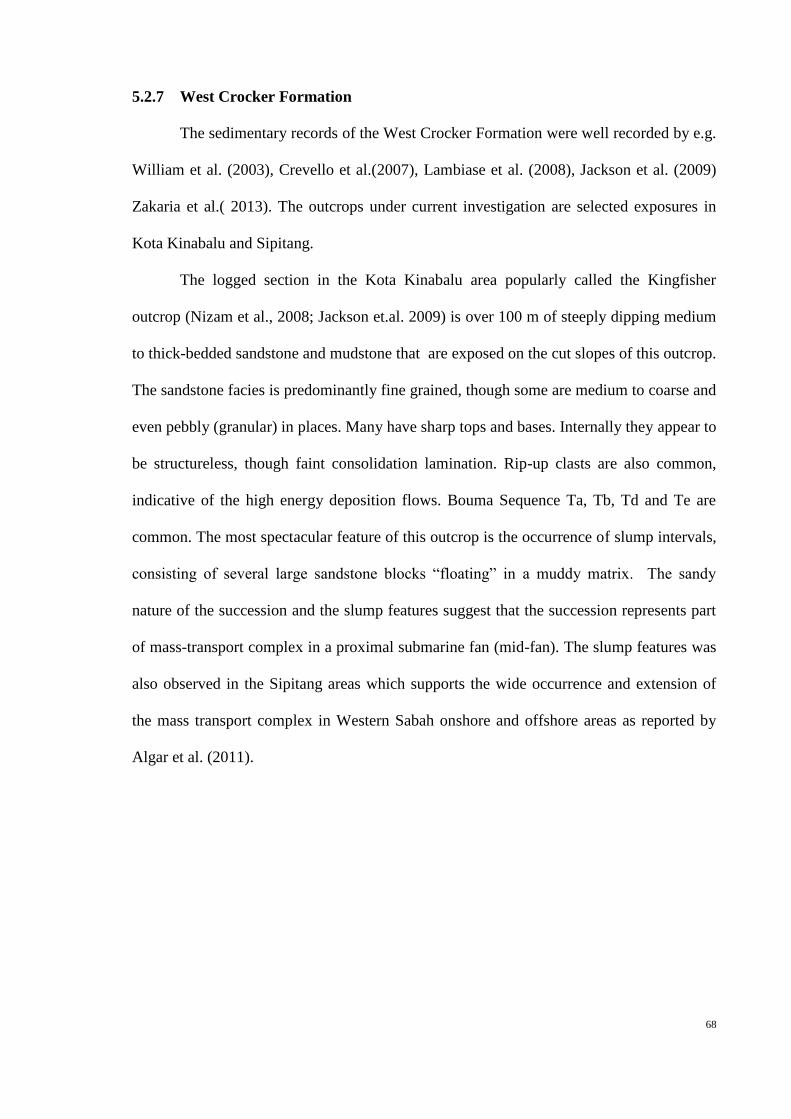
68
5.2.7 West Crocker Formation
The sedimentary records of the West Crocker Formation were well recorded by e.g.
William et al. (2003), Crevello et al.(2007), Lambiase et al. (2008), Jackson et al. (2009)
Zakaria et al.( 2013). The outcrops under current investigation are selected exposures in
Kota Kinabalu and Sipitang.
The logged section in the Kota Kinabalu area popularly called the Kingfisher
outcrop (Nizam et al., 2008; Jackson et.al. 2009) is over 100 m of steeply dipping medium
to thick-bedded sandstone and mudstone that are exposed on the cut slopes of this outcrop.
The sandstone facies is predominantly fine grained, though some are medium to coarse and
even pebbly (granular) in places. Many have sharp tops and bases. Internally they appear to
be structureless, though faint consolidation lamination. Rip-up clasts are also common,
indicative of the high energy deposition flows. Bouma Sequence Ta, Tb, Td and Te are
common. The most spectacular feature of this outcrop is the occurrence of slump intervals,
consisting of several large sandstone blocks “floating” in a muddy matrix. The sandy
nature of the succession and the slump features suggest that the succession represents part
of mass-transport complex in a proximal submarine fan (mid-fan). The slump features was
also observed in the Sipitang areas which supports the wide occurrence and extension of
the mass transport complex in Western Sabah onshore and offshore areas as reported by
Algar et al. (2011).

69
Figure 5.7. Sedimentary log of West Crocker Formation in Locality (145) KK, popularly
known as the kingfisher outcrop.
Facies Description Facies Association/ Environment
Fining upward sandstones with
mudclasts
Channelized Slope
Slump (“floating” sandstone in a shaly
matrix)
Parallel laminated sandstone associated
with coal
Coarse grained sandstone
Fining upward parallel laminated
sandstone with mud clast
Parallel laminated sandstone
Coarse grained sandstone
Interbedded sandstone and shales
associated with slumps
Wavy laminated sandstone with mud
clast
Interbedded sandstone and shales
associated with slumps
Massive structureless sandstone

70
Plate 5.7. Field observation of West Crocker Formation, a)outcrop view of the sandy
dominated turbiditic sequences in KK; b)slump deposits; c) flute marks at the base of
sandstone in Sipitang ; d) massive structureless sandstone bed typical of high density
turbidites; e) laminated sandstone facies associated with resinous coaly layers in KK.
a
b c
d e
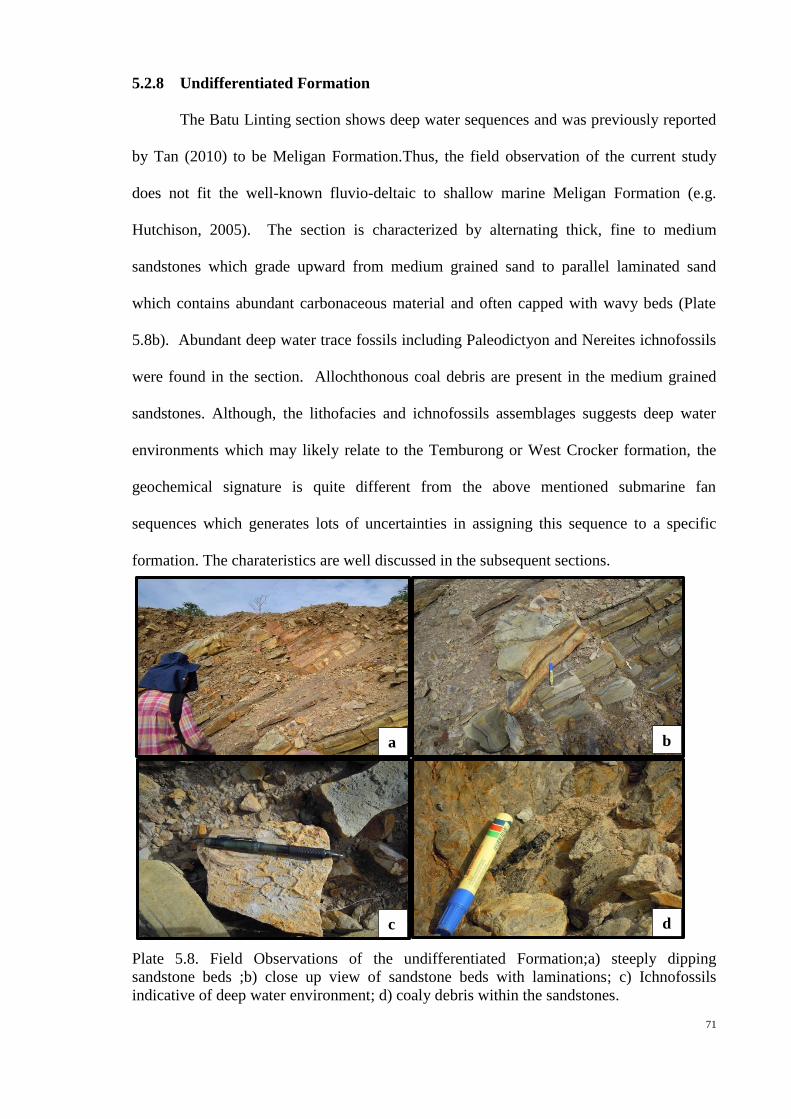
71
a b
c d
5.2.8 Undifferentiated Formation
The Batu Linting section shows deep water sequences and was previously reported
by Tan (2010) to be Meligan Formation.Thus, the field observation of the current study
does not fit the well-known fluvio-deltaic to shallow marine Meligan Formation (e.g.
Hutchison, 2005). The section is characterized by alternating thick, fine to medium
sandstones which grade upward from medium grained sand to parallel laminated sand
which contains abundant carbonaceous material and often capped with wavy beds (Plate
5.8b). Abundant deep water trace fossils including Paleodictyon and Nereites ichnofossils
were found in the section. Allochthonous coal debris are present in the medium grained
sandstones. Although, the lithofacies and ichnofossils assemblages suggests deep water
environments which may likely relate to the Temburong or West Crocker formation, the
geochemical signature is quite different from the above mentioned submarine fan
sequences which generates lots of uncertainties in assigning this sequence to a specific
formation. The charateristics are well discussed in the subsequent sections.
Plate 5.8. Field Observations of the undifferentiated Formation;a) steeply dipping
sandstone beds ;b) close up view of sandstone beds with laminations; c) Ichnofossils
indicative of deep water environment; d) coaly debris within the sandstones.

72
5.3 Organic Petrographic Data
The organic petrological studies performed include maceral analysis, vitrinite
reflectance and visual kerogen typing (palynofacies analysis). This study was carried out to
evaluate the quality and thermal maturity of organic matter using microscopic observation.
The integration of petrographic with geochemical data are discussed in the next chapter.
5.3.1 Maceral Analysis
Maceral analysis was carried out on selected samples to investigate the occurrence
and type of organic matter present in the deltaic and submarine fan sequences.
Reflected light microscopy indicates that the deltaic sequences contain phytoclasts
(dispersed organic matter) and mineral matter (Plate 5.9). The phytoclasts is made up
predominatly of vitrinitic material with low –common occurrence of liptinite and inertinite
macerals (Table 5.1). The liptinite was identified by their different fluorescence intensity in
ultra violet light and their morphological characteristcs (Plate 5.9 c-f). The common
liptinites in the studied deltaic sequences samples are cutinite, suberinite, sporinite and
bituminite, which were characterised by bright yellow to yellow and orange fluorescence
(Plate 5.9 c-f). Resinite, bituminite and amorphous organic matter is the common liptinite
maceral in the submarine fan sequences (Plate 5.10 c-g). The Temburong formation
samples shows weaker fluorescence compared to the intense fluorescing samples from the
undifferentiated formation in Batu Liting which suggests high level of thermal maturity of
the Temburong Formation.

73
Table 5.1. Organic petrology results including palynofacies (under transmitted light (%),
kerogen composition (under reflected light (%) and thermal maturity indicators (vitrinite
reflectance measurements (%Ro
%Ro: vitrinite reflectance, Phy: phytoclast, AOM: amorphous organic matter, Paly: palynomorphs
(spores+pollen), Vit: vitrinite, Lip: liptinite, Ine: inertinite, Min. Mat.: mineral matter
Samples %Ro
Palynofacies (%) Kerogen composition (%)
Formation Phy AOM
Paly
Vit Lip Ine Min.
Mat.
Deltaic Sequences
Lambir
L-02-SS 0.41 86 4 10 33 10 2 55
L-03-SH 0.39 90 3 7 30 5 5 60
L-05-SS 0.42 89 2 9 33 5 2 60
L-07-SH 0.45 89 5 6 32 6 2 60
L-14-SH 0.41 89 4 7 35 5 5 55
Miri
M-01-SH 0.48 88 4 8 25 3 10 62
M-03-SH 0.42 86 4 10 25 5 5 65
M-05-SH 0.43 87 4 9 30 3 7 60
M-08-SH 0.41 92 2 6 35 5 5 55
M-11-SS 0.45 88 3 9 35 5 7 53
Tukau
T-01-SS 0.41 88 2 10 30 5 2 63
T-03-SH 0.45 88 2 10 35 5 3 62
T-04-SH 0.42 90 2 8 35 5 5 60
T-08-SH 0.43 86 4 10 35 3 5 57
T-10-SS 0.42 83 6 9 40 5 5 50
Belait
BL-A2-SH 0.46 86 6 8 25 5 5 55
BL-A3-SH 0.44 86 6 8 30 5 10 55
BL-A5-SS 0.45 88 4 8 30 5 7 58
BL-A6-SS 0.46 90 3 7 20 5 5 60
BL-A7-SH 0.43 89 4 7 20 5 5 60
BL-B1-SH 0.44 86 4 10 22 5 5 68
BL-C2-SH 0.45 84 6 10 30 3 10 57
Meligan
ME-130B-SH 0.87 88 4 8 20 5 5 70
ME-130C-SS 0.74 86 6 8 25 5 5 65
ME-130F-SH 0.69 88 4 8 25 5 5 55
ME-133A-SS 0.72 88 4 8 30 5 5 60
ME-134A-SH 0.71 88 2 10 30 10 5 55
Submarine Fan Sequences
Temburong
TE-137A-SH 1.08 60 35 5 15 4 1 80
TE-137B-SS 1.14 62 33 5 5 3 2 83
TE-140-SH 0.99 55 35 10 15 4 1 80
West Crocker
WC-129B-SH 0.79 58 35 7 25 7 1 67
WC-129E-MTD 0.82 48 40 12 30 15 1 54
WC-135B-SS 0.89 60 33 7 35 10 2 53
WC-144A-MTD 0.92 47 43 10 30 15 trace 55
WC-145B-MTD 1.14 46 42 12 35 15 trace 50
Undifferentiated
Formation UD-01-SS 0.46 65 30 5 30 10 5 55
UD-02-SS 0.49 55 40 5 20 10 5 60

74
Plate 5.9. Photomicrograph of common maceral constituents of the studied northwest
Sarawak formations. (a) and (b) vitrinite phytoclasts (VR) associated with Quartz (Q) and
clay minerals (Cl) under white light; (c) Yellow to greenish fluorescing cutinite (Cu)
associated with greenish fluorescing suberinite (Su); (d) Greenish fluorescing cutinite (Cu);
(e) Greenish fluorescing suberinite (Su); (f) Yellow fluorescing sporinite (Sp) associated
with resinite (Rs).

75
Plate 5.10. a) and b)weakly fluorescing bitumen stain around vitrinite rim in Meligan
sample c)and d) amorphous organic matter in Slump sample from West Crocker
Formation, e) and f) sparse vitrinite phytoclast and weakly fluorescing resinite in the
Temburong Formation sample, g) and h) Intense fluorescing bituminite in the
undifferentiated deep water sample from Klias Peninsula.
a b
c d
e f
g h

76
5.3.2 Palynofacies analysis
Combaz (1964) originally defined the term palynofacies to encompass the total
complement of acid-resistant organic matter recovered from a sediment or sedimentary
rock by palynological processing techniques, using hydrochloric acid and hydrofluoric
acid, as seen under a microscope. Powell et al. (1990) redefined the term as “a distinctive
assemblage of palynoclasts whose composition reflects a particular sedimentary
environment”. Tyson (1995), however, added that apart from reflecting a specific set of
environmental conditions it is also associated with a characteristic range of hydrocarbon-
generating potential.
The palynofacies classification terms used here follows that of Tyson (1995):
phytoclasts, opaques, (black debris), Amorphous organic matter (AOM) and
palynomorphs. Phytoclasts include structured terrestrial plants fragments such as cuticles,
wood tracheid and cortex tissues. The structure may be displayed, only faintly discernible
or suggested, sometimes merely by the fact that it is a membrane or filament that has a
clearly defined, non-amorphous outline (Batten, 1996). They are mainly derived from
terrestrial sources and they show high concentrations in places close to the parent flora,
near the mouth of rivers and in oxidizing conditions. Opaque (black debris) are made up of
oxidized brownish black to black coloured woody tissues including charcoal. They are
produced as a result of oxidation and natural pyrolysis on terrestrial plant tissues. AOM
includes all particulate organic materials that appear structure less with no cellular
structure preserved. They appear in different forms and are referred to as fluffy, granular,
fibrous, or membranous. AOM normally dominates sediments deposited in oxygen
deficient conditions and the increase of AOM indicates reducing conditions, distal dysoxic
– anoxic shelf and high marine productivity (Tyson, 1995; Batten, 1981, 1996).
Quantitative analysis of palynofacies in the studied formations is shown in Table
5.1. From the varying characters and distribution of the organic matter in the studied

77
sequences, four palynofacies types have been identified. Variation in the palynofacies
types and composition of the palynomorphs assemblage may provide information
regarding the depositional environments which is discussed in Chapter 6.
Palynofacies type I is dominated by structured phytoclast with an average relative
abundance of more than 80% structured and unstructured phytoclasts and an average
content of 5% for AOM. Palynomorphs are with an average of 10%. This assemblage is
related to proximal depositional conditions, with the main controlling factor being the short
transport of the particles. The phytoclasts are well preserved, translucent and structured
(mainly cuticles and tracheid). Palynomorphs though few, are mainly well preserved
spores and some pollen. This palynofacies type is common in the deltaic sequence.
Playnofacies type II is dominated by phytoclast more than 60% consisting of dominant
opaque, lesser transclucent phytoclast and AOM more than 30% Palynomorphs are less
than 10%. This occurs in most samples from Temburong and West Crocker Formation.
Palynofacies type III is mostly made up of AOM and phytoclast in relative
abundance. Opaque phytoclasts are more abundant than the transcluscent phytoclasts in
this type. Palynomorphs are less than 15% with minor occurrence of dinoflagellate. The
major type of AOM is possibly resins and this occurs in the slump facies within the West
Crocker Formation.

78
Plate 5.11. Photomicrograph of common palynofacies in the studied formations. a) opaque
and transclucent phytoclasts; b) structured woody phytoclasts; c) dinoflagellate macerated
from submarine fan deposits; d) amorphous resinous organic matter; e) spores; f) pollen.
50µm
50µm
50µm 50µm
50µm 50µm a b
c d
e f
79
5.3.3 Vitrinite Reflectance
Vitrinite reflectance values for main phase of oil generation ranges from (0.6-1.3)
%Ro and values greater than 2.0 %Ro indicate dry gas generation (Tissot and Welte, 1984;
Teichmüller et al., 1998; Killops and Killops, 2005). The vitrinite reflectance values for the
deltaic sequences range from 0.39-0.48 %Ro for Tukau, Miri, Lambir and Belait
formation samples while the values of 0.69-0.79 %Ro was recorded in the Meligan
Formation (Table 5.1). The submarine fan sequences shows vitrinite reflectance values in
the range of 0.99-1.14%Ro and 0.79-1.14%Ro (Table 5.1) for Temburong and West
Crocker formations respectively. The undifferentiated Formation has lower vitrinite
reflectance values compared to Temburong and West Crocker formations in the range of
0.46 -0.49 %Ro.The spatial distribution of vitrinite reflectance within the studied
formations is shown in Figure 5.8. See Appendix A for more information on the measured
vitrinite reflectance.
5.4 Organic Geochemistry
In this study organic geochemical analyses were performed to evaluate the organic
matter content, type and thermal maturity as well as to interpret depositional environment
conditions based on total organic matter content, pyrolysis, elemental and molecular
composition. Sixty-two samples were selected to represent the sandy, shaly and slump
facies within the studied formtions. Total organic carbon, source rock analysis, extractable
organic matter (EOM) and hydrocarbon yield of selected samples were used to identify
source richness in terms of hydrocarbon generation potential. These data are discussed in
the next chapter.

80
Figure 5.8. Map showing distribution of vitrinite reflectance in the western Sabah and northern Sarawak studied formations.

81
5.4.1 Extractable Organic Matter and Hydrocarbon Yield
A summary of the extractable organic matter (EOM) and petroleum yield is shown
in in Table 5.2. The total amount of EOM is high in the sandy and shaly facies of all the
deltaic sequences with average EOM concentration more than 1000ppm compared to most
samples from submarine fan sequences with average EOM concentration of less than 700
ppm. Some samples from the slump facies in West Crocker Formation and the
undifferentiated Formation have values over 1000 ppm. The concentrations of the
aromatic, aliphatic and NSO fractions from the EOM are shown in Figure 5.9. Aromatic
hydrocarbon fraction is higher than the aliphatic in all the analysed samples except for the
slump facies in the West Crocker Formation where the values of aromatic and aliphatic
yied are close. There are relatively high values of NSO fractions compared to total
hydrocarbons (aliphatic and aromatic) in the Tukau, Miri, Lambir, Belait samples which is
in agreement with the immature or the every early mature stage (Tissot and Welte, 1984)
5.4.2 Total Organic Carbon
Total Organic carbon (TOC) analysis was carried out to determine the amount of
organic matter. Most of the studied samples contain high organic matter content (TOC
>1.0 wt.%, Table 5.3). In terms of source rocks quantity, most of the studied samples have
relatively good TOC content (as defined by Peters and Cassa, 1994). There are variations
in TOC content relative to facies. In general, the sandy facies are found to have higher
TOC, when compared to the shaly facies, except in Temburong Formation where the TOC
content value is higher in the shales. The sandy facies have higher TOC values because
they are commonly associated with coals and carbonaceous debris. This is typical to
terrestrial and marginal depositional environment.

82
Figure 5.9. Concentrations of EOM fractions in the studied samples.
0
10
20
30
40
50
60
70
80
90
100
M-02-SH M-03-SH M-06-SH M-07-SH M-09-SH
Co
ncen
tra
tio
n (
%)
Miri Formation Aliphatic
Aromatic
NSO Compounds
0
10
20
30
40
50
60
70
80
90
100
T-03-SH T-04-SH T-06-SH T-07-SH T-09-SH
Con
cen
trati
on
(%
)
Tukau Formation Aliphatic
Aromatic
NSO Compounds
0
10
20
30
40
50
60
70
80
90
100
L-03-SH L-06-SH L-07-SH L-10-SH L-11-SH
Co
ncen
tra
tio
n (
%)
Lambir Formation Aliphatic
Aromatic
NSO Compounds
0
10
20
30
40
50
60
70
80
90
100
Co
ncen
tra
tio
n (
%)
Belait Formation Aliphatic
Aromatic
NSO Compounds
0
10
20
30
40
50
60
70
80
90
100
Co
ncen
tra
tio
n (
%)
Temburong Formation Aliphatic
Aromatic
NSO Compounds
0
10
20
30
40
50
60
70
80
90
100
Co
ncen
tra
tio
n (
%)
West Crocker Formation Aliphatic
Aromatic
NSO Compounds
0
10
20
30
40
50
60
70
80
90
100
UD-01-SS UD-02-SS
Co
ncen
tra
tio
n (
%)
Undifferentiated Formation Aliphatic
Aromatic
NSO Compounds
0
10
20
30
40
50
60
70
80
90
100
Co
ncen
tra
tio
n (
%)
Meligan Formation Aliphatic
Aromatic
NSO Compounds

83
Sample ID
TOC
(wt.%)
EOM
(wt.%)
EOM
(ppm)
ALI
(%)
ARO
(%)
NSO
(%)
ALI
(ppm)
ARO
(ppm)
NSO
(ppm)
HC
yield
(ppm)
Del
taic
Seq
uen
ce
Tukau Formation
T-03-SH 1.61 0.13 1320 15 35 50 198 462 660 660
T-04-SH 1.52 0.12 1204 15 35 50 181 421 602 602
T-06-SH 1.54 0.12 1220 14 34 52 171 415 634 586
T-07-SH 1.21 0.12 1240 16 30 54 198 372 670 570
T-09-SH 1.38 0.13 1308 15 35 50 196 458 654 654
T-01-SS 2.91 0.16 1580 14 36 50 221 569 790 790
T-10-SS 2.54 0.15 1450 16 32 52 232 464 754 696
Miri Formation 0
M-02-SH 1.14 0.13 1290 16 32 52 206 413 671 619
M-03-SH 1.06 0.13 1240 16 29 55 198 360 682 558
M-06-SH 1.14 0.13 1276 18 34 48 230 434 612 664
M-07-SH 1.24 0.13 1287 15 29 56 193 373 721 566
M-09-SH 1.59 0.13 1299 15 29 56 195 377 727 572
M-08-SS 2.32 0.11 1298 15 30 55 195 390 714 585
M-11-SS 2.54 0.12 1346 15 32 53 202 431 713 634
Lambir Formation 0
L-03-SH 1.28 0.12 1214 16 34 50 195 412 607 607
L-06-SH 1.07 0.13 1284 18 32 50 231 411 642 642
L-07-SH 2.76 0.14 1376 16 34 50 220 468 688 688
L-10-SH 1.45 0.11 1089 14 38 48 152 414 523 566
L-11-SH 1.62 0.11 1124 16 34 50 180 382 562 562
L-02-SS 11.11 0.35 3484 20 28 52 697 976 1812 1672
L-05-SS 3.45 0.18 1842 18 32 50 332 589 921 921
Belait Formation
BL-A2-SH 1.71 0.14 1420 20 32 48 284 454 682 738
BL-A3-SH 5.03 0.22 2210 19 29 52 420 641 1149 1061
BL-A5-SS 4.18 0.21 2082 18 33 49 375 687 1020 1062
BL-A6-SS 1.08 0.10 1005 18 31 51 181 312 513 492
BL-A7-SH 1.05 0.10 1030 18 34 48 185 350 494 536
BL-A8-SS 7.87 0.17 1654 16 32 52 265 529 860 794
BL-B1-SH 2.27 0.19 1850 17 31 52 315 574 962 888
BL-C2-SH 1.19 0.11 1050 17 25 58 179 263 609 441
Meligan Formation
ME-130B-SH 0.98 0.14 1420 18 39 43 256 554 611 809
ME-130C-SS 1.34 0.11 1053 15 45 40 158 474 421 632
ME-130F-SH 2.85 0.11 1070 17 43 40 182 460 428 642
ME-133A-SS 3.03 0.09 852 20 47 33 170 400 281 571
ME-133C-SH 1.77 0.20 1582 19 48 33 253 727 600 980
ME-134A-SH 2.42 0.16 1980 16 46 38 377 951 654 1328
Table 5.2. Extractable organic matter and hydrocarbon yield from the studied samples

84
Table 5.2. Extractable organic matter and hydrocarbon yield from the studied samples
(continuation).
TOC, total organic carbon content
EOM, extractable organic matter
ALI, aliphatic fraction
ARO, aromatic fraction
NSO, nitrogen, oxygen and sulphur compounds
HC yield, total hydrocarbon yield (aliphatic + aromatic)
Sample ID
TOC
(wt.%)
EOM
(wt.%)
EOM
(ppm)
ALI
(%)
ARO
(%)
NSO
(%)
ALI
(ppm)
ARO
(ppm)
NSO
(ppm)
HC
yield
(ppm)
Su
bm
ari
ne
Fan
Temburong Formation
TEM-137A-SH 1.10 0.03 420 16 56 28 99 147 174 246
TEM-137B-SS 0.51 0.04 445 14 57 29 76 211 158 287
TEM-138-SH 1.38 0.05 482 16 55 29 93 220 169 313
TEM-139-SH 1.26 0.03 483 14 53 33 96 188 125 284
TEM-139-SS 0.58 0.04 342 16 58 26 54 100 67 221
TEM-140-SH 0.71 0.03 381 13 55 32 89 176 116 265
West Crocker Formation
WC-129B-SH 1.23 0.07 698 15 58 27 105 405 188 510
WC-129E-MTD 2.26 0.18 1784 37 48 15 660 856 268 1516
WC-129D-MTD 1.73 0.16 1560 36 45 19 562 702 296 1264
WC-129F-MTD 2.40 0.19 1850 37 43 20 685 796 370 1480
WC-135B-SS 3.94 0.18 1058 14 63 23 148 667 243 815
WC-144A-MTD 10.63 0.42 4200 36 42 22 1512 1764 924 3276
WC-144B-SH 1.72 0.07 726 19 63 18 138 457 131 595
WC-145A-SS 0.65 0.08 456 22 65 13 166 491 98 358
WC-145B-MTD 6.32 0.41 4098 41 39 20 1680 1598 820 3278
WC-145C-SH 1.06 0.07 659 17 61 22 112 402 145 514
Undifferentiated Formation
UD-01-SS 2.27 0.15 1480 16 34 50 237 503 740 740
UD-02-SS 1.82 0.14 1360 18 38 44 245 517 598 762

85
5.4.3 Pyrolysis
5.4.3.1 Source Rock Analysis
In the pyrolysis analyses, free hydrocarbons (S1), the amount of hydrocarbon (S2)
and CO2 (S3) expelled from pyrolysis of kerogen are measured and the results are shown
in Table 5.3. The amount of hydrocarbon yield (S2) expelled during pyrolysis can be used
to evaluate the generative potential of the source rocks (Bordenave, 1993). Most of the
samples analysed have S2 yield less than 5.0 mg HC/g rock and this indicates poor to fair
hydrocarbon generative potential. However, some of the sandy and slump samples from
Lambir, Belait and West Crocker formation have S2 yield more than 5.0 mg HC/g rock
indicating good to very good hydrocarbon generative potential. In addition, Tmax values
which represents the temperature at the point where S2 peak is the maximum is also
determined (Espitalie et al., 1977). The Tmax values is higher in Meligan, Temburong and
West Crocker formations samples compared to Tukau, Miri, Lambir and Belait formations
samples (Table 5.3) and this is significant in determining the thermal maturity of the
studied samples. The hydrogen index (HI) values are generally less than 150 mg HC/g
TOC is most of the studied samples except for the samples from the slump facies in the
West Crocker Formation which show significant high HI values (up to 300 mg HC/g
TOC; Table 5.3). Hydrocarbon generative capacity depends on the quality (HIo; as defined
in Table 5.3) of organic matter in thermally immature source rocks (Peters et al., 2005).
However, petroleum generation decreases the remaining generative potential as measured
by present day HI. Thus, the need to reconstruct of original source rock generative
potential for thermally matured organic matter with respect to its original generation
potential in order to understand the true characteristics of the organic matter. Adopting
empirical equations from Banerjee et.al (1998) in relation to the Tmax (>435°C), the
corrected HI values are shown in Table 5.3. There are no much differences in the
characteristics of the organic matter in terms of hydrocarbon generative potential and

86
source rock quality after correction except from few samples from West Crocker
Formation.This parameter is combined with other parameters to give information of the
source rock quality present in all the studied formations and is further discussed in the next
chapter.
5.4.3.2 Py-GC
The pyrolysis products of the oil prone Type I and II kerogen extend out to the high
molecular weight range of compounds. Type I and II kerogen produces abundant lon-
chained n-alkenes, as shown by the prominent peaks in the pyrograms in the C 15 range. In
contrast, Type III kerogen shows the bulk of the pyrolysis products confined to the low
molecular weigh part of the pyrogram (Dembicki, 2009). The Py-GC pyrograms of most of
the analysed kerogen samples from Tukau, Miri, Lambir, Belait and West Crocker
formations are dominated by low molecular weight compounds relative to the homologous
series of n-alkane /alkene doublets as shown in Figure 5.10, these are characteristics of
Type III kerogen and typically gas prone. Temburong Formation shows Type IV kerogen
(Figure 5.10) fingerprints which may be due to the effect of low grade metamorphism on
the organic matter. It is interesting to note that the slump samples from the West Crocker
Formation display Type II kerogen with dominance of n-alkene/alkane doublets over
aromatic compound (Figure 5.10) which indicate oil proness. See Appendix B for the
quantitative data based on the peak height measurements of the Py-GC pyrograms.

87
Table 5.3 Bulk geochemical characteristics (TOC content , pyrolysis) of the studied
formations
Sample
ID
TOC
Wt.%
Pyrolysis (SRA) data
S1
(mg/g)
S2
(mg/g)
S3
(mg/g)
S2/S3
(mg/g)
Tmax
(°C) HI HI(o) OI PI GP
Deltaic Sequences
Lambir Formation
L-02-SS 11.11 0.14 10.21 3.78 2.70 426 92 - 34 0.01 10.35
L-03-SH 1.28 0.08 1.12 0.27 4.17 401 88 - 21 0.07 1.20
L-04-SS 6.57 0.09 6.51 1.97 3.30 413 99 - 30 0.01 6.60
L-05-SS 3.45 0.10 2.10 0.76 2.77 418 61 - 22 0.05 2.20
L-06-SH 1.07 0.04 1.03 0.25 4.19 421 96 - 23 0.04 1.07
L-07-SH 2.76 0.07 1.92 0.83 2.32 426 70 - 30 0.04 1.99
L-09-SH 1.38 0.04 1.06 0.43 2.48 410 77 - 31 0.04 1.10
L-10-SH 1.45 0.06 1.14 0.36 3.14 412 79 - 25 0.05 1.20
L-11-SH 1.62 0.13 1.18 0.45 2.60 418 73 - 28 0.10 1.31
L-14-SH 1.85 0.09 1.53 0.48 3.18 416 83 - 26 0.06 1.62
Miri Formation
M-01-SH 1.36 0.44 1.03 0.33 3.16 434 76 - 24 0.30 1.47
M-02-SH 1.14 0.13 1.12 0.31 3.64 429 98 - 27 0.10 1.25
M-03-SH 1.06 0.05 1.08 0.34 3.18 421 102 - 32 0.04 1.13
M-04-SH 1.12 0.04 1.08 0.29 3.71 432 96 - 26 0.04 1.12
M-05-SH 1.87 0.09 1.18 0.71 1.66 434 63 - 38 0.07 1.27
M-06-SH 1.14 0.21 1.19 0.41 2.90 416 104 - 36 0.15 1.40
M-07-SH 1.24 0.09 1.17 0.47 2.48 416 94 - 38 0.07 1.26
M-08-SS 2.32 0.05 1.91 0.65 2.94 413 82 - 28 0.03 1.96
M-09-SH 1.59 0.11 1.41 0.43 3.28 424 89 - 27 0.07 1.52
M-11-SS 2.54 0.16 2.12 0.66 3.21 426 83 - 26 0.07 2.28
Tukau Formation
T-01-SS 2.91 0.09 2.56 0.61 4.19 411 88 - 21 0.03 2.65
T-02-SH 1.24 0.05 1.23 0.31 3.97 423 99 - 25 0.04 1.28
T-03-SH 1.61 0.05 1.17 0.42 2.80 426 73 - 26 0.04 1.22
T-04-SH 1.52 0.09 1.18 0.41 2.88 429 78 - 27 0.07 1.27
T-06-SH 1.54 0.10 1.08 0.35 3.05 430 70 - 23 0.08 1.18
T-07-SH 1.21 0.18 1.20 0.34 3.54 430 99 - 28 0.13 1.38
T-08-SH 1.60 0.15 1.21 0.41 3.54 427 85 - 24 0.10 1.51
T-09-SH 1.38 0.08 1.06 0.41 2.56 428 77 - 30 0.07 1.14
T-10-SS 2.54 0.09 1.98 0.64 3.12 416 78 - 25 0.04 2.07
T-12-SH 1.26 0.06 1.20 0.33 3.66 420 95 - 26 0.05 1.26
Belait Formation
BL-A2-SH 1.71 0.03 0.31 0.76 0.41 435 18 20 45 0.08 0.34
BL-A3-SH 5.03 0.16 5.19 2.26 2.30 428 103 - 45 0.03 5.35
BL-A5-SST 4.18 0.09 5.29 1.07 4.94 426 126 - 26 0.02 5.38
BL-A6-SST 1.08 0.06 0.39 0.47 0.83 437 36 41 44 0.13 0.45
BL-A7-SH 1.05 0.02 0.25 0.55 0.45 431 24 - 53 0.08 0.27
BL-A8-SST 7.87 0.58 12.8 2.58 4.96 418 163 - 33 0.04 13.38
BL-B1-SH 2.27 0.27 3.18 0.59 5.39 431 127 - 23 0.08 3.45
BL-C2-SH 1.19 0.08 0.39 0.50 0.78 432 33 - 42 0.17 0.47
Meligan Formation
ME-130B-SH 0.98 0.04 0.2 - - 458 20 42 - 0.17 0.24
ME-130C-SS 1.34 0.03 0.25 0.42 0.60 460 19 40 32 0.11 0.28
ME-130F-SH 2.85 0.22 0.64 0.48 1.33 444 22 43 17 0.26 0.86
ME-133A-SS 3.03 0.07 1.99 0.49 4.06 452 66 78 16 0.03 2.06
ME-133C-SH 1.77 0.15 0.99 0.56 1.76 471 56 77 32 0.13 1.14
ME-134A-SH 1.90 0.19 1.05 - - 472 54 75 - 0.15 1.24

88
Table 5.3 Bulk geochemical characteristics (TOC content , pyrolysis) of the studied
formations (Continuation)
TOC: total organic carbon (wt. %)
S1: volatile hydrocarbon (HC) content, mg HC/g rock
S2: remaining HC generative potential, mg HC/g rock
S3: carbon dioxide yield, mgCO2/g rock
HI: hydrogen index = S2 100/TOC, mg HC/g TOC
OI: oxygen index = S3 100/TOC, mg CO2/g TOC; PI: production index = S1/ (S1 + S2)
GP: genetic potential=S1+S2
Tmax = Temperature at maximum generation
Ro= vitrinite reflectance
HIo= Original Hydrogen Index= HI. 1/ (a*exp.b*(Tmax -435))+HIo) (Banergee et al.,
1998)
Sample
ID
TOC
Wt.%
Pyrolysis (SRA) data
S1
(mg/g)
S2
(mg/g)
S3
(mg/g)
S2/S3
(mg/g)
Tmax
(°C) HI HI(o) OI PI GP
Submarine Fan Sequence
Temburong Formation
TE-137A-SH 1.1 0.07 0.59 0.17 3.47 492 54 60 15 0.11 0.66
TE-137B-SS 0.51 0.17 0.19 - - 497 37 40 - 0.47 0.36
TE-138-SH 1.38 0.03 0.32 0.35 0.91 487 23 29 25 0.09 0.35
TE-139-SH 1.26 0.02 0.22 - - 490 17 25 - 0.08 0.24
TE-139-SS 0.58 0.01 0.25 0.13 1.92 492 43 59 22 0.04 0.26
TE-140-SH 0.71 0.05 0.32 0.17 1.88 474 45 52 24 0.14 0.37
West Crocker Formation
WC-129B-SH 1.23 0.03 0.18 0.28 0.64 455 14 26 23 0.15 0.21
WC-129D-MTD 1.73 0.44 1.66 0.31 5.35 450 96 121 18 0.21 2.10
WC-129E-MTD 2.26 0.08 0.82 0.47 1.74 453 86 113 21 0.09 0.90
WC-129F-MTD 2.4 0.11 0.95 0.24 3.96 459 40 84 10 0.10 1.06
WC-135B-SS 3.94 0.07 4.69 0.44 10.66 465 119 211 11 0.01 4.76
WC-144A-MTD 10.63 0.09 35.83 0.52 68.90 463 337 387 5 0.00 35.92
WC-144B-SH 1.72 0.01 0.18 0.79 0.23 473 10 11 46 0.08 0.19
WC-145A-SS 0.65 0.01 0.03 0.29 0.10 515 5 6 44 0.14 0.04
WC-145B-MTD 6.32 0.06 3.25 0.46 7.07 503 151 282 7 0.02 3.31
WC-145C-SH 1.06 0.01 0.02 0.29 0.07 488 2 10 27 0.20 0.03
Undifferentiated Formation
UD-01-SS 2.27 0.27 3.18 0.59 5.39 431 127 - 33 0.08 3.45
UD-02-SS 1.82 0.05 2.03 0.42 4.83 434 111 - 30 0.06 1.87

89
Figure 5.10. Pyrograms of the studied formations showing quality of kerogen.
10.00 20.00 30.00 40.00 50.00 60.00 70.00
20000
40000
60000
80000
100000
120000
140000
160000
180000
200000
220000
240000
260000
T im e
R esponse_
Signal: L-072-3KEROG.D\FID1A.CHC6
C8
C9
C1
0
Ph
en
ol
Nap
hte
nic
Pri
st-1
-en
e
C1
2 C1
4
C1
6
C1
8
C1
7
C2
0
C2
2
C2
4 C2
8
C2
6
C3
0
C3
2
Tukau FormationT-03-SH
Gas prone
M-P
-xyl
ene
Tolu
en
e
5.00 10.00 15.00 20.00 25.00 30.00 35.00 40.00 45.00 50.00 55.00 60.00 65.00
20000
40000
60000
80000
100000
120000
140000
160000
180000
200000
220000
240000
Time
Response_
Sig na l: BL-A-3- KER OG.D \FID 1A.CHC6
C8
C9
C1
0
Ph
en
ol
Nap
hte
nic
Pri
st-1
-en
e
C1
2 C1
4 C1
6
C1
8C1
7
C2
0
C2
2
C2
4
C2
8
C2
6
C3
0
C3
2Miri Formation
M-01-SHGas prone
M-P
-xyl
ene
Tolu
en
e

90
Figure 5.10. Pyrograms of the studied formations showing quality of kerogen (cont.)
1 0 .0 0 2 0 .0 0 3 0 .0 0 4 0 .0 0 5 0 .0 0 6 0 .0 0 7 0 .0 0
1 0 0 0 0
2 0 0 0 0
3 0 0 0 0
4 0 0 0 0
5 0 0 0 0
6 0 0 0 0
7 0 0 0 0
8 0 0 0 0
9 0 0 0 0
1 0 0 0 0 0
1 1 0 0 0 0
1 2 0 0 0 0
1 3 0 0 0 0
1 4 0 0 0 0
1 5 0 0 0 0
1 6 0 0 0 0
1 7 0 0 0 0
1 8 0 0 0 0
1 9 0 0 0 0
T im e
R e s p o n s e _
S ig n a l : B L -B -1 K E R O G .D \ F ID 1 A .C H
C6
C8
C9 C1
0P
he
no
l
Nap
hte
nic
Pri
st-1
-en
e
C1
2
C1
4
C1
6
C1
8C1
7
C2
0
C2
2
C2
4
C2
8
C2
6
C3
0
C3
2
Lambir FormationL-02-SS
Gas prone
M-P
-xyl
ene
Tolu
en
e
5.00 10.00 15.00 20.00 25.00 30.00 35.00 40.00 45.00 50.00 55.00 60.00 65.00
20000
40000
60000
80000
100000
120000
140000
160000
180000
200000
220000
240000
Time
Response_
Sig na l: BL-A-3- KER OG.D \FID 1A.CHC6
C8
C9
C1
0
Ph
en
ol
Nap
hte
nic
Pri
st-1
-en
e
C1
2
C1
4 C1
6
C1
8
C1
7
C2
0
C2
2
C2
4
C2
8
C2
6
C3
0
C3
2
Undifferentiated FormationUD-01-SSGas prone
M-P
-xyl
ene
Tolu
en
e

91
Figure 5.10. Pyrograms of the studied formations showing quality of kerogen (cont.).
1 0 .0 0 2 0 .0 0 3 0 .0 0 4 0 .0 0 5 0 .0 0 6 0 .0 0 7 0 .0 0 8 0 .0 0 9 0 .0 0
5 0 0 0 0 0
1 0 0 0 0 0 0
1 5 0 0 0 0 0
2 0 0 0 0 0 0
2 5 0 0 0 0 0
3 0 0 0 0 0 0
3 5 0 0 0 0 0
4 0 0 0 0 0 0
4 5 0 0 0 0 0
5 0 0 0 0 0 0
Tim e
R e sp o n se _
S ig n a l: B L -A -3 - K E R O G .D \ F ID 1 A .C H
C10
C6
C8C9
Phen
ol
m,p
-xyl
ene
Tolu
ene
C12
Cada
lene
C14
C16
C18
C20
Nap
hthe
nic
C22
C24 C2
6
C28
C30
Belait FormationGas prone
10.00 20.00 30.00 40.00 50.00 60.00 70.00 80.00 90.00
400000
600000
800000
1000000
1200000
1400000
1600000
1800000
2000000
2200000
2400000
Time
Response_
S ig n a l: 1 3 4 A -K E R O G .D \ F ID 1 A .CH
C1
0
C6
C8
C9
Ph
en
ol
m,p
-xyl
ene
Tolu
en
e
C1
2
Cad
alen
e
C1
4
C1
6
C1
8
C2
0
Nap
hth
enic
C2
2
C2
4
C2
6
C2
8
C3
0
Meligan FormationGas prone

92
Figure 5.10. Pyrograms of the studied formations showing quality of kerogen (cont.).
1 0 . 0 0 2 0 . 0 0 3 0 . 0 0 4 0 . 0 0 5 0 . 0 0 6 0 . 0 0 7 0 . 0 0 8 0 . 0 0
3 0 0 0 0 0
4 0 0 0 0 0
5 0 0 0 0 0
6 0 0 0 0 0
7 0 0 0 0 0
8 0 0 0 0 0
9 0 0 0 0 0
1 0 0 0 0 0 0
1 1 0 0 0 0 0
1 2 0 0 0 0 0
1 3 0 0 0 0 0
1 4 0 0 0 0 0
1 5 0 0 0 0 0
1 6 0 0 0 0 0
1 7 0 0 0 0 0
1 8 0 0 0 0 0
1 9 0 0 0 0 0
T i m e
R e s p o n s e _
S ig n a l : 1 3 9 . D \ F I D 1 A . C H
C1
0
C6
C8
C9
Ph
eno
l
m,p
-xyl
eneTo
luen
e
C1
2
Cad
alen
e
C1
4
Nap
hth
enic
Temburong FormationNo hydrocarbon
1 0 . 0 0 2 0 . 0 0 3 0 . 0 0 4 0 . 0 0 5 0 . 0 0 6 0 . 0 0 7 0 . 0 0 8 0 . 0 0
4 0 0 0 0 0
6 0 0 0 0 0
8 0 0 0 0 0
1 0 0 0 0 0 0
1 2 0 0 0 0 0
1 4 0 0 0 0 0
1 6 0 0 0 0 0
1 8 0 0 0 0 0
2 0 0 0 0 0 0
2 2 0 0 0 0 0
2 4 0 0 0 0 0
2 6 0 0 0 0 0
2 8 0 0 0 0 0
3 0 0 0 0 0 0
3 2 0 0 0 0 0
3 4 0 0 0 0 0
T i m e
R e s p o n s e _
S ig n a l : 1 2 9 E . D \ F I D 1 A . C H
C1
0
C6
C8
C9
Ph
eno
lm
,p-x
ylen
e
Tolu
ene
C1
2
C1
4
C1
6
C1
8
C2
0Nap
hth
enic
C2
2
C2
4
C2
6
C2
8
C3
0
West Crocker FormationOil prone

93
5.4.4 Elemental Analytical Data
Representative whole rock and isolated kerogen samples from Belait, Meligan,
Temburong and West Crocker formations were analysed for total sulphur (TS), carbon,
hydrogen and nitrogen (CHN). The results in Table 5.4 were used to assess the type or
organic matter, source input and depositional conditions. The atomic H/C ratios are less
than 1 in most of the samples and significantly lower in the Temburong Formation samples
(Table 5.4). This may be due to increased thermal decomposition of the Temburong
Formation. Total sulphur contents are very low in most of the studied samples and this
indicates presence of oxygen in the deposition of the organic matter present in the studied
Formations. Total nitrogen is also low and this may suggest high terrestrial influence in the
studied formations. These are further discussed in the next chapter.
5.4.5 Molecular Composition
The fragmentograms of n-alkanes and isoprenoids (m/z 85) and phenanthrenes (m/z
178+192) of the representative samples of the studied formations are presented in Figures
5.11 and 5.12. The calculated parameters are shown in Table 5.5 for aliphatic and aromatic
hydrocarbon respectively.
5.4.5.1 n-alkanes and isoprenoids
The distribution of n-alkanes and isoprenoids are represented by mass
fragmentogram (m/z 85). The n-alkanes ranging from n-C16 to n-C33, pristane, and phytane
were identified in all the analysed samples (Figure 5.11). The distributions based on
integrated peak areas of n-alkanes and isoprenoids identified in each sample are listed in
Table 5.5. The implication for source input, depositional conditions and thermal maturity
will be discussed in Chapter 6.

94
Table 5.4. TOC and elemental analysis data of the studied formations.
Sample ID TOC TS TN C H H/C TOC/TS TOC/TN D
elta
ic S
equ
ence
Tukau Formation
T-01-SS 2.91 0.45 0.11 62.05 4.24 0.82 6.54 25.98
T-03-SH 1.61 0.30 0.06 59.45 4.36 0.88 5.37 28.25
T-04-SH 1.52 0.34 0.06 71.70 4.84 0.81 4.54 27.64
T-08-SH 1.60 0.33 0.09 56.18 4.12 0.88 4.86 18.82
T-10-SS 2.54 0.55 0.05 65.22 4.62 0.85 4.64 47.92
Miri Formation
M-01-SH 1.36 0.32 0.06 64.27 4.82 0.90 4.29 22.67
M-03-SH 1.06 0.28 0.04 60.55 4.44 0.88 3.79 24.09
M-05-SH 1.87 0.45 0.07 56.09 4.02 0.86 4.13 26.71
M-08-SS 2.32 0.58 0.09 57.27 4.20 0.88 4.00 25.78
M-11-SS 2.54 0.68 0.11 59.86 4.39 0.88 3.72 23.09
Lambir Formation
L-02-SS 11.11 1.85 0.46 58.76 4.26 0.87 6.01 24.15
L-03-SH 1.28 0.35 0.05 62.45 4.58 0.88 3.69 27.23
L-05-SS 3.45 0.57 0.13 59.58 4.22 0.85 6.07 27.60
L-11-SH 1.62 0.36 0.07 62.02 4.60 0.89 4.45 24.92
L-14-SH 1.85 0.31 0.07 61.46 4.20 0.82 5.99 25.69
Belait Formation
BL-A2-SH 1.71 0.7 0.08 60.28 4.98 0.99 2.44 21.16
BL-A3-SH 5.03 0.62 0.24 61.18 4.86 0.95 8.11 21.07
BL-A5-SST 4.18 0.91 0.20 60.86 4.56 0.90 4.59 20.84
BL-A6-SST 1.08 0.76 0.05 60.24 4.38 0.87 1.42 21.22
BL-A7-SH 1.05 0.82 0.05 60.14 4.78 0.95 1.28 20.46
BL-B1-SH 2.27 0.86 0.11 60.85 4.85 0.96 2.64 21.18
BL-C2-SH 1.19 0.31 0.04 71.87 4.74 0.79 3.84 27.06
Meligan Formation
ME-130B-SH 0.98 0.35 0.04 64.25 4.14 0.77 2.80 24.5
ME-130C-SS 1.34 0.39 0.06 62.38 4.48 0.86 3.44 23.45
ME-130F-SS 2.85 0.57 0.13 64.62 4.58 0.85 5.00 22.24
ME-133A-SS 3.03 0.62 0.12 65.27 4.21 0.77 4.89 24.54
ME-133C-SH 1.77 0.33 0.07 60.7 4.24 0.84 5.36 24.48
ME-134A-SH 2.42 0.44 0.09 80.41 4.62 0.69 5.50 27.89

95
Table 5.4. TOC and elemental analysis data of the studied formations (cont.).
.
TOC: total organic carbon content
TS: total sulphur
TN: total nitrogen
C: carbon
H:hydrogen
Sample ID TOC TS TN C H H/C TOC/TS TOC/TN
Su
bm
ari
ne
Fan
Temburong Formation
TEM-137A-SH 1.1 0.78 0.06 67.86 3.89 0.59 1.41 18.43
TEM-138-SH 1.38 0.72 0.07 75.45 4.12 0.60 1.92 19.84
TEM-139-SH 1.26 0.65 0.06 78.46 3.92 0.59 1.94 19.89
TEM-140-SH 0.71 0.55 0.04 78.13 3.65 0.46 1.29 20.01
West Crocker Formation
WC-129B-SH 1.23 0.76 0.07 53.49 3.2 0.72 1.62 18.46
WC-129D-MTD 1.73 0.75 0.10 57.25 4.39 0.92 2.31 17.89
WC-129E-MTD 2.26 0.75 0.13 53.15 4.21 0.95 3.01 17.4
WC-129F-MTD 2.4 0.74 0.13 53.97 4.34 0.96 3.24 18.2
WC-135B-SS 3.94 0.99 0.19 58.95 4.02 0.82 3.98 20.76
WC-144A-MTD 10.63 3.07 0.56 52.24 5.12 1.18 3.46 18.99
WC-145B-MTD 6.32 1.92 0.33 54.2 4.17 0.92 3.29 19.02
WC-145C-SH 1.06 0.82 0.05 57.26 4.28 0.90 1.29 20.04
Undifferentiated Formation
UD-01-SS 2.27 0.68 0.15 58.06 4.50 0.93 3.33 15.13
UD-02-SS 1.82 0.72 0.12 60.20 4.84 0.96 2.53 15.17

96
5.4.5.2 Phenanthrene and alkyl derivatives
The m/z 178 and 192 fragmentograms showing the distribution of phenanthrene
and methyl phenanthrenes in the studied samples are shown in Figure 5.12. Phenanthrene
and four methylphenanthrene (MP) were detected in the aromatic fraction of the studied
samples. The calculated parameters based on peak heights are recorded in Table 5.5. The
implication for source input and thermal maturity will be discussed in Chapter 6.
5.5 Trace elements distributions
Selected trace elements concentrations of Lambir, Miri and Tukau samples are
listed in Table 5.6, along with the several widely used geochemical ratios.Trace elements
such as V, Ni and Cr in sediments are sensitive indicators of paleo-redox conditions and
may allow oxic, dysoxic and anoxic depositional settings to be identified (Galarraga et al.,
2008). Vanadium (V) is usually enriched in comparison with Nickel (Ni) in suboxic to
anoxic marine environments (Barwise, 1990; Peters and Moldowan, 1993). The
concentration of vanadium (V) is higher than nickel (Ni) in all the analyzed samples (Table
5.6) indicating the prevalence of alternating oxic and anoxic conditions in the study area.
Cobalt and Scadium are in much lower concentration in all the analysed samples except for
high Cobalt concentrations recorded in some of Miri Formation samples and that indicate
prevailing oxic conditions during deposition. These results are discussed in the context of
paleoenvironment in the next chapter.

97
Table 5.5. Source and maturity parameters derived from n-alkanes, isoprenoids and
phenanthrenes.
Sample ID
n-alkane and Isoprenoids Phenanthrenes
Pr/Ph
Pr/n-
C17
Ph/n-
C18 CPI OEP TAR
Paq 9MP/9M
P+1MP
MPI-1
Tukau Formation
Del
taic
Seq
uen
ce
T-03-SH 3.16 2.76 0.68 1.78 1.76 1.96 0.34 0.50 0.44
T-04-SH 2.86 2.19 0.71 1.31 1.34 2.86 0.42 0.54 0.42
T-06-SH 3.20 1.71 0.75 1.80 1.82 2.40 0.32 0.62 0.44
T-07-SH 2.89 2.14 0.95 1.96 1.96 2.52 0.40 0.44 0.42
T-09-SH 2.24 1.18 0.86 2.24 2.20 2.65 0.36 0.58 0.40
Miri Formation
M-02-SH 1.43 1.52 0.65 1.23 1.30 2.54 0.40 0.52 0.48
M-03-SH 3.25 2.4 0.63 1.50 1.48 1.98 0.40 0.50 0.42
M-06-SH 2.25 1.42 0.64 1.67 1.68 1.84 0.38 0.48 0.46
M-07-SH 2.74 2.60 0.72 1.28 1.28 1.75 0.36 0.63 0.46
M-09-SH 1.84 2.27 0.86 2.54 2.48 2.02 0.40 0.52 0.42
Lambir Formation
L-03-SH 2.54 1.21 0.58 1.75 1.70 2.81 0.38 0.56 0.41
L-06-SH 2.43 2.8 0.76 1.50 1.50 2.32 0.34 0.64 0.43
L-07-SH 3.21 2.54 0.83 2.20 2.22 2.46 0.40 0.72 0.45
L-10-SH 3.20 2.31 0.8 1.74 1.70 2.08 0.38 0.58 0.44
L-11-SH 2.95 1.64 0.82 1.66 1.68 2.24 0.38 0.50 0.42
Belait Formation
BL-A2-SH 2.54 1.1 0.8 1.93 2.10 2.01 0.40 0.42 0.48
BL-A3-SH 2.9 0.91 0.49 1.65 1.75 1.75 0.42 0.52 0.46
BL-A5-SS 2.72 1.3 0.56 1.89 1.83 1.96 0.38 0.43 0.45
BL-A6-SS 2.68 1.65 0.86 2.03 2.01 1.78 0.42 0.56 0.48
BL-A7-SH 2.54 1.05 0.45 2.04 2.06 1.31 0.40 0.58 0.46
BL-A8-SS 3.82 1.39 0.61 1.89 1.78 2.76 - - -
BL-B1-SH 2.5 1.37 0.48 1.23 1.25 1.86 0.45 0.52 0.48
BL-C2-SH 4.2 3.1 0.67 1.71 1.72 2.54 - - -
Meligan Formation
ME-130B-SH 2.86 1.08 0.39 1.01 1.00 1.98 0.48 0.62 0.85
ME-130C-SS 2.8 0.86 0.15 1.01 0.98 1.72 - - -
ME-130F-SH 2.84 1.72 0.53 1.01 1.00 1.84 0.45 0.53 0.76
ME-133A-SS 3.04 1.39 0.43 0.99 0.92 2.01 0.43 0.42 0.7
ME-133C-SH 2.12 0.7 0.15 1.00 0.99 1.96 0.43 0.50 0.74
ME-134A-SH 3.6 1.07 0.36 1.00 1.00 2.34 0.43 0.43 0.7

98
Table 5.5. Source and maturity parameters derived from n-alkanes, isoprenoids and
phenanthrenes (Continuation).
Pr:pristane
Ph: phythane
CPI: carbon preference index
OEP: odd-even predominane
TAR: terrigenous-aquatic ratio
Paq= nC23 + nC25/ nC23 + nC25 + nC29 + nC31 – Alkanes
MPI-1 = 1.5 (2-MP + 3-MP)/ 0.69P + 1-MP + 9-MP
Sample ID
n-alkane and Isoprenoids Phenanthrenes
Pr/Ph
Pr/n-
C17
Ph/n-
C18 CPI OEP TAR
Paq 9MP/9M
P+1MP
MPI-1
Su
bm
ari
ne
Fan
Seq
uen
ce
Temburong Formation
TEM-137A-SH 1.21 0.98 0.58 0.98 0.99 1.84 0.45 0.38 1.1
TEM-137B-SS 1.42 0.40 0.12 1.00 0.9 1.52 0.48 0.38 1.1
TEM-138-SH 1.6 0.55 0.22 0.98 1.00 1.48 0.46 0.36 1.08
TEM-139-SH 1.28 0.65 0.24 1.01 1.00 1.5 0.35 0.34 1.14
TEM-139-SS 1.34 0.73 0.47 0.99 1.00 1.62 - - -
TEM-140-SH 1.42 0.82 0.5 1.01 1.2 1.48 - - -
West Crocker Formation
WC-129B-SH 1.74 1.9 0.85 0.9 0.9 1.65 0.36 0.38 0.8
WC-129E-MTD 1.62 1.75 0.76 0.98 0.99 1.62 0.37 0.39 0.99
WC-129D-MTD 1.48 0.86 0.33 0.99 0.98 1.82 0.37 0.35 0.92
WC-129F-MTD 1.34 1.15 0.68 0.99 0.99 1.46 0.35 0.34 0.9
WC-135B-SS 2.7 1.33 0.41 1.01 0.99 1.54 0.36 0.36 0.99
WC-144A-MTD 1.7 0.56 0.18 1.01 1.01 1.68 0.45 0.36 0.89
WC-144B-SH 1.42 0.72 0.28 1.01 1.01 1.78 - - -
WC-145A-SS 1.38 1.21 0.62 0.99 0.99 1.24 - - -
WC-145B-MTD 1.62 1.1 0.52 1.00 1.00 1.62 - - -
WC-145C-SH 1.72 0.98 0.62 1.01 0.99 1.48 - - -
Undifferentiated Formation
UD-01-SS 1.84 1.54 0.86 1.54 1.52 1.60 0.40 0.42 0.45
UD-02-SS 1.58 1.23 0.62 1.48 1.46 1.78 0.42 0.46 0.48

99
Figure 5.11. Representative m/z 85 fragmentogram showing the distribution of n-alkanes
and isoprenoids.
1 5 .0 0 2 0 .0 0 2 5 .0 0 3 0 .0 0 3 5 .0 0 4 0 .0 0 4 5 .0 0 5 0 .0 0 5 5 .0 0 6 0 .0 0 6 5 .0 0 7 0 .0 00
1 0 0 0
2 0 0 0
3 0 0 0
4 0 0 0
5 0 0 0
6 0 0 0
7 0 0 0
8 0 0 0
9 0 0 0
1 0 0 0 0
1 1 0 0 0
1 2 0 0 0
1 3 0 0 0
1 4 0 0 0
1 5 0 0 0
1 6 0 0 0
1 7 0 0 0
1 8 0 0 0
T im e -->
A b u n d a n c e
Io n 8 5 .0 0 (8 4 .7 0 to 8 5 .7 0 ): P _ 0 4 .D \d a ta .m s
n-C
17
n-C
18
n-C
20
n-C
22
n-C
24
n-C
26
n-C
28
n-C
30
n-C
32
n-C
33
Pr
Ph
Tukau FormationT-09-SHPr/Ph= 2.24TAR=2.65CPI=2.24
1 0 . 0 0 2 0 . 0 0 3 0 . 0 0 4 0 . 0 0 5 0 . 0 0 6 0 . 0 0 7 0 . 0 0 8 0 . 0 0 9 0 . 0 0
0
5 0 0 0
1 0 0 0 0
1 5 0 0 0
2 0 0 0 0
2 5 0 0 0
3 0 0 0 0
3 5 0 0 0
4 0 0 0 0
4 5 0 0 0
T i m e - - >
A b u n d a n c e
I o n 8 5 . 0 0 ( 8 4 . 7 0 t o 8 5 . 7 0 ) : U C M B R 0 7 . D \ d a t a . m s
n-C
17
n-C
18 n-C
19
n-C
20
n-C
22 n
-C2
4
n-C
26
n-C
28
n-C
30
n-C
32
n-C
33
Pr
Ph
Miri FormationM-07-SHPr/Ph= 2.74TAR=2.02CPI=2.54

100
Figure 5.11. Representative m/z 85 fragmentogram showing the distribution of n-alkanes
and isoprenoids (cont.).
1 5 .0 0 2 0 .0 0 2 5 .0 0 3 0 .0 0 3 5 .0 0 4 0 .0 0 4 5 .0 0 5 0 .0 0 5 5 .0 0 6 0 .0 0 6 5 .0 0 7 0 .0 00
1 0 0 0
2 0 0 0
3 0 0 0
4 0 0 0
5 0 0 0
6 0 0 0
7 0 0 0
8 0 0 0
9 0 0 0
1 0 0 0 0
1 1 0 0 0
1 2 0 0 0
1 3 0 0 0
1 4 0 0 0
1 5 0 0 0
1 6 0 0 0
1 7 0 0 0
1 8 0 0 0
1 9 0 0 0
2 0 0 0 0
2 1 0 0 0
2 2 0 0 0
2 3 0 0 0
2 4 0 0 0
2 5 0 0 0
2 6 0 0 0
T i m e - - >
A b u n d a n c e
Io n 8 5 .0 0 ( 8 4 .7 0 t o 8 5 .7 0 ) : S D _ M B R 0 4 .D \ d a ta .m s
n-C
17
n-C
18
n-C
19
n-C
20 n-C
22
n-C
24
n-C
26
n-C
28
n-C
30
n-C
32
n-C
33
Pr
Ph
Lambir FormationL-03-SHPr/Ph= 2.54TAR=2.81CPI=1.75
15.00 20.00 25.00 30.00 35.00 40.00 45.00 50.00 55.00 60.00 65.00 70.000
50000
100000
150000
200000
250000
300000
350000
400000
450000
500000
550000
600000
650000
700000
750000
800000
850000
900000
Time-->
Abundance
Ion 85.00 (84.70 to 85.70): BM-01ALIPH.D\data.ms
n-C
17
n-C
18 n
-C1
9n
-C2
0
n-C
22
n-C
24
n-C
26
n-C
28
n-C
30
n-C
32
n-C
33
Pr
Ph
UndifferentiatedFormationUD-01-SSPr/Ph= 1.84TAR=1.60CPI=1.48

101
Figure 5.11. Representative m/z 85 fragmentogram showing the distribution of n-alkanes
and isoprenoids (cont.).
1 5 .0 0 2 0 .0 02 5 .0 0 3 0 .0 03 5 .0 0 4 0 .0 04 5 .0 0 5 0 .0 05 5 .0 0 6 0 .0 0 6 5 .0 0 7 0 .0 07 5 .0 00
2 0 0 0 0
4 0 0 0 0
6 0 0 0 0
8 0 0 0 0
1 0 0 0 0 0
1 2 0 0 0 0
1 4 0 0 0 0
1 6 0 0 0 0
1 8 0 0 0 0
2 0 0 0 0 0
2 2 0 0 0 0
2 4 0 0 0 0
2 6 0 0 0 0
T im e - ->
A b u n d a n c e
I o n 8 5 . 0 0 (8 4 . 7 0 t o 8 5 . 7 0 ) : B L -A -5 A L I . D \ d a t a . m s
Pr
Ph
n-C
17
n-C
18
n-C
20
n-C
22
n-C
24
n-C
26
n-C
28
n-C
30
Belait FormationPr/Ph=2.72TAR=1.96CPI=1.89
1 5 . 0 0 2 0 . 0 0 2 5 . 0 0 3 0 . 0 0 3 5 . 0 0 4 0 . 0 0 4 5 . 0 0 5 0 . 0 0 5 5 . 0 0 6 0 . 0 0 6 5 . 0 0 7 0 . 0 0 7 5 . 0 00
5 0 0 0 0
1 0 0 0 0 0
1 5 0 0 0 0
2 0 0 0 0 0
2 5 0 0 0 0
3 0 0 0 0 0
3 5 0 0 0 0
4 0 0 0 0 0
4 5 0 0 0 0
5 0 0 0 0 0
5 5 0 0 0 0
6 0 0 0 0 0
6 5 0 0 0 0
7 0 0 0 0 0
7 5 0 0 0 0
8 0 0 0 0 0
T i m e - - >
A b u n d a n c e
I o n 8 5 . 0 0 ( 8 4 . 7 0 t o 8 5 . 7 0 ) : 1 3 3 C A L I P H . D \ d a t a . m s
Pr
Ph
n-C
17
n-C
18 n-C
20
n-C
22
n-C
24
n-C
26
n-C
28
n-C
30
Meligan FormationPr/Ph=2.12TAR=1.96CPI=1.0
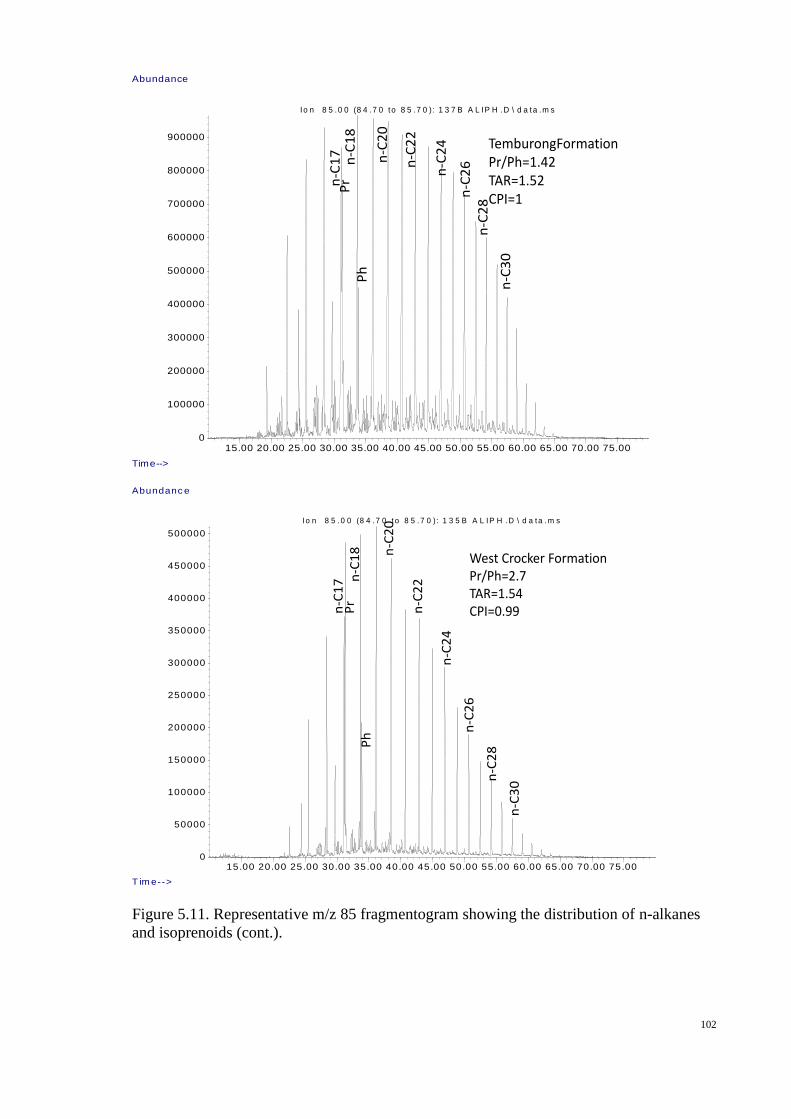
102
Figure 5.11. Representative m/z 85 fragmentogram showing the distribution of n-alkanes
and isoprenoids (cont.).
15.00 20.00 25.00 30.00 35.00 40.00 45.00 50.00 55.00 60.00 65.00 70.00 75.000
100000
200000
300000
400000
500000
600000
700000
800000
900000
Time-->
Abundance
Io n 8 5 .0 0 (8 4 .7 0 to 8 5 .7 0 ): 1 3 7 B A L IP H .D \ d a ta .m s
Pr
Ph
n-C
17
n-C
18
n-C
20
n-C
22
n-C
24
n-C
26
n-C
28
n-C
30
TemburongFormationPr/Ph=1.42TAR=1.52CPI=1
15.00 20.00 25.00 30.00 35.00 40.00 45.00 50.00 55.00 60.00 65.00 70.00 75.000
50000
100000
150000
200000
250000
300000
350000
400000
450000
500000
T im e-->
Abundanc e
I o n 8 5 . 0 0 (8 4 . 7 0 t o 8 5 .7 0 ): 1 3 5 B A L IP H .D \ d a t a . m s
Pr
Ph
n-C
17 n
-C1
8 n-C
20
n-C
22
n-C
24
n-C
26
n-C
28
n-C
30
West Crocker FormationPr/Ph=2.7TAR=1.54CPI=0.99
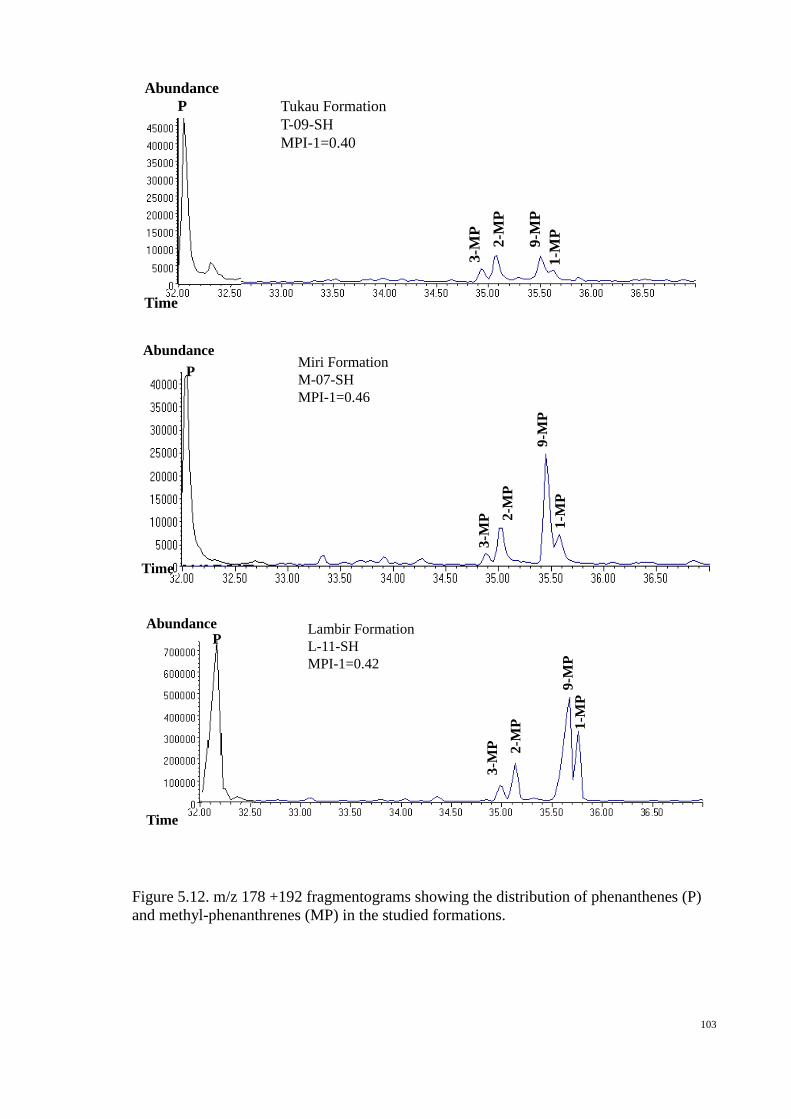
103
Figure 5.12. m/z 178 +192 fragmentograms showing the distribution of phenanthenes (P)
and methyl-phenanthrenes (MP) in the studied formations.
Tukau Formation
T-09-SH
MPI-1=0.40
P
3-M
P
1-M
P
2-M
P
9-M
P
Time
Abundance
Miri Formation
M-07-SH
MPI-1=0.46
P
3-M
P
1-M
P
2-M
P
9-M
P
Time
Abundance
Lambir Formation
L-11-SH
MPI-1=0.42
P
3-M
P
1-M
P
2-M
P
9-M
P
Time
Abundance

104
Figure 5.12. m/z 178 +192 fragmentograms showing the distribution of phenanthenes (P)
and methyl-phenanthrenes (MP) in the studied formations (cont.).
Belait Formation
BL-A5-SS
MPI-1=0.45
P
3-M
P
1-M
P
2-M
P
9-M
P
Time
Abundance
Meligan Formation
ME-134A-SH
MPI-1=0.70
P
3-M
P
1-M
P
2-M
P
9-M
PTime
Abundance
Undifferentiated Formation
UD-01-SS
MPI-1=0.45
P
3-M
P
1-M
P
2-M
P
9-M
P
Time
Abundance

105
Figure 5.12. m/z 178 +192 fragmentograms showing the distribution of phenanthenes (P)
and methyl-phenanthrenes (MP) in the studied formations (cont.).
Temburong Formation
TEM-138-SH
MPI-1=1.08
P
3-M
P
1-M
P
2-M
P
9-M
P
Time
Abundance
West Crocker Formation
WC-135B-SS
MPI-1=0.99
P3-M
P
1-M
PTime
Abundance
2-M
P
9-M
P

106
Table 5.6. Trace elements concentrations and ratios in the studied samples.
Sample ID V Ni Cr Co Sc V/Ni V/Cr V/Sc Ni/Co D
elta
ic S
equ
ence
Tukau Formation
T-03-SH 60.21 25.02 24.69 4.98 4.2 2.40 2.43 14.29 5.02
T-04-SH 48.19 31.89 31.58 11.64 4.24 1.50 1.52 11.32 2.75
T-06-SH 46.09 26.05 20.54 5.16 4.56 1.77 2.24 10.09 5.04
T-07-SH 50.34 39.87 30.86 13.38 3.26 1.25 1.62 15.34 2.99
T-09-SH 36.48 18.02 16.82 3.49 4.24 2.00 2.14 8.49 5.16
Miri Formation
M-02-SH 38.21 28.05 17.59 13.59 3.42 1.36 2.16 11.11 2.06
M-03-SH 54.25 32.03 20.69 15.69 3.9 1.69 2.61 13.85 2.04
M-06-SH 48.34 31.98 40.00 14.29 4.2 1.50 1.20 11.43 2.24
M-07-SH 45.12 26.79 21.95 4.99 4.82 1.73 2.05 9.34 5.21
M-09-SH 50.04 30.28 33.78 12.50 4.65 1.67 1.48 10.75 2.40
Lambir Formation
L-03-SH 48.06 17.96 18.46 3.46 3.86 2.67 2.60 12.44 5.20
L-06-SH 42.03 23.83 17.50 4.63 3.80 1.75 2.40 11.05 5.18
L-07-SH 26.05 17.78 17.57 6.29 4.52 1.44 1.48 5.75 2.86
L-10-SH 48.04 24.86 21.72 11.06 3.72 1.92 2.21 12.90 2.26
L-11-SH 30.15 16.02 26.32 5.37 3.24 1.88 1.14 9.26 2.98
Belait Formation
BL-A2-SH 48.46 24.70 23.76 4.75 3.72 1.96 2.04 13.02 5.20
BL-A3-SH 46.83 24.40 18.70 4.80 3.52 1.92 2.50 13.30 5.08
BL-A5-SST 44.34 20.24 13.02 7.41 4.57 2.19 3.41 9.71 2.73
BL-A6-SST 52.06 20.97 16.25 3.99 2.77 2.48 3.20 18.82 5.26
BL-A7-SH 25.16 15.00 17.24 3.41 3.18 1.68 1.46 7.91 4.40
BL-A8-SST 30.80 20.00 16.92 4.35 3.72 1.54 1.82 8.28 4.60
BL-B1-SH 48.26 20.34 22.64 4.18 4.03 2.37 2.13 11.96 4.86
BL-C2-SH 32.84 24.30 26.00 4.99 4.57 1.35 1.26 7.19 4.87
Meligan Formation
ME-130B-SH 35.34 22.00 20.83 4.94 4.27 1.61 1.70 8.28 4.45
ME-130C-SS 36.43 19.00 18.18 3.89 3.96 1.92 2.00 9.21 4.89
ME-130F-SS 27.34 15.00 15.70 3.74 3.13 1.82 1.74 8.75 4.01
ME-133A-SS 35.45 22.00 18.82 4.44 3.91 1.61 1.88 9.05 4.96
ME-133C-SH 45.26 24.00 23.44 4.74 4.99 1.89 1.93 9.07 5.06
ME-134A-SH 38.50 21.70 19.15 5.45 4.32 1.77 2.01 8.92 3.98

107
Table 5.6. Trace concentrations and ratios in the studied samples (Continuation).
V: Vanadium
Ni: Nickel
Cr: Chromium
Co: Cobalt
Sc: Scandium
Sample ID V Ni Cr Co Sc V/Ni V/Cr V/Sc Ni/Co S
ub
mari
ne
Fan
Temburong Formation
TE-137A-SH 43.45 18.20 10.63 4.08 2.34 2.39 4.09 18.53 4.46
TE-137B-SS 50.28 26.00 17.30 4.19 3.02 1.93 2.91 16.67 6.20
TE-138-SH 40.14 18.20 13.99 2.87 2.82 2.21 2.87 14.25 6.34
TE-139-SH 58.74 26.77 27.87 3.89 3.62 2.19 2.11 16.22 6.88
TE-139-SS 54.28 24.11 19.15 4.10 3.06 2.25 2.83 17.73 5.88
TE-140-SH 49.26 21.46 17.79 3.41 2.97 2.30 2.77 16.58 6.29
West Crocker Formation
WC-129B-SH 84.45 33.87 29.37 5.21 4.23 2.49 2.88 19.95 6.50
WC-129E-MTD 75.04 30.12 27.17 4.64 3.99 2.49 2.76 18.81 6.49
WC-129D-MTD 45.21 22.90 17.44 3.35 2.61 1.97 2.59 17.30 6.84
WC-129F-MTD 68.74 33.01 25.00 5.19 3.51 2.08 2.75 19.59 6.36
WC-135B-SST 66.32 30.84 23.91 5.28 3.40 2.15 2.77 19.51 5.84
WC-144A-MTD 70.24 28.00 22.29 4.51 3.90 2.51 3.15 18.02 6.21
WC-144B-SH 52.28 23.70 14.69 3.49 2.61 2.21 3.56 20.03 6.80
WC-145A-SST 68.80 30.63 20.66 4.91 3.89 2.25 3.33 17.69 6.24
WC-145B-MTD 84.60 43.30 34.53 6.83 4.99 1.95 2.45 16.94 6.34
WC-145C-SH 69.12 33.17 17.93 5.18 3.49 2.08 3.86 19.80 6.40
Undifferentiated Formation
UD-01-SS 67.82 20.19 28.26 5.78 3.46 3.36 2.40 19.60 3.49
UD-02-SS 64.76 22.34 24.30 5.30 3.86 2.90 2.67 16.78 4.21

108
CHAPTER 6
DISCUSSION
6.1 Introduction
This chapter discusses the integration of petrographical and geochemical data to
interpret the source rock characteristics, as well as the source and preservation of the
organic matter in the studied sequences. Greater emphasis been given in comparing sandy
and shaly facies.
6.2 Source Rock Evaluation
Source rocks are capable of generating petroleum (Tissot and Welte, 1984). Source
rock evaluation consists of assessing the hydrocarbon generating potential of sediments by
evaluating their capacity for hydrocarbon generation, the type of organic matter, what
hydrocarbons might be generated, thermal maturity and how it influences generation and
expulsion (Dembicki, 2009). The source rock characteristics of the studied deltaic and
submarine fan sequences is discussed based on organic richness (quantity), type of
kerogen and potential hydrocarbon (oil and/or gas) and thermal maturity.
6.2.1 Organic matter richness and hydrocarbon generative potential
The organic richness of a rock is usually expressed as the total organic carbon
(TOC) content in wt%. The minimum acceptable TOC value for clastic type rocks
indicating good source potential is 1.0% (Peters and Cassa, 1994., Hunt, 1996).
Deltaic Sequence
The TOC values in most of the samples in the Tukau, Miri, Lambir, Belait and
Meligan formations exceed the minimal 1.0 wt.% and thus, in terms of source rock organic
richness, the deltaic sequences have good to excellent TOC contents (as defined by Peters
and Cassa,1994; Hunt, 1996). There is variation in TOC content in the shaly and sandy

109
facies of the deltaic sequences. Most of the sandy facies have higher TOC than the shaly
facies with exceptionally high values of 7.87 wt. % and 11.1 wt. % recorded in Belait and
Lambir sandy facies respectively. Moreover, the amount of hydrocarbon yield (S2)
generated during pyrolysis is a useful parameter to evaluate the hydrocarbon generation
potential of source rocks (Peters, 1986; Bordenave, 1993). Generally, the hydrocarbon (S2)
yields in the deltaic sequence can be regarded as fair to good hydrocarbon generation
potential as shown in Figure 6.1. Some sandy facies from the Lambir and Belait
Formation have significant higher values of S2 yield, which implies higher hydrocarbon
generative potential (Figure 6.1). The hydrocarbon generative potential in the studied
deltaic sequences was also been supported based on extractable organic matter (EOM,
ppm) and hydrocarbon yields (Table 5.2). The source rock richness rating is shown in TOC
(wt. %) versus hydrocarbon yields crossplot (Figure 6.2), which indicate that most of the
samples from Tukau, Miri, Lambir, Belait and Meligan formations have fair to good
hydrocarbon generative potential.
Submarine Fan Sequences
There is variation in TOC in the shaly and sandy facies of the submarine fan
deposits. Most of the sandy facies in the studied formations have higher TOC than the
shaly facies except in the Temburong Formation where the shaly facies have higher TOC
content. Most of slump facies samples within the West Crocker Formation show
significantly high amount of organic matter and this means they contain more than
sufficient organic matter required to be a source rock. The hydrocarbon (S2) yields in the
submarine fan deposits can generally be refered to as poor to fair hydrocarbon generating
potential with exceptions to the slump samples and the sandy facies from the
undifferentiated formation which shows quite good to excellent hydrocarbon generating
characteristics. This is further supported by TOC and hydrocarbon yield (Figure 6.2).

110
0.01
0.1
1
10
100
1000
0.1 1 10 100
S2 (
mgH
C/g
TO
C)
Total Organic Carbon (TOC, wt%)
Tukau Formation (Shaly)
Tukau Formation (Sandy)
Miri Formation (Shaly)
Miri Formation (Sandy)
Lambir Formation (Shaly)
Lambir Formation (Sandy)
Belait Formation (Shaly)
Belait Formation (Sandy)
Meligan Formation (Shaly)
Meligan Formation (Sandy)
Deltaic Sequence
Excellent
Very Good
Very
Good
Good
Fair
Poor
Good
Fair
Poor
0.01
0.1
1
10
100
1000
0.1 1 10 100S
2 (
mgH
C/g
TO
C)
Total Organic Carbon (TOC, wt%)
Temburong Formation (Shaly)
Temburong Formation (Sandy)
West Crocker Formation (Shaly)
West Crocker Formation (Sandy)
West Crocker Formation (Slump)
Undifferentiated Formation (Sandy)
Excellent
Very Good
Ver
yG
ood
Good
Fair
Poor
Good
Fair
Poor
Submarine Fan Sequence
Figure 6.1. Plot of total organic carbon (TOC) versus hydrocarbon yield (S2) showing the hydrocarbon generatie potential of the studied deltaic and
submarine fan samples.

111
Figure 6.2. Plot of TOC versus hydrocarbon yield plot showing source rock richness and hydrocarbon potential.
0.1
1
10
100
100 1000 10000
To
tal
Org
an
ic C
arb
on
(w
t.%
)
Hydrocarbon yield (ppm)
Tukau Formation (shaly)
Tukau Formation(sandy)
Miri Formation (shaly)
Miri Formation (sandy)
Lambir Formation (shaly)
Lambir Formation (sandy)
Belait Formation (shaly)
Belait Formation (sandy)
Meligan Formation(shaly)
Meligan Formation (sandy)
Poor
Fair
Good
Very Good
Excellent
Deltaic Sequences
0.1
1
10
100
100 1000 10000
To
tal
Org
an
ic C
arb
on
(w
t.%
)
Hydrocarbon yield (ppm)
Temburong Formation
(shaly)
Temburong Formation
(sandy)
West Crocker Formation
(shaly)
West Crocker Formation
(sandy)
West Crocker Formation
(slump)
Undifferentiated Formation
Poor
Fair
Good
Very Good
Excellent
Submarine Fan Sequences

112
6.2.2 Bulk kerogen Characteristics
Bulk kerogen and type were characterized based on pyrolysis (SRA and Py-GC),
elemental data and petrographic characteristics.
Deltaic Sequences
A van Krevelen plot of whole rock hydrogen and oxygen indices can be used to
classify the dominant type of organic matter in potential source rocks (Bordenave, 1993;
Figure 6.3). Most of the samples from Tukau, Miri, Lambir, Belait and Meligan formations
plot in the field of Type III kerogen. This suggests that the organic matter in these
formations contain predominantly gas prone Type III kerogen. In addition, TOC versus
pyrolysis S2 can be used to indicate the type of organic matter (Figure 6.4). Based on this
relationship, most of the samples have Type III kerogen. This is further supported by low
atomic H/C ratios. The atomic H/C (hydrogen to carbon) ratio of kerogen has been used to
assess the quality of organic matter in source rocks. For oil prone source rocks, Type I
kerogens have H/C ratios of 1.35-1.50, whereas Type II kerogens have H/C ratios of 1.20-
1.35. Gas prone Type III kerogen have H/C ratios <1 while Type IV kerogen has H/C
ratios of 0.5 (Baskin, 1997; Killops and Killops, 2005). Most of the analysed samples have
low H/C (<1) which is typical of gas prone Type III kerogen.
Pyrolysis (SRA) hydrogen and oxygen indices (HI and OI) does not always
accurately represent the types of kerogen present and types of hydrocarbon that may be
generated by the source rocks (Dembicki, 2009). The application of SRA technique can
provide more accurate assessments of kerogen type when integrated with pyrolysis-gas
chromatography (Py-GC) method (Dembicki, 1993 and Dembicki, 2009). The Py-GC
analysis provides information regarding the quantitative chemistry of the thermal
decomposition products of the kerogen. This gives a direct indicator of the kerogen types

113
and types of hydrocarbons that can be generated by the kerogen during maturation process
(Giraud, 1970; Larter and Douglas, 1980; Horsfield, 1989; Eglinton et. al., 1990;
Dembicki, 2009). Bahar and Pelet, (1985) and Dembicki (2009) show clearly how the three
main types of kerogen can be distinguished by the carbon number distribution of n-alkanes.
These authors stated that Type I kerogen pyrogram contain large amounts of n-alkanes/n-
alkenes in C20-C30 range, whereas a Type III pyrogram shows most products in the <C10
fraction. The fingerprint observed in the analysed kerogen samples from the studied
formations indicates the dominance of gas prone Type III kerogen characterized by
dominance of aromatic compounds over n-alkane/alkene doublets.
The relative percentages of three pyrolysate components (m,p-xylene, phenol and
n-octene) were used to define kerogen type using the diagram of Figure 6.5 as defined by
Larter (1984). These three pyrolysate components represent the aliphatic and aromatic
structures within the macromolecular organic matter. Based on the relative abundance of
the three pyrolysate components (m,p-xylene, phenol and n-octene), the majority of the
analysed samples fall within the field of the Type III kerogen (Figure 6.5), consistent with
their HI indices. Thus provide further support that the Type III is the main organofacies
within the deltaic samples.
The kerogen composition of the Tukau, Miri, Lambir, Belait and Meligan
formations samples has also been evaluated by petrographic examination. The phytoclasts
consist predominantly of vitrinitic material with low-common occurrence of liptinite and
inertinite macerals. Based on the type of organic matter under reflected light microscopy, a
high proportion of Type III kerogen was observed as illustrated in Figure 6.6.
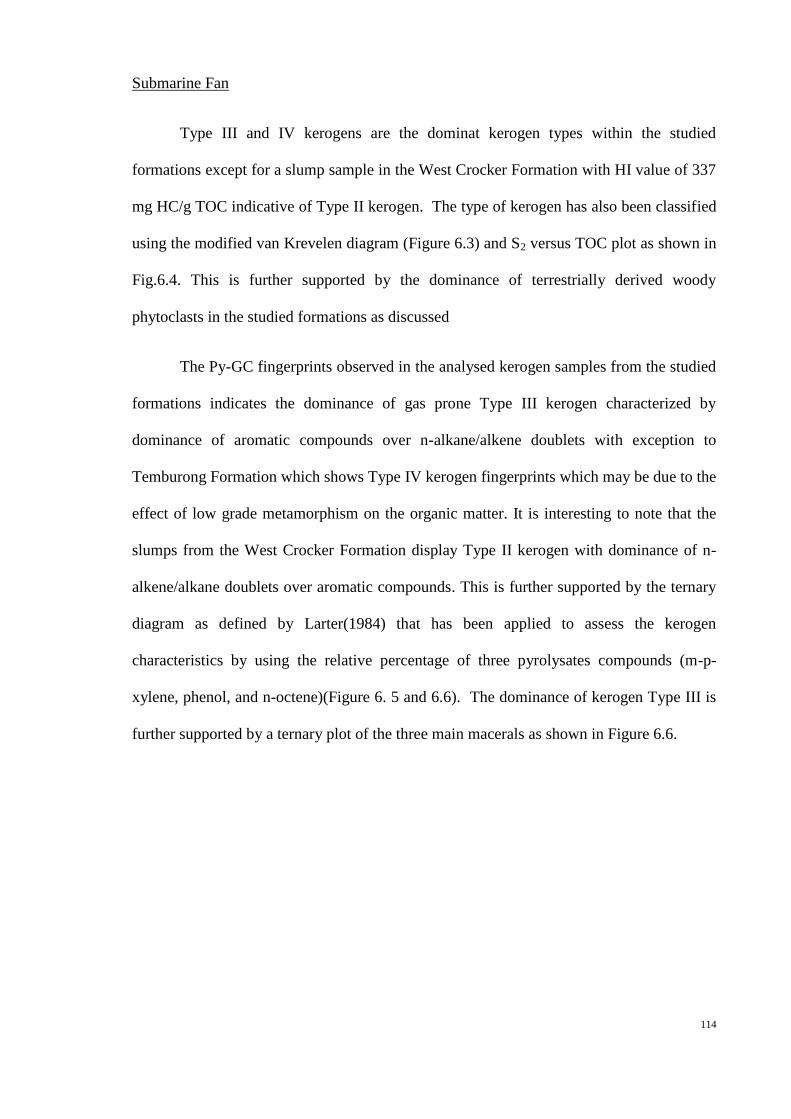
114
Submarine Fan
Type III and IV kerogens are the dominat kerogen types within the studied
formations except for a slump sample in the West Crocker Formation with HI value of 337
mg HC/g TOC indicative of Type II kerogen. The type of kerogen has also been classified
using the modified van Krevelen diagram (Figure 6.3) and S2 versus TOC plot as shown in
Fig.6.4. This is further supported by the dominance of terrestrially derived woody
phytoclasts in the studied formations as discussed
The Py-GC fingerprints observed in the analysed kerogen samples from the studied
formations indicates the dominance of gas prone Type III kerogen characterized by
dominance of aromatic compounds over n-alkane/alkene doublets with exception to
Temburong Formation which shows Type IV kerogen fingerprints which may be due to the
effect of low grade metamorphism on the organic matter. It is interesting to note that the
slumps from the West Crocker Formation display Type II kerogen with dominance of n-
alkene/alkane doublets over aromatic compounds. This is further supported by the ternary
diagram as defined by Larter(1984) that has been applied to assess the kerogen
characteristics by using the relative percentage of three pyrolysates compounds (m-p-
xylene, phenol, and n-octene)(Figure 6. 5 and 6.6). The dominance of kerogen Type III is
further supported by a ternary plot of the three main macerals as shown in Figure 6.6.
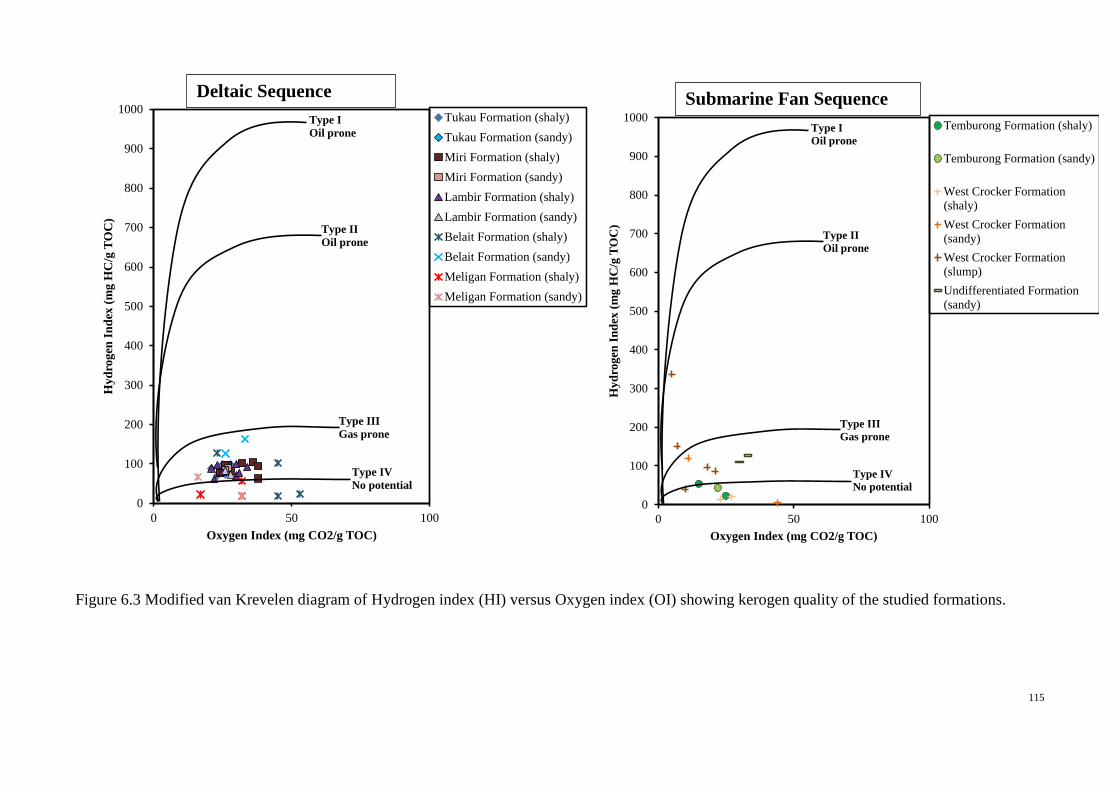
115
Figure 6.3 Modified van Krevelen diagram of Hydrogen index (HI) versus Oxygen index (OI) showing kerogen quality of the studied formations.
0
100
200
300
400
500
600
700
800
900
1000
0 50 100
Hyd
rogen
In
dex
(m
g H
C/g
TO
C)
Oxygen Index (mg CO2/g TOC)
Temburong Formation (shaly)
Temburong Formation (sandy)
West Crocker Formation
(shaly)
West Crocker Formation
(sandy)
West Crocker Formation
(slump)
Undifferentiated Formation
(sandy)
Type I
Oil prone
Type II
Oil prone
Type III
Gas prone
Type IV
No potential
0
100
200
300
400
500
600
700
800
900
1000
0 50 100
Hyd
rogen
In
dex
(m
g H
C/g
TO
C)
Oxygen Index (mg CO2/g TOC)
Tukau Formation (shaly)
Tukau Formation (sandy)
Miri Formation (shaly)
Miri Formation (sandy)
Lambir Formation (shaly)
Lambir Formation (sandy)
Belait Formation (shaly)
Belait Formation (sandy)
Meligan Formation (shaly)
Meligan Formation (sandy)
Type I
Oil prone
Type II
Oil prone
Type III
Gas prone
Type IV
No potential
Deltaic Sequence Submarine Fan Sequence

116
0
5
10
15
20
25
30
35
40
0 2 4 6 8 10 12 14 16 18 20
S2 (
mgH
C/g
TO
C)
Total Organic Carbon (TOC, wt%)
Temburong Formation (Shaly)
Temburong Formation (Sandy)
West Crocker Formation (Shaly)
West Crocker Formation (Sandy)
West Crocker Formation (Slump)
Undifferentiated Formation (Sandy)
Type I
Oil proneType II
Oil proneType II- III
Oil -Gas
TypeIII
Gas prone
Type IV
Submarine Fan Sequence
0
5
10
15
20
25
30
35
40
0 2 4 6 8 10 12 14 16 18 20
S2
(m
gH
C/g
TO
C)
Total Organic Carbon (TOC, wt%)
Tukau Formation (Shaly)
Tukau Formation (Sandy)
Miri Formation (Shaly)
Miri Formation (Sandy)
Lambir Formation (Shaly)
Lambir Formation (Sandy)
Belait Formation (Shaly)
Belait Formation (Sandy)
Meligan Formation (Shaly)
Meligan Formation (Sandy)
Type I
Oil proneType II
Oil proneType II- III
Oil -Gas
TypeIII
Gas prone
Type IV
Deltaic Sequence
Figure 6.4. Crossplot of total organic carbon (TOC in wt. %) and remaining hydrocarbon potential (S2 in mg HC/g rock) showing the quality of
kerogen in the studied formations

117
Figure 6.5. The ternary diagram to assess the kerogen characteristics based on the relative
percentages m-p-xylene, phenol, and n-octene (Larter, 1984).
Deltaic Sequences
Phenol
n-Octene
m, p-Xylene 10 20 30 40 50 60 70 80 90
10
20
30
40
50
60
70
80
9010
20
30
40
50
60
70
80
90
Tukau Formation (shaly)
Tukau Formation (sandy)
Miri Formation (shaly)
Miri Formation (sandy)
Lambir Formation (shaly)
Lambir Formation (sandy)
Belait Formation (shaly)
Belait Formation (sandy)
Meligan Formation (shaly)
Meligan Formation (sandy)
I
II
III
IV
10%-grid
10%-ticks
10%-labels
20%-labels
Feldspar diagram
Feldspar diagram labels
Classification and nomenclature of tuffs and ashes
Individual mask
Individual labels
Phenol
n-Octene
m, p-Xylene 10 20 30 40 50 60 70 80 90
10
20
30
40
50
60
70
80
9010
20
30
40
50
60
70
80
90
Temburong Formation (shaly)
Temburong Formation (sandy)
West Crocker Formation (shaly)
West Crocker Formation (sandy)
West Crocker Formation (slump)
Undifferentiated Formation (sandy)I
II
III
IV
10%-grid
10%-ticks
10%-labels
20%-labels
Feldspar diagram
Feldspar diagram labels
Classification and nomenclature of tuffs and ashes
Individual mask
Individual labels
Submarine Fan
Sequences
Deltaic Sequences

118
Inertinite
Vitrinite
Liptinite 10 20 30 40 50 60 70 80 90
10
20
30
40
50
60
70
80
9010
20
30
40
50
60
70
80
90
Temburong Formation (shaly)
Temburong Formation (sandy)
West Crocker Formation (shaly)
West Crocker Formation (sandy)
West Crocker Formation (slump)
Undifferentiated Formation (sandy)
Type I
Type II
Type III
Type IV
10%-grid
10%-ticks
10%-labels
20%-labels
Feldspar diagram
Feldspar diagram labels
Classification and nomenclature of tuffs and ashes
Individual mask
Individual labels
Inertinite
Vitrinite
Liptinite
10 20 30 40 50 60 70 80 90
10
20
30
40
50
60
70
80
9010
20
30
40
50
60
70
80
90
Tuakau Formation (shaly)
Tukau Formation (sandy)
Miri Formation (shaly)
Miri Formation (sandy)
Lambir Formation (shaly)
Lambir Formation(sandy)
Belait Formation (shaly)
Belait Formation (sandy)
Meligan Formation (shaly)
Meligan Formation(sandy)
10%-grid
10%-ticks
10%-labels
20%-labels
Feldspar diagram
Feldspar diagram labels
Classification and nomenclature of tuffs and ashes
Individual mask
Individual labels
Type I
Type II
Type III
Type IV
Submarine Fan
Sequences
Deltaic Sequences
Figure 6.6. Ternary plot of classification of kerogen type based on major organic
constituents observed under reflected light microscopy (modified after Cornford et al.,
1998).

119
6.2.3 Thermal Maturity of Organic Matter
For an organic rich source rock to become effective source rock, it must reach a
maturity level sufficient to generate hydrocarbons (Tissot and Wellte, 1984). Thermal
maturity describes the impact of heat during burial of sediments. This thermal exposure
converts kerogen into petroleum. Several data types and parametrs have been used to
evaluate the level of organic maturity; these include vitrinite reflectance data (%Ro),
pyrolysis Tmax and molecular parameters.
Deltaic Sequences
Vitrinite reflectance (VR) is more satisfactory and widely accepted by many
authors and exploration geologists as a technique for measuring the thermal maturity of
source rocks (Teichmüller, 1958; Tissot and Welte, 1984; Bordenave, 1993). Vitrinite
reflectance values for main phase of oil generation ranges from (0.6-1.3) %Ro and values
greater than 2.0 %Ro indicate dry gas generation (Tissot and Welte, 1984). The vitrinite
reflectance values for the deltaic sequences range from 0.39-0.48 %Ro for Tukau, Miri,
Lambir and Belait formation samples which indicates that they are thermally immature for
hydrocarbon generation while the values of 0.69-0.79 %Ro recorded in the Meligan
Formation samples indicates peak of oil generation to late oil window level of thermal
maturity for hydrocarbon generation.
The pyrolysis Tmax indicates the temperature of the maximum generation of S2
peak. Generally, the threshold of the oil zone is at Tmax of 430°C - 435°C for Type II and
III kerogen while gas zone ranges from 450°C - 455°C and 465°C - 470°C for Type II and
type III respectively (Killops and Killops, 2005, Peters et al., 2005, Sykes and Raine,
2008). The pyrolysis Tmax values for most of the Tukau, Miri, Lambir and Belait
formations samples is less than 435°C, indicating immature to very early mature stage. The
pyrolysis Tmax values in the Meligan Formation samples range from 458-472 °C

120
indicating peak of oil generation to late oil window level of thermal maturity. This is in
good agreement wiith the measured vitrinite reflectance data as illustrated in the HI versus
Tmax plot of Figure 6.7.
The fractions of the EOM can be used to determine the level of thermal maturity.
Nitrogen, Sulphur and Oxygen compounds (NSO), tends to be abundant in immature
organic matter as recorded in Tukau, Miri, Lambir and Belait formations samples and
decreases with increasing maturity. Also, there is increase in the aromaticity as maturity
increases. This is displayed by the mature samples of Meligan Formation as described in
Section 5.4.1.
The proportion of odd versus even carbon numbered n-alkanes may be used to
obtain a rough estimate of organic maturation level of sediments (Bray and Evans 1961;
Peters and Moldowan 1993; Peters et al.2005), These measurements include the carbon
preference index (CPI) proposed by Peters and Moldowan (1993), which is an improved
odd-even preference (OEP) by Scalan and Smith (1970). CPI or OEP values significantly
above 1.0 (odd preference) or below 1.0 (even preference) indicate thermal immaturity
while values of 1.0 suggest that the organic matter is thermally mature (Peters and
Moldowan 1993). Tukau, Miri, Lambir and Beliat samples have CPI more than 1.0 with
prevalence of odd carbon number over even carbon number. This indicates that all the
analysed samples are thermally immature in terms of hydrocarbon generation (Bray and
Evans 1961). The CPI and OEP values in the Meligan Formation samples are close to 1
and suggest these samples are thermally mature for hydrocarbon generation maturity. Also,
the MPI-1 values correlate well with the measured vitrinite reflectance data.

121
Submarine Fan Sequence
The Submarine fan sequences shows vitrinite reflectance values in the range of
0.99-1.14%Ro and 0.79-1.14%Ro for Temburong and West Crocker formations samples
respectively and this also indicates they are thermally mature for hydrocarbon generation.
However, the undifferentiated Formation samples shows low thermal maturity with
vitrinite reflectance values in the range 0.45-0.46%Ro.
The Temburong and West Crocker formations samples have Tmax values in the
range of 474-492°C and 450-515°C respectively indicative of over-maturity for the
Temburong Formation and peak of oil window to over-maturity for West Crocker
Formation samples as described by Peters and Cassa (1994). This is supported by the plot
of present day Hydrogen Index versus pyrolysis Tmax as shown in Figure 6.7. There is
also a good agreement with the measured vitrinite reflectance data. This is further
supported by the increase in aromaticity as recorded from EOM fractionation (see Section
5.4.1). The CPI and OEP values are close to 1 thereby suggest the analysed samples are
thermally mature. The measured MPI-1 from phenanthrenes and alkyl derivatives is in
good agreement with the measured vitrinite reflectance of the studied samples.
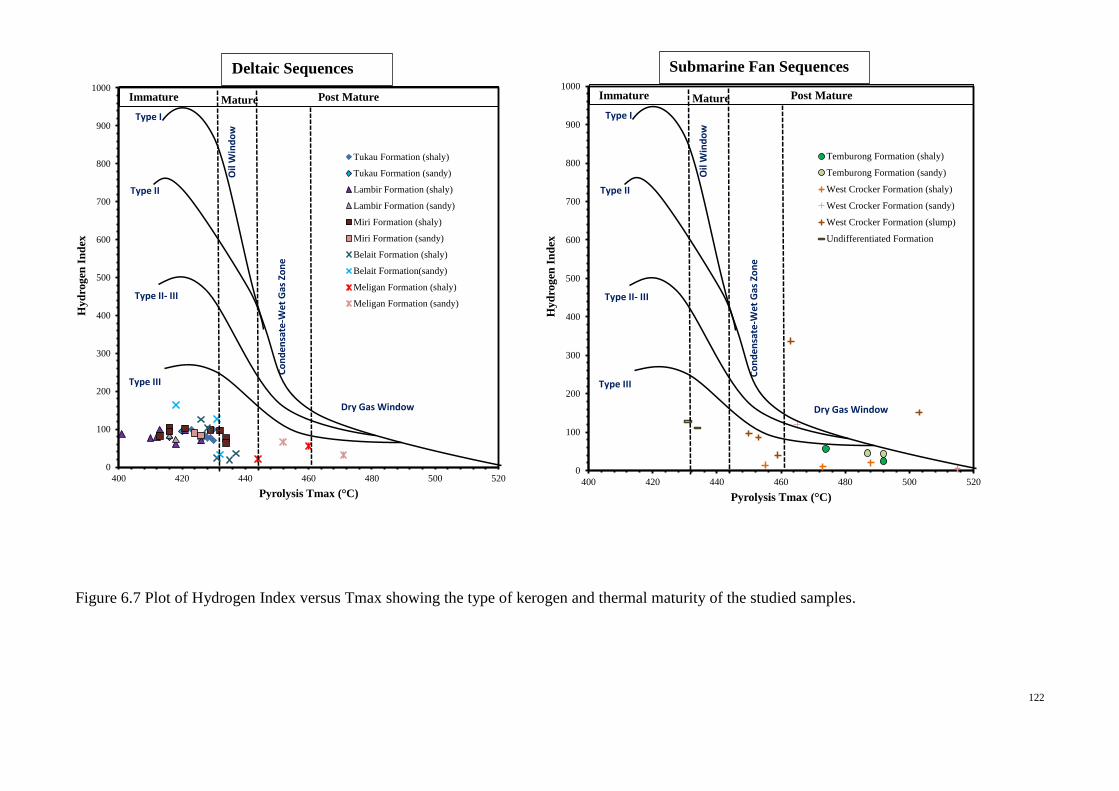
122
Figure 6.7 Plot of Hydrogen Index versus Tmax showing the type of kerogen and thermal maturity of the studied samples.
0
100
200
300
400
500
600
700
800
900
1000
400 420 440 460 480 500 520
Hyd
rogen
In
dex
Pyrolysis Tmax ( C)
Temburong Formation (shaly)
Temburong Formation (sandy)
West Crocker Formation (shaly)
West Crocker Formation (sandy)
West Crocker Formation (slump)
Undifferentiated Formation
Oil
Win
do
w
Co
nd
en
sate
-Wet
Gas
Zo
ne
Dry Gas Window
Type III
Type II- III
Type II
Type I
T
y
p
e
I
I
I
Immature Mature Post Mature
0
100
200
300
400
500
600
700
800
900
1000
400 420 440 460 480 500 520
Hy
dro
gen
In
dex
Pyrolysis Tmax ( C)
Tukau Formation (shaly)
Tukau Formation (sandy)
Lambir Formation (shaly)
Lambir Formation (sandy)
Miri Formation (shaly)
Miri Formation (sandy)
Belait Formation (shaly)
Belait Formation(sandy)
Meligan Formation (shaly)
Meligan Formation (sandy)
Oil
Win
do
w
Co
nd
en
sate
-Wet
Gas
Zo
ne
Dry Gas Window
Type III
Type II- III
Type II
Type I
T
y
p
e
I
I
I
Immature Mature Post Mature
Deltaic Sequences Submarine Fan Sequences
SuSequences

123
6.2.4 Prospect for Liquid Hydrocarbon Generation
The prospect of the studied samples for hydrocarbon generation and expulsion was
evaluated based on bulk and quantitative pyrolysis techniques and organic petrological
study. Capability for liquid hydrocarbon generation potential will be discussed in this
section although the majority of the analysed samples have been shown to be gas prone.
Deltaic Sequences
The deltaic sequences (Tukau, Miri, Lambir, Belait, and Meligan) generally have
pyrolysis HI values less than 150 mg HC/g TOC, indicating that Type III kerogen is the
dominant kerogen in these sediments. This interpretation is supported by kerogen
composition using pyrolysis products of pyrolysis–gas chromatography (Py-GC). The
Type III kerogen has also been confirmed by high contribution of terrigenous organic
matter input as indicated by the presence of vitrinitic-rich phytoclasts with minor
occurrence of spores and pollen. These types of organic matters can generate mainly
gaseous hydrocarbons if they are subjected to sufficient burial and heating as shown in the
ternary diagram shown in Figure 6.8. However, some of the deltaic sequences show
potential to generate liquid hydrocarbon (mainly wet gas/condensate) as supported by the
display of mixed kerogen fingerprints of predominantly n-alkane/alkene doublets and
aromatic compounds. In the Miri, Lambir and Belait formations samples, the pyrolysis –
GC is dominated by the n-alkane/alkene doublets that extend beyond C30, indicative of the
aliphatic–richness with significant aromatic compounds, suggesting capability to generate
waxy hydrocarbon and/or wet gas. In contrast, the samples from Meligan and Tukau
formations show relatively low n-alkane/alkene doublets, indicative of the aliphatic–poor,
and with significant aromatic compounds, suggesting the main generation products are gas.
While the Meligan Formation samples are thermally mature for hydrocarbon generation,
the Tukau, Miri, Lambir and Belait formations samples are immature to very early-mature,

124
thus indicate they have not been buried to a sufficient depth for hydrocarbon generation,
but the stratigraphic offshore equivalents are known to have been buried to deeper depth
and could therefore act as predominantly gas source rocks with limited oil generating
potential.
Submarine Fan Sequences
The submarine fan sequences (West Crocker and Temburong formations) are
generally lower in organic richness compared to the deltaic sequences, although within the
West Crocker Formation abundant resinous coaly fragments do occur within the slump or
debris flow mass transport deposits. Gas prone Type III and IV kerogen are the most
common organic constituents in these sequences although occurrence of oil prone Type II
kerogen was commonly observed in the slump deposits. The oil generative features were
observed to be associated with perhydrous vitrinite and abundant resinous constituents,
was also observed as well as appreciably presence of amorphous organic matter (Figure
6.8) and this is supported by pyrolysis HI up to 300 mg HC/g TOC. This is further
supported by dominance of n-alkane/alkene doublets over aromatic compounds suggesting
the main generation products of the slumps deposit are liquid hydrocarbon. The
Temburong Formation samples are in late maturity stages of hydrocarbon generation while
the West Crocker Formation samples shows variable thermal maturity ranging from early
oil to gas generation stage. It is possible that the oil prone slump deposits within the West
Crocker acts as effective liquid hydrocarbon source rock in NW Sabah due to large scale
occurrence in the offshore part as reported by Algar et al. (2011).

125
Figure 6.8. Predicted hydrocarbon in the studied sequences
Vitrinite
Liptinite
Inertinite
10 20 30 40 50 60 70 80 90
10
20
30
40
50
60
70
80
9010
20
30
40
50
60
70
80
90
Tukau Formation (shaly)
Tukau Formation (sandy)
Miri Formation (shaly)
Miri Formation (sandy)
Lambir Formation (shaly)
Lambir Formation(sandy)
Belait Formation (shaly)
Belait Formation (sandy)
Meligan Formation (shaly)
Meligan Formation(sandy)
10%-grid
10%-ticks
10%-labels
20%-labels
Feldspar diagram
Feldspar diagram labels
Classification and nomenclature of tuffs and ashes
Individual mask
Individual labels
Wet Gas +
Condensate
Dry Gas
Barren
Oil
Vitrinite
Liptinite
Inertinite
10 20 30 40 50 60 70 80 90
10
20
30
40
50
60
70
80
9010
20
30
40
50
60
70
80
90
Temburong Formation (shaly)
Temburong Formation (sandy)
West Crocker Formation (shaly)
West Crocker Formation (sandy)
West Crocker Formation (slump)
Undifferentiated Formation(sandy)
10%-grid
10%-ticks
10%-labels
20%-labels
Feldspar diagram
Feldspar diagram labels
Classification and nomenclature of tuffs and ashes
Individual mask
Individual labels
Wet Gas +
Condensate
Dry Gas
Barren
Oil
Submarine Fan
Sequences
Deltaic Sequences

126
6.3 Source of Organic Matter and Depositional Conditions
The organic matter source input and depositional conditions of the studied
sequences were examined based on petrographic characteristics (palynofacies), molecular
composition (n-alkanes and phenanthrenes) and elemental data.
6.3.1. Palynofacies Indicators
The AOM-phytoclast-palynomorph (APP) plot of Tyson (1993) is applied to give
paleoenvironmental interpretation of the studied sequences.
The palynofacies assemblages in Lambir, Miri ,Tukau and Belait formations shows
dominance of phytoclasts group with high content of transcluscent phytoclasts related to
proximal depositional conditions, with the main controlling factor being the short transport
of the particules. This interval can be interpreted as high energy environment due to the
presence of high percentage of cuticle thus being dominated by terrestrial input (Boulter
and Riddick, 1986; Zavattieri et al., 2008). The phytoclast contents of this facies suggest
the proximity to a fluvio-deltaic source and moderately suboxic depositional conditions
(Kholeif and Ibrahim, 2010). This is supported by Tyson (1993) ternary diagram where the
studied samples from these formations plot in palynofacies field I (Figure 6.9).
Palynofacies assemblages in the Meligan Formation show predominance of
phytoclast group with high content of opaque phytoclast. According to Kholeif and
Ibrahim (2010), opaque are derived from the oxidation of translucent woody material
either during prolonged transport or post-depositional alteration. Tyson (1993) has stated
that, the high frequency of opaque phytoclasts indicates oxidizing conditions and either
proximity to terrestrial sources or redeposition of terrestrial organic matter from fluvio-
deltaic environment.
The Submarine Fan sequences are characterized by almost equal content of
phytoclasts group and AOM with low abundance of palynomorphs. The amorphous

127
organic matter comprises mostly resin. The palynomorphs are mostly spores and pollen
grains of terrestrial origin with a few dinoflagellates. The presence of dinoflagellates may
indicate minor input of marine organic matter in the submarine fan sequences. The high
percentage of AOM in the Submarine Fan sequences indicates enhanced preservation in
reducing conditions and increased stability of water column, resulting in suboxic or anoxic
bottom conditions (Tyson, 1993, 1995; Ibrahim et al. 2002). In oxygen deficient basins,
with high AOM preservation, allochtonous terrestrial material is dominant in the
immediate vicinity of fluvio-deltaic sources or within turbidites (Tyson, 1987, 1993).
Zavatierri et al. (2008) described similar palynofacies association in Neuquen basin,
Argentina, and interpreted it as a relatively high-energy reducing environment with a
terrestrial organic input. Kholeif and Ibrahim (2010) suggest that the very low presence of
palynomorphs suggest a proximal suboxic –anoxic basin environment. Unlike the deltaic
sequences, these assemblages indicate that sediments must have been transported farther
away from land and into nearshore/marine environment as supported by the plot related to
palynofacies field II and IV on Tyson (1993) ternary plot (Figure 6.9).
6.3.2 Molecular Indicators for Source Input and Depositional Conditions
The use of n-alkanes to evaluate organic matter source input is based on short chain
alkanes (n-C15 to n-C19) being predominantly derived from marine algae and long chain
alkanes (n-C25 to n-C31) being derived from land plant waxes (Peters et al.2005). The
Terrigeneous/Aquatic ratio (TAR) is defined as: (n-C27 + n-C29 + n-C31)/ (n-C15 + n-C17 +
n-C19). Values >1 for this parameter indicate more land plant sources than marine algae
sources and low values (<1) indicate more marine algae sources than land plant sources.
TAR values for the deltaic samples range from 2.08 -2.86 for Lambir samples, 1.26-1.98
for Miri samples , 1.98-2.81 for Tukau samples, 2.4-3.2 for Belait samples and 2.06-3.14 in

128
Palynofacies Fields Environment Kerogen Type
I Highly proximal shelf or basin III(gas prone)
II Marginal dysoxic -oxic basin III(gas prone)
III Heterolithic oxic shelf III or IV (gas pprone)
IV Shelf to basin transition III or II (oil prone
V Mud-dominated oxic shelf III>IV (gas prone)
VI Proximal suboxic -anoxic shelf II (oil prone)
VII Distal dysoxic-anoxic shelf II (oil prone)
VIII Distal dysoxic-anoxic shelf II>>I (oil prone)
IX Distal suboxic-anoxic basin II>>I (highly oil prone)
Palynomorphs
Phytoclasts
AOM
10 20 30 40 50 60 70 80 90
10
20
30
40
50
60
70
80
9010
20
30
40
50
60
70
80
90
Tukau Formation
Miri Formation
Lambir Formation
Belait Formation
Meligan Formation
Temburong Formation
West Crocker Formation
Undifferentiated Formation
10%-grid
10%-ticks
10%-labels
20%-labels
Feldspar diagram
Feldspar diagram labels
Classification and nomenclature of tuffs and ashes
Individual mask
Individual labels
V
VII
VIII
III
IV
VI
IX
II
I
Figure 6.9. Ternary amorphous organic matter–phytoclast–palynomorph (APP) kerogen
plot based to characterize the kerogen assemblage and environments under transmitted
light microscopy (modified after Tyson, 1995).

129
Meligan samples suggesting the dominance of land–derived organic matter in these
formations. The TAR values in the submarine fan samples range from 1.89-2.01 for
Temburong samples and 1.56-2.12 in the West Crocker samples. The undifferentiated
formation has TAR values range from 1.58-1.60. This also suggests terrigenous source
input.
Pristane (Pr) and phytane (Ph) are usually the most important acyclic isoprenoid
hydrocarbons in terms of concentration (Powell and McKirdy, 1973), and reflect the
palaeoenvironmental conditions of source rocks and are considered as potential indicators
of the redox conditions during sedimentation and diagenesis (Didyk et al., 1978; Chandra
et al., 1994). Pr/Ph ratio values greater than 3.0 indicate oxic conditions, values below 1.0
indicate anoxic conditions, and values between 1.0 and 3.0 indicate suboxic conditions
(Didyk et al.1978; Peters et al.2005). The Pr/Ph ratio values range from 1-3 in both the
deltaic and submarine sequences and this suggests alternation of oxic and anoxic
conditions during deposition. Some researchers (e.g. ten Haven et al.1987; Peters et al.
2005;) have raised objections to interpreting redox conditions from the Pr/Ph ratio,
suggesting possible sources other than chlorophyll for pristane and phytane and possible
influence of thermal maturity on the ratio. However, in this study redox interpretations
using the Pr/Ph ratio are consistent with interpretations using other biomarker redox
indicators (e.g. Pr/n-C17 versus Ph/n-C18). The Pr/n-C17 versus Ph/n-C18 plots (Figure 6.10)
shows dominance of oxic conditions in the deltaic sequences compared to submarine fan
sequences. The plot also discriminates the source input in the deltaic sequences and
submarine fan. There is indicator of minor contributions of marine organic matter in the
submarine fan sequences, although few samples from the Belait formation also plot in
mixed organic matter field (Figure 6.10) suggesting minor input of marine derived organic
matter in some of the analysed Belait Formation samples.

130
Source input indicator based on phenanthrenes also indicates that the source of the
organic matter in the deltaic and submarine fan sequences is predominantly terrigenous.
Ficken et al. (2000) established that aquatic macrophyte n-alkane proxy (Paq) <0.1
indicates pure terrestrial organic matter, 0.1-0.4 and 0.4-1 indicates dominating
contribution of emergent plants and submerged plants respectively. This is clearly depicted
in the plot of 9MP/PMP+1MP ratio against Paq (Figure 6.11) to distinguish between
various sources of organic input for the samples analysed in this study.
6.3.3. Elemental Indicators
Organic carbon and total sulphur contents in sediments may provide insight into the
depositional environment and microbial sulphate reduction (Berner and Raiswell 1983,
Raiswell et. al.1987; Berner 1989; Hedges and Keil 1995; Adegoke et al. 2014). According
to Hedges and Keil (1996), TOC/TS values of >5 indicates oxic conditions, while values
between 1.5 and 5 indicates suboxic conditions. Anoxic conditions have TOC/TS values
less than 1.5. The TOC/TS values in the deltaic samples range from 2.44-8.05 wt. %
which suggests oxic to suboxic deposition conditions. The submarine fan samples show
lower TOC/TS in the range of 1.29-3.98 wt. % and this indicates deposition under suboxic
conditions. This is well depicted in the plot of organic carbon and sulphur contents as
shown in Figure 6.12.
The relationship between total organic carbon and nitrogen from bulk organic
matter have been used in many studies to distinguish between phytoplankton and terrestrial
plant sources (e.g. Meyers 1997; Bechtel et al. 2001; Lamb et al. 2006; Gao et al. 2012).
The former typically yields low values (4-10), and terrestrial plant sources tend to have
ratios greater than 20 (Meyers 1997), while lacustrine and marine systems close to land
generally show intermediate TOC/TN values (Silliman et al.1996; Muller and Methesius
1999).

131
0.1
1
10
100
0.1 1 10 100
Pri
sta
ne/
C1
7
Phythane/C18
Tukau Formation
Miri Formation
Lambir Formation
Belait Formation
Meligan Formation
Deltaic Sequences
0.1
1
10
100
0.1 1 10 100
Pri
sta
ne/
C1
7
Phythane/C18
Temburong Formation
West Crocker Formation
Undifferentiated Formation
Submarine Fan Sequences
Figure 6.10. Plot of Pr/n-C17 vs Ph/n-C18 showing the deposition conditions of the preserved organic matter in the studied formations

132
0.1
0.2
0.3
0.4
0.5
0.6
0.7
0.8
0.9
1
0 0.2 0.4 0.6 0.8 1
9M
P/9
MP
+1M
P
Paq
Tukau Formation
Miri Formation
Lambir Formation
Belait Formation
Meligan Formation
Temburong Formation
West Crocker Formation
Undifferentiated Formation
Terrestrial organic
matter input
Marine
organic matter input
Figure 6.11 . Plot of 9MP/9MP+1MP ratio against aquatic macrophyte n-alkane proxy
(Paq) of the analysed samples (after Ficken et al., 2000).

133
The TOC/TN ratios in all the deltaic samples are greater than 20 and this reflect
major contributions of terrigenous organic matter. However, the TOC/TN ratios in most
submarine fan samples are slightly lower than 20 which may suggest presence of mixed
organic matter (i.e minor contributions of marine organisms). The mixed organic source
input is supported by minor occurrence of dinoflagellates as described in section 6.3.1 and
as indicated based on the plot of Pr/n-C17 vs Ph/n-C18 (Figure 6.10)
6.3.4 Trace Elements
The trace elements concentrations and ratios reveal the paleo-redox conditions
during sedimentation of siliciclastic rocks (e.g. Harris et al.2004; MacDonald et al.2010;
Fu et al.2011; Adegoke et al.2014).
Vanadium–nickel relationship: Vanadium (V) and Nickel (Ni) are important
indicators for the redox conditions during deposition (Bechtel et al.2001; Galarraga et
al.2008). The relative proportions of V and Ni are controlled by the depositional
environment (Lewan 1984). A V/Ni ratio greater than 3 indicates deposition in a reducing
environment; V/Ni ratios ranging from 1.9 to 3 or less than 1.9 indicate deposition under
suboxic conditions and oxic conditions respectively (Galarraga et al.2008). The cross plot
of V and Ni (Figure 6.13) indicates the deposition of terrigenous organic matter in oxygen
influenced environment.
The Vanadium-Chromium (V/Cr) ratio has been suggested and employed as an
index of paleo-oxygenation in a number of studies (e.g Jones and Manning, 1994; Algeo
and Maynard 2004; Tribovillard et al., 2006). Chromium is usually incorporated within the
detrital clastic fraction of a sediment, where it maysubstitute for Al within clays, be
adsorbed, or occur as chromite (Patterson et al., 1986; Jones and Manning, 1994). In
contrast, vanadium may be bound to organic matters by the incorporation of V4+
into
porphyrins, and is concentrated in sediments deposited under reducing conditions (Jones

134
and Manning, 1994; Tribovillard et al., 2006). So, higher V/Cr ratios are thought to
represent more anoxic (reducing) depositional conditions. The V/Cr ratio above 4 may be
indicative of anoxic depositional conditions and the V/Cr ratio below 2 may indicate oxic
depositional conditions (Jones and Manning, 1994). The V/Cr ratio in the deltaic sequences
range between 1.0-3.5 which suggests oxic and suboxic depositional conditions while the
ratio in the submarine fan sequences range from 2-4 and suggests mainly suboxic
depositional conditions
The Nickel-Cobalt (Ni/Co) ratio suggested from the studies of Lewan (1984) and
Tribovillard et al. (2006) can also be used to interpret the depositional conditions. The
thermodynamics predict that the Ni//Co ratio will decrease as the environment becomes
more oxidising due to the enrichment of cobalt (Telnaes et al., 1991). The Ni/Co ratio of
less than 5 suggests oxic conditions while more than 7 suggests anoxic conditions. Most
the deltaic samples have Ni/Co ratios less than 5 which suggest high level of oxygen
during deposition. The submarine fan sequences have Ni/Co ratios between 5 and 7 and
this suggests suboxic depostional conditions. This is further supported by the cross plot of
Ni/Co versus V/Cr (Figure 6.13 a).
Powell et al. (2003) also revealed that Ni/Co and V/Sc ratios preserved the most
detailed record of paleo-redox conditions. Values of V/Sc < 9.1 correspond to oxic
environment, whereas V/Sc ≥ 10.0 corresponds to low-oxygen depositional environments.
Based on the cross plot of Ni/Co against V/Sc ratios (Powell et al., 2003), the submarine
fan samples were deposited in suboxic marine conditions while the deltaic samples were
deposited in much oxygen influence environment, thus also in agreement with previously
discussed organic geochemical parameters such as total sulphur content and Pr/n-C17 vs
Ph/n-C18 plot.

135
0.1
1
10
0.1 1 10 100
Tota
l S
ulp
hu
r (w
t.%
)
Total Organic Carbon (TOC, wt%)
Tukau Formation
Miri Formation
Lambir Formation
Belait Formation
Meligan Formation
Anozic/Euxinic
Suboxic/ Dysoxic
Oxic (Oxygenated
bottom water)
Deltaic Sequences
0.1
1
10
0.1 1 10 100
Tot
al S
ulp
hu
r (w
t.%
)
Total Organic Carbon (TOC, wt%)
Temburong Formation
West Crocker Formation
Undifferentiated Formation
Anozic/Euxinic
Suboxic/ Dysoxic
Oxic (Oxygenated
bottom water)
Submarine Fan Sequences
Figure 6.12.Relationship between total organic carbon (TOC) and total sulphur (TS) showing the depositional conditions of the analysed samples
(Trendline after Hedges and Keil, 1996).

136
0
200
400
600
800
1000
1200
1400
1600
0 20 40 60 80 100 120 140 160
Van
ad
ium
(p
pm
)
Nickel (ppm)
Tukau Formation
Miri Formation
Lambir Formation
Belait Formation
Meligan Formation
Marine anoxic
shale/carbonate
Marine euxinic
carbonate
Marine -terrestrial
oxic-dysoxic
Terrestrial
oxic
Deltaic Sequences
0
200
400
600
800
1000
1200
1400
1600
0 20 40 60 80 100 120 140 160
Van
ad
ium
(p
pm
)
Nickel (ppm)
Temburong Formation
West Crocker Formation
Undifferentiated Formation
Marine anoxic
shale/carbonate
Marine euxinic
carbonate
Marine -terrestrial
oxic-dysoxic
Terrestrial
oxic
Submarine Fan Sequences
Figure 6.12. Plots of nickel against vanadium (modified after Akinlua et al. 2013).

137
0
1
2
3
4
5
6
7
8
0 5 10 15 20 25
Ni/
Co r
ati
o
V/Sc ratio
Tukau Formation
Miri Formation
Lambir Formation
Belait Formation
Meligan Formation
Temburong Formation
West Crocker Formation
Undifferentiated Formation
Oxic
Suboxic/
Dysoxic
Anoxic
Normal Low Oxygen
0
1
2
3
4
5
6
7
8
9
10
0 2 4 6 8 10N
i/C
o r
ati
o
V/Cr ratio
Tukau Formation
Miri Formation
Lambir Formation
Belait Formation
Meligan Formation
Temburong Formation
West Crocker Formation
Undifferentiated Formation
Ox
icS
ub
ox
icA
no
xic
Oxic Suboxic Anoxic
Figure 6.13 a) Plot of Ni/Co against V/Sc ratios (modified after Powell et al. 2003), b) Plot of Ni/Co and V/Cr (modified after Jones and
Manning,1994)

138
CHAPTER 7
CONCLUSIONS
This thesis integrates petrology and geochemistry in order to evaluate for potential
source rocks in the deltaic (Tukau, Miri, Lambir, Belait, Meligan formations) and
submarine fan (West Crocker and Temburong) deposits. Also, to provide more
information on the source of organic matter and the conditions under which the organic
matter was preserved.
There is variation in TOC in the shaly and sandy facies of the studied Formations.
Most of the sandy facies in the studied formations have higher TOC than the shaly facies
except in the Temburong Formation where the shaly facies have higher TOC content and
this is supported by high EOM yield. This indicates most of the samples within the studied
formations have sufficient total organic carbon content to act as petroleum source rocks.
However, the pyrolysis S2 yields show that most of the deltaic samples have fair to good
hydrocarbon generating potential while the submarine fan deposits shows poor to fair
hydrocarbon generating potential. The slump facies within the West Crocker formation
shows good to excellent hydrocarbon generating potential. This is supported by the
hydrocarbon yield fraction of the EOM.
The organic matter in most of the deltaic and submarine fan sediments is
predominantly Type III kerogen and is gas prone, as indicated by low pyrolysis HI values
of mostly less than 150 mg HC/ g TOC. However, there is evidence of oil prone Type II
kerogen in the West Crocker Formation slump deposits. The dominance of Type III
kerogen is confirmed by low initial H/C atomic ratios in the range of 0.82-0.90 and
abundance of terrestrial–derived organic matter (i.e., vitrinite phytoclasts) as generally
observed in all of the studied samples.

139
Thermal maturity assessed from pyrolysis Tmax and the vitrinite reflectance
indicate that the organic matter in the submarine fan deposits is thermally mature to
overmature for hydrocarbon generation with exception from the sandy facies from the
undifferentiated Formation. The studied deltaic deposits are mostly immature to very early
mature for hydrocarbon generation except for the Meligan Formation samples which
display relatively higher thermal maturity. The maturity inference is supported by CPI,
OEP and MPI-1 obtained from aliphatic and aromatic molecular parameters.
The organic material in the submarine fans and deltaic sediments are derived
mainly from terrestrial environments that were eroded and carried towards the deeper parts
of the basin, via a delta system and submarine canyons. An n-alkane distribution with high
to medium molecular weight typical of terrestrial derived organic matter is most common
especially in the deltaic deposits while some of the submarine fan deposits show evidence
of low molecular weight compounds that suggest minor contribution of marine organic
matter. This is further supported by the occurrence of marine plankton (dinoflagellate) in
the submarine fan deposits. The organic matter present in all the studied samples is mostly
preserved under oxic to suboxic conditons as revealed by n-alkane /isoprenoids ratios and
trace elements distributions. This paleoenvironment conditions is further supported by the
palynofacies assemblages in the analysed organic matter.
Integration of all geochemical-petrographic analyses indicate that the immature
deltaic deposits and the slump deposits of the submarine fan has a possible hydrocarbon
potential of mainly gas with minor oil and should attract further research. This could
include detailed sedimentology logging for adequate information on the lateral extent and
volumes of these strata . Also, biomarker study based on hopane and sterane distributions
that could be directly correlated with the known occurences of oil accumulation within the
petroleum prolific basins of offshore Sarawak and Sabah.

140
REFERENCES
Abdullah, W.H., (1999). Oil generating potential of Tertiary coals and other organic –rich
sediments of the Nyalau Formation, onshore Sarawak. Jour. Asian Earth Sci., 17,
255-267.
Abdul Jalil, M., Mohd Jamaal, H., (1992). Possible source for the Tembungo Oils:
Evidences from Biomarker Fingerprints . GSM, 32, 213-232.
Abdullah, W.H., (2003). Coaly source rocks of NW Borneo: role of suberinite and
bituminite in oil generation and expulsion. Geological Society of Malaysia Bulletin
47, 153–163.
Abeida, H.S., Abdul Hadi, A., Zuhar Zahir, T.H., (2005). Facies, Depositional Framework
and Sequence Stratigraphy of the Miri Formation (Middle Miocene), Miri, Sarawak.
PGCE, 6 December, Kuala Lumpur.
Adedosu , T.A, Sonibare, O.O., Tuo, J., Ekundayo, O., (2012). Biomarkers, carbon
isotopic composition and source rock potentials of Awgu coals, middle Benue trough,
Nigeria. Journal of African Earth Sciences, 66, 13-21.
Adegoke, A.K, Abdullah, W.H, Hakimi, M.H, Sarki Yandoka, B.M, Mustapha, K.A,
Aturamu, A.O., (2014). Trace elements geochemistry of kerogen in Upper
Cretaceous sediments, Chad (Bornu) Basin, northeastern Nigeria: Origin
and paleo-redox conditions. Journal of African Earth Sciences 100:675-683.
Akinlua, A., Adekola, S.A., Swakamisa, O., Fadipe, O.A., Akinyemi, S.A., (2010). Trace
element characterisation of Cretaceous Orange Basin hydrocarbon source rocks.
Applied Geochemistry 25:1587-1595.
Alberdi-Genolet, M., Tocco, R., (1999). Trace metals and organic geochemistry of the
Machiques Member (Aptiana-Albian) and La Luna Formation (Cenomanian-
Campanian), Venezuela. Chemical Geology 160:19-38.
Agostinelli, E., M. R. A. Tajuddin, E. Antollielli, and M. M. Aris (1990), Miocene‐Pliocene palaeogeographic evolution of a tract of Sarawak offshore between Bintulu
and Miri, Bull. Geol. Soc. Malays., 27, 117–135.

141
Alexander, R., Kagi, R. I. , Woodhouse, G. W. (1981). Geochemical correlation of
Windalia oil and extract of winning group (Cretaceous) Potential source rock,
Barrow Sub-basin, Western Australia, AAPG Bulletin, 65, 235-50.
Algar, S., C. Milton, H. Upshall, J. Roestenburg, Crevello, P., (2011). Mass-transport
deposits of the deep-water north western Borneo margin (Malaysia);
characterization from seismic reflection, borehole, and core data with
implications for hydrocarbon exploration and exploitation, in R.C. Shipp, P.
Weimer, and H.W. Posamentier, (eds.), Mass transport deposits in deep-water
settings: Society for Sedimentary Geology, Special Publication 96, p. 351-366.
Algar, S.C., (2012). Big Oil from “Gas Prone” Source Rocks and Leaking Traps:Northwest
Borneo. AAPG ICE, Singapore.
Algeo, T.J., Maynard, J.B., ( 2004). Trace-element behavior and redox facies in core
shales of Upper Pennsylvanian Kansas-type cyclothems: Chemical Geology, v.
206, p. 289- 318.
Anuar, A., Hoesni, M.J., (2008). The Hydrocarbon Property Variation in the West Baram
Delta Petroleum System: Unravelling the Respective Effects of Biodegradation
and Source Facies. AAPG International Conference and Exhibition, Cape Town,
South Africa. October 22.
Anuar A., Kinghorn, R.F., (1994). Sterane and triterpane biomarker characteristics from oil
and sediments extracts of the Middle-Upper Miocene sequences, Northern Sabah
Basin. GSM Bulletin, 37.
Anuar, A., Abdul Jalil, M., (1997). A comparison of source rock facies and hydrocarbon
types of the Middle Miocene sequence, offshore NW Sabah Basin Malaysia. In:
Howes, J.V.C. and Noble , R.A eds, Proceedings of the IPA Petroleum Systems of
SE Asia and Australia, 21-23 May 1997, Indonesian Petroleum Association, Jakarta,
773-786.
Arfaoui, A., Montacer, M., Kamoun, F. and Rigane, A., (2007) Comparative study
between Rock-Eval prolysis and biomarkers parameters: A case study of Ypresian
source rocks in central-northern Tunisia. Marine and Petroleum Geology, 24, 566-
578.
Armstroff A. et.al., (2006). Aromatic hydrocarbon biomarkers in terrestrial organic matter
of Devonian to Permian age. Paleogeography, Palaeoclimatology, Palaeoecology
(240) 253-274

142
Back, S., Morley, C.K., Simmons, M.D., Lambiase, J.J., (2001). Depositional environment
and sequence stratigraphy of Miocene deltaic cycles exposed along the Jerudong
anticline, Brunei Darussalam. Journal of Sedimentary Research, 71, 913-921.
Back, S., Strozyk, F., Kukla, P., Lambiase, J.J., (2008). Three-dimensional restoration of
original sedimentary geometries in deformed basin fill, onshore Brunei Darussalam,
NW Borneo. Basin Research, 20, 99-117.
Back, S., Tioe Hak Jing, Tran Xuan Thang, Morley, C.K., (2005). Stratigraphic
development of synkinematic deposits in a large growth-fault system, onshore Brunei
Darussalam. Journal of the Geological Society, London, 162, 243-258.
Balaguru, A., Nichols, G.J., Hall, R., (2003). The origin of the circular basins of Sabah,
Malaysia. Geological Society of Malaysia Bulletin 46, 335–351.
Balaguru, A., Nichols, G.J., (2004). Tertiary stratigraphy and basin evolution, southern
Sabah (Malaysian Borneo). Journal of Asian Earth Sciences 23, 537–554.
Baskin, D.K. (1997). Atomic H/C ratio of kerogen as an estimate of thermal maturity and
organic matter conversion. AAPG Bulletin 8, 1437-1450.
Bastow, T.P., Alexander, R., Sosrowidjojo, I.B. and Kagi, R.I., (1998).
Pentamethylnaphthalenes and related compounds in sedimentary organic matter.
Organic Geochemistry 28.9-10:585-595.
Bastow, T.P., Alexander, R., Fisher, S.J., Singh, R.K., van Aarssen, B.G.K. and Kagi, R.I.,
(2000).Geosynthesis of organic compounds. Part V-methylation of
alkylnaphthalenes. Organic Geochemistry 31:523-534.
Batten, D. J., (1981). Palynofacies, organic maturation and source potential for petroleum.
In: Brooks J. (Ed), Organic maturation studies and fossil fuel exploration.
Academic Press, London, pp. 201 – 223.
Batten, D.J., (1996). Palynofacies and paleoenvironmental interpretation.In Jansonius J,
McGregor DC (Eds.), Palynology: Principles and applications; Amer. Assoc. Strat.
Palynol. Found., 3: 1011-1064.
Batten, D.J., (1999). Small palynomorphs. In: Jones TP, Rowe NP (eds) Fossil plants and
spores: modern techniques. Geological Society, London, pp 15–19

143
Barwise, A.J.G., (1990). Role of nickel and vanadium in petroleum classification. Energy
Fuels 4:647-652.
Bechtel, A., Gratzer, R., Sachsenhofer, R.F., (2001) Chemical characteristics of Upper
Cretaceous (Turonian) jet of the Gosau Group of Gams/Hieflau (Styria, Austria).
International Journal of Coal Geology 46:27-49.
Berner, R.A., (1989). Biogeochemical cycles of carbon and sulfur and their effect on
atmospheric oxygen over phanerozoic time. Palaeogeography, Palaeoclimatology,
Palaeoecology 75:97-122.
Berner, R.A., Raiswell, R., (1983). Burial of organic carbon and pyrite sulfur in sediments
over phanerozoic time: a new theory. Geochimica et Cosmochimica Acta 47:855-862.
Banerjee, A., Sinha, A. K., Jain, A. K., Thomas, N. J., Misra, K. N., & Chandra, K. (1998).
A mathematical representation of Rock-Eval Hydrogen index vs Tmax profiles.
Organic Geochemistry, 28, 43–55.
Barckhausen, U., Roeser, H.A., (2004). Seafloor spreading anomalies in the South China
Sea revisited. In: Clift, P., Wang, P., Kuhnt, W., Hayes, D.E. (Eds.), Continent–
Ocean Interactions within the East Asian Marginal Seas, vol. 149. American
Geophysical Union Geophysical Monograph, pp. 121–125.
Bol, A.J., van Hoorn, B., (1980). Structural style in western Sabah offshore. Bulletin of the
Geological Society of Malaysia 12, 1–16.
Boulter, M., C., Riddick, A., (1986). Classification and analysis of palynodebris from the
Paleocene sediments of the Forties Field: Sedimentology, 33, 871–886.
Bourbonniere, R. A. and Meyers, P. A., (1996). Sedimentary geolipid records of historical
changes in the watersheds and productivities of the Lakes Ontario and Erie,
Limnology and Oceanography, 41, 352-59.
Bordenave, M. L., Espitalie, J., Leplat, P., Oudin, J. L. and Vendenbroucke, M., (1993).
Screening techniques for source rock evaluation. In: Bordenave, M. L. (Ed.),
Applied Petroleum Geochemistry Editions Technip, Paris, pp. 237-255.

144
Bostick, N.H., (1979), Microscopic measurement of the level of catagenesis of solid
organic matter in sedimentary rocks to aid exploration for petroleum and to
determine former burial temperatures -- a review, in P.A. Scholle, and P.R.
Schluger, eds., Aspects of Diagenesis: S.E.P.M. Special Publication 26, p. 17-43.
Bray, E. E. and Evans, E. D., (1961). Distribution of n-paraffin’s as a clue to recognition of
source beds. Geochimica et Cosmochimica Acta, 22, 2-15.
Brooks, J. D., Gould, K. and Smith, J. W., (1969). Isoprenoids hydrocarbons in coal and
petroleum. Nature, 222, 257-9.
Budzinski, H. et. al.., (1995). Alkylated phenanthrene distributions as maturity and origin
indicators in crude oils and rock extracts. Geochimica et Cosmochimica Acta. 59,
2043– 2056.
Briais, A., Patriat, P., Trapponier, P., (1993). Updated interpretation of magnetic anomalies
and seafloor spreading stages in the South China Sea: implications for the Tertiary
tectonics of Southeast Asia. Journal of Geophysical Research, 98, 6299-6328.
Carvalho, M.A., Filho, J.G.M., Menezes, T.R., (2006). Paleoenvironmental reconstruction
based on palynofacies analysis of the Aptian-Albian succession of the Sergipe Basin,
North eastern Brazil, Marine Micropaleontol. 59: 56-81
Crevello, P.D et al. (2006). “Mixed braided and leveed-channel turbidites, West Crocker
fan system, northwest Borneo,” in Atlas of Deep-Water Outcrops, AAPG Studies in
Geology 56.
Curiale, J., Morelos, J., Lambiase, J., Mueller, W., (2000). Brunei Darussalam—
characteristics of selected petroleums and source rocks. Organic Geochemistry 31,
1475–1493.
Combaz, A., (1964). Les palynofaciès. Revue de Micropaléontologie, v. 7, p. 205-218.
Darlrymple, R.W., Zaitlin, B.A., Boyd, R., (1992). Estuarine facies models: Conceptual
basis and stratigraphic implications. Journal of Sedimentary Petrology, 62: 1130-
1146.
Dembicki, H.J., 2009. Three common source rock evaluation errors made by geologists
during prospect or play appraisals Am. Assoc. Pet. Geol. Bull., 93 (3) pp. 341–35.

145
Dembicki, H.J., Horsfield, B., & Thomas, T.Y.H., (1983). Source rock evaluation by
pyrolysis-gas chromatography. American Association of Petroleum Geologists
Bulletin 67(7), pp. 1094-1103.
Dembicki Jr., H., (2009). Three common source rock evaluation errors made by geologists
during prospects or play appraisals. American Association of Petroleum Geologists
Bulletin 93(3), 341-356
Demaison, G. J. and Moore, G. T., (1980). Anoxic environments and oil source bed
genesis. AAPG Bulletin, 64, 1179-1209.
Derenne, S., Largeau, C., Casadevall, E. and Connan, J., (1988). Comparison of torbanites
of various origins and evolutionary stages. Bacterial contribution to their formation.
Cause of lack of botryococcane in bitumens. Organic Geochemistry, 12, 43-59.
Dyman, T. S., Palacas, J. G., Tysdal, R. G., Perry, W. G., Pawlewicz, M. J., (1996). Source
rocks potentials of middle Cretaceous rocks in south western Montana.
AAPG Bulletin 80, 1177-84.
Didyk, B. M., Simoneit, B. R. T., Brassell, S. C., Eglinton, G., (1978). Organic
geochemical indicators of paleoenvironmental conditions of sedimentation. Nature,
272, 216-22.
Durand, B., Monin, J.C., (1980). Elemental analysis of kerogens (C, H, O, N, S, Fe), In: B.
Durand (Ed.), Kerogen, Editions Technip, Paris (1980), pp. 113–142.
Eglinton, T.I, Sinninghe Damsté, J.S, Kohnen, M.E.L., de Leeuw, J.W., (1990). Rapid
estimation of the organic sulphur content of kerogens, coals and asphaltenes by
pyrolysis-gas chromatography. Fuel, 69, pp. 1394–1404
Eglinton, G. and Hamilton, R. G., (1967). Leaf epicuticular waxes. Science 156, 1322–
1344.
Ehinola, O. A., Sonibare, O. O., Jave, D. M. and Oluwole, E. A., (2008). Geochemical
appraisal of organic matter in the Mid-Cretaceous sediments of the Calabar Flank,
Southeastern, Nigeria. European Journal of Scientific Research, 23 (4), 567-77.
Emerson, S., (1985). Organic carbon preservation in marine sediments, American
Geophysical Union, Washington DC, 78-86

146
Espitalie, J., Marques, F. and Barsony, I., (1984). Geochemical logging. In: Voorhees, K.J.
(Ed.), Analytical Pyrolysis-Techniques and Applications: Boston, Butterworth, p.
276-304.
Ficken, K.J., Li, B., Swain, D.L. and Eglinton, G., (2000). An n-alkane proxy for the
sedimentary input of submerged/floating fresh water aquatic macrophytes.
Organic Geochemistry 31.7-8:745-749.
Gao, X., Yang, Y., Wang, C., (2012). Geochemistry of organic carbon and nitrogen in
surface sediments of coastal Bohai Bay inferred from their ratios and stable isotopic
signatures. Marine Pollution Bulletin 64:1148-1155.
Galarraga, F., Reategui, K., Martïnez, A., Martínez, M., Llamas, J., Márquez, G., (2008).
V/Ni ratio as a parameter in palaeoenvironmental characterisation of nonmature
medium-crude oils from several Latin American basins. Journal of Petroleum Science
and Engineering 61:9-14.
Gartrell, A., Torres, J., Hoggmascall, N., (2011). A regional approach to understanding
basin evolution and play systematic in Brunei – unearthing new opportunities in a
mature basin. In: International Petroleum Technology Conference, Bangkok,
Thailand, IPTC 1571, 1–5.
Giraud, A., (1970). Application of pyrolysis and gas chromatography to the geochemical
characterization of kerogen in sedimentary rocks. Bull. Am. Assoc. Pet. Geol., 54,
pp. 439–455
Gogou, A., Bouloubassi, I. and Stephanou, E. G., (2000). Marine organic geochemistry of
the Eastern Mediterranean: 1. Aliphatic and polyaromatic hydrocarbons in Cretan
Sea surficial sediments. Marine Chemistry, 68, 265-82.
Hakimi, M.H., Wan Hasiah, A., & Shalaby, M.R., (2011). organic geochemical
characteristics and depositional environments of Jurassic shales in the Masila basin
of Eastern Yemen, Geo Arabia 16(1), pp. 47-64.
Hakimi, M.H., Abdullah, W.H., Sia, G.S., Makeen, Y.M., (2013). Organic geochemical
and petrographic characteristics of Tertiary coals in the northwest Sarawak,
Malaysia: Implications for palaeoenvironmental conditions and hydrocarbon
generation potential. Marine and Petroleum Geology 48, 31-46.
Haile, N., Ho, C., (2014). Geological field guide, Sibu-Miri Traverse, Sarawak. 37p

147
Hall, R., (1996). Reconstructing Cenozoic SE Asia. In: Hall, R. & Blundell, D. J., (eds.)
Tectonic Evolution of SE Asia. Geological Society, London, Special Publications
106, 153- 184.
Hall, R., and Nichols, G., (2002). Cenozoic sedimentation and tectonics in Borneo:
climatic influences on orogenesis. In: Jones S J, Frostick, L. (eds.),
Sediment Flux to Basins: Causes, Controls and Consequences, Geological Society
London Special Publication, 191:5–22.
Hall, R., and C. K. Morley (2004), Sundaland basins, in Continent‐Ocean Interactions
within East Asian Marginal Seas, Geophys. Monogr. Ser, vol. 149, edited by P.
Clift et al., pp. 55–85, AGU, Washington, D. C.
Hall, R., van Hattum, M.W.A., Spakman, W., (2008). Impact of India–Asia collision on SE
Asia: the record in Borneo. Tectonophysics 451, 366–389.
Hall, R., (2013). Contraction and extension in northern Borneo driven by subduction
rollback. J. Asian Earth Sci. 76, 399-411
Harris, N. B., Freeman, K. H., Pancost, R. D., White, T. S. and Mitchell, G. D. (2004). The
character and origin of lacustrine source rocks in the Lower Cretaceous synrift
section, Congo Basin, west Africa. AAPG Bulletin 88, 1163– 1184.
Hazebroek, H. P., and Tan, D. N. K., (1993). Tertiary tectonic evolution of the NW Sabah
continental margin, in Proceedings of the Symposium on Tectonic Framework and
Energy Resources of the Western Margin of Pacific Basin, edited by G. H. Teh,
Bull. Geol. Soc. Malays., 33, 195–210.
Hesse, S., S. Back, and Franke, D., (2009). The deep‐water fold‐and‐thrust belt offshore
NW Borneo: Gravity‐driven versus basement‐driven shortening, Geol. Soc. Am.
Bull., 121, 939–953, doi:10.1130/B26411.1.
Hinz, K., and Schlüter, H.U., (1985). Geology of the Dangerous Grounds, South China Sea
and the continental margin off southwest Palawan: Results of SONNE cruises SO‐23
and SO‐27, Energy, 10, 297–315.
Hinz, K., J. Fritsch, E. H. K. Kempter, A. Manaf Mohammad, J. Meyer, D. Mohammad, H.
Vosberg, J. Weber, and J. Benavidez., (1989). Thrust tectonics along the north‐western continental margin of Sabah/Borneo, Geol. Rundsch., 78, 705–730,

148
Hunt, J.M., (1996). Petroleum Geochemistry and Geology. W.H. Freeman and Company.
New York. pp. 743
Hutchison, C.S., (1996a). The ‘Rajang accretionary prism’ and ‘Lupar Line’ problem of
Borneo. In: R. Hall and D.J. Blundell, (eds.) Tectonic evolution of Southeast Asia,
Geological Society, London, Special Publication, 106, 247-261.
Hutchison, C.S., (1996b). South-East Asian Oil, Gas, Coal and Mineral Deposits, Oxford
Monographs on Geology and Geophysics, 36, Clarendon Press, Oxford, 265 p
Hutchison, C.S., Bergman, S.C., Swauger, D.A., Graves, J.E., (2000). A Miocene
collisional belt in north Borneo: uplift mechanism and isostatic adjustment quantified
by thermochronology. Journal of the Geological Society, London, 157, 783–793.
Hutchison, C.S., (2005). Geology of North-West Borneo. Elsevier. pp.42.
Horsfield, B., (1989). Practical criteria for classifiying kerogens: some observations from
pyrolysis–gas chromatography. Geochim. Cosmochim. Acta, 53.
Horsfield, B., (1997). The bulk composition of first-formed petroleum in source rocks. In:
D.H. Welte, B. Horsfield, D.R. Backer (Eds.), Petroleum and Basin Evolution;
Insights from Petroleum Geochemistry, Geology and Basin Modeling, Springer,
Berlin.
Horsfield, B., Dueppenbecker, S., (1991). The decomposition of Posidonia Shale and
Green River Shale kerogens using microscale sealed vessel (MSSV) pyrolysis. J.
Anal. Appl. Pyrolysis 20, 107-123.
Hedges J, Keil R (1995) Sedimentary organic matter preservation: an assessment and
speculative synthesis. Marine Chemistry 49:81-115.
Ibrahim, M. I. A., Al-Saad, H, Kholeif, S.E.,(2002).Chronostratigraphy, palynofacies,
source rock potential, and organic thermal maturity of Jurassic rocks of Qatar.
GeoArabia, 7: 675 – 696.
Ingram, G. M., T. J. Chisholm, C. J. Grant, C. A. Hedlund, P. Stuart‐Smith, and J. Teasdale
(2004). Deepwater North West Borneo: Hydrocarbon accumulation in an active
fold thrust belt, Mar. Pet. Geol., 21, 879– 887,

149
Jones, B.,. Manning, D. A.C., (1994). Comparison of geochemical indices used for the
interpretation of paleoredox conditions in ancient mudstones: Chemical Geology, v.
111,p. 111-129.
Jackson, C.A.L, Zakaria, A.A., Johnson, H.D., Tongkul, F., Crevello, P.D., (2009).
Sedimentology, stratigraphic occurrence and origin of linked debrites in the West
Crocker Formation (Oligo-Miocene), Sabah, NW Borneo. Marine and Petroleum
Geology 26, p.1957-1973.
James, D.M.D., (1984). Regional geological setting, In: D.M.D. James, (ed.) The Geology
and Hydrocarbon Resources of Negara Brunei Darussalam. Brunei Museum and
Brunei Shell Petroleum Company, 34-42.
Killops, S.D., Killops, V.J., (2005). Introduction to organic geochemistry. Blackwell Pub.,
Malden, MA.
Kholeif, S.H.E, Ibrahim, M.I, (2010). Palynofacies Analysis of Inner Continental Shelf and
Middle Slope Sediments offshore Egypt, South-eastern Mediterranean, Geobios 43:
333-340.
Kessler, F.L., (2010). Observations on sediments and deformation characteristics of the
Sarawak Foreland, Borneo Island. Warta Geologi 35,1-10
Kessler, F.L., (2005). Comments on the evolution of Bukit Lambir area; PGCE, 6
December, Kuala Lumpur.
King, R. C., M. R. P. Tingay, R. R. Hillis, C. K. Morley, and J. Clark (2010). Present‐day
stress orientations and tectonic provinces of the NW Borneo collisional margin, J.
Geophys. Res., 115, B10415, doi:10.1029/2009JB006997.
Lamb, A.L., Wilson, G.P., Leng, M.J., (2006). A review of coastal palaeoclimate and
relative sea- level reconstructions using δ13C and C/N ratios in organic material.
Earth-Science Reviews 75:29-57.
Larter, S.R., (1984). Application of analytical pyrolysis technique to kerogen
characterization and fossil fuel exploitation. In: K. Voorhees (Ed.), Analytical
Pyrolysis, Butterworth's, London, pp. 212–275
150
Larter, S.R., Douglas, A.G., (1980). A Pyrolysis –gas chromatographic method for kerogen
typing. In: A.G. Douglas, J.R. Maxwell (Eds.), Advances in Organic Geochemistry.
Pergamon Press, New York, pp. 579–584.
Larter, S.R., Senftle, J.T., (1985). Improved kerogen typing for petroleum source rock
analysis. Nature 318, 277-280.
Lambiase, J.J. and Suraya Tulot, (2013). Low energy, low latitude wave-dominated
shallow marine depositional systems: examples from northern Borneo. Journal of
Marine Geophysics.
Lambiase, J.J. and A. B. Cullen, (2013). Sediment supply systems of the Champion
"Delta" of NW Borneo: implications for deepwater reservoir sandstones. Journal of
Southeast Asian Earth Sciences, 76, 356-371.
Lambiase, J.J., Tzong, T.Y., William, A.G., Cullen, A.B., (2008). The WestCrocker
formation of NW Borneo: an Eocene accretionary prism. In: Draut, A.E., Clift,
R.D., Scholl, D.W. (Eds), Formation and Applications of theSedimentary record
in Arc Collision Zones. Geological Society of America, Special Paper, 436,
pp. 171–184.
Lambiase, J.J., Ovinda, (2006). Reservoir geometry, lateral facies continuity and
permeability heterogeneities in outcropping shoreface sandstones, Brunei
Darussalam. In: American Association of Petroleum Geologists International
Conference, Perth.
Leong, K.M., (1999).Geological Setting of Sabah. The Petroleum Geology and Resources
of Malaysia. Petroliam Nasional Berhard (PETRONAS). Kuala Lumpur. 293-341.
Lesslar, P. and Wannier , M., (2001). Destination Mri: A geological tour of Northern
Sarawak’s National Parks and Giant Caves. Multimedia in Ecomedia Software,
Miri Sarawak.
Leichti P, Roe FN, Haile NS, Kirk HJC (1960) The geology of Sarawak, Brunei and
western part of north Borneo. Sarawak Geological Survey 3:
Lewan, M.D. Maynard, J.B., (1982). Factors controlling enrichment of vanadium and
nickel in the bitumen of organic sedimentary rocks: Geochimica et Cosmochimica
Acta, v. 46, p.2547-2560.

151
Lewan, M.D., (1984). Factors controlling the proportionality of vanadium to nickel in
crude oils: Geochimica et Cosmochimica Acta, v. 48, p. 2231-2238.
Levell, B.K., (1987). The nature and significance of regional unconformities in the
hydrocarbon-bearing Neogene sequence offshore West Sabah. Geological Society
of Malaysia Bulletin, 21, 55-90.
Leong, K.M., Azlina Anuar (1999). Sabah Basin. The Petroleum Geology and Resources
of Malaysia. Petroliam Nasional Berhard (PETRONAS). Kuala Lumpur. 499-515.
Mazlan b. Haji Madon (1997) Sedimentological aspects of the Temburong and Belait
Formations, Labuan (Offshore west Sabah, Malaysia). Geol. Soc. Malay. Bull., 41,
61-84
Mackenzie, A. S. (1984). Application of biological markers in petroleum geochemistry. In:
Advances in Petroleum Geochemistry Vol.1 (J. Brooks and D. H. Welte, eds.),
Academic Press, London, p. 115-214.
Madon, M.B.H., Abolins, P.. (1999). Balingian Province. In The Petroleum Geology and
Resources of Malaysia pp-343-346, PETRONAS , Kuala Lumpur, Malaysia
Madon, M. B. H., (1999a). Geological Setting of Sarawak, in The Petroleum Geology and
Resources of Malaysia, pp. 273–290, PETRONAS, Kuala Lumpur, Malaysia.
Madon, M. B. H., (1999b). Basin types, tectono‐stratigraphic provinces, structural styles,
in The Petroleum Geology and Resources of Malaysia, pp. 77–112, PETRONAS,
Kuala Lumpur, Malaysia.
Mango, F. D. (1991). The stability of hydrocarbons under time-temperature condition of
petroleum genesis. Nature 352, 146-148.
Moldowan, J. M., Seifert, W. K. and Gallegos, E. J., (1985). Relationship between
petroleum composition and depositional environment of petroleum source rocks.
AAPG Bulletin, 69:12, 55-68.
Meyers, P. A., (1997). Organic geochemical proxies of Paleooceanographic,
Paleolimnlogic, and Paleoclimatic processes. Organic Geochemistry, 27, 213-50.

152
Milsom, J., Holt, R., Bin Ayub, D., Smail, R., (1997). Gravity anomalies and deep
structural controls at the Sabah-Palawan margin, South China Sea. In: Frazer,
A.J., Matthews, S.J., Murphy, R.W., (eds.). Petroleum Geology of Southeast
Asia. Geological Society, London, Special Publication, 126, 417-427.
Morley, C. K., (2003). Mobile shale related deformation in large deltas developed on
passive and active margins, in Subsurface Sediment Mobilization, edited by P. van
Rensbergen et al., Geol. Soc. Spec. Publ., 216, 335–357.
Morley, C.K., Back, S., (2008). Estimating hinterland exhumation from late orogenic basin
volume, NW Borneo. Journal of Geological Society, London, 165, 353-364.
Morrison, K., Lee, W. C., (2003). Sequence stratigraphic framework for Northwest
Borneo. Bulletin of the Geological Society of Malaysia, 47, 127-138
MacDonald, R., Hardman, D., Sprague, R., Meridji, Y., Mudjiono, W., Galford, J., Rourke,
M., Dix, M., Kelto, M., (2010). Using elemental geochemistry to improve
sandstone reservoir characterization: a case study from the Unayzah A interval of
Saudi Arabia. In: SPWLA 51st Annual Logging Symposium. pp 1-16
Muller, A., Voss, M., (1999). The palaeoenvironments of coastal lagoons in the southern
Baltic Sea, II. δ13C and δ15N ratios of organic matter — sources and sediments.
Palaeogeography, Palaeoclimatology, Palaeoecology 145:17-32.
Nissenbaum, A., Swaine, D., (1976). Organic matter-metal interactions in Recent
sediments: the role of humic substances. Geochimica et Cosmochimica Acta
40:809-816
Nagarajan R., (2013). Geochemistry of Neogene sedimentary rocks of Borneo Basin, East
Malaysia: Paleo-weathering, provenance and tectonic setting. Chemie Erde-
Geochemistry.
Nøhr-Hansen, H., (1989). Visual and chemical kerogen analyses of the Lower Kimmeridge
Clay, Westbury, England. In: Batten DJ, Keen MC (eds) Northwest European
micropalaeontology and palynology. Ellis Horwood Limited, Chichester, pp 118–132
Nizam , A.B., Abudul Hadi, A., Mazlan, M., (2008). The West Crocker Formation (Early
Oligocene to Middle Miocene) in the Kota Kinabalu Area, Sabah: Facies,
Sedimentary Processes and Depositional Setting. PGCE, 14 January, Kuala Lumpur

153
Nor Azidin, N.F., Balaguru, A., Ahmad, N., (2011). Structural Styles of the North West
Sabah and West Sulawesi Fold Thrust Belt Regions and its Implication to the
Petroleum System – A Comparison. PGCE , 03 July, Kuala Lumpur
Patterson, J.H., A.R. Ramsden, L.S. Dale, and J.J. Fardy, (1986), Geochemistry and
mineralogical residences of trace elements in oil.
Paramananthan, S., (1998). Malaysian Soil Taxonomy (Second Approximation). Mal. Soc.
Soil Sci. and Param Agric .Soil Surveys, March
PETRONAS., (2013), Petronas announces oil and gas discovery onshore Sarawak.
Petronas Media Release. Retrieved from http://www.petronas.com.my/media-
relations/media releases/Pages/article/PETRONAS-ANNOUNCES-OIL-
AND-GAS-DISCOVERY-ONSHORE-SARAWAK.aspx. January 18
PETRONAS, (1999). The Petroleum Geology and Resources of Malaysia: Kuala Lumpur,
Malaysia, Petroliam Nasional Berhad, 665p
Peters, K. E. (1986) Guidelines for evaluating petroleum source rock using programmed
pyrolysis. AAPG bulletin, 70, 318-329.
Peters, K.E., Cassa, M.R., (1994). Applied source rock geochemistry.In: Magoon , L.B.,
Dow,W.G.(Eds), The Petroleum System-From Source to Trap. American
Association of Petroleum Geologists Memoir, vol 60, pp.93-120.
Peters, K.E., Walters, C.C., Moldowan, J.M.,(2005). The biomarker guide. Cambridge
University Press, Cambridge, UK
Peters, K.E., Moldowan, J.M., (1993) The biomarker guide. Prentice Hall, Englewood
Cliffs, N.J.
Pepper, A. S., Corvi, P., (1995) Simple kinetic models of petroleum formation. Part 1: Oil
and gas generation from kerogen. Marine and Petroleum Geology, 12, 291-319.
154
Pereira, W.E., Hostettler, F.D., Luoma, S.N., van Geen, A., Fuller, C.C., Anima, R.J.,
(1999). Sedimentary record of anthropogenic and biogenic polycyclic aromatic
hydrocarbons in San Francisco Bay, California. Mar. Chem. 64, 99–113.
Philp, R. P. (1985). Fossil Fuel Biomarkers. Methods in Geochemistry and Geophysics,
Elsevier, New York, 23, p. 294.
Powell, T. G., (1988). Pristane/Phytane ratio as environmental indicator. Nature,333, 604.
Powell, A.J., Dodge, J.D., Lewis, J., (1990).Late Neogene to Pleistocene palynological
faciesof the Peruvian continental margin upwelling, Leg 112. Proceedings of the
OceanDrilling Project, Scientific Results, 112, pp. 297–321
Powell, W.G., Johnston, P.J., Collom, C.J., (2003). Geochemical evidence for
oxygenated bottom waters during deposition of fossiliferous strata of the Burgess
ShaleFormation. Palaeogeography, Palaeoclimatology, Palaeoecology 201, 24
268.
Pi, D.H., Cong-Qiang, L., Shields-Zhoud, A.G., Shao-Yong J., (2013).Trace and rare earth
element geochemistry of black shale and kerogen in the early Cambrian Niutitang
Formation in Guizhou province, South China: constraints for redox environments
and origin of metal enrichments. Precambr. Res., 225, 218–229.
Piper, D.Z., (1994). Seawater as the source of minor elements in black shales, phosphorites
and other sedimentary rocks. Chemical Geology 114:95-114.
Raiswell, R., Buckley, F., Bern, R.A., (1988). Degree of Pyritization of Iron as a
Paleoenvironmental Indicator of Bottom-Water Oxygenation. SEPM Journal of
Sedimentary Research.
Rangin, C., Bellon, H., Bernard, F., Letouzey, J., Muller,C. & Sanudin , T., (1990).
Neogene arc-continent collision in Sabah, northern Borneo (Malaysia).
Tectonophysics 183, 305-319.
Radke, M. and Welte, D.H., (1983).The methylphenanthrene index (MPI): a maturity
parameter based on aromatic hydrocarbons. In: Bjoroy M, editor. Advances in
Organic Geochemistry 10:51-63.

155
Radke, M., Welte, D. and Willsch, H., (1986). Maturity parameters based on aromatic
hydrocarbons: influence of the organic matter type. Organic Geochemistry
10:51-63.
Radke, M., (1987).Organic geochemistry of aromatic hydrocarbons. In: Brooks, J., Welte,
D.H. (Eds.). Advances in Petroleum Geochemistry, Vol.2.London: Academic
Press.141-207.
Radke, M., Welte, D.H. and Willsch, H. (1990).Methylated dicyclic and tricyclic aromatic
hydrocarbons in crude oils from Handil Field (Indonesia). Organic Geochemistry
15:17-34.
Radke, M., Hilkert, A. and Rullkoter, J., (1998).Molecular stable carbon isotope
compositions of alkylphenanthrenes in coals and marine shales related to source
and maturity. Organic Geochemistry 28.12: 785-795.
Rijks, E.J.H., (1981). Baram delta geology and hydrocarbon occurrence. Geo. Survey
Malaysia Bulletin, 14, 1-18
Sandal, S.T., (1996). The geology and hydrocarbon resources of Negara Brunei
Darussalam: Brunei Darassalam, Brunei Shell Petroleum Company Sendirian Berhad
and Brunei Museum, 243 p
Scalan, K. S. and Smith, J. E. (1970). An improved measure of odd even predominance in
the n-alkanes of sediment extract and petroleum, Geochimica et Cosmochimica Acta,
34, 611-620.
Scherer, F.C., (1980). Exploration in East Malaysia over the past decade. In: Halbouty,
M.T., ED., Giant Oil and Gas Fields of the Decade 1968-1978. AAPG Memoir, 30,
423-440
Schwark, L., Ferretti, A., Papazzoni, C. A. and Trevisani, E. (2009) Organic geochemistry
and paleoenvironment of the Early Eocene “Pesciara di Bolca” Konservat-
Lagerstatte, Italy. Palaeogeography, Palaeoclimatology, Palaeoecology, 273, 272-85.
Simoneit, B. R. T. (2004) Biomarkers (Molecular fossils) as geochemical indicators of life.
Advances in Space Research, 33, 1255-61.

156
Seah, E., Zulkifli S. and Awang Sapawi, A.J. (1987). Rock Eval Analyses and Total
Organic Carbon analyses of Core and Surface Samples from Sarawak. PETRONAS
Report No. MGK/08/87.
Simons, W. J. F., et al. (2007), A decade of GPS in Southeast Asia: Resolving Sundaland
motion and boundaries, J. Geophys. Res., 112, B06420,
Silliman JE, Meyers PA, Bourbonniere RA (1996) Record of postglacial organic matter
delivery and burial in sediments of Lake Ontario. Organic Geochemistry 24:463-472.
Tan, D.N.K., Abdul Hadi, A., Azlina Anuar, Boniface, B., Chow K.T.,( 1999). West
Baram Delta. The Petroleum Geology and Resources of Malaysia. Petroliam
Nasional Berhard (PETRONAS). Kuala Lumpur. 293-341.
Tan, C.H., (2010), Facies Distribution and Stratigraphic Development on a Shale-Cored
Ridge, Klias Peninsula, Malaysia, Bulletin of Earth Sciences of Thailand, 3 (2),
p.9- 11241–260.
Taylor, G.H., M. Teichmuller, A. Davis, C.F.K. Diessel, R. Littke, and P. Robert, (1998),
Organic petrology: Berlin & Stuttgart, Gebruder Borntraeger, 704 p
Taylor, B., Hayes, D.E., (1983). Origin and history of the South China Sea Basin. In: D.E.
Hayes (ed.), The Tectonic and Geologic Evolution of Southeast Asian Seas and
Islands Part 2, Geophysical Monograph, 27, American Geophysical Union,
Washington, D.C., 23-56.
Teichmüller M, Littke R, Robert P, (1998). Coalification and maturation. In: Taylor GH,
Teichmüller M, Davis A, Diessel CF, Littke R, Robert P (ed) Organic Petrology,
Berlin: Gebrüder Borntraeger, 86–174.
ten Haven HL, de Leeuw JW, Rullkötter J,Sinninghe Damsté JS (1987) Restricted utility of
the pristane/phytane ratio as a palaeoenvironmental indicator. Nature 330:641-643.

157
Tissot, B. P., Califet-Debyser, Y., Deroo, G. and Oudin, J. L. (1971) Origin and
evolution of hydrocarbons in early Toarcian shales, Paris Basin, France. AAPG
Bulletin, 55, 2177-93.
Tissot, B.T. and Welte, D.H., (1984). Petroleum Formation and Occurrences.Second
Edition. Berlin: Springer-Verlag.
Tjia, H.D., (2012). The Paleo-Orientations of Northwestern Borneo and Adjacent to South
China Sea Bains. Indonesian Journal of Geology, 7(2), 67-76
Tongkul, F., (1989). “The sedimentology and structure of the Crocker Formation in the
Kota Kinabalu area,” GEOSEA VI Proceedings, Jakarta 1987, Indonesian
Association of Geologists, pp. 135-156.
Tulloch, A. P., (1976). Chemistry of waxes of higher plants. In: Kolattukudy, P. E(Ed.),
Chemistry and Biochemistry of Natural Waxes. Elsevier, Amsterdam, p. 236.
Tyson, R.V., (1995). Sedimentary organic matters: organic facies and palynofacies.
Chapman & Hall, London, p 615.
Telnaes, N., B.S. Cooper, and B. Jones, (1991). Kerogen facies, biomarker, trace metal
contents, and spectral logs as indicators of oxicity and salinity, Upper Jurassic,
North Sea, in
Tribovillard, N., T.J. Algeo, T. Lyons, and A. Riboulleau, ( 2006). Trace metals as
paleoredox andpaleoproductivity proxies: An update: Chemical Geology, v.
232, p. 12-32.
Tyson, R.V., (1987). The genesis and palynofacies characteristics of marine petroleum
source rocks. In: Brooks J, Fleet A J. (Eds), Marine petroleum source rocks. Geol. Soc.
Special Publ., 26: 47 – 67.

158
Tyson, R.V., (1998). Late Jurassic palynofacies trends, Piper and Kimmeridge Clay
formation,UK onshore and offshore.In: Batten D J,Keen M C (Eds),Northwest
European Micropalaeontology and Palynology. Brit.Micropalaeontol. Soc.
Series, Ellis Horwood, Chichester, pp. 135 – 172.
Tyson, R.V. (1993). Palynofacies analysis.In: Jenkins DJ(Ed), Applied
Micropaleontolology, Kluwer Academic publishers, Dordrecht, pp. 153-191
Tyson, R.V., (1995). Sedimentary Organic matter - Organic facies and palynofacies.
Chapman and Hall, London. pp 615
Van Hattum, M.W.A., Hall, R., Pickard, A.L., Nicols, G., (2013). Provenance and
Geochronology of Cenozoic Sandstones of Northern Borneo. Journal of Asian
Earth Sciences, 76,266-282
Van Hattum, M.W.A., Hall, R., Pickard, A.L., Nicols, G., (2006). Southeast Asian
sediments not from Asia: Provenance and geochronology of north Borneosandstones.
Geology, 34 (7), 589-592.
Wan Hasiah Abdullah, 1999. Oil-generating potential of Tertiary coals and other organic-
rich sediments of the Nyalau Formation, onshore Sarawak. Journal of Asian Earth
Sciences 17, 255-267
Wannier M, Lesslar PH, Lee CH, Raven H, Sorkhabi R, and Ibrahim A. (2011) Geological
Excursions Around Miri, Sarawak. EcoMedia, Miri, Malaysia, 308 p.
William A.G., Lambiase, J.J., Back, S., Mohd Khalid, J., (2003). Sedimentology of the
Jalan Salaiman and Bukit Melinsung outcrops, western Sabah: is the West Crocker
Formation an analogue for Neogene turbidites offshore?. Geol. Soc. Malaysia,
Bulletin 47, 63-75.
Wilson,, R.A.M., (1964). The Geology and Mineral Resources of Labuan and Padas Area,
Sabah, Malaysia. Mem.17, Geol. Sur. Borneo Region, Malaysia.
Wignall, P.B., and J.R. Maynard, (1993). The sequence stratigraphy of transgressive black
shales, in: Katz, B.J., Pratt, L.M., Eds., Source Rocks in a Sequence Stratigraphic
Framework: AAPG Studies in Geology, vol. 37, p. 35-47.

159
Wilford, G.E. (1961). The Geology and Mineral Resources of Brunei and adjacent part of
Sarawak. British Borneo Geological Survey Memoir 10, 617-740.
Yensepbayev, T., Izart, A., Joltaev, G., Hautevelle, Y., Elie, M. and Suarez-Ruiz, I.,
(2010). Geochemical characterization of source rocks and oils from the eastern part
of the Precaspian and Pre-Uralian Basins (Kazakhstan): Palaeoenvironmental and
palaeothermal interpretation. Organic Geochemistry, 41, 242-62.
Zavattieri, A.N., Rosenfield, U., Volkheimer, W., (2008). Palynofacies analysis and
sedimentary environment of Early Jurassic coastal sediments at the southern border
of the Neuquen Basin, Argentina. J. South Am. Earth Sci. 25: 245-277

160
LIST OF PUBLICATIONS AND CONFERENCES
1. Olayinka Serifat Togunwa, Wan Hasiah Abdullah, Mohammed Hail Hakimi, Pedro
Jose Barbeito, 2015. Organic geochemical and petrographic characteristics of Neogene
organic-rich sediments from the onshore West Baram Delta Province, Sarawak Basin:
Implications for source rocks and hydrocarbon generation potential. Marine and Petroleum
Geology 63,115-126 (ISI-Cited Publication)
2. Olayinka S. Togunwa and Wan H. Abdullah 2015. Geochemical characterization of
Neogene sediments from onshore West Baram Delta Province, Sarawak: Implications for
paleoenvironment, source input and thermal maturity. Central European Journal of
Geosciences (under review)
3. Olayinka S. Togunwa and Wan H. Abdullah. 2014. Biomarkers in the Lambir
mudstones as indicators of source, paleoenvironment and thermal maturity, 9th
Mathematics and Physical Graduate Congress, Malaysia. (Poster presentation)
4. Wan H. Abdullah, Felix Tongkul, Meor A. Hassan, Olayinka S. Togunwa, Khairul A.
Mustapha.2014. Petroleum Source Rock Potential of Cenozoic Sandy Facies of NW
Borneo: Deepwater Submarine Fan of Crocker Formation versus Shallow Marine Deposits
of Meligan Formation, Onshore Sabah, Malaysia. AAPG ICE, Istanbul. (Poster
presentation)
161
APPENDIX A
Vitrinite Reflectance Data and Histograms
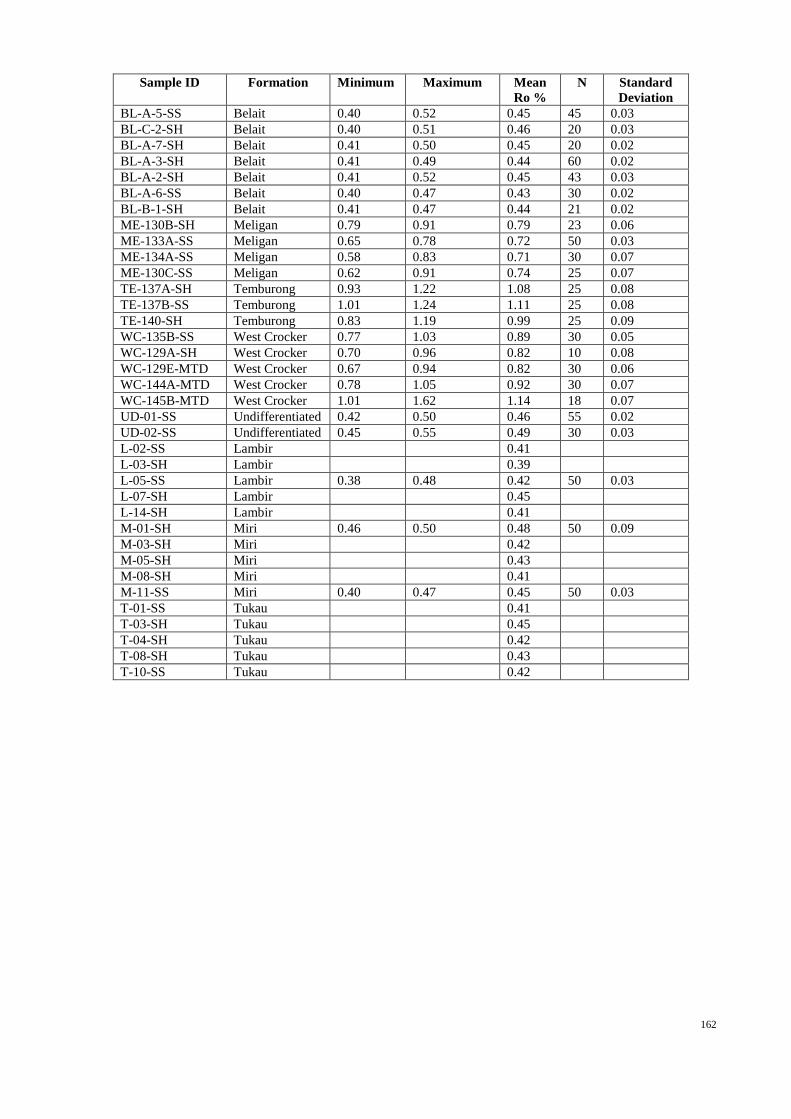
162
Sample ID Formation Minimum Maximum Mean
Ro %
N Standard
Deviation
BL-A-5-SS Belait 0.40 0.52 0.45 45 0.03
BL-C-2-SH Belait 0.40 0.51 0.46 20 0.03
BL-A-7-SH Belait 0.41 0.50 0.45 20 0.02
BL-A-3-SH Belait 0.41 0.49 0.44 60 0.02
BL-A-2-SH Belait 0.41 0.52 0.45 43 0.03
BL-A-6-SS Belait 0.40 0.47 0.43 30 0.02
BL-B-1-SH Belait 0.41 0.47 0.44 21 0.02
ME-130B-SH Meligan 0.79 0.91 0.79 23 0.06
ME-133A-SS Meligan 0.65 0.78 0.72 50 0.03
ME-134A-SS Meligan 0.58 0.83 0.71 30 0.07
ME-130C-SS Meligan 0.62 0.91 0.74 25 0.07
TE-137A-SH Temburong 0.93 1.22 1.08 25 0.08
TE-137B-SS Temburong 1.01 1.24 1.11 25 0.08
TE-140-SH Temburong 0.83 1.19 0.99 25 0.09
WC-135B-SS West Crocker 0.77 1.03 0.89 30 0.05
WC-129A-SH West Crocker 0.70 0.96 0.82 10 0.08
WC-129E-MTD West Crocker 0.67 0.94 0.82 30 0.06
WC-144A-MTD West Crocker 0.78 1.05 0.92 30 0.07
WC-145B-MTD West Crocker 1.01 1.62 1.14 18 0.07
UD-01-SS Undifferentiated 0.42 0.50 0.46 55 0.02
UD-02-SS Undifferentiated 0.45 0.55 0.49 30 0.03
L-02-SS Lambir 0.41
L-03-SH Lambir 0.39
L-05-SS Lambir 0.38 0.48 0.42 50 0.03
L-07-SH Lambir 0.45
L-14-SH Lambir 0.41
M-01-SH Miri 0.46 0.50 0.48 50 0.09
M-03-SH Miri 0.42
M-05-SH Miri 0.43
M-08-SH Miri 0.41
M-11-SS Miri 0.40 0.47 0.45 50 0.03
T-01-SS Tukau 0.41
T-03-SH Tukau 0.45
T-04-SH Tukau 0.42
T-08-SH Tukau 0.43
T-10-SS Tukau 0.42

163
ME-130B-SH
ME-130C-SS
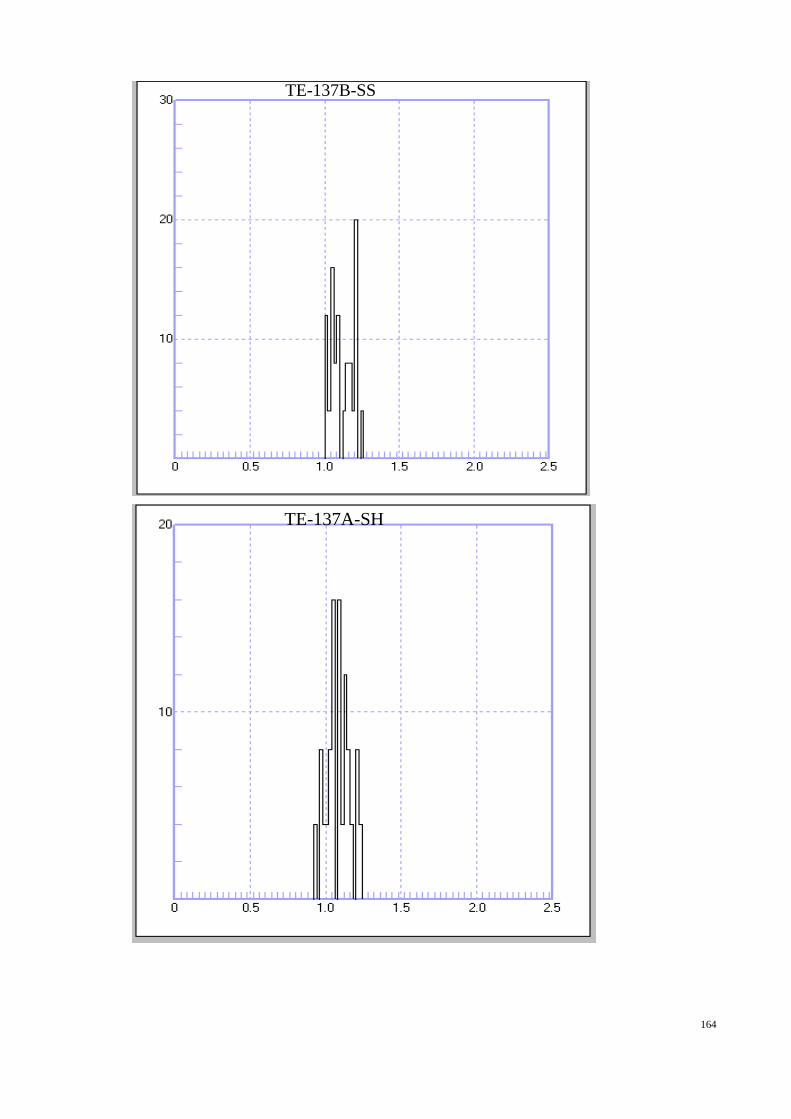
164
TE-137B-SS
TE-137A-SH

165
TE-140-SH
WC-129A-SH

166
WC-144A-MTD
WC-145B-MTD

167
WC-129E-MTD
WC-135B-SS

168
M-11-SS
M-01-SH

169
L-05-SS
T-03-SH

170
BL-A-3
BL-A-3BL-B-1
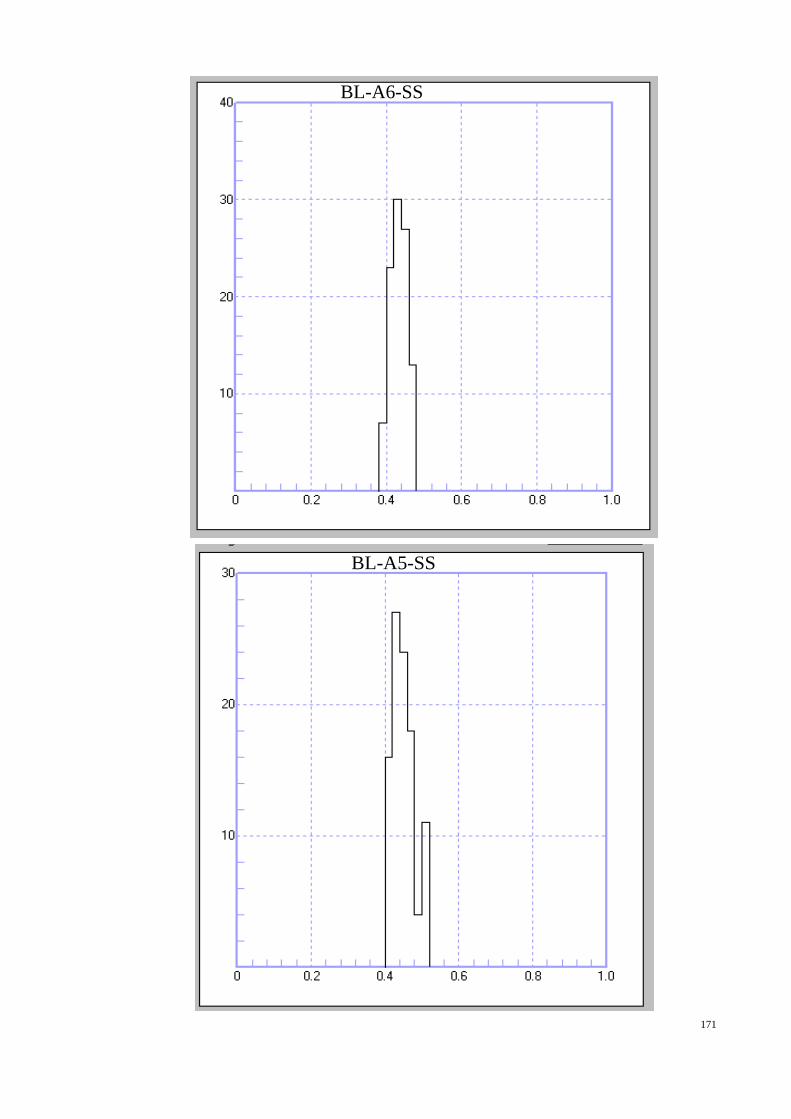
171
BL-A6-SS
BL-A5-SS

172
BL-C2-SH
BL-A7-SH

173
APPENDIX B
Py-GC Pyrogram Quantitative Data

174
Sample Formation C8 Xy Phe C8 % Xy % Phe %
T-03-SH Tukau 1.2 3.2 3.5 15 41 44
T-04-SH Tukau 1.6 3.4 3.4 19 40 40
T-10-SS Tukau 1.2 3.6 3.5 14 43 42
M-01-SH Miri 1.6 3.8 6.4 14 32 54
M-03-SH Miri 1.4 3.2 5.8 13 31 56
M-05-SH Miri 1.4 3.6 5.8 13 33 54
M-08-SH Miri 1.3 3.3 6.2 12 31 57
M-11-SS Miri 1.2 3.5 5.5 12 34 54
L-02-SS Lambir 1.7 2.8 3.3 22 36 42
L-03-SH Lambir 1.5 2.8 3.2 20 37 43
L-05-SS Lambir 1.8 3.2 3.5 21 38 41
L-07-SH Lambir 1.5 2.5 3.2 21 35 44
L-14-SH Lambir 1.5 3.1 3.2 19 40 41
BL-A3-SH Belait 2.2 5.2 7.1 15 36 49
BL-A5-SS Belait 2.4 5.5 6.8 16 37 46
BL-A6-SS Belait 2.2 4.8 8.2 14 32 54
BL-B1-SH Belait 2.6 5.6 7.8 16 35 49
BL-C2-SH Meligan 2.8 8.4 4.2 18 55 27
ME-134A-SH Meligan 3.5 6.2 1.6 31 55 14
ME-130F-SH Meligan 3 7.2 5 20 47 33
ME-133A-SS Meligan 2.6 7.6 3.8 19 54 27
TE-139-SH Temburong 2.2 6.7 0.7 23 70 7
TE-137A-SH Temburong 1.2 7.2 0.5 13 81 6
TE-140-SH Temburong 1.4 7.4 0.3 15 81 3
WC-129E-MTD West Crocker 5.8 7.6 1.2 52 43 8
WC-144A-MTD West Crocker 6 8.4 1.6 53 38 10
WC-145B-MTD West Crocker 4 8.2 1.2 30 61 9
WC-129B-SH West Crocker 2.8 6.2 0.8 29 63 8
WC-135B-SS West Crocker 3.2 5.6 1.2 32 56 12
UD-01-SS Undifferentiated 1.7 4 6.3 14 33 53
UD-02-SS Undifferentiated 1.5 3.8 5.8 14 34 52
C8: n-Octene Xy: Xylene Phe: Phenol