Embed Size (px)
Citation preview
(
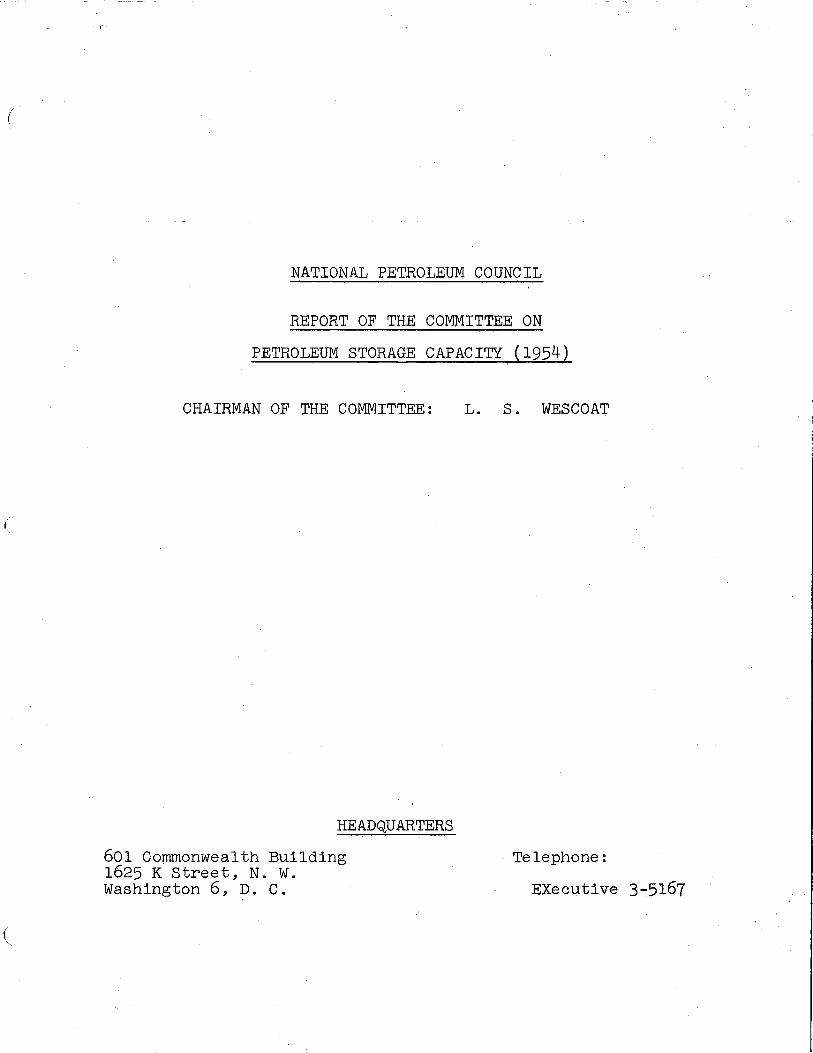
NATIONAL PETROLEUM COUNCIL
REPORT OF THE COMMITTEE ON
PETROLEUM STORAGE CAPACITY (1954)
(
CHAIRMAN OF THE COMMITTEE:
HEADQUARTERS
601 Commonwealth Building1625 K Street, N. W.Washington 6, D. C.
L. S. WESCOAT
. Telephone :
EXec~tive 3-5l67
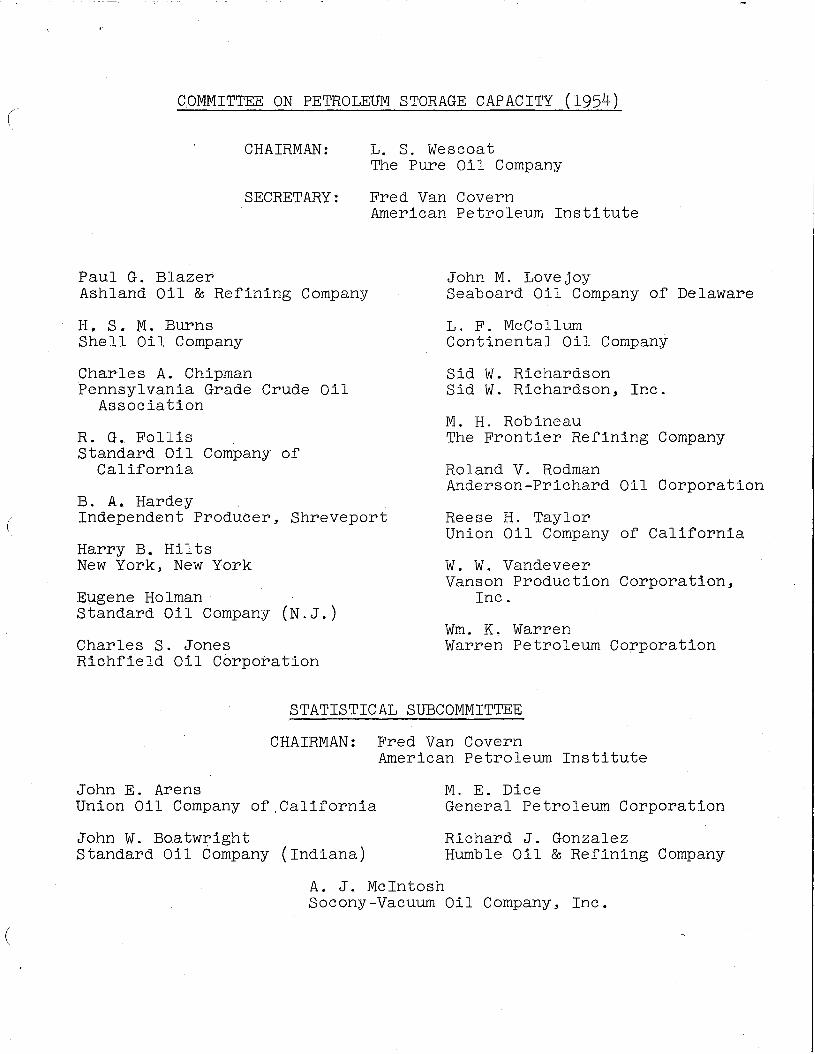
COMMITTEE ON PETROLEUM STORAGE CAPACITY (1954)
CHAIRMAN:
SECRETARY:
L. S. WescoatThe Pure Oil Company
Fred Van CovernAmerican Petroleum Institute
(
Paul G. BlazerAshland Oil & Refining Company
H. S. M. BurnsShell Oil Company
Charles A. ChipmanPennsylvania Grade Crude Oil
Association
R. G. FollisStandard Oil Company of
California
B. A. HardeyIndependent Producer, Shreveport
Harry B. HiltsNew York, New York
Eugene HolmanStandard Oil Company (N.J.)
Charles S. JonesRichfield Oil Corpo~ation
John M. LovejoySeaboard Oil Company of Delaware
L. F. McCollumContinental Oil Company
Sid W. RichardsonSid W. Richardson, Inc.
M. H. RobineauThe Frontier Refining Company
Roland V. RodmanAnderson-Prichard Oil Oorporation
Reese H. TaylorUnion Oil Company of California
W. W. VandeveerVanson Production Corporation,
Inc.
Wm. K. WarrenWarren Petroleum Corporation
STATISTICAL SUBCOMMITTEE
CHAIRMAN: Fred Van CovernAmerican Petroleum Institute
John E. ArensUnion Oil Company of California
John W. BoatwrightStandard Oil Company (Indiana)
M. E. DiceGeneral Petroleum Corporation
Richard J. GonzalezHumble Oil & Refining Company
(
A. J. McIntoshSocony-Vacuum Oil Company, Inc.
NATIONAL PETROLEUM COUNCIL
REPORT OF THE COMMITTEE ON PETROLEUM STORAGE CAPACITY (1954)
October 19, 1954
Members of theNational Petroleum Council:
Gentlemen:
This report is being made in response to the action taken by
the Council at its March meeting, after recommendation of the Agenda
Committee in connection with a communication dated March 22nd from
Mr. H. A. Stewart then Acting Director, Oil and Gas Division, Depart-
ment of the Interior. In accord with this action your committee on
Petroleum Storage Capacity was re-activated and requested to oring
( up-to-date its report of December 9, 1952, but in addition to the in~
formation gathered at that time, which subdivided the figures de-
veloped for the East Coast, Indiana-Illinois-Kentucky and the Pacific
Coast Bureau of Mines districts into smaller subdivisions thereof,
to survey the undergro~nd storage capacity also.
As in previous reports your committee related the current
analysis to a previously reported inventory situation and chose
March 31 of this year as the reporting date, since such information
was the latest available when the questionnaires were distributed,
and also because of the desirability of determining principal pro
duct inventory and storage relationships at the end of the most re-
cent winter season.
(
(
(
A total of about 350 questionnaires were distributed to re
finers and other holders of crude oil and principal product inventories
and storage facilities. Based on the inventories reported in com
parison with those previously developed by the Bureau of Mines, the
crude oil section of this report represents 96.4 per cent of the
refinery, pipe line and tank farm stocks of crude, and the crude oil
in transit; the clean products group (gasoline, kerosine and distillate
fuel oils) about 97 per cent; while the residual fuel oil portion
represents 96.5 per cent of all of the inventorieB in these various
categories that were reported to the Bureau of Mines for the United
States as a whole as of March 31st last.
Your committee appreciates this extremely gratifying response,
and takes this opportunity to thank the industry for it and for so
promptly returning the information requested.
Returns were not received from a few relatively small companies.
It is believed, however, that most of these are crude producers who
carry lease stock only, an item for which no analysis was requested.
Your committee retained the opinion expressed in its previous reports
that such inventories in practically all circumstances represent
working inventories required on producing properties.
Attached to the report, in consolidated form, are reproductions
of all the questionnaire forms used in the survey, showing all of the
details, including information on underground storage capacity for
the first time, as well as additional information with respect to
- 2 -
(
(
the assignment of clean product storage capacity to gasoline, kero
sine and distillate fuel oils individually as of October 31, 1953
and March 31, 1954.
The significant facts which may be noted from this survey
are:
CRUDE OIL
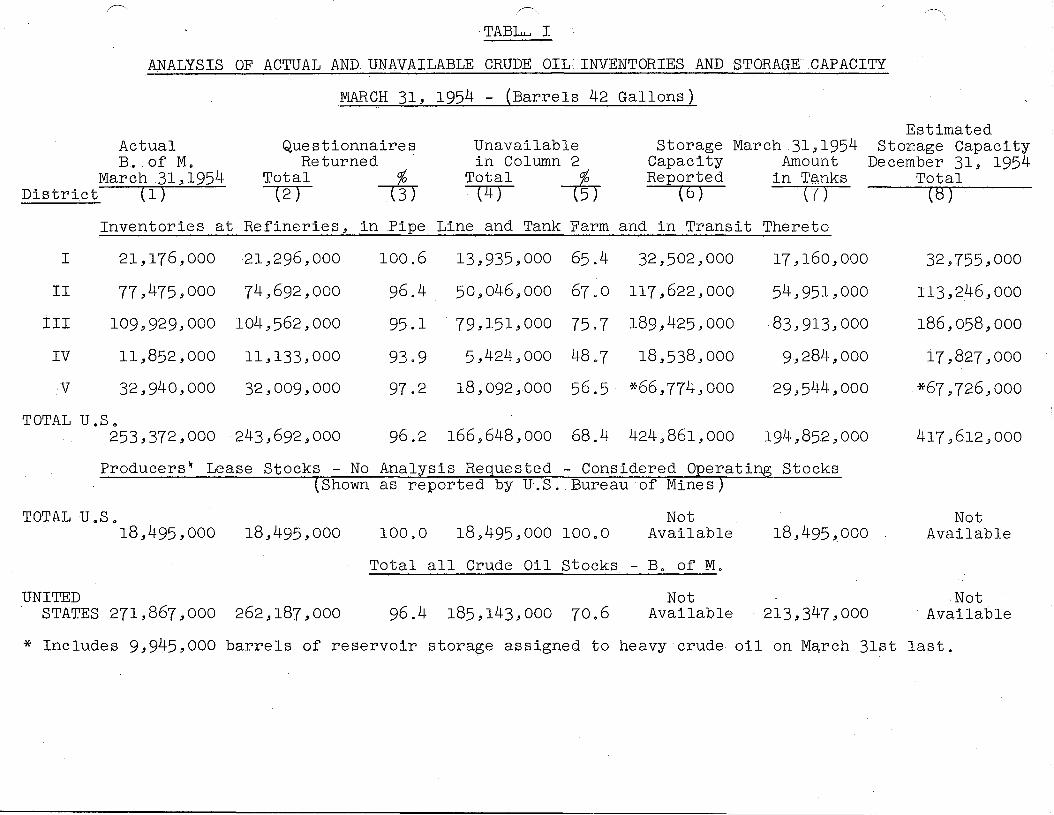
(1) That the total capacity for storage of crude oil in tanks
above ground in the country as a whole amounted to 425 million barrels
on March 31st last, a slight decline from the 1952 level. This in
cludes almost 10 million barrels of reservoir storage in California,
a decline in this type of 4 million barrels.
(2) That total crude oil in tanks and all other facilities
including pipe lines, tankers, etc., but not Producers' Lease Stocks
was 244 million barrels.
(3) That the amount in tanks alone was 195 million--thus
indicating above ground storage to have been 46.7 per cent full.
In this connection it should be borne in mind that much of the re
ported tankage is in areas where it is not currently available for
use, and some of it even so not susceptible to relocation elsewhere
because of its condition. Still other portions are available only
for limited use.
(4) That approximately 49 million barrels or about 19.2
per cent of all reported crude, are constantly required as main
trunk and tank farm pipe line fill (44.3 million), as well as aver-
age required fill for tankers, barges, tank cars and trucks hauling
crude (4.5 million).
(5) That over 76 million barrels, not including line fill
shown above, are required to assure continuous operation of pipe
lines and as crude tank bottoms; while 41 million are required to
assure continuous processing and the handling and blending of the
many grades of crude oil produced in the United States and processed
in its refineries.
(6) That the combined total of all unavailable stocks of
crude which is the combination of number (4) and number (5) above,
amounted to about 68 per cent of all of the crude oil in storage
as of March 31st last.
Table I, which follows, shows consolidated crude oil com-
( parisons by general supply and demand districts of the country.
(
- 4 -
~ ,~'
TABL.LJ I
ANALYSIS,OF ACTUAL AND UNAVAILABLE CRUDE OIL INVENTORIES AND STORAGE 'CAPACITY
MARCH 31, 1954 - (Barrels 42 Gallons)
ActualB.. of M.
March 31,1954District (1)
QuestionnairesReturned
Total %(2) ---cTI
Unavailablein Column 2
Total %(4) -m
StorageCapacityReported
(6)
March 31,1954Amount
in T©,nksen
EstimatedStor-age Capacity
December 31, 1954Total
r8J
Inventories at Refineries, in Pipe Line and Tank Farm and in Transit Thereto
I 21,176,000 21,296,000 100.6 13,935,000 65.4 32,502,000 17,160,000 32,755,000
II 77,475,000 74,692,000 96.4 50,046'p000 67.0 117,622,000 54,951,000 113,246,000
III 109,929,000 104,562,000 95.1 79,151,000 75.7 189,425,000 83,913,000 186,058,000
IV 11,852,000 11,133,000 93.9 5,424,000 48.7 18,538,000 9,284,000 17,827,000
V 32,940,000 32,009,000 97.2 18,092,000 56.5 -j(-66, 774,000 29,544,000 *67,726,000
TOTAL U.S 0
253,372,000 243,692,000 96.2 166,648,000 68.4 424,861,000 194,852,000 417,612,000
Producers~ Lease Stocks - No Analysis Requested - Considered Operating Stocks(Shown as reported by U.S. ,Bureau of Mines)
TOTAL U'S' 18 ,495,000 18,495,000 100.0 18,495,000 100.0Not
Available 18,495,.000Not
Available
Total all Crude Oil Stocks - B o of M.
UNITEDSTATES 271,867,000 262,187,000 96.4 185,143,000 70.6
NotAvailable 213,347,000
NotAvailable
* Includes 9,945,000 barrels of reservoir storage assigned to heavy crude oil on M~rch 31st last.
(
(
CLEAN PRODUCTS
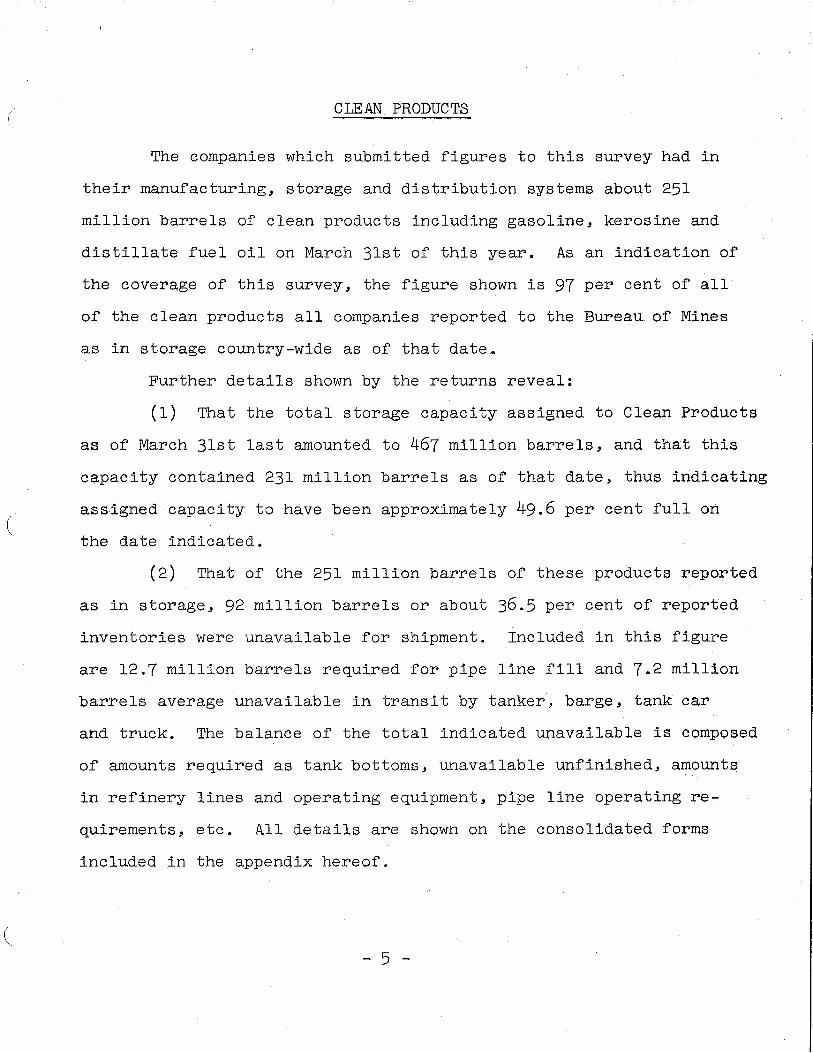
The companies which submitted figures to this survey had in
their manufacturing, storage and distribution systems about 251
million barrels of clean products including gasoline, kerosine and
distillate fuel oil on March 31st of this year. As an indication of
the coverage of this survey, the figure shown is 97 percent of all
of the clean products all companies reported to the Bureau of Mines
as in storage country-wide as of that date.
Further details shown by the returns reveal:
(1) That the total storage capacity assigned to Clean Products
as of March 31st last amounted to 467 million barrels, and that this
capacity contained 231 million barrels as of that date, thus indicating
assigned capacity to have been approximately 49.6 per cent full on
the date indicated.
(2) That of the 251 million barrels of these products reported
as in storage, 92 million barrels or about 36.5 per cent of reported
inventories were unavailable for shipment. Included in this figure
are 12.7 million barrels required for pipe line fill and 7 .. 2 million
barrels average unavailable in transit by tanker, barge, tank car
and truck. The balance of the total indicated unavailable is composed
of amounts required as tank bottoms, unavailable unfinished, amounts
in refinery lines and operating equipment, pipe line operating re
quirements, etc. All details are shown on the consolidated forms
included in the appendix hereof.
- 5 -
(
(
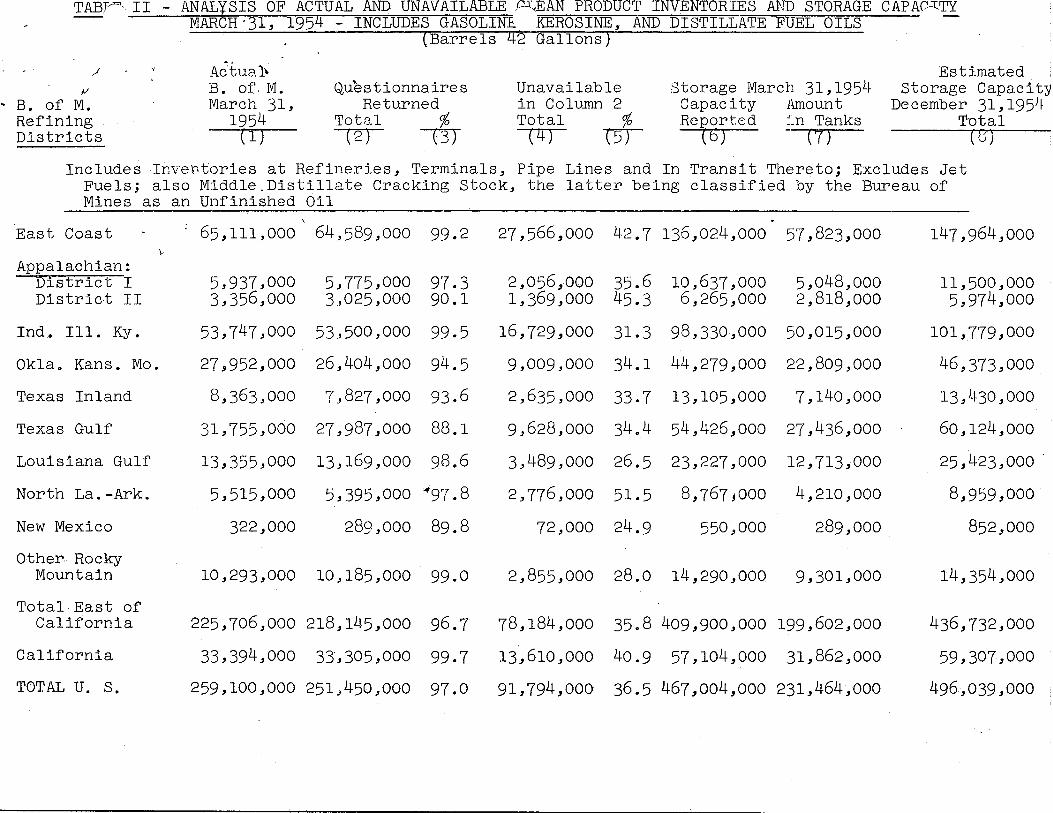
(3) That the 467 million barrels of clean produots storage
capacity reported for March 31, 1954, is expected to increase to 496
million barrels by December 31st next.
Con~olidated clean product figures are shown in Table II, which
follows, by Bureau of Mines refining districts~ Consult attached
consolidated forms for additional district break down including New
England, North Central areas and the Pacific Northwe$t.
- 6 -
TABT~ II - ANALYSIS OF ACTUAL AND UNAVAILABLE ~£AN PRODUCT INVENTORIES AtID STORAGE CAPAr~TY
MARCH'31, 1954 - INCLUDES GASOLINE KEROSINE, AND DISTILLATE FUEL OILS(Barrels 42 Gallons)
""/0/
.. B. of M.RefiningDistricts
Actu8.1\B. of', M.March 31,
1954rT)
QuestionnairesReturned
Total %(2) t:rr
Unavailablein Column 2Total %
(4) T5r
storage March 31,1954Capacity AmountReported in Tanks
(6) - (7)
EstimatedStorage Capacit~
December 31,1954Total
(0)
Includes Inventories at Refineries, Terminals, Pipe Lines and In Transit Thereto; Excludes JetFuels; also M:iddle.Distillate Cracking Stock, the latter being classified by the Bureau ofMines as an Unfinished Oil
Okla. Kans. Mo.
322,000 289,000 89.8
65,111,000 64,589,000 99.2
5,395,000 ~97.8
11,500,0005,974,000
101,779,000
46,373,000
13,430,000
60,124,000
25,423,000 .
8,959,000
852,000
147,964,000
289,000
7,140,000
27,436,000
12,713,000
4,210,000
5,048,0002,818,000
50,015,000
22,809,000
23,227,000
8,767,000
54,426,000
10,637,0006,265,000
98,330,000
44,279,000
13,105,000
35.645.3
31.3
34.1
33.7
34.4
26.5
72,000 24.9 550,000
2,776,000 51. 5
9,009,000
2,635,000
9,628,000
3,489,000
2,056,0001,369,000
16,729,000
27,566,000 42.7 136,024,000 57,823,000
97.390.1
99.5
94.5
93.6
88.1
98.6
7,827,000
27,987,000
13,169,000
5,775,0003,025,000
53,,500,000
26,404,000
13,355,000
5,515,000
27,952,000
8,363,000
31,755,000
5,937,0003,356,000
53,747,000
~
Appalachian:District IDistrict II
North La.-Ark.
New Mexico
Texas Inland
Louisiana Gulf
Texas Gulf
East Coast
Ind. Ill. Ky.
Other RockyMountain 10,293,000 10,185,000 99.0 2,855,000 28.0 14,290,000 9,301,000 14,354,000
Total·East ofCalifornia
California
TOTAL U. S.
225,706,000 218,145,000 96.7
33,394,000 33,305,000 99.7
259,100,000 251,450,000 97.0
78,184,000 35.8 409,900,000 199,602,000
13,610,000 40.9 57,104,000 31,862,000
91,794,000 36.5 467,004,000 231,464,000
436,732,000
59,307,000
496,039,000
(
(
RESIDUAL FUEL OIL
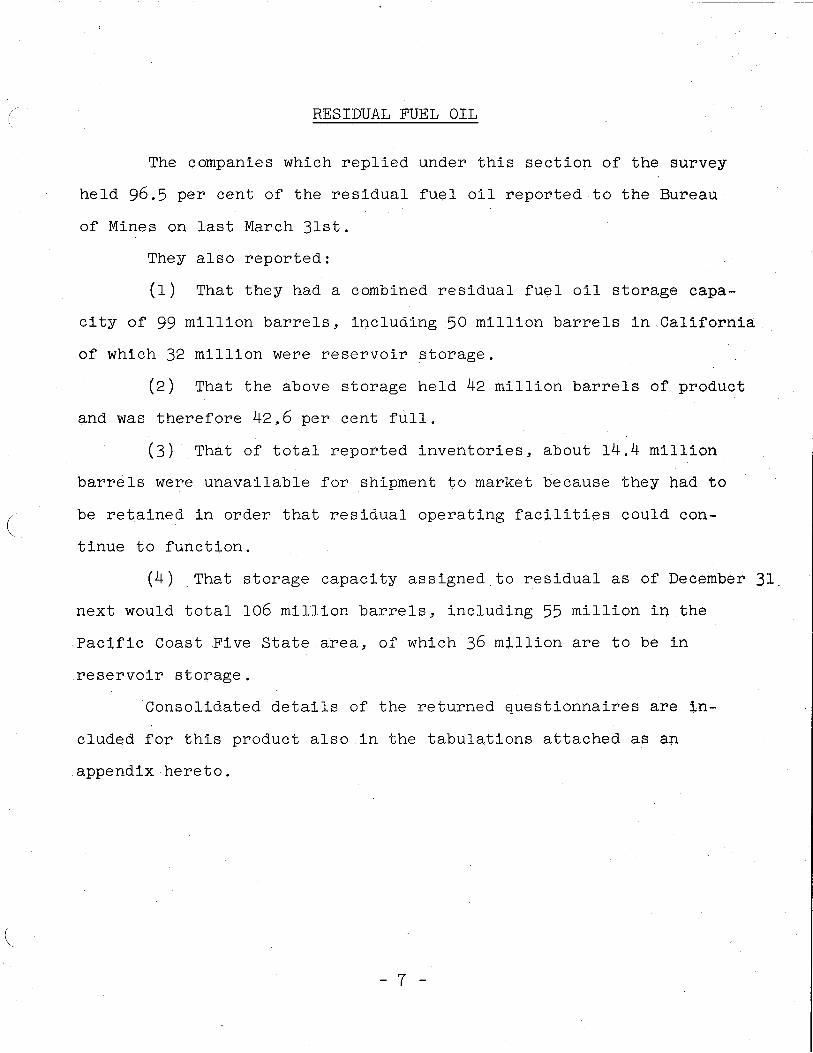
The companies which replied under this section of the survey
held 96.5 per cent of the residual fuel oil reported to the Bureau
of Mines on last March 31st.
They also reported:
(1) That they had a combined residual fuel oil storage capa
city of 99 million barrels, including 50 million barrels in California
of which 32 million were reservoir storage.
(2) That the above storage held 42 million barrels of product
and was therefore 42.6 per cent full.
(3) That of total reported inventories, about 14.4 million
barrels were unavailable for shipment to market because they had to
be retained in order that residual operating facilities could con
tinue to function.
(4) That storage capacity assigned to residual as of December 31_
next would total 106 million barrels, including 55 million in the
Pacific Coast Five State area, of which 36 million are to be in
reservoir storage.
Consolidated details of the returned questionnaires are in
cluded for this product also in the tabulations attached as an
appendix hereto.
- 7 -
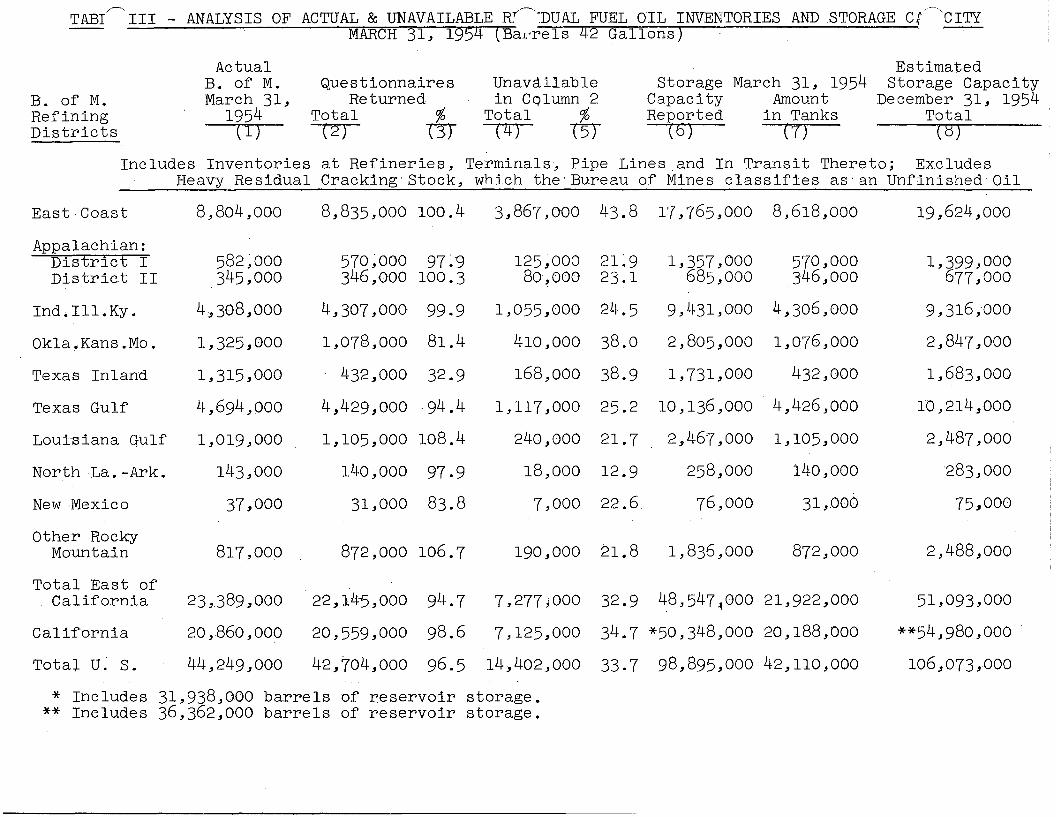
TABt~III - ANALYSIS OF ACTUAL & UNAVAILABLE RT~~DUAL FUEL OIL INVENTORIES AND STORAGE C{~'CITYMARCH 31, 1954 (BaL'rels 42 Gallons) .
%mB. of M.RefiningDistricts
ActualB. of M.March 31,
1954(T)
QuestionnairesReturned
Total(2)
Unavailablein Cqlumn 2
Total %(4) T5T
StorageCapacityReported
(6)
March 31, 1954Amount
in Tanks(7)
EstimatedStorage Capacity
December 31, 1954Total
(t$)
Includes Inventories at Refineries, Terminals, Pipe Lines and In Transit Thereto; ExcludesHeavy Residual Cracking'Stock, which the'Bureau of Mines classifies as'an Unfinished Oil
East,Coast 8,804,000 8,835,000 100.4 3,867,000 43.8 17,765,000 8,618,000 19,624,000
4,429,000 -94.4
1,105,000 108.4
140,000 97.9
31,000 83.8
Appalachian:District IDistrict II
Ind.lll.Ky.
Okla.Kans.Mo.
Texas Inland
Texas Gulf
Louisiana qulf
North La.-Ark.
New Mexico
582~OOO345,000
4,308,000
1,325,000
1,315,000
4,694,000
1,019,000
143,000
37,000
570,000346,000
4,307,000
1,078,000
432,000
97~9100.3
99.9
81.4
32.9
125,000 21.980,000 23.1
1,055,000 24.5
410,000 38.0
168,000 38.9
1,117,000 25.2
240,000 21.7
18,000 12.9
7,000 22.6
1,357,000 570,000685,000 346,000
9,431,000 4,306,000
2,805,000 1,076,000
1,731,000 432,000
10,136,000 4,426,000
2,467,000 1,105,000
258,000 140,000
76,000 31,000
1,399,000677,000
9,316,'000
2,847,000
1,683,000
10,214,000
2,487,000
283,000
75,000
Other RockyMountain 817,000 872,000 106.7 190,000 21. 8 1,836,000 872,000 2,488,000
Total East ofCalifornia
California
Total U~ S.
23,389,000
20,860,000
44,249,000
22, 14-S,000 94.7
20,559,000 98.6
42,704,000 96.5
7,277;000 32.9 48,547~000 21,922,000
7,125,000 34.7 *50,348,000 20,188,000
14,402,000 33.7 98,895,000 42,110,000
51,093,000
**54,980,000
106,073,000
* Includes 31,938,000 barrels of reservoir storage.** Includes 36,362,000 barrels of reservoir storage.
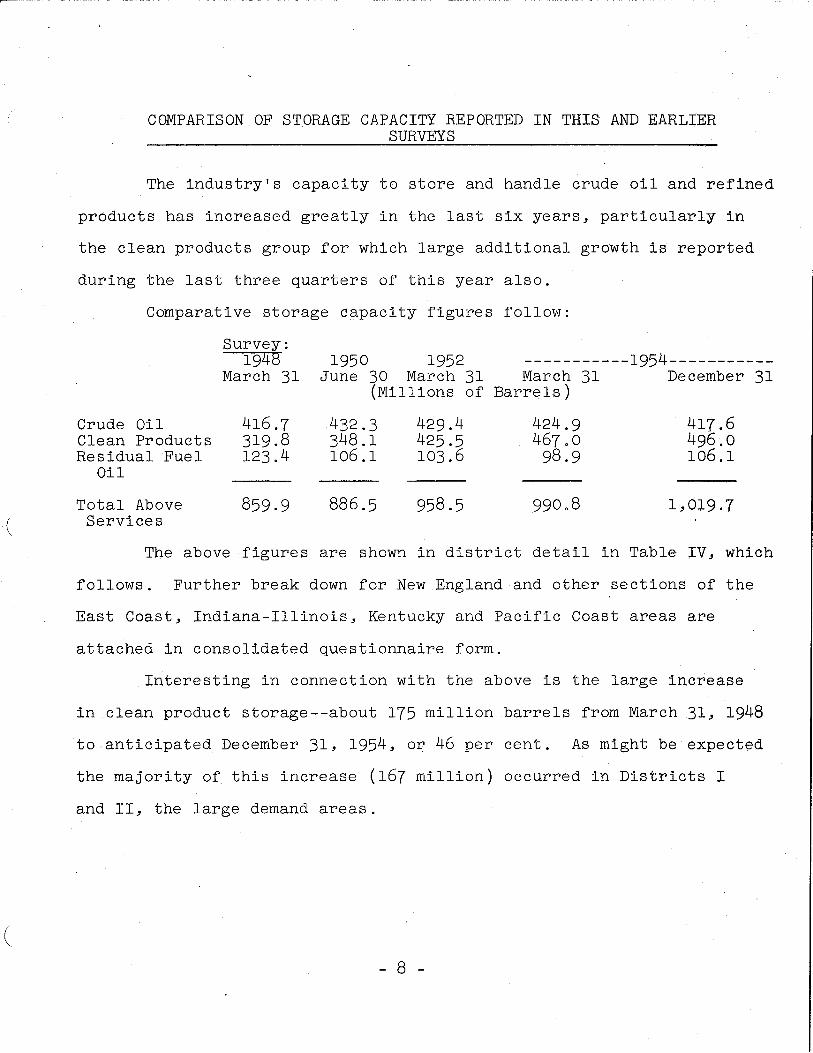
COMPARISON OF STORAGE CAPACITY REPORTED IN THIS AND EARLIERSURVEYS
The industry's capacity to store and handle crude oil and refined
products has increased greatly in the last six years, particularly in
the clean products group for which large addit;i.onal growth is reported
during the last three quarters of this year also.
Comparative storage c0pacity figures follow:
Survey:1948
March 311950 1952 -----------1954-----------
June 30 March 31 March 31 December 31(Millions of Barr~ls)
(
Crude Oil 416.7 432.3 429.4 424.9 417.6Clean Products 319.8 348.1 425.5 46700 496.0Residual Fuel 123.4 106.1 103.6 98.9 106.1
Oil
Total Above 859.9 886.5 958.5 99008 1,019.7Services
The above figures are shown in district detail in Table IV, which
follows. Further break down for New England and other sections of the
East Coast, Indiana-Illinois, Kentucky and Pacific Coast areas are
attached in consolidated questionnaire form.
Interesting in connection with the above is the large increase
in clean product storage--about 175 million barrels from March 31, 1948
to anticipated December 31, 1954, or 46 per cent. As might be expected
the majority of this increase (167 million) occurred in Districts I
and II, the large demand areas.
- 8 -
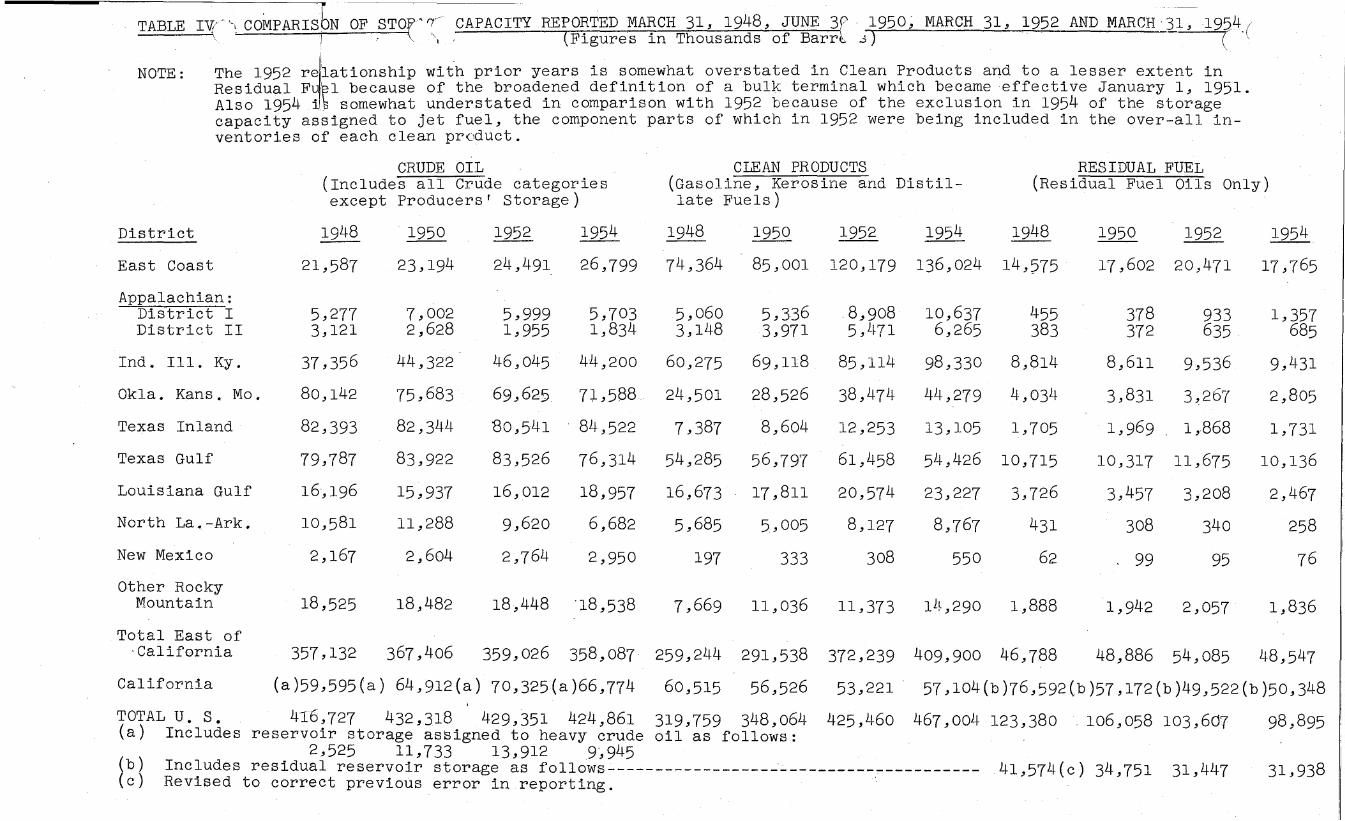
NOTE:
TABLE IV(> COMPARISbN OF STO:v'f(r~ CAPACITY REPORTED MARCH 31, 1948, JUNE 3P 1950; MARCH 31.9 1952 AND MARCH '31, 195.4 (" I· '" '\ i (Figures in Thousands of Barrl .3) ( "
The 1952 r~~ationshiP with prior years is somewhat overstated in Clean Products and to a lesser extent inResidual F 1.~1 because of the broadened definition of a bulk terminal which became effective January 1, 1951.Also 1954 .~ somewhat understated in comparison with 1952 because of the exclusion in 1954 of the storagecapacity assigned to jet fuel, the component parts of which in 1952 were being included in the over-all inventories of each clean product.
CRUDE OIL(Includes all Crude categoriesexcept Producers' storage)
CLEAN PRODUCTS(Gasoline, Kerosine and Distillate Fuels)
RES IDUAL FUEL(Residual Fuel Oils Only)
District
East Coast
1950
23,194
1952 1954 1948 1950 1952 1954 1948
24,491 26,799 74,364 85,001 120,179 136,024 14,575
1950 1952
17,602 20,471
Appalachian:District IDistrict II
Ind. Ill. Ky.
Okla. Kans. Mo.
Texas Inland
Texas Gulf
Louisiana Gulf
North La.-Ark.
New Mexico
Other RockyMountain
5,2773,121
37,356
80,142
82,393
79,787
16,196
10,581
2,167
18,525
7,0022,628
44,322
75,683
82,344
83,922
15,937
11,288
2,604
18,482
5,999 5,7031,955 1,834
46,045 44,200
69,,625 7~,588
80,541 84,522
83,526 76,314
16,012 18,957
9,620 6,682
2,764 2,950
18,448 '18,538
5,0603,148
60,275
24,501
7,387
54,285
16,673
5,685
197
7,669
5,3363,971
69,118
28,526
8,604
56,797
17,811
5,005
333
11,036
,8.,9085,Lf71
85,114
38,474
12,253
61,458
20,574
8,127
308
11,373
10,637 4556,265 383
98,330 8,814
44,279 4,034
13,105 1,705
54,426 10,715
23,227 3,726
8,767 431
550 62
11!,,290 1,888
378 933372 635
8,611 9,536
3,831 3,26~(
1,969 1,868
10,317 11,675
3,457 3,208
308 340
99 95
1,942 2,057
1,357685
9,431
2,805
1,731
10,136
2,467
258
76
1,836
259,244 291,538 372,239 409,900 46,788 48,886 54,085 48,547
60,515 56,526 53,221 57,104(b)76,592(b)57,172(b)49.9522(b)50,348!
319,759 348,064 425,460 467,004 123,380 106,058 103,607 98,895oil as follows:
Total East of-California 357,132 367,406 359,026 358,087
California (a)59,595(a) 64,912(a) 70,325(a)66,774
TOTAL U. S. 416,727 432,318 429,351 424,861(a) Includes reservoir storage assigned to heavy crude
2,525 11,733 13,912 9~945
(b) Includes residual reservoir storage as fo110ws----------------------------,..----------(c) Revised to correct previous error in reporting. .
41,574(c) 34,751 31,447 31,938
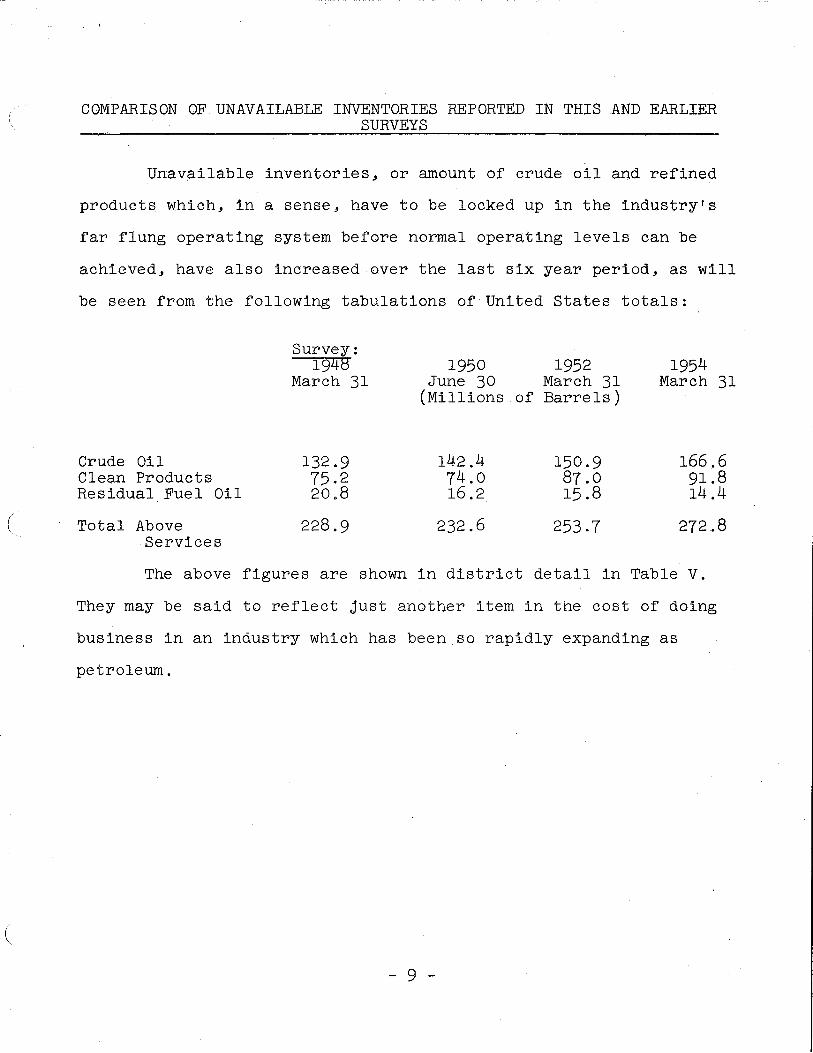
COMPARISON OF UNAVAILABLE INVENTORIES REPORTED IN THIS AND EARLIERSURVEYS
Unavailable inventories~ or amount of crude oil and refined
products which, in a sense, have to be locked up in the industry's
far flung operating system before normal operating levels can be
achieved, have also increased over the last six year period, as will
be seen from the following tabulations of United States totals:
Survey:1948
March 311950 1952
June 30 March 31(Millions of Barrels)
1954March 31
Crude OilClean ProductsResidual Fuel Oil
( Total AboveServices
132.9 142.4 150·9 166.675.2 74.0 87.0 91.82008 16.2 15.8 14.4
228.9 232.6 253.7 272.8
The above figures are shown in district detail in Table V.
They may be said to reflect just another item in the cost of doing
business in an industry which has been so rapidly expanding as
petroleum.
- 9 -
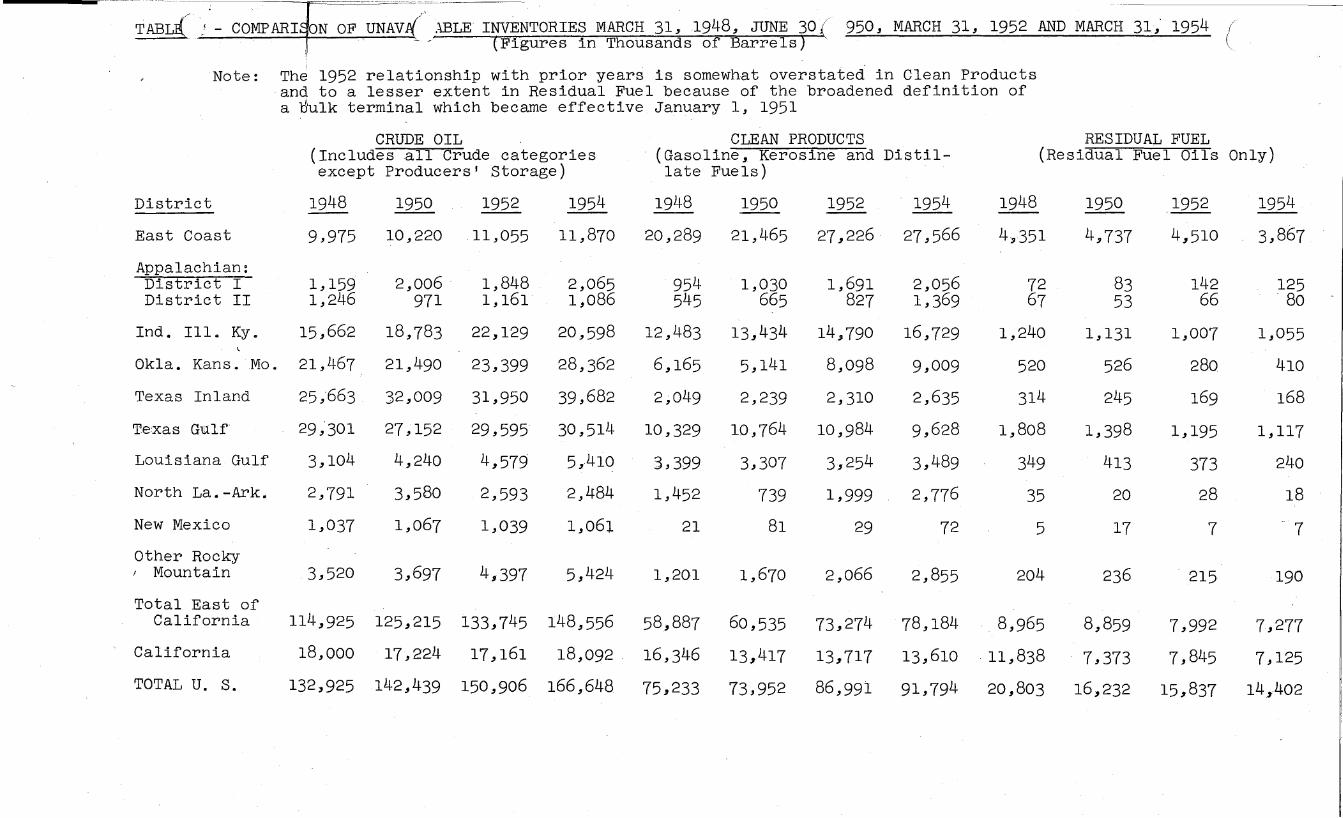
COMPARI~N~~:~7:~~LE INVENTORIES MARCH 31, 1948, JUNE 30{ 950, MARCH 31, 1952 AND MARCH 31, 1954 ((f .. -- (Figures in Thousands of Barrels) ,
Note: Th~ 1952 relationship with prior years is somewhat overstated in Clean Productsand to a lesser extent in Residual Fuel because of the broadened definition ofa ~ulk terminal which became effective January 1, 1951
CRUDE OIL(Includes all Crude categoriesexcept Producers' storage)
CLEAN PRODUCTS(Gasoline, Kerosine and Distillate Fuels)
RESIDUAL FUEL(Residual Fuel Oils Only)
District
East Coast
Appalachian:District IDistrict II
Ind. Ill. Ky.
Okla. Kans. Mo.
Texas Inland
Texas Gmlf
Louisiana Gulf
North La.-Ark.
New Mexico
other Rocky! Mountain
Total East ofCalifornia
California
TOTAL U. S.
1948
9,975
1,1591,246
15,662
21,467
25,663
29;301
3,104
2,791
1,037
3,520
114,925
18,000
132,925
1950
10,220
2,006971
18,783
21,490
32,009
27,152
4,240
3,580
1,067
3,697
125,215
17,224
142,439
1952
11,055
1,8481,161
22,129
23,399
31,950
29,595
4,579
2,593
1,039
4,397
133,745
17,161
150,906
1954
11,870
2,0651,086
20,598
28,362
39,682
30,514
5,410
2,484
1,061
5,424
148,556
18,092 .
166,648
1948
20,289
954545
12,483
6,165
2,049
10,329
3,399
1,452
21
1,201
58,887
16,346
75,233
1950
21,465
1,030665
13,434
5,141
2,239
10,764
3,307
739
81
1,670
60,535
13,417
73,952
1952
27,226
1,691827
14,790
8,098
2,310
10,984
3,254
1,999
29
2,066
73,274
13,717
86,991
1954
27,566
2,0561,369
16,729
9,009
2,635
9,628
3,489
2,776
72
2,855
78,184
13,610
91,794
1948--4,351
7267
1,240
520
314
1,808
349
35
5
204
8,965
·11,838
20,803
1950
4,737
8353
1,131
526
245
1,398
413
20
17
236
8,859
7,373
16,232
1952
4,510
14266
1,007
280
169
1,195
373
28
7
215
7,992
7,845
15,837
1954
3,867
125·80
1,055
410
168
1,117
240
18
7
190
7,277
7,125
14,402
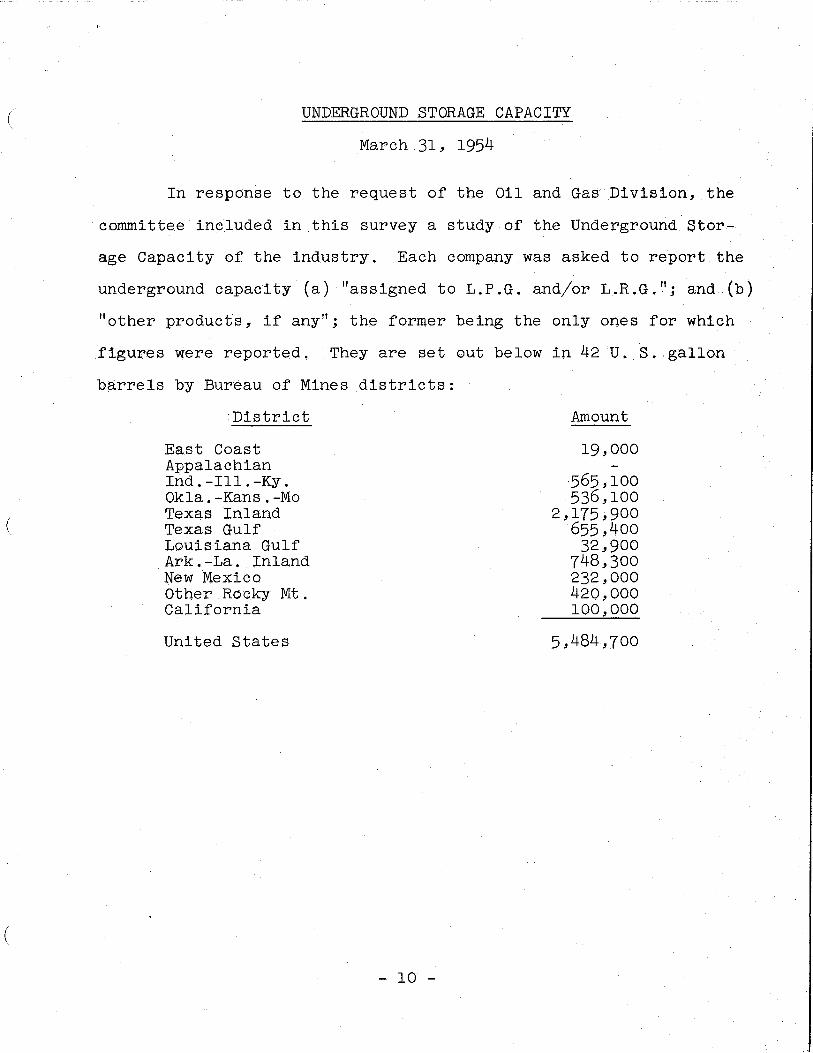
( UNDERGROUND STORAGE CAPACITY
March 31, 1954
In response to the request of the Oil and Gas Division, the
committee included in this survey a study of the Underground Stor
age Capacity of the industry. Each company was asked to report the
underground capacity (a) lIass igned to L.P.G. and/or L.R.G."; and (b)
"other products, if any"; the former being the only ones for which
figures were reported. They are set out below in 42U. S.gallon
barrels by Bureau of Mines districts:
(
(
District
East CoastAppalachianInd.-Ill.-Ky.Okla. -Kans. -MoTexas InlandTexas GulfLouisiana GulfArk.-La. InlandNew MexicoOther Rocky Mt.California
United States
- 10 -
Amount
19,000
565,100536,100
2,175,900655,400
32,900748,300232,000420,000100,000
5,484,700
As in all of the previous surveys by this committee, the most
interesting finding is again the very large petroleum storage capacity
indicated as necessary to maintain normal flexibility of industry
operations.
The first survey which was as of March 31, 1948 showed an aver
age of 100 barrels of storage capacity to every 41 barrels of inven
tories held in steel storage or reservoirs. The second survey as of
October 31, 1950 showed an average of 100 barrels of capacity to
every 45 barrels of inventory. In the 1952 study the relationship
was the same. This year the figures show 47 barrels of inventory to
each 100 barrels of capacity.
The committee wishes to again point out to those not familiar
with oil industry operating problems that in no sense can the differ-
( ence between inventories and capacities herein shown, be taken as
an indication of available storage space. The industry must enjoy
complete flexibility at all times if normal operation of its far
flung transportation, manufacturing and distribution systems is to
prevail, and if supplies to consumers are to be delivered efficiently
and on schedule.
These four surveys, the only ones of their kind developed for
the industry as a whole, may be said to have definitely confirmed
what individual long term operating experience has indicated,
that relatively low ratios of actual inventories to total storage
- 11 -
(
capacity in service is essential if difficulties in processing,
handling and distribution are to be avoided, and if the industry
is to operate efficiently and well. The committee therefore again
stresses as proof of the foregoing reflections the operating relation-
ships once more derived as a result of this latest survey.
None of the figures in this report include stocks or storage
capacity, if any, in the hands of the military.
Respectfully submitted,
FOR THE COMMITTEE ON PETROLEUMSTORAGE CAPACITY
/S/ L. S. WescoatL. S. Wescoat; Chairman·
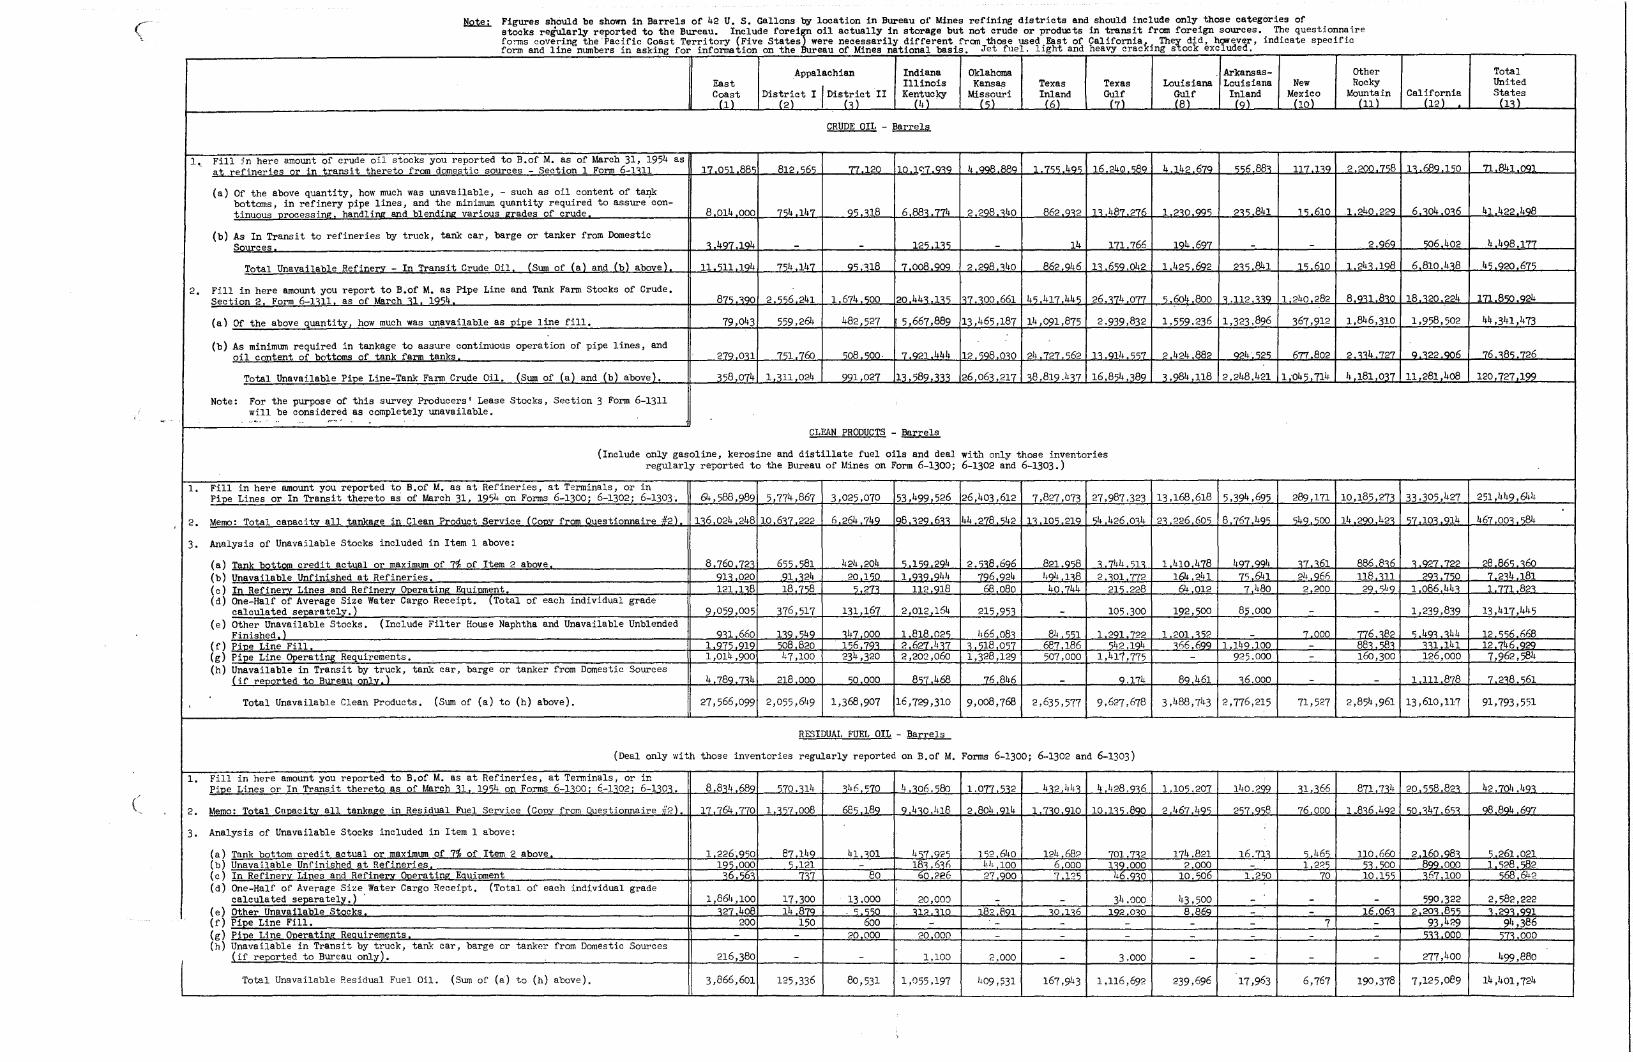
Figures should be shown in Barrels of 42 U. S. Gallons b,y location in Bureau of Mines refining districts and should include only those categories ofstocks reiularly reported to the Bureau. Include forei~ oil actually in storage but not crude or products in transit fran foreign sources. The questionnairefo~s covering the'Pacific Coast Territory (Five States) were necessarily different from those used East of California~ They did, however, indicate specificform and line numbers in asking for information on the Bureau of Mines national basis Jpt fuel light and heavy craCKing s~ock excluded-
Appalachian Indiana Oklahoma . Arkansas- other TotalEast
Disl~~ct I .IDisl~~ctIIIllinois Kansas Texas Texas Louisiana Louisiana New Rocky United
C~)t Kentucky Mi(~)uri I(~,nd ~~ ~~f I~,nd M7~;)0 Mo~i)in California sl~;\s(4) (12)
CRUDE OIL - Barrels
1 •. Fill ;n here amount of crude oil stocks you reported to B.of M. as of March 31, 1954 asat refineries or in transit thereto from domestic sources - Section 1 Form 6-1<11 17 0,1 88, 812.,6, 77 120 10 1~7.9'9 4.0Q/3 880 1 7<;<; 49, 16 240 <;80 4 142 670 <;<;688< 117 .1'0 2 2oo.7r;8 l' 680.1r;0 71 84l.OQ1
(a) Of the above quantity, how much was unavailable, - such as oil content of t~bottoms, in refinery pipe lines, and the minimum quantity required to assure con-
7r;4 147 9'5.,18 688<774 2 298.,40 862 0<2 1< 487 276 2<0 00<; 2<<; 841 1<; 610 .1 240 229 6.,04 0,6 41 422 498tinuous nrocessinu handlin2 and blendinu various arades of crude 8 014 000 1
(b) As In Transit to refineries by truck, tank car, barge or tanker from Domestic, 407 104 12r; 1'r; 171.766 104 607 2.060 r;06 402 4 408 177Sources - - 14 - -
Total Unavailable Refinerv - In Transit Crude Oil (Sum of (a) and (b) above) 11.r;11 104 7r;4 147 0,:'U8 7 008.000 2 208.<40 862.046 1< 6,0 042 1 42,1002 2<' 841 l' 610 1 24, 108 6 810 4,8 4,.020 67,
2. Fill in here amount you report to B.of M. as Pipe Line and Tank Farm Stocks of Crude.1<.112 «0Section 2 Form 6-1<11 as of March <1 10<;4 87'5.,90 2.'5'56 241 1 674.r;00 2044, 1'r; 1,7.<00 661 4r; 417 44r; 26.<74 077 r; 604 800 1240 282 8.0,1 8,0 18.,20 224 1718r;o.024
(a) Of the above quantity. how much was unavailable as nine line fill. 79,043 559,264 482,527 5,667,889 13,465,187 14,091,875 2.939,832 1.559.236 1,323,896 367,912 1.846,310 1,958,502 44,341,473
(b) As minimum required in tankage to assure continuous operation of pipe lines, andoil content of b~ttoms of tank farm tanks 279 0,1 7'51.760 ,08'00· 7021 444 12.r;98 0,0 24 727 <;6? 1< 014 <;<;7 2 424 882 024' <;2<; 677 802 2.«4.727 9.<22.906 76.,8r;.726
Total Unavailable Pine Line-Tank Farm Crude Oil. (Sum of (a) and (b) above). ,58 074 1.,11 024 991 027 n 589.", 26 06, 217 <8 819.4,7 16.854.,80 "Q/34 118 2.248.421 1 ·04r;. 714 4 181 0,7 11 281 408 120.727 199
Note: For the purpose of this survey Producers' Lease Stocks, Section 3 Form 6-1311will be considered as completely unavailable..~ .... .. .. ~..
CLEAN PRODUCTS - Barrels
(Include only gasoline, kerosine and distillate fuel oils and deal with only those inventoriesregularly reported to the Bureau of Mines on Form 6-1300; 6-1302 and 6-1303.)
1, Fill in here amount you reported to B.of M. as at Refineries, at Terminals, or inPipe Lines or In Transit thereto as of March 31, 1954 on Forms 6-1300; 6-1302; 6-1303. 64,588,989 5,774,867 3,025.070 53,499 526 26,403,612 7,827,073 27,987.323 13.168,618 5,394,695 289,171 10,18.5,273 33,305,427 251,449,644
2. Memo: Total canac i tv all tankaae in Clean Product Service (Co"v from Questionnaire ·#2) n6 024 248 10 6,7 222 6 264.749 98.,29 6" 44 278.,42 1< 10' 210 r;4 426 0<4 2< 226 60, 8.76740<; ,40.'00 14 290 42, '5710<.014 46700< .,84
3. Analysis of Unavailable Stocks included in Item 1 above:
(a) TRnk b~t.tnm credit act al or maximum of 7% of Item 2 above 8.760.72, 6'5'5,'581 424 204 <; 1r;9 294 2.r;<8 606 821.9r;8 ,.744 ')1' 1 410 478 407004 <7. <61 886 8<6 <.027.722 28.116,.<60
(b) Unavailable Unfinished at Refineries. 91, 020 .91. ,24 20 1'50 1.9,9.944 706.024 4041'8 ? .<01.772 iii" 241 7, 641 24.066 118.<11 20<.7r;0 7 2<4 181(c) In Refinerv Lines and Refinerv Oneratinll Eauinment 121 n8 18.7,8 , 27< 112.018 68 080 40.744 21r;.228 64 012 7 480 2 200 20 ,)1,0. 1 086 44, 1.771 82<(d) One-Half of Average Size Water Cargo Receipt. (Total of each individual grade
calculated separately.) 9 059,005 376,517 131 167 2 012 164 215 953 - 105,300 192 500 8,5 .000 - - 1 239,839 13,417,445(e) Other una,ailable Stocks. (Include Filter House Naphtha and Unavailable Unblended
Finished 9,1 660 n9,'549 ,117 000 1 818 02r; 1166 08< 84"'1 1 201.722 1 201<'2 7 000 776.,82 '5 4cn.'44 12<;<;6 1168(f) Pine Line Fill 1.97'5.91CJ ,08 820 1<;6.70< 2 6274<7 ,.r;180r;7 687.186 r;42.194 <66.606- 1 140.100 88,.,8, "1 141 12.746.0?Q(g) Pipe Line Onerating Requirements. 1,014,900 47,100 234,320 2,202,060 1,328,129 507,000 1,411,775 - 925.000 160,300 126,000 7,962,584(h) Unavailable in Transit by truck, tank car, barge or tanker from Domestic Sources
j if re"nT't.ed to BtlT'eau nnlv. ) 4.780.7<lf 218 000 '0 000 8,7 468 '76 81~6 - 0.174 80 461 <6.000 - - 1 111 878 7 2<8.,61
Total Unavailable Clean Products. (Sum of (a) to (h) above). 27,566,099 2,055,649 1,368,907 16,729,310 9,008,768 2,635,577 9.627,678 3,1188,743 2,776,215 71,527 2,854,961 13,610,11:7 91,793,551
RESIDUAl. FUEL OIL - Barrels
(Deal only with those inventories regularly reported on B.of M. Forms 6-1300; 6-1302 and 6-1303)
1, Fill in here amount you reported to B.of M. as at Refineries, at Terminals, or inPine Lines or In Transit theret,-, as of March <1 10,4 on Forms 6 1<00' 6-1'02' 6 1<0< 8 8,4 68CJ ,70. <14 ~46 <;70 4·<06.r;80 1,077.,,2 4,2.411' 4 428.0,6 1.10, 207 140.2QQ ,1.,66 871.7,4 20.,,8 82' 42.701f 49,
2. Memo: Tntal Capacity all tankaue in Residual Fuel Service (Conv from Questionnaire ;'2), 17.764.770 1,,'57 008 68" 189 9 4,0 hIS 2 80lf .014 1.7,0.010 10 1<,.800 2 )~67 40, 2,7.0,8 76 000 1 8,6 492 '50.,47 6,< 08804 697
3. Analysis of Unavailable Stocks included in Item 1 above:
(a) Tank bottom credit actual or maximum of 7~ of Item 2 above 1 226.9'50 87 149 41.,01 4')7.02') 1 ')? 6lfO 124 682 701.7,2 174.821 16.71' , 46') llb660 2 160.98, ') 261 021(b) Unavailable Unfinished at Refineries 10, 000 , 121 - 18'l 6,11 44 100 6 000 1« 000 2 000 - 1 2~, r;,.,oo 899 000 1 ')28.,82(c) In Refinerv Lines and Refine""" nneratina Enuinrnent '\6.'56, 7'\7 80 602£:6 27 .000 7 12' 1~6.o<o 10.'i06 1 2'i0 70 10 1'5'5 ,67 100 r;68 642(d) One-Half of Average Size Water Cargo Receipt. (Total of each individual grade !
calculated senaratelY.) , 1,861f,100 17.300 13.000 20,00a - - 34.000 43,500 - - - 590.322 2,582,222(e) Other Unavailable Stocks ,27 408 111 879 . <;.')')0 ,12.,10 182 801 <0 1~6 1Q2 0<0 8860 - - 16 06, 2 20, 8" < 20, .091(f) Pine Line Fill. 200 150 600 - - - - - - 7 - 93,429 94,386(g) Pine Line Oneratinu Reouirements - 20000 20 000 - - - - r;" 000 ,7< 000(h) ynavailable in Transit by truck, tank car, barge or tanker from Domestic Sources
Iif renorted to Bureau onlY). 216,380 - - 1.100 2,000 - 3.000 - - 277,400 499,880
Total Unavailable Residual Fuel Oil. (Sum of (a) to (h) above). 3,866,601 1'25,336 80,531 1,055,197 )~09 .?31 167,943 1.116,692 239,696 17,963 6,767 190.378 7,125,089 14,401,724
(
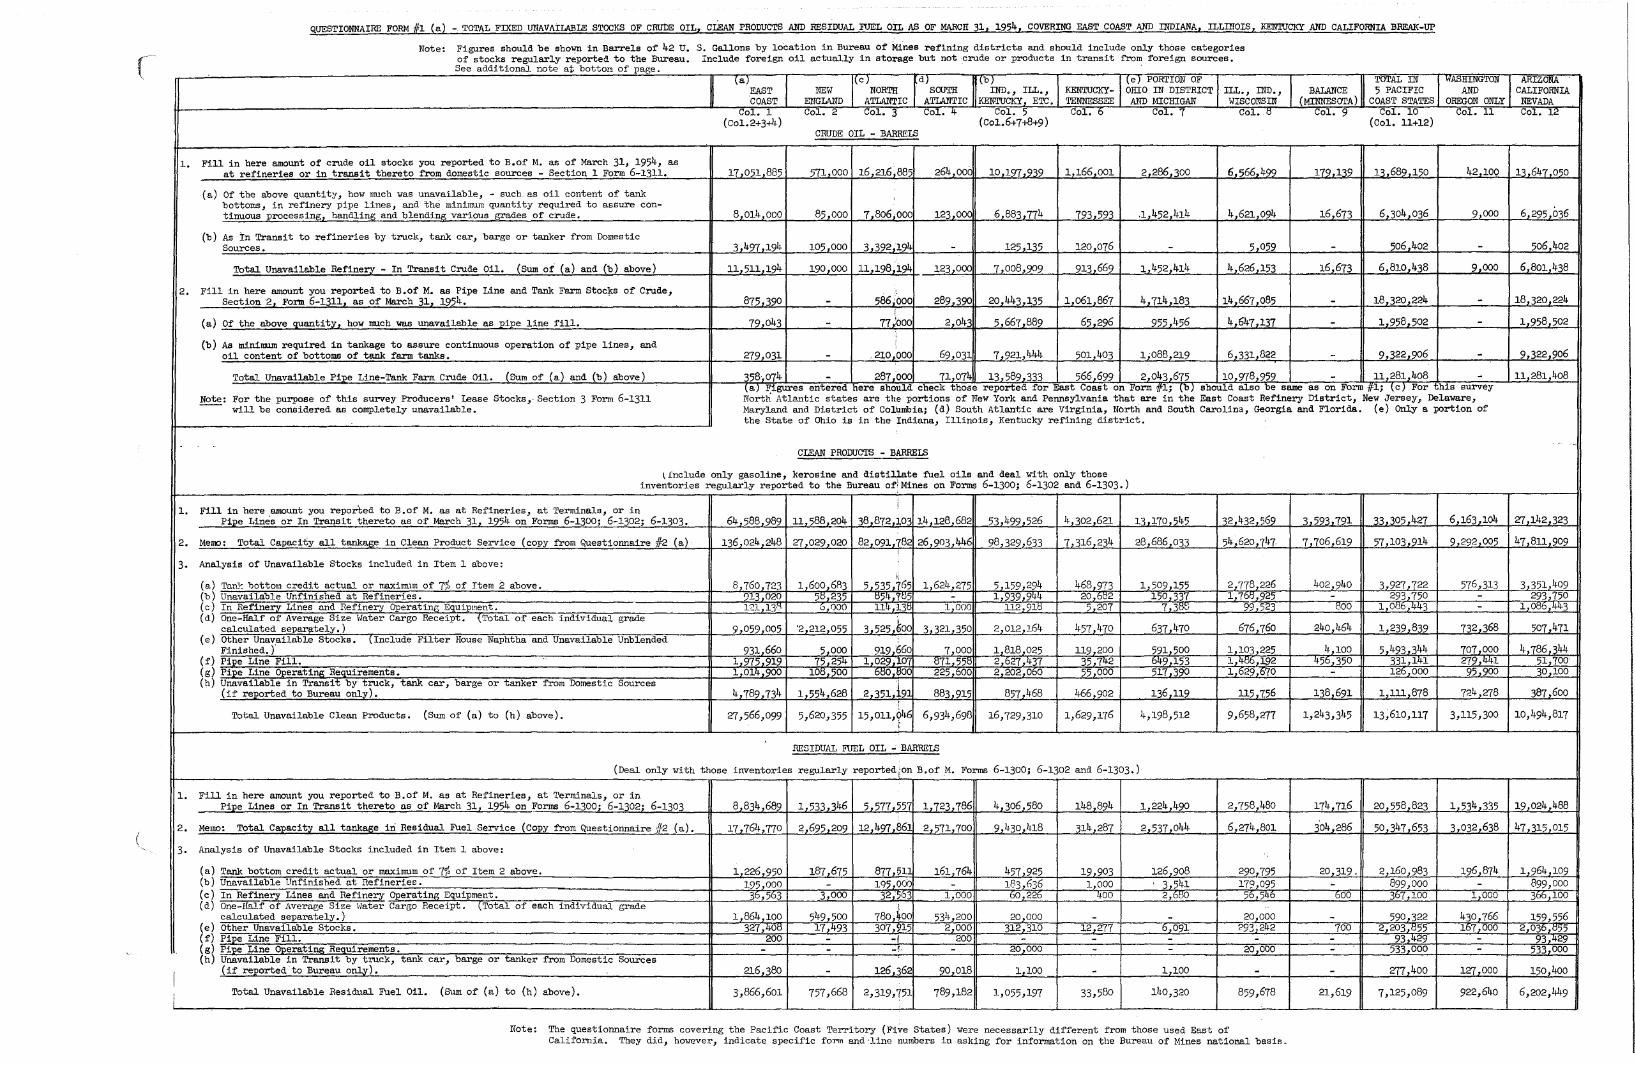
QUESTIONNAIRE FORM #1 (a) - TOTAL FIXED UNAVAILABLE STOCKS OF CRUDE OIL. CLEAN PRODUCTS AND RESIDUAL FUEL OIL AS OF MARCH 31, 1954, COVERING EAST COAST AND INDIANA. ILLINOIS. KENTUCKY AND CALIFORNIA BREAK-UP
Note: Figures should be shown in Barrels of 42 U. S. Gallons by location in Bureau of Mines refining districts and should include only those categoriesof stocks regularly reported to the Bureau. Include foreign oil actually in storage but not ,crude or products in transit from foreign sources.See additional note at bottom of paGe, .
(a) I(c) d) i(b) (e) PORTION OF TOTAL IN wASHINGTON ARIZONAEAST NEW NORTH SOOTH IND., ILL., KENTUCKY- OHIO, IN DISTRICT ILL., IND., BALANCE 5 pACIFIC AND CALIFORNIACOAST ENGLAND ATLANTIC ATLANTIC KEN'l'UCKY ETC. TENNESSEE AND MICHIGAN WISCONSIN (MINNESOTA) COAST STATES OREGON ONLY NEVADA
Col. 1 Col. 2 Col. 3 Col. 4 Col. 5 Col. 6 Col. 7 Col. ,tI Col. 9 Col. 10 Col. 11 Col. 12(Co1.2+3+4) (Col.6+7+8+9) (Col. 11+12)
CRUDE OIL - BARRELS
l. Fill in here amount of crude oil stocks you reported to B.of M. as of March 31, 1954, as16 216 885 264 oob 10.197.919 2 286 300 6 566 499 179 119 11,689 150 42.100 11 647 0'50at refineries or in transit thereto from domestic sources - Section 1 Form 6-1311. 17 051 885 571 000 1.166001
(a) Of the above quantity, how much was unavailable, - such, as oil content of tankbottoms, in refinery pipe lines, and the minimum quantity required to assure con-
8 014 000 85 000 7,806000 6 883.774 ,1 452 414 4 621 094 16 673 6.304,036 9,000 6 295 036tinuous processing, handling and blending various grades of crude. 123 000 793 593
(b) As In Transit to refineries by truck, tank car, barge or tanker from Domestic3,497,194 3 392 194 120,076 506 402 506402Sources. 105 000 - 125 135 - 5 059 - -
Total Unavailable Refinery - In Transit Crude Oil. (Sum of (a) and (b) above) 11,511 194 190 000 11 198 194 123 000 7 008 909 913,669 1 452 414 4 626 153 16673 6 810,438 9 000 6 801 438
2. Fill in here amount you reported to B.of M. as Pipe Line and Tank Farm Stoc~s of Crude,Section 2 Form 6-1311 as of March 31 1954. 875 390 - 586 '000 289,390 20 443 135 1 061 867 4,714 183 14 667 085 - 18,320,224 - 18 320 224
I
(a) Of the above Quantity, how much was unavailable as pipe line fill. 79.043 - 77 ;000 2,043 5 667 889 65 296 955 456 4 647,137 - 1,958 502 - 1 958 502;
(b) As minilllUJJl required in tankage to assure continuous operation of pipe lines, andoil content of bottoms of tank farm tanks. 279,031 - 210000 69,031 7 921,444 501 403 1,088,219 6 331 822 - 9,322,906 - 9 322,906
Total Unavailable Pipe Line-Tank Farm Crude Oil. (Sum of (a) and (b) above) 358,074 - 287000 71.074 13 589 333 566 699 2,043 675 10,978,959 - 11,281,408 - 11 281,408
For the purpose of this survey Producers' Lease Stocks,' Section 3 Form 6-1311(a) ~igures entered here should check thoBe reported for East Coast on Form 1/,1; (b) should also ,be same as on Form 1/,1; (C) For this survey
Note: North Atlantic states are the portions of New York and Pennsylvania that are in the East Coast Refinery District, New Jersey', Delaware,Will be considered as completely unavailable. Maryland and District of Columbia; (d) South Atlantic are Virginia, North and South Carolina, Georgia and Florida. (e) Only a portion of
the State of Ohio is in the Indiana, Illinois, Kentucky refining district.
CLEAN PRODUCTS - BARRELS
(include only gasoline, kerosine and distillate fuel oils and deal With only thoseinventories regularly reported to the Bureau of)Mines on Forms 6-1300; 6-1302 and 6-1303.)
I
Fill in here amount you reported to B. of M. as at Refineries, at Terminals, or inI
l.Pipe Lines or In Transit thereto as of March 31 1954 on Forms 6-1300; 6-1302; 6-1303. 64 588 989 11 588 204 38.872 10, 14 128 682 53 499 526 4 302 621 13,170.545 12 432.569 3,593,791 33 305,427 6 163 104 27 142,323
2. Memo: Total Capacity all tankage in Clean Product Service (copy from Questionnaire 1/2 (a) 136 024 248 27.029020 82,091 782 26 903.41~6 98,329 633 7 316 234 28,686,033 54 620,747 7 706 619 57 103,914 9 292 005 47 811 909i
3. Analysis of Unavailable Stocks included in Item 1 above:~
2 778,226 402 940 3.927.722 576 313 3 351 409(a) Tank bottom creMt actual or maxinn.tm of 7% of Item 2 above. 8 760 723 1,600,6R3 5 535 '765 1 624,275 5,159,294 468 973 1,509 155(b) Unavailable Unfinished at Refineries. ')13 020 50.235 54,7tJ5 - 1 939 9l~4 20.6t52 150,337 1 761),925 - 293 750 - 293 750(c) In Refinery Lines and Refinery OperatinG EqUipment. 121 1}':\ .0.000 11!~13tJ 1 000 112,91d 5 207 7,3t10 99 523 tlOO 1 01:16,lf43 - 1 0($6,443(d) One-Half of Average Size Water Cargo Receipt. {Total of each individual grade
3 525 600 676 760 240 464 732 368 507 471calculated separ!l-te1y.) 9,059.005 '2,212,055 3 321,350 2,012 164 457 470 637 470 1 239,839(e) other Unavailable Stocks. (Include Filter House Naphtha and Unavailable Unblended ;
Finished.)' 931,660 5,000 919660 7,000 1 818 025 119 200 591 500 1 103 225 4 100 5.493,344 707 000 4 786 344(f) Pipe Line Fill. 1.975.919 75 254 1 029 107 1:171.551: 2,627,437 35 742 649 153 l,4t16.192 45b350 331,141 279,441 51 700(g) Pipe Line Doeratinl>: Requirements. 1,014,900 lOb, 500 btlO,I;)OO 225,000 2 202 000 55 000 517 390 1,629.670 - 126.000 95 900 30 100(h) Unavailable in Transit by truck, tank car, barge or tanker from Domestic Sources
2,351 191 724 278 387,600(if reported to Bureau only). 4,789,734 1,554,628 883 915 857,468 466 902 136 119 115 1:56 138,691 1.111,878i
Total Unavailable Clean Products. (Sum of (a) to (h) above). 27,566,099 5,620,355 15,OllA>46 6,934,6913 16,729,310 1,629,176 4,198,512 9,658,277 1,243,345 13,610,117 3,115,300 10,494,817c
RESIDUAL FUEL OIL -BARRELS
(Deal only With those inventories regularly' reported ion B.of M. Forms 6-1300; 6-1302 and 6-1303.)
1. Fill in here amount you reported to B.of M. as at Refineries, at Terminals, or inPipe Lines or In Transit thereto as of March 31, 1954 on Forms 6-1300; 6-1302; 6-1303 8,834,689 1 533 346 5 577 557 1,723,786 4,306,580 148 894 1 224 490 2 758 480 174 716 20 558 823 1 534 335 19 024 488
2. Memo: Total Capacit:v all tankage iIi Residual Fuel Service (Copy from Questionnaire /,"2 (a). 17 ,764 770 2 695 209 12 lf97 86 2,571,700 9 430 418 314 287 2 537 044 6 274 801 304 286 50,347,653 3 032 638 47 315 015
3. Analysis of Unavailable Stocks included in Item 1 above:
(a) Tank bottom credit actual or maximum of 7% of Item 2 above. 1 226 950 187 675 877 51 161,764 457 925 19 903 126 908 290,795 20 319, 2,160,983 196 874 1964 109(b) Unavailable Unfinished at Refineries. 195 000 - 195 000 - 183,636 1,000 3 541 179,095 - 899,000 - 899,000(c) In Refinery Lines and Refinery, Operating Equipment. 36,563 3 000 32 '503 1 000 60,2'26 400 2.6eo 56 546 600 367 100 1000 3bb,100(d) One-Half of Average Size I'later Cargo Receipt. (Total of each individual grade \
calculated separately.) 1,864,100 549 500 780 ~OO 531f.200 20 000 - - 20 000 - 590 322 430.766 159,556(e) other Unavailable Stocks. 327,40b 17,493 307,5115 2,000 312,310 12 277 6,091 293 242 700 2 203,d55 107,000 2,036,b55(f) Pipe Line Fill. 200 - -I 200 - - - - - 93.429 - 93;ll-29(g) Pipe Line Ooeratiru>: Reauirements. - - -'~' - 20 000 - - 20,000 - 533 000 - 533,000(h) Unavailable in Transit by truck, tank car, barge or tanker from Domestic Sources
I(if re'Ported' to Bureau onl.v). , 216,380 - 126 362 90.018 1,100 - 1.100 - - 277 400 127.000 150,400
(Sum of (a) to (h) above).i
Total Unavailable Residual Fuel Oil. 3,866,601 757,668 2,319,751 789,182 1,055,197 33,580 140,320 859,678 21,619 7,125,089 922,640 6,202,449
Note: The questionnaire forms covering the Pacific Coast Territo~J (FiVe States) were necessarily different from those used East ofCalifornia. They did, however, indicate specific form and 'line nUlnbers in asking for information on the Bureau of Mines national basis.
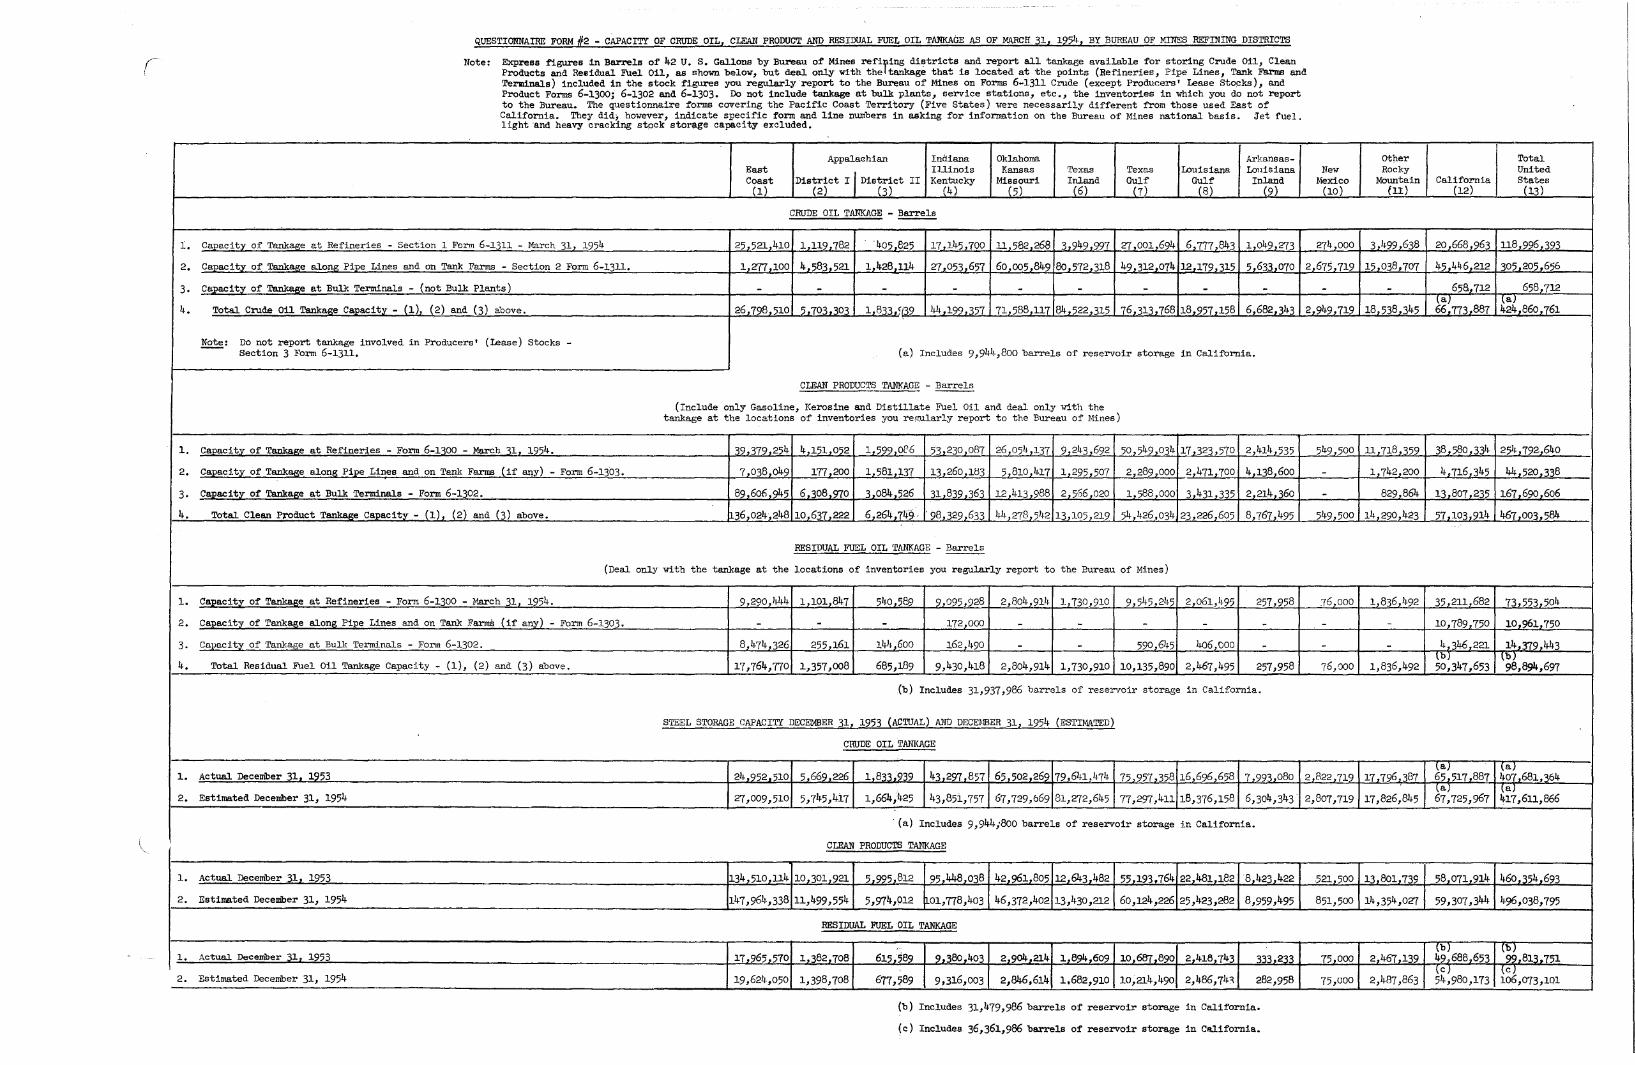
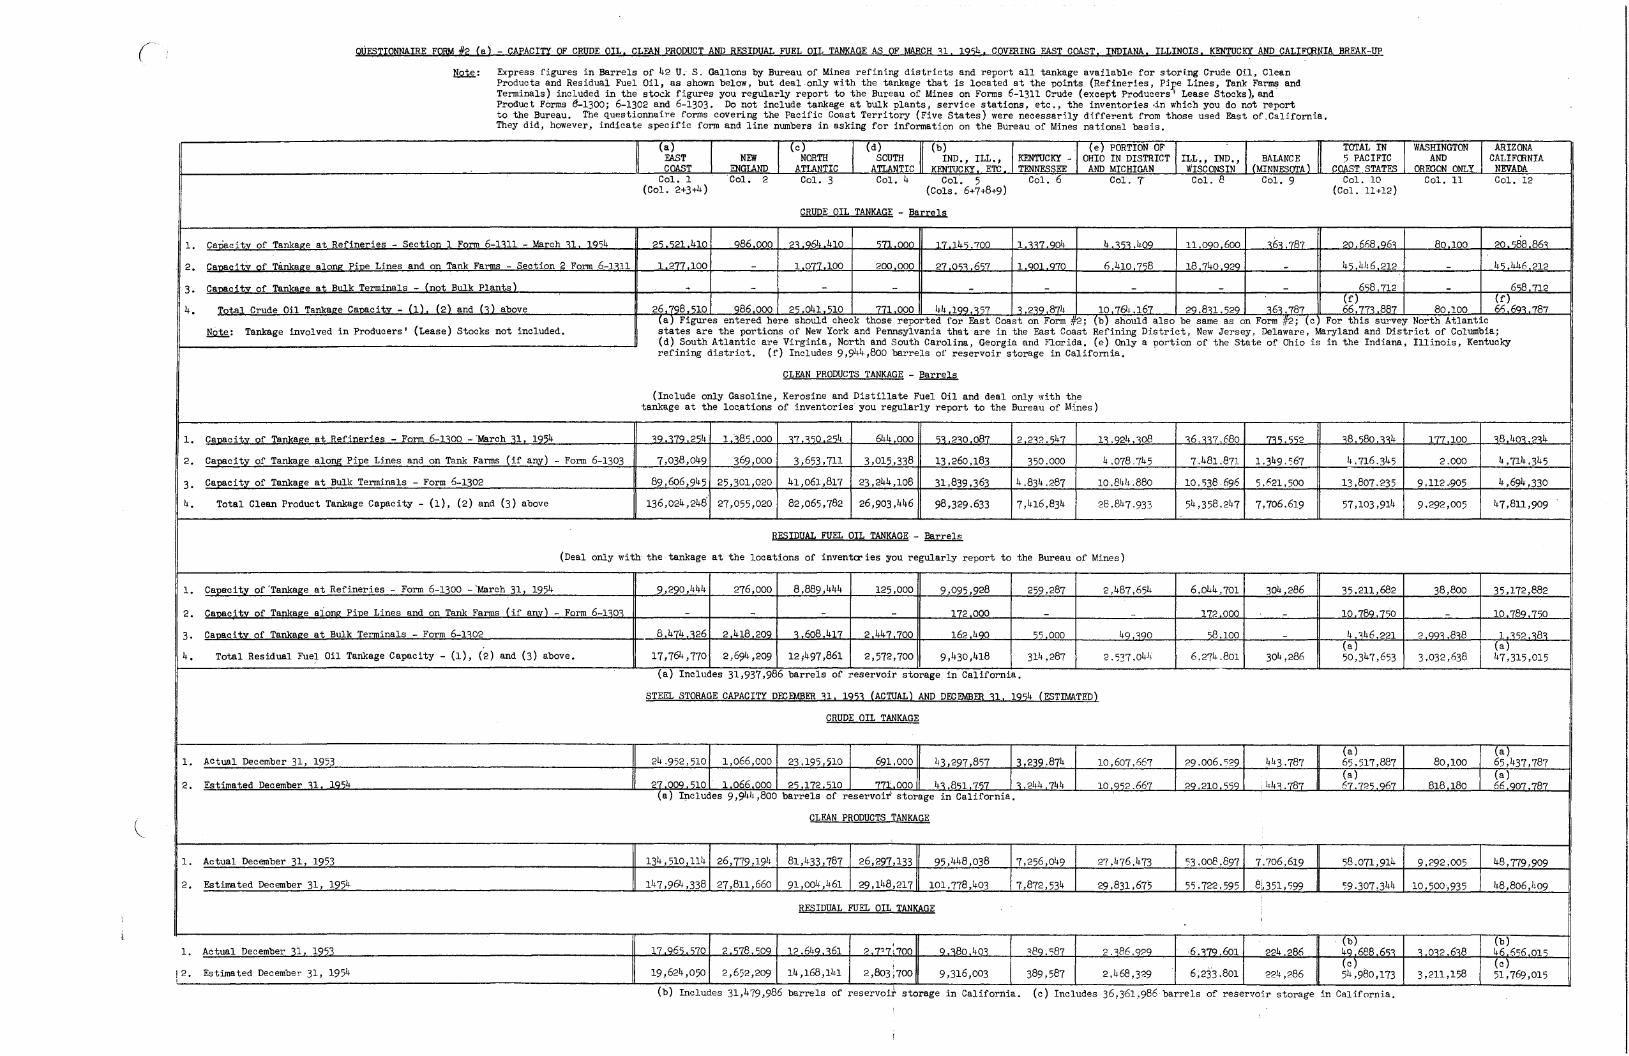
QUESTIONNAIRE FORM #2 - CAPACITY OF CRUDE OIL, CLEAN PRODUCT AND RESIDUAL FUEL OIL TANKAGE AS OF MARCH 31, 1954, BY BUREAU OF MTNES REFINING DISTRICTS
Note: Express figures in Barrels of 42 U. S. Gallons by Bureau of Mines ref'ifing districts and report all tankage available for storing Crude Oil, CleanProducts and Residual Fuel Oil, as shown below, but deal only with the tankage that is located at the points (Refineries, Pipe Lines, Tank Farms andTerminals) included in the stock figures you regularly report to the Bureau of Mines on Forms 6-1311 Crude (except Producers' Lease Stocks), andProduct Forms 6-1300; 6-1302 and 6-1303. Do not include tankage at bulk plants, service stations, etc., the inventories in which you do not reportto the Bureau. The questionnaire f'orms covering the Pacifi.c Coast Territory (Five States) ;Tere necessarily different :from those used East ofCalifornia. They did; however, indicate specific fonn and line numbers in asking for information on the Bureau of Mines national basis. Jet fuel.light ·and heavy cracking stock storage capacity excluded.
Appalachian Indiana Oklahoma Arkansas- other TotalEast Illinois Kansas Texas Texas IDuisiana Louisiana New Rocky Unitedcrst District I IDistrict II Kentucky Missouri Inland Gulf Gulf Inland lo!exico Mountain California States
1) (2) (3) (4) (5) (6) (7) (8) (9) (10) (11) (12) (13)
CRUDE OIL TANKAGE - Barrels
1- Capacity of Tankage at Refineries - Section 1 Form 6-l311 - I<'.arch 31 1954 25 521,410 1 119 782 ·405 825 17 145 700 II 582 268 3.949 997 27 001 694 6 777 843 1 049 273 274 000 3 499 638 20 668 963 118,996,393
2, Capacity of Tankage alont': Pipe Lines and on Tank Farms - Section 2 Fonn 6-1311. 1 277 100 4 583,521 1,428 114 27,053,657 60 005 849 80,572 318 49 312 074 12.179.315 5,633 070 2 675,719 15,038,707 45 44-6212 305 205.656
3. Capacity of~e at Bulk Tenninals - (not Bulk Plants) - - - - - - - - - - - 65B 712 658,712
Total Crude Oil Tankage Capacity - (1). (2) and (3) above. 6 682 343 2,949,719 18.538,345 ~6}773,887.la}
4. 26 798 510 5,703.303 1 833.(139 44,199 357 71 588 117 84,522 315 76 313,768 18 957,158 424 860.761
Note: Do not report tankage involved in Producers' (Lease) Stocks -Section 3 Fonn 6-1311. (a) Includes 9,944,800 barrels of reservoir storage in California.
CLEAN PRODUCTS TANKAGE -~
(Include only Gasoline, Kerosine and Distillate Fuel Oil and deal only with thetankage at the locations of inventories you rem1arly report to the Bureau of Nines)
1. Capacitv of Tankalle at Ref'ineries - Fonn 6-1300 - March 31 1954. 39 379 254 4 151,052 1 599 01.'6 53,230 087 26,05);,137 9,243,692 50,549,034 17.323,570 2 414 535 549 500 II 718.359 38 580 334 254 792,640
2. Capacity of' Tankage along Pipe tines and on Tank Farms (if' any) - Form 6-1303. 7 038 049 177,200 1 581,137 13,260.1tl3 5.810.417 1,295,507 2,289,000 2 471 700 4 138 600 - 1,742,200 4.716,345 44 520 338
3. Capacity of' Tankage at Bulk Tenninals - Fonn 6-1302. 89 606 945 6 308 970 3.084,526 31.839.363 12 413,988 2.5056,020 1,588,000 3 431,335 2 214 360 - 829.864 13 807,235 167 690 606
4. Total Clean P;roduct Tankage Capacity - (1) (2) and (3) above. b.36 024 248 10 637 222 6 264,749 '98329,633 44 278.5'+2 13 105 219 54,426,034 23 226 605 8767.495 549,500 14 290 423 57.103,914 467 003 584
RESIDUAL FUEL OIL TANKAGE - Barrels
(Deal only with the tankage at the locations of inventories you regularly report to the Bureau of Mines)
1. Capacity of Tankap;e at Refineries - FOI"l!l 6-1300 - ~1arch 31 1954. 9 290 If44 1 101 847 51fO 589 9.095,928 2,804,914 1 730,910 9 545 245 2 061,lf95 257,958 76 000 1 836 492 35,211,682 73 553 504
2. Capacity of Tankage along Pipe Lines and on Tank FarmS (if any) - Form 6-1303. - - - 172 000 - - - - - - - 10,789,750 10 961 750
3. Capacity of Tankap;e at Bulk Tenninals - Form 6-1302. 8 474 326 255 161 141, 600 162 490 - - 590 6).5 406 000 - - - 4,346,221 14 379 443
4. Total Residual Fuel Oil Tankage Capacity - (1), (2) and (3) above. 17,764,770 1,357,008 685,189 9,430,418 2,804,914 10,135,890 2,467,495 257,958 76,000 1,836,492~b) ~'!)l
1,730,910 50,347,653 98,894,697
(b) Includes 31,937,986 barrels of reservoir storage in California.
STEEL STORAGE CAPACITY DECEMBER 31, 1953 (ACTUAL) AND DECENBER 31, 1954 (ESTIMATED)
CRUDE OIL TANKAGE
Actual December 31. 1953 24,952 510 5669226 1 8,,!'.939 43 297 857 65 502 269 79 641 474 16,696 658 7.993,080 2,822,719 17,796 387\a)
~~i 681,3641. 75 957 358 65,517,887
Estimated December 31, 1954 5,745,417 1,664,425 If3,851,757\a) .lai
2. 27,009,510 67,729,669 81,272,645 77,297,411 18,376,158 6,304,343 2,807,719 17,826,845 67,725,967 417,611,866
. (a) InCludes 9,944;800 barrels of reservoir storage in California.
CLEAN PRODUCTS TANKAGE
1. Actual December 31, 1953 134 510 114 10 301 921 5 995 812 95 448 038 42 961 805 12 643 482 55 193.764 22,481 182 8,423,422 521 500 13 SOl 739 58,071,914 460,,54 693
2. Estimated December 31, 1954 147,964,338 11,499,554 5,974,012 01,778,403 46,372,402 13,430,212 60,124,226 25,423,282 8,959,495 851,500 14,354,027 59,307,344 496,038,795
RESIDUAL FUEL OIL TANKAGE
Actual December :'ll. 1953 615589 9380 403 333.233(b)
(~ 813.7511. 17 965 570 1 382 708 2904 214 1 894 609 10 68T 890 2,418 743 75000 2,467 139 49,688,653
2. Estimated December 31, 1954 19,624,050 1,398,708 677,589 9,316,003 2,846,614 1.682,910 10,214,490 2,486,74::l 282,958 2,487,863i~ ) lc ~
75,000 54,980,173 106,073,101
(b) Includes 31,479,986 barrels of reservoir storage in California.
(c) Includes 36,361,986 barrels of reservoir storage in California.
( oUESTIONNAIRE FORM ft2 (a) CAPACITY OF CRUDE OIL. CLEAN PRODUCT AND RESIDUAL FUEL OIL TANKAGE AS OF MARCH i1. 1954. COVERING EAST COAST, INDIANA. ILLINOIS. KENTUCKY AND CALIFCRNIA BREAK-UP
fu2k: Express figures in Barrels of 42 U. S. Gallons by Bureau of Mines refining districts and report all tankage available for storIng Crude Oil, CleanProducts and Residuai Fuel Oil, as shown below, but deal.only with the tankage that is located at the points (Refineries, Pipe Lines, Tank Farms andTerminals) inclUded in the stock figures you regularly report to the Bureau of Mines on Forms 6-1311 Crude (except Producers' Lease StockSh andProduct Forms e-1300; 6-1302 and 6-1303. Do not include tankage at bulk plants, service stations, etc., the inventories .in which you do not reportto the Bureau. The questionnaire forms covering the Pacific Coast Territory (Five States) were necessarily different from those used East of.California.They did, however, indicate specific form and line numbers in asking for information on the Bureau of Mines national basis.
(b) Includes 31,479,986 barrels of reservoir storage in California. (c) Includes 36,361,986 barrels of reservoir storage in California.
(a) (c) (d) (b) ( e) PORTION OF TOTAL IN WASHINGTON ARIZONAEAST NEW NORTH SOUTH IND., ILL., KENTUCKY - OHIO IN DISTRICT ILL., IND., BALANCE '5 PACIFIC AND CALIFCRNIACOAST ENGLAND ATLANTIC ATLANTIC KENTUCKY ETC TENNESSEE AND MICHIGAN WISCONSIN (MINNESOTA) CoAsT STATES OREGON ONLY NEVADA
Col. 1 Col. 2 Col. 3 Col. 4 Col. 5 Col. 6 Col. T Col. 8 Col. 9 Col. 10 Col. 11 Col. 12(Col. 2+3+4) (Cols. 6+7+8+9) (Col. 11+12)
CRUDE OIL TANKAGE - Barrels
1. Catiacitv of Tanka~e at Refineries - Section 1 Form 6-nll - March il 19S4 2'5.'521 410 986 000 2i.964 410 '571.000 17.1!J.S 700 1.ii7.004 4.i<;i 409 11.090 600 ,6,.787 20 668.96i 80 100 20 s88 86i
2. Canacitv of Tanka~e alan" Pine Lines and on Tank Farms - Section 2 Form 6-1'<11 1 277 100 - 1077.100 200 000 27.0'5, 6'57 1 .90l .970 6 410.7<;8 18.740.929 - 4<; 4116 212 - 4<; 446 212
3. Canacitv of Tanka~e at. Blll k Terminals - (not Bulk Plants) - - - - - - - - - 6'58.712 - 6'58.712
Total Crude Oil Tanka"e Canacitv - (1) (2) and h) above 26.798.'510 986000 2'5.041.'510 771 000(f) (f)
4. 44 199.,'57 , 2,9 874 10.764.167 29.8,1.'529 ,6,.787 66~77, 887 80 100 66 69i.787
Tankage involved in Producers' (Lease) Stocks not included.(a) Figures entered here should check those reported for East Coast on Form ~2; (b) should also be same as on Form 1/2; (c For this survey North Atlantic
fu2k: states are the portions of New York and Pennsylvania that are in the East Coast Refining District, New Jersey, Delaware, Maryland and District of Columbia;(d) South Atlantic are Virginia, North and South Carolina, Georgia and Florida. (e) Only a nortion of the State of Ohio is in the Indiana, Illinois, Kentuckyrefining district. (f) Includes 9,944,800 barrels of reservoir storage in California.
CLEAN PRODUCTS TANKAGE - Barrels
(Include only Gasoline, Kerosine and Distillate Fuel Oil and deal only with thetankage at the 10c.ations of inventories' you regularly report to the Bureau of Mines)
1. Canacitv of Tanka~e at Refineries - Form 6 liOO -'March ,1 1954 i9.i79 2<;4 1.'8s 000 ,7.,'50 2'54 644 000 '5, 2iO 087 2 2i2.'547 1'.924.i08 i6."7.680 7i'5.'5'52 ,8.'580.,,4 177 100 ,8 40, 2,4
2. Ca-pacity of Tanka~e alOM Pine Lines and on Tank Farms (if anv) - Form 6-1303 7,038,049 369,000 3,653,711 3,015,338 13,260,183 350.000 4.078,745 7.481.871 1.349. r,67 4.716.345 2.000 4,714,345
3. Capacity of Tanka~e at Bulk Terminals - Form 6-1302 89,606,945 25,301,020 41,061,817 23,244,108 31,839,363 4.834.287 10.8411 .880 10,538 696 5.621,500 13.807.235 9.112.·905 4,694,330
4. Total Clean Product Tankage Capacity - (1), (2) and (3) above 136,024,248 27,055,020 82,065,782 26,903,446 98,329.633 7,416.834 28.847.933 54,358.247 7.706.619 57,103,914 9.292,005 47,811,909
RESIDUAL FUEL OIL TANKAGE - Barrels
(Deal only with the tankage at the locations of inventories you regularly report to the Bureau of Mines)
1. Capacity of 'Tanka~e at Refineries - Form 6-1300 -,'March 31 1954 9,290,444 276,000 8,889,444 125,000 9,095,928 259,287 2,487,654 6,044,701 304,286 35,211 ,682 38,800 35,172,882
2. Canacitv of Tanka~e aion~ Pine Lines and on Tank Farms (if' anv) - Form 6-no, - - - - 172 000 - 172 000 10.789.750 10.78Q.7'50
3. Canacitv of Tanka~e at Bulk Terminals Form 6 1,02 8 474.,26 2 418 209 , 608417 2 447.700 162 490 '5'5 000 49 i90 <;8.100 - 4 i46 221 2.99i 8i8 l,i'52i8,
Total Residual Fuel Oil Tankage Capacity - (1), (2) and (3) above. 12;497,861(a) (a)
4. 17,764,770 2,694 ,209 2,572,700 9,430,418 314,287 2.537,044 6,274.801 304,286 50,347,653 3.032,638 47,315,015
(a) Includes 31,937,986 barrels of reservoir storage in California.
STEEL STORAGE CAPACITY DECEMBER 31. 1953 (ACTUAL) AND DECEMBER 31. 1954 (ESTIMATEb)
CRUDE OIL TANKAGE
(a) (a)1. Actual December 31, 1953 24.952,510 1,066,000 23.195 ~10 691,000 113,297,8'57 3,239.874 10 ,607 ,667 29.006. s29 443.787 65,517,887 80,100 65,437,787
Estimated December ,1 19'54 27009,'510 2'5 172.'510 nJ: 000 4i 8'51.757 , 244.744 10.9<;2.667 29 210 <;<;9(a) (a)
2. 1 066 000 h4i.787 67.72S.967 818 180 66.907.787(a) InCludes 9,944,800 barrels of reservoir storage in California.
CLEAN PRODUCTS TANKAGE
1. Actual December 31, 1953 134, 510,114 26,779,1911 81,433,787 26,297,133 95,448,038 7,256,049 27,476.473 53.008.897 7.706,619 58.071,914 9.292,005 48,779,909
2. Estimated December 31 1954 147,964,338 27,811,660 91,004,461 29,148,217 101,778,403 7,872,534 29,831,675 5'5.722.595 8~351,599 59.307.344 10,500,935 48,806,409;
RESIDUAL FUEL OIL TANKAGE
Actual December ,1 19'5, 17.96<;.<;70 2,<;78 S09 12.649.,61 2.7~7~700 9.,80 40~ ~e9 S87 2. iB6.9?9 6. i79 .601(b) (b)
1. 224.286 49 688 6,;, , 0,2 6,8 46 6s6 01S
Estimated December 31, 1954 19,624,050 2,652,209 14,168,141 2,803;700 6,233.801(c) , (c)
!2. 9,316,003 389,587 2,468,329 224,286 54,980,173 3,211,158 51,769,015i
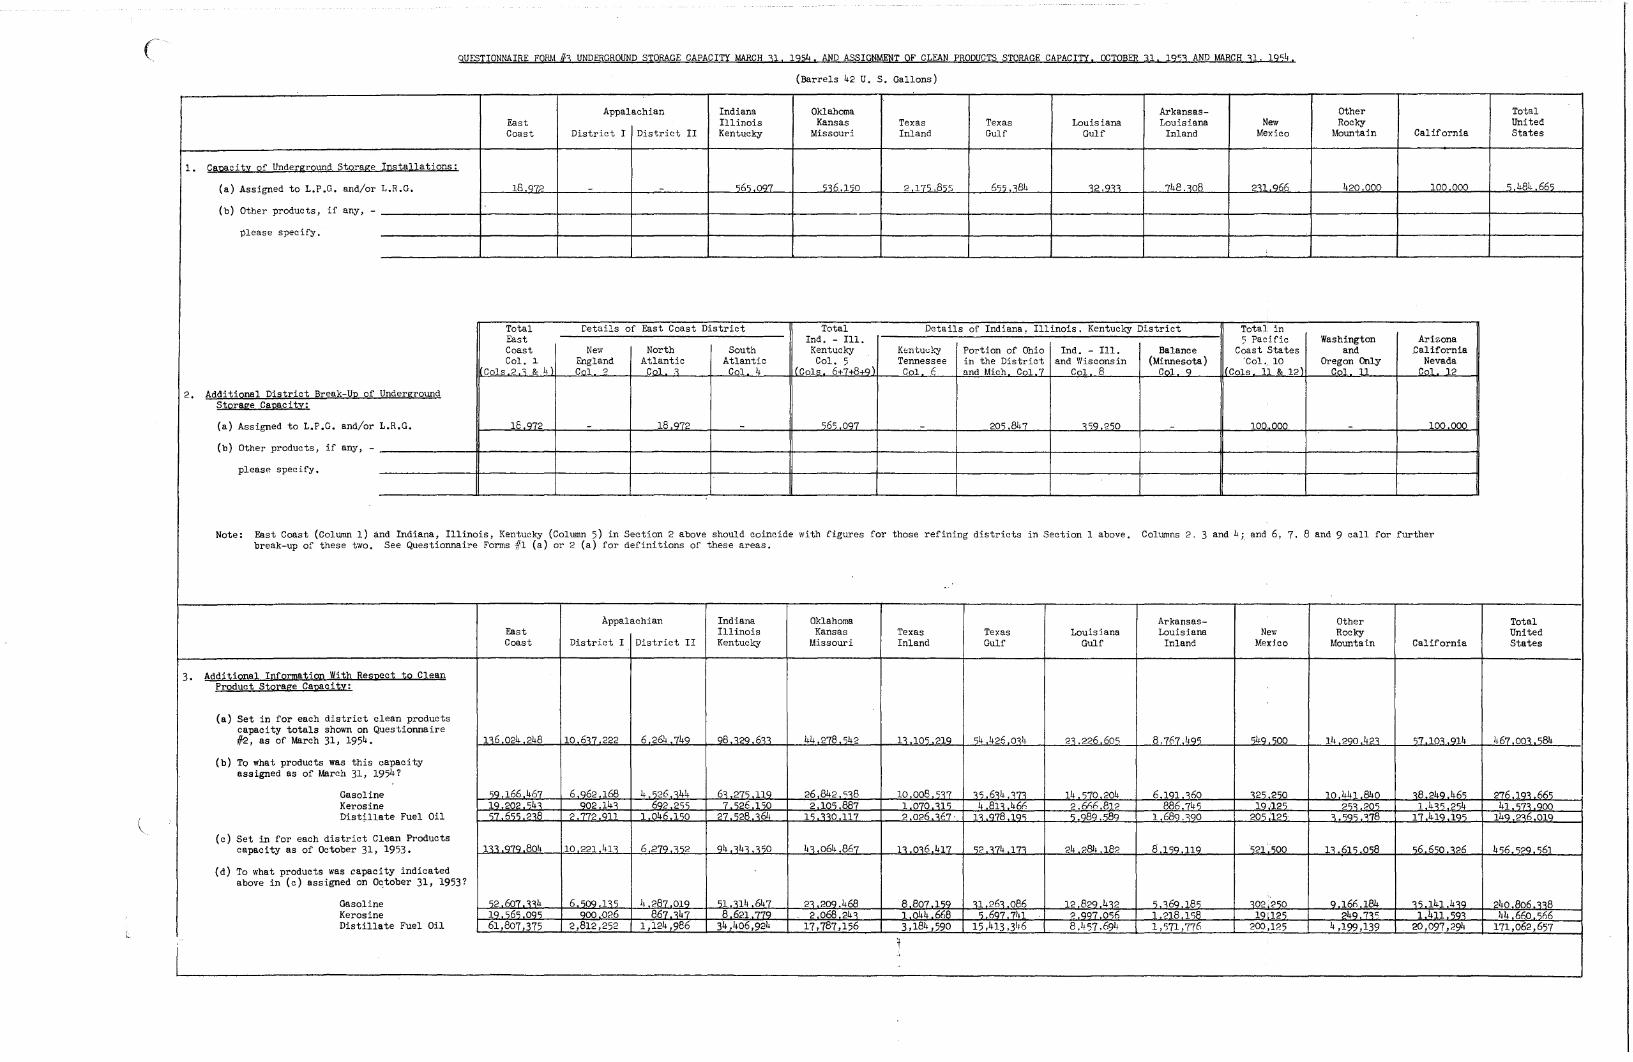
QUFSTIONNAIRE fORM /}3 UNDERGROUND STORAGE CAPACITY MARCH 31, 1954, AND ASSIGNMENT OF CLEAN PRODUCTS STORAG~ CAPACITY, OCTOBER 31, 19~3 AND MARCH 31, 19"~ ,
(Barrels ~2 U, S, Gallons)
Appalachian Indiana Oklahoma Arkansas- Other TotalEast Illinois Kansas Texas Texas Louisiana Louisiana New Rocky UnitedCoast District I District II Kentucky Missouri Inland Gulf Gulf Inland Mexico Mountain California States
1, Capacity of Underground Storage Installations:
(a) Assigned to L,P,G, and/or L,R,G, 18.97? - - s6s 097 5,6 1"0 2 17S .8"" 6S5. ,81, ,2.9" 748.'08 2"u.966 420.000 100 000 5 484 665
(b) Other products, if any, -
please specify.
Total retails of East Coast District Total Details of Indiana, Illinois. Kentucky District Total inEast Ind, - Ill, 5 Pad fic Washington ArizonaCoast New North South Kentucky Ksntu<.;rj Portion of Ohio Ind, - Ill. Balance Coast States and .CaliforniaCol. 1- England Atlantic Atlantic Col, 5 Tennessee in the District and Wisconsin (Minnesota) ·Col. 10 Oregon Only Nevada
Cols 2.; & 4 Col 2 Col , Col 4 (Cols 6+7+8+9) Col c and Mich CoL7 Col 8 Col 9 I(Cols 11 & 12) Cn] 11 Col 12
2, Additional District Break-Up of UndergroundStorage Capacity:
(a) Assigned to L,P,G, and/or L,R,G, 16.972 - 18.972 - s6" 097 20~ 8~7 ,~9 2~0 100. OM 100 000
(b) Other products, if any, -
please specify,
Note: East Coast (Column 1) and Indiana, Illinois, Kentucky (Column 5) in Section 2 above shOUld coincide with figures for those refining districts in Section 1 above, Columns 2. 3 and ~; and 6, 7, 8 and 9 call for furtherbreak-up of these two, See Questionnaire Forms #1 (a) or 2 (a) for definitions of these areas,
Appalachian Indiana Oklahoma Arkansas- Other TotalEast Illinois Kansas Texas Texas Louisiana Louisiana New Rocky UnitedCoast District I District II Kentucky Missouri Inland Gulf Gulf Inland Mexico Mountain California States
3, Additional Ipformation With Respect to CleanProduct Storage Capacity:
(a) Set in for each district clean productscapacity totals shown on Questionnaire
1,6 024 248 10 6'.\7222 6 264 ,749 98.'.\29 6ii 44 278, ~4? 1'.\ 10" 219 s4.426 0,4 2, 226 60S 8.76749S S49 .~OO 14 290 ~2, S7.10'.914 467.00i.s84#2, as of March 31, 1954 ,
(b) To what products was this capacityassigned as of March 31, 1954?
Gasoline S9 166 467 6.962 168 4.S26.'44 6; 27S 119 26 842 ",8 10 008 ",7 '.\5 6'.\4, '.\7'.\ 14.570 204 6 191, '.\60 ,2S 2S0 10 441 840 i8 249 46~ 276 19'.\ 665Kerosine 19202,54i 902 14'.\ 692 2~~ 7,~26 1"0 2 lOS 887 1.070. ,1 S ~ 81' 46(, 2.666812 886.74S 1912S 2S, 20S 1 4," 2s4 41.S7'.000Dist~l1ate Fuel Oil S7 6ss 2,8 2.772.911 1 046 ISO 27 .s28. ,61, IS. "0 117 2 026.'.\67' 1'.\.978.19S 5.989 ..589 1 689.,90 20~ 125 i '195.'.\78 17419 195 149 2,6.019
(c) Set in for each district Clean ProductsS21~SOOcapacity as of October 31, 1953, ni .070 804 10 221 41'.\ 6 .279. '.\~2 94.'.\4'.\,'.\~0 ~'.\ 064 867 l' oi6 417 S2.i74 17i 21, ?81, 182 8 ISO 119 Ii 61S os8 s6 6"0.i?6 456, ~29, 561
(d) To what products was capacity indicatedabove in (c) assigned on October 31, 1953?
Gasoline S2 607. <,4 6sOQ li~ I, 287 019 ~1.'.\1~ 647 2'.\ 209 468 8 8071~9 il 26, 086 12 8294i2 s.i69.18s ,0?'2S0 9 16f) 184 ,~ 141 4,9 240 806.ii8Kerosine 19. s6s 09S 900026 867.,47 8 621.779 2 068 24'.\ 1 044 668 5 697.71,1 2.9970s6 1.?18 ls8 19' 125 249.7'.\'; 1 411 ,59'.\ 44 660.sfi6Distillate Fuel Oil 61,807,375 2,812,252 1,124,986 34,406,92~ 17,787,156 3,184,590 15,413,3',6 8.457.694 1,571,776 200,125 4,199,139 20,097,29~ 171,062,657
I
:f
(
(
(
STATEMENT BY
L. S•. WESCOAT, CHAIRMAN OF THE COMMITTEEON PETROLEUM STORA.GE CAPACITY
AS PRESENTED ATMEETING OF THE NATIONAL PETROLEUM COUNCIL
HELD TN WASHINGTON, D.. C., OCTOBER 19, 1954
The current report of .the Committee on Petroleum Storage Capa,...
city is the fourth in a series which began in 1948.. Thesesu.rveys of
unavailable inventories and storage capacity for crude of1, clean
products as a group, and residual fuel Oil have been made at approxi-
mately two-year intervals. The current report was compiled after
recommendation t.o the Council 'by the Agenda Committee in connection
with a communication dated March 22nd last from Mr. H. A. Stewart,
then Acting Director of the Oil and Gas Division.. Department of the
Interior.
This survey bears out the basic findings of all the others
in that it again establishes the inherent need of the industry for
large storage capacity in relation to the amount of crude oil and
products moving into and out of such storage in order to convenientlY
and-economically supply the current and forward requirements of our
customers.
The March 1954 ratio indicates that 100 barrels of storage
is required for every 47 barrels of inventories contained therein,
if the industry is to enjoy complete flexibility at all times in
normal operation of its facilities" The 1952 ratio was 100 barrels
of storage to 45 barrels of inventories; the 1950 ratio also was 100
to 45" while in 1948 it was 100 to 41.. The 1954 crude oil ratio alone
is 100 to 46; clean products 100 to 50, while residual showed 100 to
Total storage capacity reported for crude oil, clean products
and·residual fuel was 991 million barrels, more than half of' which was
assigned to clean products--gasoline.." kerosine and distillate fuel oils,
By the end of this year an additional 29 million of capacity will have
been added to bring the December 31 total to 1 billion 20 million
barrels, an increase over March 31, 1948 of 160 million,.. Interesting
in connection with these figures is the fact that clean product stor
age by itself increased about 175 million barrels from March 31, 1948
to anticipated December 31, 1954, or 46 per cent. As might be expected,
( the majority of this increase (167 million) occured in Districts I
and IT, the large demand areas.
Another point confirmed by this survey as in the others, is
the large portion of total reported inventories that are unavailable
for shipment, in other words, that are wrapped up in the industry's
far-fIling manufacturing, storage and transportation systems, that must
be kept intact if' the industry is to function. On March 31 of this
year these unavailables totaled almost 273 million barrels or 50.7
per cent of the 538 million barrels that were reported as in crude oil,
clean product and residual inventories.
Included in these surveys for the first time this year is a
study of the underground storage capacity of the industry G. Each company
- 2 -
(
\was asked .to report the underground capacity (a) l1 assigned to L.P .G.
and/or L.. R.. G.JI and (b) "other products, if any''.. The only figures
reported were in connection with L •. P .. G. or L.R .. G.. The total for the
United states was apprOXimately 5 million 500 thousand barrels as of
March 31 last, almost half of which was found to be in the Texas
Inlandarea o Arkansas~Louisiana Inland accounted for almost 750
thousand barrels, with Texas GUlf, Indiana..,..Illinois":Kentucky and
Oklahoma-Kansas-Missouri areas all having sizeable amounts.
The Committee wishes to again point out to those not
familiar with oil industry operating problems that ~n no sense can
the difference between the inventories and capacities shown in the
survey be taken as an indication of available storage space. The
four surveys completed to date may again be said to have definitelY
cont1rmed What individual long term operating experience has indicated--
that relatively low ratios of actual inventories to total storage
capacity in service is essential if difficulties in processing,
handling and distribution are to be avoided, and if the industry is
to operate efficiently and well. The Committee therefore again stresses
as proof of the foregoing reflections the operation relationships once
more derived as a result of the current survey.. It should perhaps be
pointed out here, however, that some of the reported'crude oil stor ...
age capacity is in areas where it is not currently available for use,
and some of it, even so, not susceptible to relocation elsewhere be-
cause of its condition. Still other portions are available only for
limited use.
- 3 --
(
(
, ,
None of the figures in this report include stocks or
storage capacity, if any, in the hands of the military.
A total of about 350 questionnaires were distributed to \
refiners and other holders of crude oil and principal product in
ventories and storage facilities. Based on the inventories reported
in comparison with those previously developed by the Bureau of Mines,
the crude oil section of this survey represents 96,.4 per cent of the
refinery, pipeline and tank farm stocks of crude, and the crude oil
in transit; about 97 per cent of the clean products group, and 96.5
per cent of the residual fuel oil inventories as reported last March 31 ..
Your Conrrnittee appreciates this extremely gratifying response
and takes this opportunity to thank the industry for it and for so
promptly returning the information requested. Attached to the report
in consolidated form are reproductions of all of the questionnaire
forms used in the survey, shOWing all of the details of the inventory
and storage capacity figures and amounts unavailable for shipment.,
for each of the Bureau of Mines refining districts with added separa
tions for the East Coast, Indiana-Illinois-Kentucky and the Pacific
Coast areas.