Embed Size (px)
DESCRIPTION
Igneous and metamorphic rocks - Classification IUGS
Citation preview

1
1/17/02 Petrology-Spring 2002, Goeke 1
Classification and Nomenclature
Chapter 2
1/17/02 Petrology-Spring 2002, Goeke 2
IUGS System• In the 60’s and 70’s the International Union of Geological
Sciences (IUGS) developed a system to standardizeigneous rock classification
• IUGS chose to classify igneous rocks based on plotting therock on a ternary diagram– Values must be normalized so that the total equals 100
(e.g. X = 4.5, Y = 2, Z = 6.3; to normalize the value, wemultiply each number by 100/(4.5+2+6.3) and get X =35.16%, Y = 15.63%, Z = 49.22%)
– There are two methods to determine the location of agiven rock on the ternary diagram: the “traditional”method and an “IUGS” method

2
1/17/02 Petrology-Spring 2002, Goeke 3
“Traditional” Method
Figure 2-1a.Method #1 forplotting a pointwith thecomponents: 70%X, 20% Y, and 10%Z on triangulardiagrams. AnIntroduction toIgneous andMetamorphicPetrology, JohnWinter, PrenticeHall.
1/17/02 Petrology-Spring 2002, Goeke 4
“IUGS” Method• Since the IUGS
diagrams do nothave gridlines, it ishard to use the“traditional”method
• Take the100Y/(Y+Z) tofind the base %[e.g. for Y = 20%and Z = 10%,100*20/(20+10) =67%]
Figure 2-1b. Method #2 for plotting a point with thecomponents: 70% X, 20% Y, and 10% Z on triangulardiagrams. An Introduction to Igneous and MetamorphicPetrology, John Winter, Prentice Hall.

3
1/17/02 Petrology-Spring 2002, Goeke 5
• Any point betweenthis point on the Z-Y base and the X-apex of thediagram, will havethe same Y/Z ratio
• Where the X% lineintersects the Y/Zratio line, that isthe composition ofthe rock
• Note that the twomethods producethe same results
Figure 2-1b. Method #2 for plotting a point with the components:70% X, 20% Y, and 10% Z on triangular diagrams. AnIntroduction to Igneous and Metamorphic Petrology, John Winter,Prentice Hall.
1/17/02 Petrology-Spring 2002, Goeke 6
• To classify a rock via the IUGS system, the followingsteps must be taken:
• Determine the mode (% of each mineral present based onvolume)– Estimated on the cumulative area of each mineral in
either hand sample or in thin section– Point counts are a more precise method of determining
mode, but are time-intensive– We assume that area will correlate directly to volume
• Normalize totals to 100%• From the mode, determine the following:
– Q’ = % quartz– P’ = % plagioclase (An5-An100)– A’ = % alkali feldspar– F’ = total % feldspathoids

4
1/17/02 Petrology-Spring 2002, Goeke 7
– M’ = total % mafics and accessories• Most igneous rocks found at the Earth’s surface will
have at least 10% Q’+A’+P’ or F’+A’+P’• Quartz and feldspathoids are not stable with one
another (we’ll deal with why in chapters 5-7), so theywill never occur in equilibrium with one another
• If the rock meets this 10% minimum, ignore M andnormalize the remaining three components to 100%
• Determine if the rock is phaneritic or aphanitic andchoose the appropriate diagram
• Plot the rock in the appropriate field• A few issues for phaneritic rocks:
– Rocks that plot near P cannot be distinguished fromone another based on QAPF ratios
1/17/02 Petrology-Spring 2002, Goeke 8
• Anorthosites = greater 90% plagioclase in the un-normalized mode
• Diorite and gabbro are distinguished by mode of mafics(>35% = gabbro) in hand sample, or by plagioclasecomposition (>An50 = gabbro) in thin section
– Replace the “foid” term with the appropriate feldspathoidname in the APF triangle
– It is acceptable to add a mineralogical, chemical, or texturaladjective to the beginning of an IUGS classification
• E.g. leuco-granite, mela-granite, pegmatitic orthoclasegranite
• If you use more than one mineral to describe a rock, theminerals are listed in increasing modal concentration
– E.g. a “muscovite biotite granite” would have morebiotite then muscovite

5
1/17/02 Petrology-Spring 2002, Goeke 9
Classification ofPhaneritic
Igneous Rocks
Figure 2-2. A classification of the phaneritic igneousrocks. a. Phaneritic rocks with more than 10% (quartz +feldspar + feldspathoids). After IUGS.
The rock must contain a total ofat least 10% of the minerals below.Renormalize to 100%
(a)
Quartz-richGranitoid
9090
6060
2020Alkali Fs.Quartz Syenite Quartz
SyeniteQuartz
MonzoniteQuartz
Monzodiorite
Syenite Monzonite Monzodiorite(Foid)-bearing
Syenite
5
10 35 65
(Foid)-bearingMonzonite
(Foid)-bearingMonzodiorite
90
Alkali Fs.Syenite
(Foid)-bearingAlkali Fs. Syenite
10
(Foid)Monzosyenite
(Foid) Syenite
(Foid)Monzodiorite
(Foi
d) G
abbr
o
Qtz. Diorite/Qtz. Gabbro
5
10
Diorite/Gabbro/Anorthosite
(Foid)-bearingDiorite/Gabbro
60
(Foid)olites
Quartzolite
Granite Grano-diorite
Tonalite
Alkali
Felds
par G
ranite
Q
A P
F
60
1/17/02 Petrology-Spring 2002, Goeke 10
• A few notes for aphanitic rocks:– It is difficult, even in thin section, to determine the
representative mineralogical mode• Vitreous or amporphous material may constitute a large
portion of the rock• When the matrix is impossible to determine a mode from,
the mode must be based on the phenocrysts—rocksdetermined this way are called phenotypes and have theprefix “pheno-” added to the name (e.g. pheno-dacite)
– Based on phenotypes, the rock is biased toward theearly-forming phases and is not correct for the rock as awhole
• A better way to classify volcanic rocks is based on achemical analysis of the rock
– The IUGS suggests a diagram that plots the alkalis vssilica

6
1/17/02 Petrology-Spring 2002, Goeke 11
» Normalize the chemical analysis to 100% ona non-volatile basis, add Na2O and K2O andplot against SiO2
– Rocks that plot near P are also problematic foraphanitic igneous samples
• IUGS suggests that the distinction between andesiteand basalt be based on either the color index orsilica content
– There are also several other types of important rocksnot included on the IUGS diagrams discussed so far
• E.g. hypabyssal (shallow intrusive), carbonatites,lamproites, etc.
1/17/02 Petrology-Spring 2002, Goeke 12
Figure 2-3. A classification and nomenclatureof volcanic rocks. After IUGS.
(foid)-bearing Trachyte
(foid)-bearing Latite
(foid)-bearing Andesite/Basalt
(Foid)ites
10
60 60
35 65
10
20 20
60 60
F
A P
Q
Rhyolite Dacite
Trachyte Latite Andesite/Basalt
Phonolite Tephrite
Classification ofAphanitic Igneous
Rocks
7
1/17/02 Petrology-Spring 2002, Goeke 13
Classification of Igneous Rocks
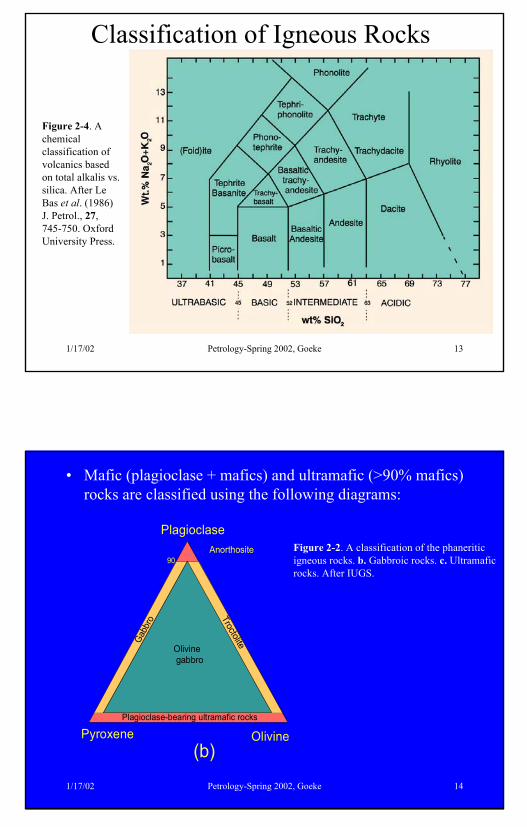
Figure 2-4. Achemicalclassification ofvolcanics basedon total alkalis vs.silica. After LeBas et al. (1986)J. Petrol., 27,745-750. OxfordUniversity Press.
1/17/02 Petrology-Spring 2002, Goeke 14
• Mafic (plagioclase + mafics) and ultramafic (>90% mafics)rocks are classified using the following diagrams:
Figure 2-2. A classification of the phaneriticigneous rocks. b. Gabbroic rocks. c. Ultramaficrocks. After IUGS.
Plagioclase
OlivinePyroxene
Gabb
ro
Troctolite
Olivine gabbro
Plagioclase-bearing ultramafic rocks
90
(b)
Anorthosite

8
1/17/02 Petrology-Spring 2002, Goeke 15
OlivineOlivine
ClinopyroxeneClinopyroxeneOrthopyroxeneOrthopyroxene
LherzoliteLherzolite
Harz
burg
ite
Wehrlite
Websterite
OrthopyroxeniteOrthopyroxenite
ClinopyroxeniteClinopyroxenite
Olivine Websterite
PeridotitesPeridotites
PyroxenitesPyroxenites
90
40
10
10
DuniteDunite
(c)
Figure 2-2. A classification of the phaneriticigneous rocks. b. Gabbroic rocks. c. Ultramaficrocks. After IUGS.
1/17/02 Petrology-Spring 2002, Goeke 16
Pyroclastic Rocks• These rocks could be classified like volcanics if the
chemical composition is available, but since theycommonly have a high number of foreign material withinthem, this is not normally attempted
• Most pyroclastics are classified based on the type ofpyroclasts or on the size of the fragments
• If the type of fragments is used, the volume percent of:glass, rock fragments, and crystal fragments is derived andplotted on a ternary diagram
• If size is the classification basis, then the volume percentof ash (<2 mm), lapilli (2-64 mm), and blocks & bombs(>64 mm) is calculated and plotted on a ternary diagram

9
1/17/02 Petrology-Spring 2002, Goeke 17
Figure 2-5. Classification of the pyroclastic rocks. a. Based on type of material. After Pettijohn(1975) Sedimentary Rocks, Harper & Row, and Schmid (1981) Geology, 9, 40-43. b. Based on thesize of the material. After Fisher (1966) Earth Sci. Rev., 1, 287-298.

1
1/22/02 Petrology-Spring 2002, Goeke 1
Igneous Rock Textures
Chapter 3
1/22/02 Petrology-Spring 2002, Goeke 2
• We use the textures of a rock to determine not only howthe rock was formed (primary), but also how the rock wasaltered (secondary)
• Texture tends to be described in thin section, but we canalso observe some of the structures in hand sample andsome on a smaller scale with the SEM or microprobe (orthe ridiculously small scale with the TEM)
• There is a list of some of the common igneous texturalterms at the end of chapter 3 in Winter—some of the termswill also be used for metamorphic and sedimentary rocks

2
1/22/02 Petrology-Spring 2002, Goeke 3
Primary Textures• For crystals to form and grow, three processes must
occur:• Nucleation
• Very small crystals have a high ratio of surface areato volume and are highly susceptible to re-absorption
• Though the melt might be at the appropriatetemperature (saturation temperature) for crystalgrowth, until the crystals can reach a critical size and“survive”, crystallization can not occur
• The critical size can be called either an “embryoniccluster” or a “crystal nucleus”
• Usually the melt must be either supersaturated orundercooled (temperature lower then saturationtemperature) for the nucleation to occur
1/22/02 Petrology-Spring 2002, Goeke 4
• The other option is for the mineral to crystallize on apre-existing surface: either a “seed crystal” or on adifferent mineral (e.g. pyroxene rims on olivine)
• Crystals with simpler structures (e.g. oxides,nesosilicates) tend to nucleate more easily then morecomplicated minerals (e.g. tectosilicates)
• Crystal growth• Ions will add onto the existing crystal to produce
crystal growth• Simple, high symmetry crystals will have prominent
faces• Amphiboles and pyroxenes tend to add more
lengthwise then widthwise to follow the silica chains;micas form in sheets
• Defects may increase the growth of a crystal, willimpurities tend to inhibit the addition of ions

3
1/22/02 Petrology-Spring 2002, Goeke 5
• Low-energy faces are more stable then high-energyfaces, and so they dominate
• Diffusion• A crystal tends to be a different composition then the
melt surrounding it• As the crystal grows, it depletes the surrounding area
of the cations & anions the mineral incorporateswithin it—for the crystal to continue growing, therequired ions must be able to diffuse across thedeplete magma zone
• When crystals form, they also release heat in the formof the “latent heat of crystallization”—if the heatcannot diffuse away from the mineral, thetemperature will rise to a great enough degree thatcrystallization cannot continue
1/22/02 Petrology-Spring 2002, Goeke 6
Rates• The rates of the nucleation, crystal growth and diffusion all
play a role in the final texture of the rock– The slowest process will define how quickly
crystallization can occur– We also need to consider cooling rate of the magma
• Slow cooling will allow equilibrium to bemaintained
• Quick cooling will cause disequilibrium asundercooling occurs—nucleation, growth, anddiffusion won’t be able to keep up
• The cooling rate can determine how fast the otherthree rates move

4
1/22/02 Petrology-Spring 2002, Goeke 7
• Undercooling causes therate of nucleation andgrowth to increase at first
• As undercoolingcontinues, however, therates drop off as theviscosity increases andthe kinetic energydecreases
• The growth maximum isat a higher temperaturethen the nucleation max,since it is easier to diffusethrough the melt and addonto an exisiting crystalthen to nucleate a newcrystal nearby
1/22/02 Petrology-Spring 2002, Goeke 8
• Examples: a melt thatcools & remains at– Ta would produce
few crystals that arevery large
– Tb would have manysmall crystals
– Tc is too low foreither nucleation orcrystallization andthe rock wouldsolidify as glass withlittle to no crystals

5
1/22/02 Petrology-Spring 2002, Goeke 9
• Rocks that cool at two different temperatures are also possible(e.g. a rock that cooled at Ta to produce large crystals, but wasthen further cooled to Tb to crystallize the rest of the melt)– Porphyritic rocks are classified as volcanic or plutonic
based on the matrix– Vitrophyric = phenocrysts set in a glassy groundmass– Poikilitic = large crystal contains inclusions of other small
crystals• Growth rate depends on diffusion rates to a large extent, since
it is hard to crystallize a mineral if the correct components arenot available– Diffusion is easier in low-viscosity melts (i.e. those with
high temperature, high H2O-content, low SiO2-content)– Small ions with low charges also diffuse more readily then
large polymerized complexes
1/22/02 Petrology-Spring 2002, Goeke 10
• Different minerals crystallize at different rates and will alsobe undercooled at different temperatures– The situation of one mineral being at Ta while another is
at Tb could also cause a porphyritic texture—while therocks remains at one temperature!
– Loss of a H2O-rich fluid phase will quickly raise thecrystallization temperature and can also cause aporphyritic texture
• Crystal shape will depend to some extent on what is thelimiting factor:– If diffusion is not the slowest rate, euhedral crystals will
form– If diffusion is slower then growth, dendritic crystals form– Spinifex texture is found in quickly cooled ultramafics
where the olivine crystals grew rapidly in a low-viscositymelt

6
1/22/02 Petrology-Spring 2002, Goeke 11
•Figure 3-2. Backscattered electron image ofquenched “blue glassy pahoehoe,” 1996Kalapana flow, Hawaii. Black minerals arefelsic plagioclase and gray ones are mafics.a. Large embayed olivine phenocryst withsmaller plagioclase laths and clusters offeathery augite nucleating on plagioclase.Magnification ca. 400X. b. ca. 2000Xmagnification of feathery quenched augitecrystals nucleating on plagioclase (black) andgrowing in a dendritic form outward. Augitenucleates on plagioclase rather than pre-existing augite phenocrysts, perhaps due tolocal enrichment in mafic components asplagioclase depletes the adjacent liquid in Ca,Al, and Si. © John Winter and Prentice Hall.
Dendritic Texture
1/22/02 Petrology-Spring 2002, Goeke 12
– Since crystal corners and edges have a larger volume ofliquid to use, they tend to grow faster forming skeletalcrystals
– In plagiocalse, the corners tend to grow straighter andform swallow-tailed shapes
•Figure 3-3. a. Volume of liquid(green) available to an edge orcorner of a crystal is greater thanfor a side. b. Volume of liquidavailable to the narrow end of aslender crystal is even greater.After Shelley (1993). Igneousand Metamorphic Rocks Underthe Microscope. © Chapmanand Hall. London.
baa b

7
1/22/02 Petrology-Spring 2002, Goeke 13
•Figure 3-4. a. Skeletal olivine phenocryst with rapid growth at edges enveloping meltat ends. Taupo, N.Z. b. “Swallow-tail” plagioclase in trachyte, Remarkable Dike, N.Z.Length of both fields ca. 0.2 mm. From Shelley (1993). Igneous and MetamorphicRocks Under the Microscope. © Chapman and Hall. London.
Skeletal and Swallow-Tailed Crystals
1/22/02 Petrology-Spring 2002, Goeke 14
Nucleation at Preferred Sites• Epitaxis is the process by which one mineral crystallizes
on another mineral—easier then nucleating its own seedcrystals– The two minerals must have similar crystal structures– E.g. sillimanite on biotite or muscovite rather then
directly replacing kyanite– Rapakivi describes the specific growth of albitic
plagioclase on orthoclase• The following two textures are thought to form during
devitrification of glass, which we’ll deal with in secondarystructures– Spherulitic texture consists of needles of quartz and
alkali feldspars that radiate out from a common center;found in silicic volcanics

8
1/22/02 Petrology-Spring 2002, Goeke 15
– Variolitic deals with needles of only plagioclaseradiating outwards found in basalt
• Minerals can also nucleate on the walls of dikes– Comb structure is formed by elongate quartz growth
with the c-axes perpendicular to the wall– Crescummulate is similar to a comb structure, but it
describes the parallel growth of a non-equilibriumassemblage of olivines, pyroxenes, feldspars, or quartz
• Found in layered mafic plutons (can be in multiplelayers) and on the edges of granites
• Minerals can be up to several centimeters long
Dike wall
C-axis
1/22/02 Petrology-Spring 2002, Goeke 16
Compositional Zoning
• Zoning occurs when a mineral changes composition as itgrows; this normally occurs due to a change in P, T, oravailable cations in the system
• Zoning is easiest to observe using either the SEM or theelectron microprobe, but we can also observe zoning inthin section based on pleochroism, extinction angles, andbirefringence
• Plagioclase is the example constantly used in igneousrocks, since the extinction angle is highly dependent onAn-content

9
1/22/02 Petrology-Spring 2002, Goeke 17
•Figure 3-5. a. Compositionally zoned hornblende phenocryst with pronounced colorvariation visible in plane-polarized light. Field width 1 mm. b. Zoned plagioclasetwinned on the carlsbad law. Andesite, Crater Lake, OR. Field width 0.3 mm. © JohnWinter and Prentice Hall.
1/22/02 Petrology-Spring 2002, Goeke 18
• In a perfect equilibrium world, zoning would never occur,since the change in the composition of the melt would alsodiffuse through the crystal to make it homogeneous—howeverin reality, diffusion through a crystal tends to be slow and thecrystal is not in equilibrium with the surrounding melt– diffusion rate depends on mineral, e.g. plagioclase requires
Si-Al exchange and since Al doesn’t diffuse readily,equilibrium is not attained
• There are several types of zoning possible:– Normal zoning forms cores stable at higher temperature
and rims stable at lower temperatures– Reverse zoning has lower temperature cores surrounded by
higher temperature rims (usually found in metamorphicrocks)
– Oscillatory zoning is considered igneous and reflectchanges in the magma composition

10
1/22/02 Petrology-Spring 2002, Goeke 19
•Figure 3-6. Examplesof plagioclase zoningprofiles determined bymicroprobe pointtraverses. a.Repeated sharpreversals attributed tomagma mixing,followed by normalcooling increments. b.Smaller and irregularoscillations caused bylocal disequilibriumcrystallization. c.Complex oscillationsdue to combinations ofmagma mixing andlocal disequilibrium.From Shelley (1993).Igneous andMetamorphic RocksUnder the Microscope.© Chapman and Hall.London.
1/22/02 Petrology-Spring 2002, Goeke 20
• Image takenwith electronmicroprobe ofzoned allanite
• Oscillatoryzoning marksthe cores oftheallanite—surmised to beigenous
• Metamorphicrims are thelighter color
epidote

11
1/22/02 Petrology-Spring 2002, Goeke 21
1/22/02 Petrology-Spring 2002, Goeke 22
Crystallization Sequence• The first crystals to form from a melt that hasn’t been
severely undercooled will be euhedral in shape• As more crystals form, space will be limited and the
crystals will be subhedral progressing to anhedral in shape• The last minerals (the anhedral ones) will be interstitial,
filling in the space between the early-formed minerals• Some zoned minerals will have euhedral cores and
anhedral rims• This principal of shape, however, doesn’t always hold true:
it really depends on the surface energy of the crystal face– Minerals with low silica polymerization are more likely
to be euhedral• Geologists also use crystal size to determine the sequence,
but as we’ve already seen, that’s also not always reliable
12
1/22/02 Petrology-Spring 2002, Goeke 23
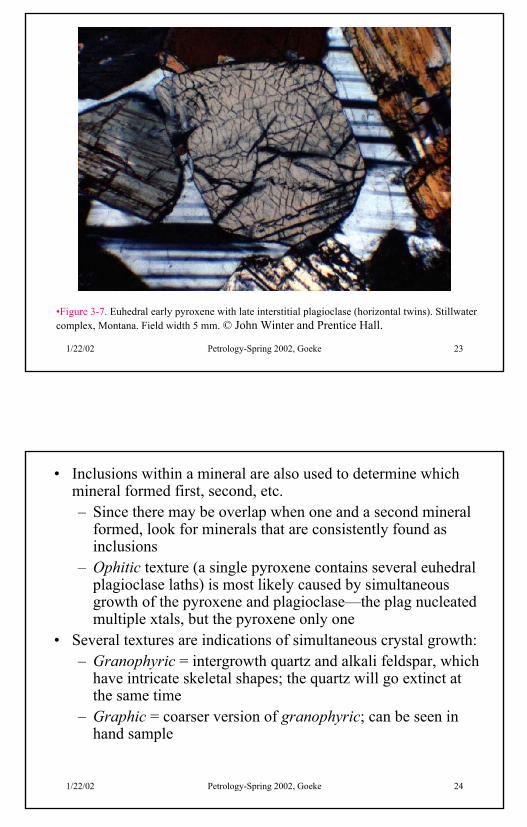
•Figure 3-7. Euhedral early pyroxene with late interstitial plagioclase (horizontal twins). Stillwatercomplex, Montana. Field width 5 mm. © John Winter and Prentice Hall.
1/22/02 Petrology-Spring 2002, Goeke 24
• Inclusions within a mineral are also used to determine whichmineral formed first, second, etc.– Since there may be overlap when one and a second mineral
formed, look for minerals that are consistently found asinclusions
– Ophitic texture (a single pyroxene contains several euhedralplagioclase laths) is most likely caused by simultaneousgrowth of the pyroxene and plagioclase—the plag nucleatedmultiple xtals, but the pyroxene only one
• Several textures are indications of simultaneous crystal growth:– Granophyric = intergrowth quartz and alkali feldspar, which
have intricate skeletal shapes; the quartz will go extinct atthe same time
– Graphic = coarser version of granophyric; can be seen inhand sample

13
1/22/02 Petrology-Spring 2002, Goeke 25
•Figure 3-8. Ophitic texture. A single pyroxene envelops several well-developedplagioclase laths. Width 1 mm. Skaergård intrusion, E. Greenland. © John Winter andPrentice Hall.
1/22/02 Petrology-Spring 2002, Goeke 26
•Figure 3-9. a. Granophyric quartz-alkali feldspar intergrowth at the margin of a 1-cmdike. Golden Horn granite, WA. Width 1mm. b. Graphic texture: a single crystal ofcuneiform quartz (darker) intergrown with alkali feldspar (lighter). Laramie Range, WY.© John Winter and Prentice Hall.

14
1/22/02 Petrology-Spring 2002, Goeke 27
Magmatic Reaction and Resorption
• Crystals can react with the melt to produce differentminerals as the melt is cooled– E.g. olivine reacts with the melt to form pyroxene– May occur due to a drop in pressure, magma mixing, or
devolatilization• Resorption = dissolution of a mineral back into the melt or
solution• Sieve texture = deep and irregular embayments caused
either by advanced resorption or rapid growth envelopingmelt due to undercooling
1/22/02 Petrology-Spring 2002, Goeke 28
•Figure 3-10. Olivine mantled by orthopyroxene in (a) plane-polarized light and (b)crossed nicols, in which olivine is extinct and the pyroxenes stand out clearly. Basalticandesite, Mt. McLaughlin, Oregon. Width ~ 5 mm. © John Winter and Prentice Hall.
a
b

15
1/22/02 Petrology-Spring 2002, Goeke 29
•Figure 3-11. c.Hornblendephenocrystdehydrating toFe-oxides pluspyroxene due topressure releaseupon eruption,andesite. CraterLake, OR. Width1 mm. © JohnWinter andPrentice Hall.
1/22/02 Petrology-Spring 2002, Goeke 30
•Figure 3-11. a.Sieve texture in acumulophyriccluster ofplagioclasephenocrysts.Note the laternon-sieve rim onthe cluster.Andesite, Mt.McLoughlin, OR.Width 1 mm. ©John Winter andPrentice Hall.

16
1/22/02 Petrology-Spring 2002, Goeke 31
•Figure 3-11. b.Resorbed andembayed olivinephenocryst. Width0.3 mm. © JohnWinter and PrenticeHall.
1/22/02 Petrology-Spring 2002, Goeke 32
Differential Movement• Flow within a melt can also cause several textures that we
consider traditionally metmorphic in nature– E.g. foliation or lineation
• Trachitic = lath-shaped microlites in a volcanic rock arestrongly aligned normally flowing around the phenocrysts
• Pilotaxitic or felty = lath-shaped microlites that are random• Flow banding = alternating layers of differing composition
caused by the mingling of two magmatic fluids• Synneusis = phenocrysts that stick to one another due to
surface tension; maybe a reason why growth twins form• Cummulophyric = texture resultant from synneusis• Glomeroporphyritic = texture resultant from synneusis of
only one type of mineral

17
1/22/02 Petrology-Spring 2002, Goeke 33
•Figure 3-12. a. Trachytic texture in whichmicrophenocrysts of plagioclase are aligneddue to flow. Note flow around phenocryst(P). Trachyte, Germany. Width 1 mm.From MacKenzie et al. (1982). © JohnWinter and Prentice Hall.
Figure 3-12. b. Felty or pilotaxitic texturein which the microphenocrysts arerandomly oriented. Basaltic andesite, Mt.McLaughlin, OR. Width 7 mm. © JohnWinter and Prentice Hall.
1/22/02 Petrology-Spring 2002, Goeke 34
•Figure 3-13. Flow banding inandesite. Mt. Rainier, WA. © JohnWinter and Prentice Hall.

18
1/22/02 Petrology-Spring 2002, Goeke 35
http://geology.csupomona.edu/drjessey/class/GSC425/Ig-Met1.html
Glomerophophyritic texture: the plagioclase have been clusteredtogether in this thin section drawing
1/22/02 Petrology-Spring 2002, Goeke 36
Cumulate Textures• In a cumulate, the minerals collect together so that they are in
contact with one another with the melt in the interstitial space (a)• Orthocumulate = liquid crystallized in place (isolated from magma
chamber); forms rims on original mineral (white) plus otherminerals (purple, green, yellow hatched) compositionally derivedfrom the isolated melt (b)
After Wager and Brown (1967), Layered Igneous Rocks. © Freeman. San Francisco.

19
1/22/02 Petrology-Spring 2002, Goeke 37
• Adcumulate = interstitial liquid was in active exchange with themagma chamber and the original minerals (white) continue to grow;a few other minerals may be trapped in the final open spaces (pink),but the majority will be one mineral type (c)
• Heteradcumulate = liquid crystallizes to form rims to the 1st mineral(white) plus other large minerals (red and yellow hatched) that onlynucleate one or two grains and become poikilitic; requires exchangebetween the interstitial melt and the magma chamber (d)
After Wager and Brown (1967), Layered Igneous Rocks. © Freeman. San Francisco.
1/22/02 Petrology-Spring 2002, Goeke 38
PrimaryTwinning
• Twin = intergrowth of two or moreorientations of the same mineral witha specific crystallographic relationshipbetween them (e.g. mirror plane,rotational axis)
• Primary twins = growth twins• Feldspars are commonly twinned
either by:– Albite twins = parallel stripes of
plagioclase that go extinct atdifferent angles
– Carlsbad twins = one half of thecrystal goes extinct at a differentangle then the other half
– You can have a crystal with bothtypes
http://www.geosci.unc.edu/Petunia/IgMetAtlas/minerals/plagtwins.X.html

20
1/22/02 Petrology-Spring 2002, Goeke 39
Volcanic Textures• Microlites = groundmass crystals that are birefringent• Crystallites = groundmass crystals too small to be
birefringent• For basalts:
– Ophitic texture grades into sub-ophitic (pyroxenessmaller, but still envelop plag) to finally intergranular
– Intergranular = equal sized plag and pyroxene withlittle to no glass
– Intersertal = a significant portion of the rock isinterstitial glass or altered glass material
– Hyalo-ophitic = the glass surrounds the microlites µphenocrysts
– Hyalophilitic = glass is the dominant phase
1/22/02 Petrology-Spring 2002, Goeke 40
• In silicic flows (rhyolite & dacite), a holohyaline (glassy)texture is more common
• Obsidian = rock containing > 80% glass; some authorslimit this term to silicic-glasses– Tachylite or basaltic glass = terms used for more
basaltic rocks with > 80% glass• Vesicles = voids left in the volcanics after bubbles of gas
escape; usually sub-spherical in shape• Basalt can grade from vesicular basalt to scoria
(increasing vesicle percentage)• Amygdules = vesicule filled by a later-forming mineral (e.g.
zeolite, carbonate, opal)• Pumice = light & frothy rock that can float on water;
usually light grey in color

21
1/22/02 Petrology-Spring 2002, Goeke 41
http://www.geosci.unc.edu/Petunia/IgMetAtlas/volcanic-micro/amygdule.X.html
The oval feature in this photomicro-graph is an amygdule: a formerly openvesicle which has been filled with asecondary mineral(s) precipitated fromlow-T ground waters which havepenetrated into the rock. In this case,the amygdule is probably filled with azeolite mineral.
http://www.geosci.unc.edu/Petunia/IgMetAtlas/volcanic-micro/vesicles.X.html
The black, ovals features in thisscoriaceous basalt are vesicles. Notethe acicular, white plagioclase lathsthroughout and the euhedral, whiteolivine phenocryst at the lower right.
1/22/02 Petrology-Spring 2002, Goeke 42
Pyroclastic Textures• Pyroclastic material usually consists of pulverized rock,
rock fragments, mineral fragments, and glassy material• The intersitial glass originally crystallized between the
vesicles in the pumice, but during the eruption, the vesiclesare destroyed leaving behind cuspate- or spicule-shapedthree-point glass shards
• Eutaxitic = textural description of structures caused bybending, compression, and deformation within apyroclastic deposit
• Fiamme = piece of pumice that has had all of the gasbubbles squeezed out of it and has become the black colorof obsidian

22
1/22/02 Petrology-Spring 2002, Goeke 43
•Figure 3-16. a. The interstitial liquid (red)between bubbles in pumice (left) become3-pointed-star-shaped glass shards in ashcontaining pulverized pumice. If they aresufficiently warm (when pulverized or afteraccumulation of the ash) the shards maydeform and fold to contorted shapes, asseen on the right and b. in thephotomicrograph of the Rattlesnakeignimbrite, SE Oregon. Width 1 mm. ©John Winter.
a
b
1/22/02 Petrology-Spring 2002, Goeke 44
• In less viscous lavas (e.g. Hawaiian basaltic lavas) finesprays are caused by bubbles bursting and can form eitherPele’s tears (glassy pellets) or Pele’s hair (delicate glassthreads)
http://volcanoes.usgs.gov/Products/Pglossary/PeleTears.html http://volcanoes.usgs.gov/Products/Pglossary/PeleHair.html

23
1/22/02 Petrology-Spring 2002, Goeke 45
• Accretionary lapilli = spheroidal balls of several layers ofash around a nucleus; forms in very moist air
• Pisolitic tuffs = consolidated deposit of accretionary lapilli
http://volcanoes.usgs.gov/Products/Pglossary/lapilli.html
1/22/02 Petrology-Spring 2002, Goeke 46
Secondary Textures• Secondary textures occur after the melt has completely
solidified, so they are technically metamorphic in nature• Even after the pluton has solidified, it is at a fairly high
temperature and pressure (equivalent to high P&T meta)for an extended period of time
• Autometamorphism = solid-state processes that occur dueto the igneous heat of a pluton (occur while the pluton iscooling); does not include diagenetic and weatheringprocesses
• Ostwald ripening = process of annealing of crystals in astatic environment– Small crystals with convex outward curvature (e.g. a
round grain) are not as stable as grains with straightboundaries that meet at ~120°

24
1/22/02 Petrology-Spring 2002, Goeke 47
© John Winter and Prentice Hall
– The small grains willbe eliminated in favorof a uniform coarse-grained equilibriumtexture; this works bestin a monominerallicrock, which igneousrocks rarely are—itwill, however, cause amore uniform grainsize distribution
1/22/02 Petrology-Spring 2002, Goeke 48
Polymorphic Transformation• Displacive transformation = shifting of atomic positions
and bending of bond angles (e.g. high-quartz to low-quartz)
• Reconstructive transformations = breaking and re-formingof bonds (e.g. graphite to diamond)
• Pseudomorph = one mineral replaces another, however thedistinctive shape of the first mineral is kept and can berecognize
http://www.privat.schlund.de/D/DoehrmannHenning/wafrika.htm
Pseudomorphs of kaoliniteafter plagioclase in thisaltered basalt
25
1/22/02 Petrology-Spring 2002, Goeke 49
Secondary Twinning• Secondary twins can occur either due to deformation or
polymorphic transformation• Transformation twins = formed when a high-temperature
polymorph revert to a low-temperature structure– High-temperature polymorphs have greater symmetry,
so when the transformation occurs, the mineral has achoice or 2+ lower-symmetry orientations
– If the entire crystal chooses the same orientation, notwins
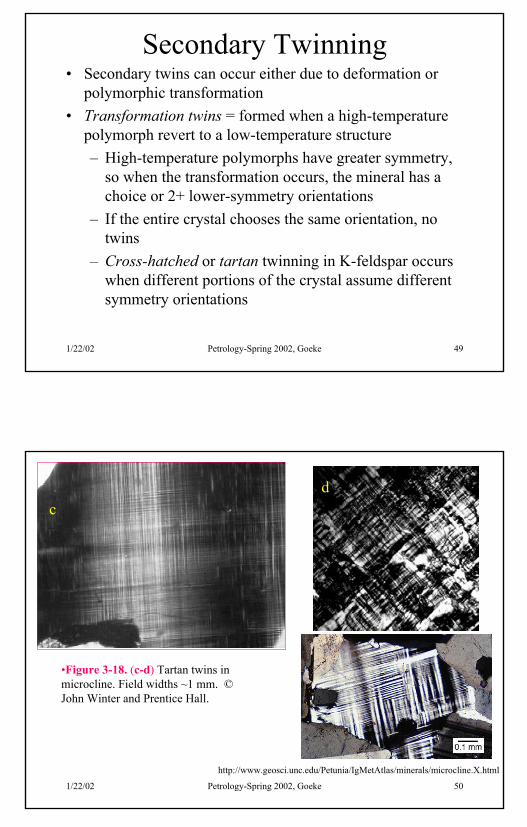
– Cross-hatched or tartan twinning in K-feldspar occurswhen different portions of the crystal assume differentsymmetry orientations
1/22/02 Petrology-Spring 2002, Goeke 50
•Figure 3-18. (c-d) Tartan twins inmicrocline. Field widths ~1 mm. ©John Winter and Prentice Hall.
http://www.geosci.unc.edu/Petunia/IgMetAtlas/minerals/microcline.X.html
cd

26
1/22/02 Petrology-Spring 2002, Goeke 51
• Deformation twins = response of minerals to deformation;occur in plagioclase at temperatures generally <400° C;instead of being extremely straight lamellar twins, theytend to taper or be bent; can occur in calcite as well asplagioclase; more likely in metamorphic rocks
•Figure 3-19. Polysyntheticdeformation twins in plagioclase.Note how they concentrate in areasof deformation, such as at themaximum curvature of the bentcleavages, and taper away towardundeformed areas. Gabbro,Wollaston, Ontario. Width 1 mm.© John Winter and Prentice Hall.
1/22/02 Petrology-Spring 2002, Goeke 52
Exsolution• Exsolution commonly occurs in: alkali feldspars (perthite
and antiperthite), pyroxenes (low- and high-Ca),amphiboles, pyroxene with lamellae of plagioclase, etc.
http://www.geosci.unc.edu/Petunia/IgMetAtlas/plutonic-micro%7F/perthite1.X.html

27
1/22/02 Petrology-Spring 2002, Goeke 53
Secondary Reactions & Replacement• Deuteric = autometamorphic properties that involve
hydration– Uralitization = pyroxene to amphibole transformation;
can be rims of amphibole around pyr, or just“inclusions” of pyroxene left within the amph crystals
– Biotitization = pyroxene/amphibole (latter morecommon) to biotite; because of the extra Ca, epidotemay also be produced
– Chloritization = any mafic mineral to chlorite; occurs atlow temperatures & high water content
– Seritization = felsic minerals (feldspars/feldspathoids)to sericite; minerals take on a “speckled” appearance; Kions are required to seritized plagioclase (fluid phase)
– Saussuritization = plagioclase to epidote
1/22/02 Petrology-Spring 2002, Goeke 54
•Figure 3-20. a. Pyroxene largelyreplaced by hornblende. Somepyroxene remains as light areas (Pyx)in the hornblende core. Width 1 mm. b.Chlorite (green) replaces biotite (darkbrown) at the rim and along cleavages.Tonalite. San Diego, CA. Width 0.3mm. © John Winter and Prentice Hall.
Pyx
Hbl
BtChl
28
1/22/02 Petrology-Spring 2002, Goeke 55
• Symplectite = intergrowths of two+ minerals as theyreplace another mineral; replacement may be partial orcomplete
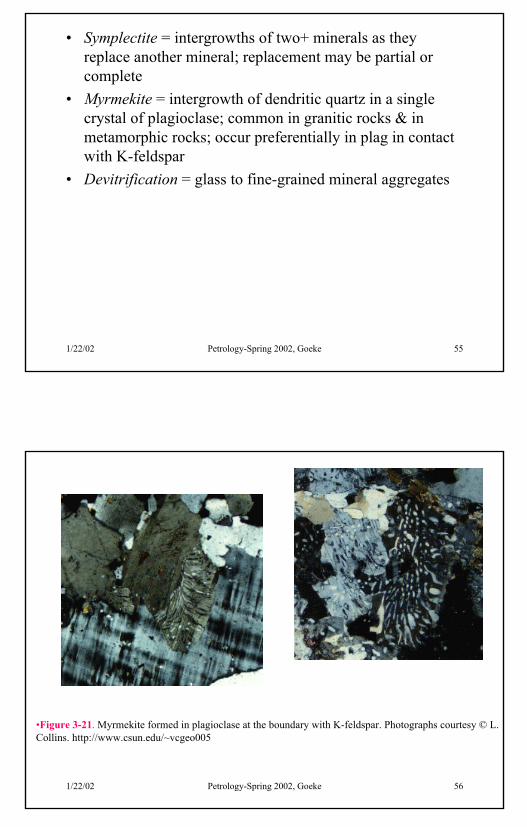
• Myrmekite = intergrowth of dendritic quartz in a singlecrystal of plagioclase; common in granitic rocks & inmetamorphic rocks; occur preferentially in plag in contactwith K-feldspar
• Devitrification = glass to fine-grained mineral aggregates
1/22/02 Petrology-Spring 2002, Goeke 56
•Figure 3-21. Myrmekite formed in plagioclase at the boundary with K-feldspar. Photographs courtesy © L.Collins. http://www.csun.edu/~vcgeo005

1
1/22/02 Petrology-Spring 2002, Goeke 1
Igneous Structures & FieldRelationships
Chapter 4
1/22/02 Petrology-Spring 2002, Goeke 2
Extrusive• The type of volcanic products depends greatly on the
properties of the magma that erupted• Magma properties depend on:
– Viscosity– Silica content– H2O content– Crystal content– Volatile content
• Yield strength = initial resistance to deformation that mustbe overcome before the material can act plastically,elastically, or brittlely

2
1/22/02 Petrology-Spring 2002, Goeke 3
•Figure 4-1. a. Calculated viscosities of anhydrous silicate liquids at one atmospherepressure, calculated by the method of Bottinga and Weill (1972) by Hess (1989),Origin of Igneous Rocks. Harvard University Press. b. Variation in the viscosity ofbasalt as it crystallizes (after Murase and McBirney, 1973), Geol. Soc. Amer. Bull., 84,3563-3592. c. Variation in the viscosity of rhyolite at 1000oC with increasing H2Ocontent (after Shaw, 1965, Amer. J. Sci., 263, 120-153).
1/22/02 Petrology-Spring 2002, Goeke 4
• Spatter = incandescent blob that suddenly bursts; occurs inlow-viscosity magmas when the volatiles escape
• Vesicles = gas bubbles that rise and concentrate near thesurface of the lava– Scoria = highly vesicular basalt– Pumice = frothy glass from rhyolitic magmas

3
1/22/02 Petrology-Spring 2002, Goeke 5
Central Vent Landforms• Vent = subcircular surface hole through which magma
erupts– The old vent may be filled by solidified magma, so that
the lava must find a new fracture or weakness that is thenext vent
• Crater = bowl or funnel-shaped depression at vent• Fissure or rift = magma of low viscosity escapes from a
long fracture; common in plateau or flood basalts• Shield = low slope landform ranging from a few kilometers
on up in diameter; form predominately from basaltic lavas– Many flows from the central vent, but also from flank
eruptions and fissure eruptions– E.g. Mauna Loa and Mauna Kea, which rise 9 km from
the bottom of the ocean up to their peaks
1/22/02 Petrology-Spring 2002, Goeke 6
• Composite volcano or stratovolcano = steep-sided (up to36°) volcanoes ~1/100 the size of a shield volcano– normally composed of a wide-range of lava
compositions—usually more silicic (~andesite)– The layers tend switch back and forth between
pyroclastics (more silicic) and lava flows (more mafic)• the ratio of pyroclastic-layers to flow-layers varies
from volcano to volcano and also within the historyof one given volcano
• E.g. Mt. St. Helen’s 1983 eruption was dacitic, butalso has had a history of more mafic flows
• Volcano complex = larger area over which the volcanism isspread throughout with sporadic activity (e.g. Lassen Peak)

4
1/22/02 Petrology-Spring 2002, Goeke 7
•Figure 4-3. a. Illustrative cross section of a stratovolcano.After Macdonald (1972), Volcanoes. Prentice-Hall, Inc.,Englewood Cliffs, N. J., 1-150. b. Deeply glaciated northwall of Mt. Rainier, WA, a stratovolcano, showing layers ofpyroclastics and lava flows. © John Winter and PrenticeHall.
1/22/02 Petrology-Spring 2002, Goeke 8
•Figure 4-2. Volcanic landforms associated with a central vent (all at same scale).
• There is a large size difference between a shield,composite, dome and cinder cone– If Mauna Loa stood completely on land (i.e. if we
drained the Pacific) it would be the tallest mountain onEarth
– Olympus Mons (Mars) is the largest volcano in thesolar system (~14 km) and is also a shield volcano
5
1/22/02 Petrology-Spring 2002, Goeke 9
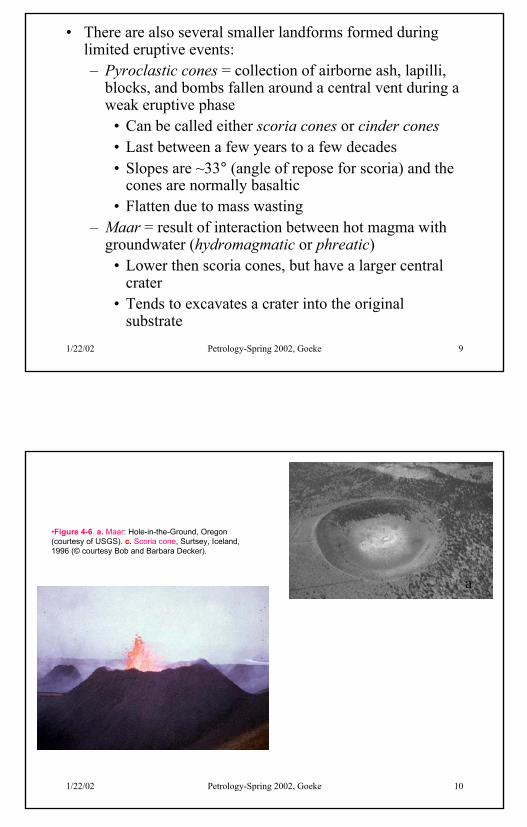
• There are also several smaller landforms formed duringlimited eruptive events:– Pyroclastic cones = collection of airborne ash, lapilli,
blocks, and bombs fallen around a central vent during aweak eruptive phase
• Can be called either scoria cones or cinder cones• Last between a few years to a few decades• Slopes are ~33° (angle of repose for scoria) and the
cones are normally basaltic• Flatten due to mass wasting
– Maar = result of interaction between hot magma withgroundwater (hydromagmatic or phreatic)
• Lower then scoria cones, but have a larger centralcrater
• Tends to excavates a crater into the originalsubstrate
1/22/02 Petrology-Spring 2002, Goeke 10
•Figure 4-6. a. Maar: Hole-in-the-Ground, Oregon(courtesy of USGS). c. Scoria cone, Surtsey, Iceland,1996 (© courtesy Bob and Barbara Decker).
c
a

6
1/22/02 Petrology-Spring 2002, Goeke 11
– Tuff ring = also caused by the interaction of water with magma,but usually closer to the surface than a maar
• Magma tends to be basaltic• Normally a higher ratio of magma to H2O then a maar• Forms a fairly subdued rim of scoria & ash and layers of
pyroclastics that dip both inwards and outwards at the sameangle
• E.g. Diamond Head on Oahu– Tuff cone = smaller then a tuff ring with more steeply dipping
sides and smaller craters• Also formed from the interaction of magma with water• Tend to result from less violent and longer eruptive phases
then either maars or tuff rings• Similar to scoria cone, but the layers dip both inwards and
outwards
1/22/02 Petrology-Spring 2002, Goeke 12
•Figure 4-5. Cross sectional structure and morphologyof small explosive volcanic landforms with approximatescales. After Wohletz and Sheridan (1983), Amer. J. Sci,283, 385-413.
•Figure 4-6. b. Tuff ring: Diamond Head, Oahu, Hawaii(courtesy of Michael Garcia), 1996 (© courtesy Bob andBarbara Decker).
7
1/22/02 Petrology-Spring 2002, Goeke 13
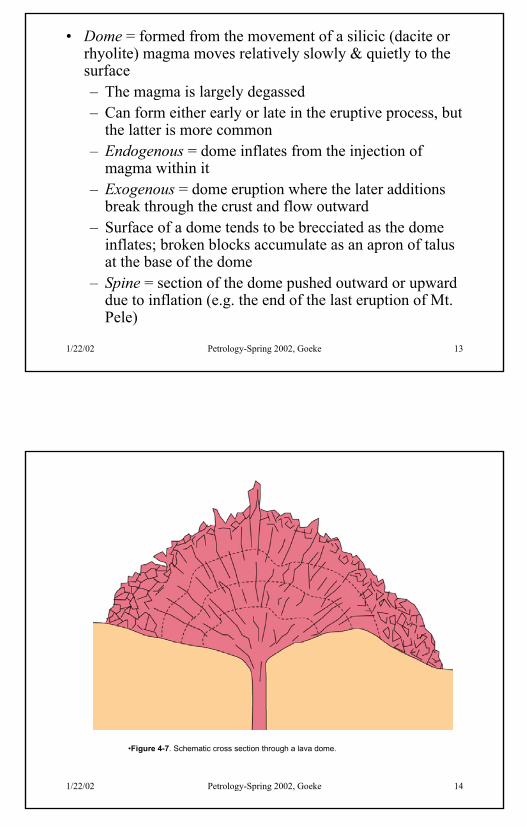
• Dome = formed from the movement of a silicic (dacite orrhyolite) magma moves relatively slowly & quietly to thesurface– The magma is largely degassed– Can form either early or late in the eruptive process, but
the latter is more common– Endogenous = dome inflates from the injection of
magma within it– Exogenous = dome eruption where the later additions
break through the crust and flow outward– Surface of a dome tends to be brecciated as the dome
inflates; broken blocks accumulate as an apron of talusat the base of the dome
– Spine = section of the dome pushed outward or upwarddue to inflation (e.g. the end of the last eruption of Mt.Pele)
1/22/02 Petrology-Spring 2002, Goeke 14
•Figure 4-7. Schematic cross section through a lava dome.
spine
Talusapron

8
1/22/02 Petrology-Spring 2002, Goeke 15
– Coulée = dome that flattens and flows downhill– Cryptodome = dome inflated beneath the Earth’s surface
(e.g. bulge on the side of Mt. St. Helen’s before it blew)• Caldera = large-scale collapse feature normally forming the
central vent– Occur when the dense material above the magma chamber
collapses inwards– May fill to form a lava lake if the collapse displaces the
magma upwards– Can be related to either basaltic (Hawaii) or rhyolitic
(Long Valley) eruptions; the latter tend to be larger– Caldera complex = overlapping calderas (e.g.
Yellowstone)– Resurgent caldera = caldera that has risen back up
towards its original height; may be due to magma inflation
1/22/02 Petrology-Spring 2002, Goeke 16
Fissure Eruptions
• Occur as magma erupts to the surface along a fracture or aseries of fractures
• Feeder dike = conduit to the eruption that has filled withsolidified magma
• Can occur in relation to a central vent or in areasundergoing extension (e.g. Basin and Range, East AfricanRift Valley)
• Most commonly occur at MORs, so not often seen byhumans

9
1/22/02 Petrology-Spring 2002, Goeke 17
Flow Features• Occur nominally from magmas with low viscosities and gas
contents—the lower the viscosity, the further the flow canreach
• Rarely kill people, but are responsible for huge amounts ofproperty damage
• Pahoehoe = flow feature caused by very low viscosity lavaflows; smooth surfaces that may appear ropy; only found inbasalts
• Aa = flow feature of more viscous lava (usually cooler); blocksof sharp cindery and scoreaceous material that looks likerubble; found in a wide variety of lava compositions
• Lava tube = conduit formed by cooled basalt that can carrylavas a great distant from the vent; normally drains to leave acave
1/22/02 Petrology-Spring 2002, Goeke 18
•Figure 4-12. a. Ropy surface of a pahoehoe flow,1996 flows, Kalapana area, Hawaii. © JohnWinter and Prentice Hall.
Figure 4-12. b. Pahoehoe (left) and aa (right)meet in the 1974 flows from Mauna Ulu, Hawaii.© John Winter and Prentice Hall.

10
1/22/02 Petrology-Spring 2002, Goeke 19
• Inflated flow = thin pahoehoe inflates due to injection ofmore magma once it has already formed a crust
• Block lava = larger, smooth-sided blocks; eruptions ofblock lava are very, very rare in human experience
• Flow foliation = aligned phenocrysts, bands of differentcolors, or pumice bands; forms in thin intermediate tosilicic lavas– Layers could represent different magmas or varying
conditions (temp, gas content, etc) of one magma– The layers could have been stretched, sheared, or
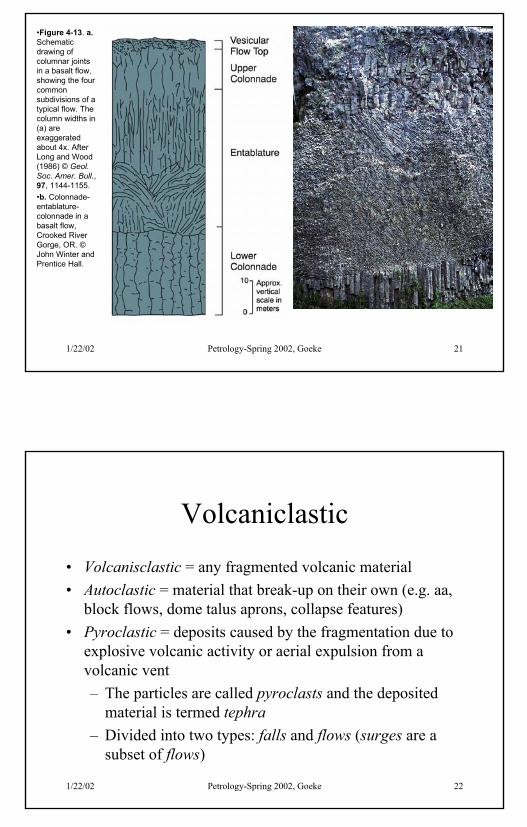
folded (or a combination of these processes)• Columnar joints = form in cooled lava that flowed on
land; ideally consists of four parts:– Thin vesiculated and brecciated flow top– An upper colonnade (regular straight columns)
1/22/02 Petrology-Spring 2002, Goeke 20
– A central entablature (more irregular columns that arecurved and skewed normally)
– Lower colonnade– Joints form as the flow contracts as it cools (generally
accepted)• Pillow lava = form through when basaltic lava flows
enter a body of water (e.g. the ocean) and form eithertongues or equidimensional blobs
11
1/22/02 Petrology-Spring 2002, Goeke 21
•Figure 4-13. a.Schematicdrawing ofcolumnar jointsin a basalt flow,showing the fourcommonsubdivisions of atypical flow. Thecolumn widths in(a) areexaggeratedabout 4x. AfterLong and Wood(1986) © Geol.Soc. Amer. Bull.,97, 1144-1155.•b. Colonnade-entablature-colonnade in abasalt flow,Crooked RiverGorge, OR. ©John Winter andPrentice Hall.
1/22/02 Petrology-Spring 2002, Goeke 22
Volcaniclastic
• Volcanisclastic = any fragmented volcanic material• Autoclastic = material that break-up on their own (e.g. aa,
block flows, dome talus aprons, collapse features)• Pyroclastic = deposits caused by the fragmentation due to
explosive volcanic activity or aerial expulsion from avolcanic vent– The particles are called pyroclasts and the deposited
material is termed tephra– Divided into two types: falls and flows (surges are a
subset of flows)

12
1/22/02 Petrology-Spring 2002, Goeke 23
Fall deposits• Fallout from a vertical eruption occurs as either the material is
forcefully propelled upwards by the eruption or carried aloft byconvection and the buoyancy of the hot gasses emitting from thevent
• Fall deposits tend to be very well sorted with larger particles nearthe vent and smaller further away
• The size of the fall deposit depends on:– Rate of expulsion– Volume erupted– Force of explosion– Direction and velocity of the winds at the time of the eruption
• The particles fall like snow irrespective of local topography andcool in the air, so they rarely weld together after deposition exceptnear the vent
1/22/02 Petrology-Spring 2002, Goeke 24
Figure 4-15. Ash cloud and deposits of the 1980eruption of Mt. St. Helens. a. Photo of Mt. St.Helens vertical ash column, May 18, 1980(courtesy USGS). b. Vertical section of the ashcloud showing temporal development during first13 minutes. c. Map view of the ash deposit.Thickness is in cm. After Sarna-Wojcicki et al. (1981) in The 1980 Eruptions of Mount St.Helens, Washington. USGS Prof. Pap., 1250,557-600.
13
1/22/02 Petrology-Spring 2002, Goeke 25
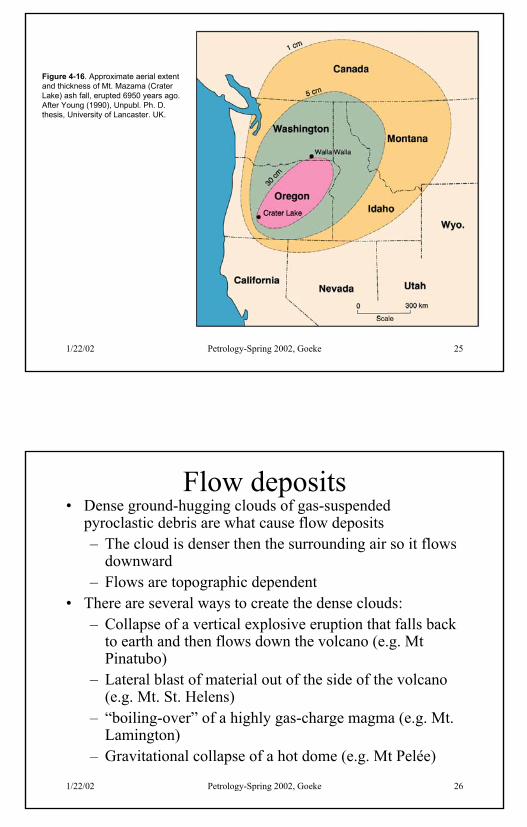
Figure 4-16. Approximate aerial extentand thickness of Mt. Mazama (CraterLake) ash fall, erupted 6950 years ago.After Young (1990), Unpubl. Ph. D.thesis, University of Lancaster. UK.
1/22/02 Petrology-Spring 2002, Goeke 26
Flow deposits• Dense ground-hugging clouds of gas-suspended
pyroclastic debris are what cause flow deposits– The cloud is denser then the surrounding air so it flows
downward– Flows are topographic dependent
• There are several ways to create the dense clouds:– Collapse of a vertical explosive eruption that falls back
to earth and then flows down the volcano (e.g. MtPinatubo)
– Lateral blast of material out of the side of the volcano(e.g. Mt. St. Helens)
– “boiling-over” of a highly gas-charge magma (e.g. Mt.Lamington)
– Gravitational collapse of a hot dome (e.g. Mt Pelée)

14
1/22/02 Petrology-Spring 2002, Goeke 27
Figure 4-18. Types of pyroclastic flow deposits.After MacDonald (1972), Volcanoes. Prentice-Hall,Inc., Fisher and Schminke (1984), PyroclasticRocks. Springer-Verlag. Berlin. a. collapse of avertical explosive or plinian column that falls back toearth, and continues to travel along the groundsurface. b. Lateral blast, such as occurred at Mt. St.Helens in 1980. c. “Boiling-over” of a highly gas-charged magma from a vent. d. Gravitationalcollapse of a hot dome (Fig. 4-18d).
1/22/02 Petrology-Spring 2002, Goeke 28
• Flows are relatively hot (400-800° C) and can move atrates greater than 50 km/hr (i.e. it can out run you)
• Ignimbrite = deposit from a pyroclastic flow– Poorly sorted normally, though larger blocks may be
found near the bottom and smaller near the top– The high temperature of deposition causing
welding—mainly at the lower levels of the deposit– Tuff = sample of ignimbrite– Welded tuff = sample of ignimbrite that has been
welded; due to the heat, they are nominally ductile for aperiod and are compressed due to the overlyingpressure to become dense and foliated
• Flows are what kill people—they cover less ground thenfalls, but the combination of fast moving & hot dense massis plain devastating

15
1/22/02 Petrology-Spring 2002, Goeke 29
Surge deposits
• More turbulent flow deposits causing dunes and anti-dunescharacterize surge deposits
• They tend to have a lower amount of particulates thenother types of flows, so they are less dense
• Surges are not as constrained by topography due to thelower density, which means they can mantle everything inan area but will still concentrate in the low-lying areas
• Cause stratified deposits which may have current-beddingfeatures
• Deposits are located near the vent
1/22/02 Petrology-Spring 2002, Goeke 30
Intrusive
• Pluton = any intrusive igneous body• Tabular = sheet-like pluton• Discordant = cut across external structures (e.g. bedding)• Concordant = parallel to country rock structure
16
1/22/02 Petrology-Spring 2002, Goeke 31
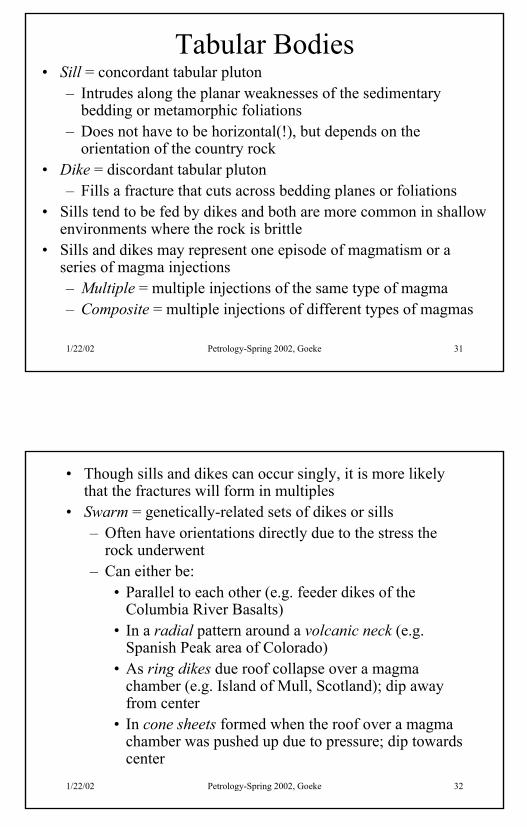
Tabular Bodies• Sill = concordant tabular pluton
– Intrudes along the planar weaknesses of the sedimentarybedding or metamorphic foliations
– Does not have to be horizontal(!), but depends on theorientation of the country rock
• Dike = discordant tabular pluton– Fills a fracture that cuts across bedding planes or foliations
• Sills tend to be fed by dikes and both are more common in shallowenvironments where the rock is brittle
• Sills and dikes may represent one episode of magmatism or aseries of magma injections– Multiple = multiple injections of the same type of magma– Composite = multiple injections of different types of magmas
1/22/02 Petrology-Spring 2002, Goeke 32
• Though sills and dikes can occur singly, it is more likelythat the fractures will form in multiples
• Swarm = genetically-related sets of dikes or sills– Often have orientations directly due to the stress the
rock underwent– Can either be:
• Parallel to each other (e.g. feeder dikes of theColumbia River Basalts)
• In a radial pattern around a volcanic neck (e.g.Spanish Peak area of Colorado)
• As ring dikes due roof collapse over a magmachamber (e.g. Island of Mull, Scotland); dip awayfrom center
• In cone sheets formed when the roof over a magmachamber was pushed up due to pressure; dip towardscenter

17
1/22/02 Petrology-Spring 2002, Goeke 33
Figure 4-21. Kangâmiut dike swarm in the SøndreStrømfjord region of SE Greenland. From Escher et al.(1976), Geology of Greenland, © The GeologicalSurvey of Denmark and Greenland. 77-95.
1/22/02 Petrology-Spring 2002, Goeke 34
Figure 4-22. a. Radial dike swarm around Spanish Peaks, Colorado. After Knopf (1936), Geol. Soc. Amer.Bull., 47, 1727-1784. b. Eroded remnant of a volcanic neck with radial dikes. Ship Rock, New Mexico. FromJohn Shelton © (1966) Geology Illustrated. W. H. Freeman. San Francisco.
ab

18
1/22/02 Petrology-Spring 2002, Goeke 35
Figure 4-23. The formation of ringdikes and cone sheets. a. Crosssection of a rising pluton causingfracture and stoping of roof blocks.b. Cylindrical blocks drop into lessdense magma below, resulting inring dikes. c. Hypothetical map viewof a ring dike with N-S strikingcountry rock strata as might resultfrom erosion to a levelapproximating X-Y in (b). d.Upward pressure of a pluton lifts theroof as conical blocks in this crosssection. Magma follows thefractures, producing cone sheets.Original horizontal bedding planeshows offsets in the conical blocks.(a), (b), and (d) after Billings (1972),Structural Geology. Prentice-Hall,Inc. (c) after Compton (1985),Geology in the Field. © Wiley. NewYork.
1/22/02 Petrology-Spring 2002, Goeke 36
Figure 4-24. a. Map of ring dikes,Island of Mull, Scotland. After Baileyet al. (1924), Tertiary and post-tertiary geology of Mull, Loch Alineand Oban. Geol. Surv. Scot. MullMemoir. Copyright British GeologicalSurvey.

19
1/22/02 Petrology-Spring 2002, Goeke 37
Figure 4-24. b.Cone sheets inthe same area ofMull, afterRitchey (1961),British RegionalGeology.Scotland, theTertiary VolcanicDistricts. Notethat the yellowfelsite ring dike inpart (a) is shownas the red ring inthe NW of part(b). BritishGeologicalSurvey.
1/22/02 Petrology-Spring 2002, Goeke 38
Non-tabular bodies• Stock = pluton with an exposed area less that 100 km2
• Batholith = pluton with an exposed area greater than 100 km2
• Since the distinction depends on exposed area, it a stock mayvolume-wise be larger than a batholith, depending on howmuch cover has been eroded
• In general, bigger plutons (whether exposed or not) are calledbatholiths and smaller stocks
• Cupola = areas exposed at the surface that are assumed (orimaged) to be connected at depth
• Plug = cylindrical conduit and magma chamber now solidified• Volcanic neck = exposed plug; caused by differential
weathering of the surrounding country rock to reveal theigneous body

20
1/22/02 Petrology-Spring 2002, Goeke 39
• There are a number of specialized names for specific shapes ofplutons, but we’re not going to worry about them—just realizethey’re out there and a good geology dictionary will tell you whatthey are ☺
Figure 4-20. Schematicblock diagram of someintrusive bodies. FromWinter.
1/22/02 Petrology-Spring 2002, Goeke 40
Contacts
• The nature of the contact between the igneous body andthe country rock depends on several factors:– Temperature of igneous vs country rock– Composition of country vs igneous rock– Presence/absence of fluids– Relative motion of the magma to country rock
• The contact may range from sharp to gradational, where itis difficult to decide where does the country rock reallyend and the pluton begin

21
1/22/02 Petrology-Spring 2002, Goeke 41
• If the magma is injected into country rock (a), a gradation fromcountry rock ⇒ country rock w/ dikes ⇒ pluton will be formed– Apophyses = dikes, veins or tongues of magma sticking into
country rock– Agmatite = rock with a high concentration of xenoliths in an
igneous matrix• The presence of fluids (esp. silicic magmas) cause a situation
where permeation dominates—no distinct boundary
Figure 4-27. Gradational border zones between homogeneous igneous rock (light) and country rock (dark). AfterCompton (1962), Manual of Field Geology. © R. Compton.
1/22/02 Petrology-Spring 2002, Goeke 42
• Contact aureole = metamorphosed country rocksurrounding a pluton; greatest amount of metamorphismnear the pluton, least further away
• Chill zone or chill margin = more quickly cooled area ofthe pluton due to contact with the cold country rock;greatest effect at the country rock-pluton contact anddecreases as you move into the pluton
• The contact may also cause a sheared zone as the magma is“dragged” by the country rock—the more viscous themagma, the greater the shear zone
• Schlieren = disc-shaped masses of elongated/flattenedminerals or ductile heated xenoliths
• Country rock may also be sheared depending on theproperties of the magma

22
1/22/02 Petrology-Spring 2002, Goeke 43
Intrusion Timing
• Post-tectonic = emplaced after the orogeny• Syn-tectonic = emplaced during the orogeny• Pre-tectonic = intruded before the orogeny• It is often difficult to tell exactly when a pluton was
emplaced, since both pre- and syn-tectonic plutons will beoverprinted by regional metamorphism & foliations andpost-tectonic plutons may foliated during emplacement
1/22/02 Petrology-Spring 2002, Goeke 44
Intrusion Depth• Depth zones = invention of Buddington (1959) based on the
structural and textural features of plutons at different depths– Epizone = relatively cool (< 300° C) country rock that is
brittle; depths < 10 km• Sharp, discordant contacts• Wall rocks often brecciated• Offshooting dikes and random lobes into the roof• Raft = large xenolith• Tend to be small• Fluid-rock interaction common & contact aureole
may be striking– Mesozone = 5 – 20 km at temperatures 300 – 500° C
• Sharp to gradational contacts

23
1/22/02 Petrology-Spring 2002, Goeke 45
• Country rock is more ductile• Contact aureole is well-developed & foliated• Chill zone minor or absent• Pluton is commonly foliated or lineated near the contact, but
the pluton may be isotropic– Catazone = deeper then 10 km and temperatures from 450 –
600° C• Gradational contacts with no chill zones• Contacts between pluton and country tend to be concordant• Since the metamorphic rocks are a med-high conditions, a
contact aureole is normally not visible• The igneous rocks may look like high-grade gneisses since
they’re foliated (either as they formed or afterwards duringcontinued deformation)
• Migmatites may also occur, which further blur the country vsigneous distinction
1/22/02 Petrology-Spring 2002, Goeke 46
Figure 4-31. a. General characteristics of plutons in the epizone, mesozone, andcatazone. From Buddington (1959), Geol. Soc. Amer. Bull., 70, 671-747.

24
1/22/02 Petrology-Spring 2002, Goeke 47
“Room Problem”• Diapir = buoyant magma body that rises through the surrounding
solid material; will stop rising when the density of the magmaequals the density of the country rock
• The “room problem” is how to deal with the fact you have magmatrying to move somewhere that’s already filled by country rock– Fractures only extend to a shallow depth, since given higher P &
T, rocks act ductily and don’t break—so you can’t just putmagma in cracks
– Melting all of the country rock you want to replace (assimilation)also is impractical—the pluton may not have enough energy
– The pluton can force the roof (lift the roof) upwards—thoughwhen the pluton density = country rock density, it should bedifficult to accomplish
1/22/02 Petrology-Spring 2002, Goeke 48
– Stoping is whenblocks of the rooffall into the plutonand sink, butrequires that thecountry rock ismore dense thenthe magma—onlyreasonable inshallow plutons
Figure 4-34. Diagrammatic illustration of proposed pluton emplacement mechanisms. 1- doming of roof; 2- wall rockassimilation, partial melting, zone melting; 3- stoping; 4- ductile wall rock deformation and wall rock return flow; 5- lateralwall rock displacement by faulting or folding; 6- (and 1)- emplacement into extensional environment. After Paterson et al.(1991), Contact Metamorphism. Rev. in Mineralogy, 26, pp. 105-206. © Min. Soc. Amer.

1
2/6/02 Petrology-Spring 2002, Goeke 1
Thermodynamics Introduction
Chapter 5
2/6/02 Petrology-Spring 2002, Goeke 2
• We dealt with a good amount of the information in thischapter during mineralogy, so I’m not going to repeat ithere
• Class will focus on the terms & concepts that we didn’ttake time to consider during last semester, but need forpetrology
• For a review, read the book! ☺

2
2/6/02 Petrology-Spring 2002, Goeke 3
Gibbs Free Energy• Since it is difficult to measure the chemical free energy of
either a phase or a system, we have to deal with changes inthe Gibbs Free Energy
• A random set of conditions (e.g. P, T, volume) is chosenand the Gibbs Free Energy at that state is a reference value(G°)– Normally the “reference state” is for pure elements in
their stable form at 25° C (298.15 K) and 1 atm (0.1MPa), at which point G° = 0 J (joules)
– G depends on the amount of material, so it is called anextensive variable
– To avoid dealing with how much of a given thing, wetalk about the molar gibbs free energy ( G°)
2/6/02 Petrology-Spring 2002, Goeke 4
• Molar Gibbs free energy of formation = uses the enthalpychange (∆H) of Si + O2 ⇒ SiO2 and the change in entropy(∆S) from 0 K to 298.15 K to tell us whether the substancewill form or not– ∆ G°f = ∆H - T∆S– Negative number = product more stable– Positive number = reactants more stable– The numbers have been tabulated for a number of
compounds and phases and can be found in big fatbooks (e.g. Robie and Hemingway, 1995)
– There are usually small discrepancies depending onwhose book you use to look up the figures—they’re dueto experimental error

3
2/6/02 Petrology-Spring 2002, Goeke 5
Applying G• Based on the formula dG = VdP – SdT we can calculate what
will occur to the Gibbs free energy for a given substance due toa change in temperature, pressure, or volume
• For a reaction, the side with the lowest G under a set P & Twill be the stable state
• At equilibrium ∆G = 0 for any reaction—that doesn’t mean thatnothing is happening, only that the reaction is going fowardequally fast to the rate is going in reverse
• Le Châtlier’s Principle = if a system is at equilibrium and achange is made, the position of the equilibrium point willchange to minimize the change– In a liquid-solid system, if we heat the system, the
proportion of liquid to solid will rise—the converse is true ifwe lower the temperature
2/6/02 Petrology-Spring 2002, Goeke 6
Capeyron Equation• If we hold pressure constant, we can derive a relationship between
the Gibbs free energy, temperature and entropy– ( c∆G / cT )P = -∆S– The Gibbs free energy will decrease with increasing temperature
(if the entropy remains the same)• Similarly, if the temperature is held constant
– ( c∆G / cP )T = -∆V– Increases in pressure lower the volume if the Gibbs free energy
is constant or the pressure increase will lower the free energy isthe volume remains the same
• When d∆G = 0, we can form the Claperyon Equation– dP / dT = ∆S / ∆V– Tells us the slope of the equilibrium curve that divides two
phases from one another

1
2/6/02 Petrology-Spring 2002, Goeke 1
Two+ Component Systems
Chapter 7
2/6/02 Petrology-Spring 2002, Goeke 2
System with 3+ components
• Every time we add another component to the system, weadd another degree of freedom—we also make the systemvery difficult to represent in 2-d
• We tend for 4+ components to use a PT diagram thatwhere lines indicate a reaction from one mineralogy toanother

2
2/6/02 Petrology-Spring 2002, Goeke 3
Figure 7-13. Pressure-temperaturephase diagram for the melting of aSnake River (Idaho, USA) tholeiiticbasalt under anhydrous conditions.After Thompson (1972). Carnegie Inst.Wash Yb. 71
2/6/02 Petrology-Spring 2002, Goeke 4
Bowen’s Reaction Series• N.L. Bowen came up with the idea of the reaction principle in
1922– Recognition of two types of reactions:
• Continuous reactions• Discontinuous reactions
– The reactions may happen sequentially, or at the same time– Series does not define which composition we’ll start with
or even what phases will be present once the rock hassolidified (we have to use the component-diagrams andbulk composition for that), but it will give us a generalsequence
– Series was originally developed for sub-alkaline rocks andwill provide erroneous thoughts for other types of igneousrocks

3
2/6/02 Petrology-Spring 2002, Goeke 5
olivine Calcic plagioclase
Mg pyroxene
Mg-Ca pyroxene
amphibole
biotite(S
pine
l)
Tem
pera
ture
potash feldspar muscovite quartz
alkalic plagioclase
Calci-alkalic plagioclase
alkali-calcic plagioclase
Bowen’s Reaction Series
DiscontinuousSeries
ContinuousSeries
2/6/02 Petrology-Spring 2002, Goeke 6
Effect of Pressure• Pressure tends to have a
smaller effect on thestability of minerals thentemperature does
• The melting point willincrease in increasingpressure– The amount of the
increase will depend on∆S & ∆V
– Exception to this rule isice
Liquid
Pres
sure
Temperature
Solid
P1
P2
T1 T2

4
2/6/02 Petrology-Spring 2002, Goeke 7
• Melting point willshift differentamounts fordifferent minerals,which means thateutectic/peritecticdiagrams will bealtered by pressure(e.g. placement ofeutectic in Di-Ansystem)
• Since it changesmineral stability, itmay also effectwhich mineral willxtalize 1st, 2nd, etc.
Figure 7-16. Effect of lithostatic pressure on the liquidus and eutecticcomposition in the diopside-anorthite system. 1 GPa data from Presnall etal. (1978). Contr. Min. Pet., 66, 203-220.
2/6/02 Petrology-Spring 2002, Goeke 8
IlmeniteIlmenite
Garnet
Ilmenite
Clinopyroxene Clinopyroxene
PlagioclaseClinopyroxenePlagioclase
GarnetClinopyroxenePlagioclaseOlivine
3.5+ GPa1 GPa0.5 GPa1 atmTem
perature

5
2/6/02 Petrology-Spring 2002, Goeke 9
Effect of Fluids• Release of fluids from a dissolved to free vapor phase
cause a large increase in volume– In we increase pressure, we can force a free vapor to
dissolve back into the melt• Fluid saturated = melt contain the maximum amount of
dissolved fluids under the current PTX conditions—anyexcess must be present as a coexisting fluid phase
• Fluid pressure (Pf) = ranges from fluid saturated (i.e. equalthe total pressure (Pt)) or “dry” (i.e. Pf = 0)
• Fluid inclusions = free fluid phases trapped within glass orminerals– May form post-magmaticly– Hard to analyze– All that is left, however, of the fluid phase
2/6/02 Petrology-Spring 2002, Goeke 10
• What we do directly measure is the volcanic gasses thatescape from the magma—the commons ones are:– H2O– CO2
– CO– O2
– H2
– S– SO2
– H2S– And minor N, B, Cl, & F
~80%, but most of it is H2O

6
2/6/02 Petrology-Spring 2002, Goeke 11
H2O• H2O does not fit into most igneous minerals, so it must be
present as a separate phase in the crystallized rocksolid + H2O ⇔ liquid (aq)
– (aq) = aqueous = liquid with fluid dissolved within it– More fluid can be dissolved in the melt then can fit in
the few igneous minerals that do accept water– According to Le Chatlier’s Principle, since H2O goes
better into the high T side (melt), that side will expand⇒ increasing the H2O-content will decrease themelting temperature
• Since you can force more H2O to dissolve at higherpressures, this effect is more dramatic as thepressure increases
2/6/02 Petrology-Spring 2002, Goeke 12
7
2/6/02 Petrology-Spring 2002, Goeke 13
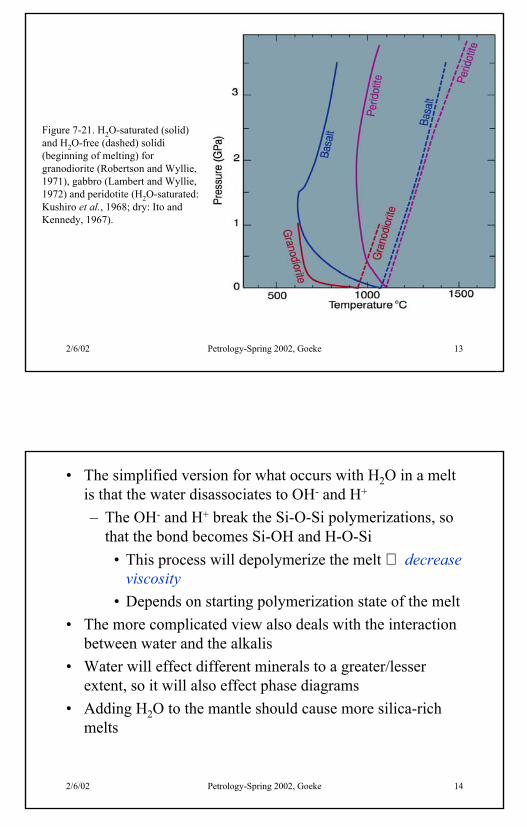
Figure 7-21. H2O-saturated (solid)and H2O-free (dashed) solidi(beginning of melting) forgranodiorite (Robertson and Wyllie,1971), gabbro (Lambert and Wyllie,1972) and peridotite (H2O-saturated:Kushiro et al., 1968; dry: Ito andKennedy, 1967).
2/6/02 Petrology-Spring 2002, Goeke 14
• The simplified version for what occurs with H2O in a meltis that the water disassociates to OH- and H+
– The OH- and H+ break the Si-O-Si polymerizations, sothat the bond becomes Si-OH and H-O-Si
• This process will depolymerize the melt ⇒ decreaseviscosity
• Depends on starting polymerization state of the melt• The more complicated view also deals with the interaction
between water and the alkalis• Water will effect different minerals to a greater/lesser
extent, so it will also effect phase diagrams• Adding H2O to the mantle should cause more silica-rich
melts

8
2/6/02 Petrology-Spring 2002, Goeke 15
Figure 7-25. The effect of H2O on thediopside-anorthite liquidus. Dry and 1 atmfrom Figure 7-16, PH2O = Ptotal curve for 1GPa from Yoder (1965). CIW Yb 64.
2/6/02 Petrology-Spring 2002, Goeke 16
CO2• CO2 acts in a very different manner then H2O in melts
– Carbon is a small atom (in comparison to H or OH) andhas a large charge (±4)
– Carbon won’t break the Si-O-Si bonds– Most petrologists treat it as an inert (no effect phase)– It can, however, dilute the effect of H2O– CO2 will have more effect on mafic magmas that have
low polymerization• Lower melting temperature—but not as much as
H2O• Tends to make the melt more polymerized ⇒ raises
viscosity

9
2/6/02 Petrology-Spring 2002, Goeke 17
Ne
Fo En
Ab
SiO2
Oversaturated(quartz-bearing)tholeiitic basalts
Highly undesaturated
(nepheline-bearing)alkali olivine
basalts
Undersaturated
tholeiitic basalts
CO2
H2Odry
P = 2 GPa

1
2/19/02 Petrology-Spring 2002, Goeke 1
Chem Pet: Major & Minor
Chapter 8
2/19/02 Petrology-Spring 2002, Goeke 2
• Major elements = > 1.0 wt. %– Control mineralogy & crystallization/melting of the
system– Dictate viscosity, density, diffusivity etc.– Used to classify igneous rocks
• Minor elements = 0.1 – 1.0 wt. %– Normally substitute for a major element– Can also be in high enough concentrations that they
form their own separate mineral phase = accessorymineral
• E.g. high Zr forms zircon; high P will form apatite;high Ti could form titanite, rutile, or a Fe-Ti oxide
• Trace elements = < 0.1 wt. %– Too dilute to form their own mineral phase, so they
only exist as substitutes within other radios

2
2/19/02 Petrology-Spring 2002, Goeke 3
– Concentration & distribution of trace elements can beused to track the evolution of magmas, distinguishbetween magma sources, or to discriminate betweenmagma processes
• Though TiO2, MnO, and P2O5 sometimes numerically beeither major or minor, they are always consideredminor—K2O is always considered major even if it is lessthan 1.0 wt. %
2/19/02 Petrology-Spring 2002, Goeke 4
Major & Minor Elements
98.5total2.2K2.8Na4.5Mg6.9Ca7.5Fe15.3Al59.3Si
O
Wt. %Oxide
Element
This table and the nextwere taken from Winter(2001).

3
2/19/02 Petrology-Spring 2002, Goeke 5
99.2099.5199.2799.0299.36Total1.571.100.830.950.0H2O5.244.301.621.100.05K2O7.793.553.482.910.22Na2O2.921.146.799.472.42CaO1.070.393.336.7339.2MgO0.170.060.140.200.11MnO2.031.114.047.136.85FeO2.791.483.273.791.36Fe2O3
19.013.317.015.74.16Al2O3
0.620.280.871.840.19TiO2
56.272.857.949.244.8SiO2
PhonoliteRhyoliteAndesiteBasaltPeridotiteOxide
2/19/02 Petrology-Spring 2002, Goeke 6
• The 7 major elements make-up the majority of thecommon igneous rocks
• Cr2O3 may be a minor element in ultramafics, but isnormally a trace element
• Iron is the only element that exists commonly in twodifferent valence state (Fe2+ and Fe3+)– Not possible to differentiate between the two with the
SEM or electron microprobe• Normally report all of the iron as FeO* if we don’t
know any better• To transfer between FeO and Fe2O3 can be done
with a bit of math: (0.8998)(FeO) = Fe2O3 or(1.1113)(Fe2O3) = FeO
– The ratio of Fe3+/Fe2+ depends on the oxygen fugacityof the melt/rock in equilibrium—higher fugacity meansmore Fe3+

4
2/19/02 Petrology-Spring 2002, Goeke 7
– Rocks with high Fe3+ find the iron sequestered in theFe-Ti oxides—rocks with high oxygen fugacities haveless Fe available for silicates
• We could calculate this either by analyzing all the mineralsin a rock and then adding the weight percentages up or bydoing a whole rock analysis—the latter is easier ☺
• This will also apply for volcanics that have a high portionof glass, since the glass composition will also be includedin the wt. %
• Chemical composition should allow us to compare theigneous rock with altered and metamorphosed equivalents
• Though mineral composition changes with P & T, the bulkrock composition should remain approximately the same
2/19/02 Petrology-Spring 2002, Goeke 8
Normative Minerals• Norms were invented to compared volcanic & intrusive rocks,
as well as rocks that form at different P’s and T’s• The norm is only based on bulk compositional differences
between rocks, so norms can be used to compare a wide rangeof igneous rocks
• Norms are calculated with the assumption that H2O = 0• CIPW Norm = developed at the beginning of the 20th century
by Cross, Iddings, Pirsson, and Washington– Minerals chosen form from anhydrous melts at low
pressures– Expressed in wt. % normative minerals– Exaggerates the denser minerals in comparison to the mode
• Mode = actual mineral composition of the rock based on theobserved volume percentage

5
2/19/02 Petrology-Spring 2002, Goeke 9
• Barth-Niggli norm or cation norm = normative minerals ona cation basis; popular in Europe
• Norms are calculated by a rigid set of steps that involvesmineral stoichiometry and math—can be done by hand, buteven easier with a computer– “guesstimates” of the oxygen fugacity and Fe3+/Fe2+
ratio have to be made– Easy to convert between CIPW & cation norms and
volume percentages with a computer• An important factor that is emphasized by a norm is silica
saturation– A “silica oversaturated” rock contains some SiO2
polymorpho– A “silica undersaturated” rock contains a phase
incompatible with an SiO2 polymorph (e.g. olivine,feldspathoid)
2/19/02 Petrology-Spring 2002, Goeke 10
– Impossible to distinguish between the two just basedon whole rock wt. % —depends on what otherelements are competing for silica to form a variety ofsilicate minerals
– Quartz is the last mineral to be calculated, so that allof the SiO2 can be properly apportioned to variousother silicates (e.g. plagioclase, pyroxene, etc) beforedetermining silica saturation
• Norms can also be used to determine high alkalinity,excess alumina content, etc.
• Homework:– calculate a norm using the appendix at the end of
Winter using the basalt composition in Table 8-3 (thisis problem #1 in Winter’s book w/ a diff basalt)
– Do number problem #2 either downloading thespreadsheet from the internet or by asking Elli for it

6
2/19/02 Petrology-Spring 2002, Goeke 11
Variation Diagrams• Used to dissect patterns found in suites of igneous rocks• Bivariate diagram = plot two parameters are plotted on an
X-Y graph• Triangular diagram = plot the relative proportions of three
variables• Can also combine elements that act similarly together (e.g.
MgO + FeO + MnO)• The diagram chosen are often varied to try and determine
the best way to analyze the data—there is no set group ofdiagrams that will show everything everyone needs
• Can be used to link different igneous rocks, as well asdistinguish processes of differentiation etc. that occurred tothe magma/rock
2/19/02 Petrology-Spring 2002, Goeke 12
Bivariate Plots• Major, minor, and trace
elements can be comparedon bivariate diagrams
• Harker diagram = set ofplots developed by AlfredHarker (1909) plotsdifferent elements versussilica as the x-coordinate
Figure 8-2. Harker variationdiagram for 310 analyzed volcanicrocks from Crater Lake (Mt.Mazama), Oregon Cascades. Datacompiled by Rick Conrey (personalcommunication). From Winter.

7
2/19/02 Petrology-Spring 2002, Goeke 13
• Primary = magmas derived directly from partial melting ofthe same source—have not undergone differentiation
• Evolved or derivaative = magma that has undergone someform of differentiation
• Primitive = not very evolved magma• Parental = the most primitive magma in the area; assume
all the other compositions in the area are derived from thisone– Normally not the “true” parent, since the magma
probably evolved during ascent—best guess we have,though
2/19/02 Petrology-Spring 2002, Goeke 14
• Trends seen on Harker diagrams assuming SiO2 increases withdifferentiation:– MgO, FeO*, CaO decrease as the magma evolves– Na2O, K2O are conserved or concentrated in more evolved
magmas• This occurs because as you remove the Mg, Fe, & Ca,
the percentage of Na & K increases even though you arenot seeing an increase in actual numbers of Na/K ions
• Called the closure problem• Though the percentage increase in Na & K does not
necessarily indicate an addition of the ions, assimilationor mixing might physically increase the number of Na/Kions in the magma
– Al2O3 has a strange trend: first Al increases then decreaseswithin the melt—explained by early xtalization of cpx (↑ )later followed by An (↓ )

8
2/19/02 Petrology-Spring 2002, Goeke 15
• A cautionary note is required when using a Harkerdiagram—don’t confuse observations with interpretations
• For the Crater Lake rocks we assumed that more SiO2 wasequated with more evolved rocks—but this doesn’t alwayswork:– E.g. Layered mafic intrusions don’t vary in SiO2 content– Difference indices are used to determine primitive vs.
evolved• Some use major elements, some trace• The index is always plotted on the abscissa• The specific index depends on the system under
examination• Harker diagrams (or other bivariate variation diagrams) tend
to be a first step in the analysis
2/19/02 Petrology-Spring 2002, Goeke 16
• If we look at the the Harker diagrams, agap exists between ~62-66 wt. %SiO2—is this real?– Glass compositions found within a
wider range of samples span thisgap—may just be a “crystal gap”
– Has been explained by a rechargeperiod in the magma chamber duringwhich time low numbers of flowswere erupted
• However, in most volcanics a gap isobserved from 48 – 68 wt. % SiO2 =Daly gap– Not as apparent if a different index is
used– Could be real or just apparent
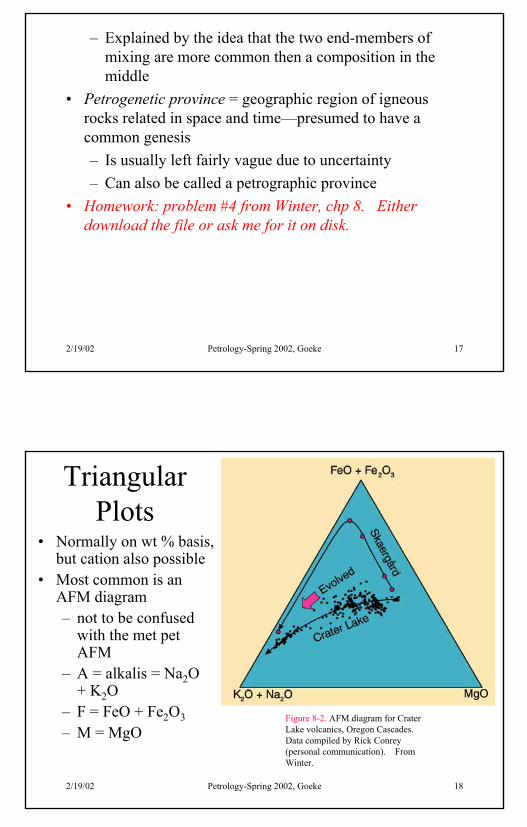
9
2/19/02 Petrology-Spring 2002, Goeke 17
– Explained by the idea that the two end-members ofmixing are more common then a composition in themiddle
• Petrogenetic province = geographic region of igneousrocks related in space and time—presumed to have acommon genesis– Is usually left fairly vague due to uncertainty– Can also be called a petrographic province
• Homework: problem #4 from Winter, chp 8. Eitherdownload the file or ask me for it on disk.
2/19/02 Petrology-Spring 2002, Goeke 18
TriangularPlots
• Normally on wt % basis,but cation also possible
• Most common is anAFM diagram– not to be confused
with the met petAFM
– A = alkalis = Na2O+ K2O
– F = FeO + Fe2O3– M = MgO
Figure 8-2. AFM diagram for CraterLake volcanics, Oregon Cascades.Data compiled by Rick Conrey(personal communication). FromWinter.

10
2/19/02 Petrology-Spring 2002, Goeke 19
– More primitive =MgO
– More evolved =alkalis
– Two different trendsare visible on thisdiagram:• Crater Lake just
evolves straightfrom MgO to thealkalis
• Skaergard becomesF enriched beforeevolving towardsthe alkalis
Figure 8-2. AFM diagram for CraterLake volcanics, Oregon Cascades.Data compiled by Rick Conrey(personal communication). FromWinter.
2/19/02 Petrology-Spring 2002, Goeke 20
Variation Diagrams for Modeling
• Two models are used to quantitatively analyze mineralfractionation:– Pearce Element Rations (PER)– Mass-balance modeling

11
2/19/02 Petrology-Spring 2002, Goeke 21
PER• Empirical—depends on element ratios• Plot on bivariate diagrams the ratios to determine
fractional crystalization– Denominator of ratio is the same for both axes– Denominator can be 1 or the sum of 2+ elements– Elements chosen for denominator based on what is not
contained within the crystallizingminerals—denominator elements are conserved
• Should minimize the closure problem– Numerators are linear combinations and reflect the
composition and stoichiometry of the fractioningmineral(s)
2/19/02 Petrology-Spring 2002, Goeke 22
• E.g. olivine (Fe,Mg)2SiO4 would have a ratio of 2/1for (Mg+Fe)/Si for atomic proportions
– On a (Mg+Fe)/K vs Si/K diagram, the slope forolivine would be 2
– On a (0.5)(Mg+Fe)/K vs Si/K diagram, olivineshould have a slope of 1
– All olivines should plot with the same slope,though the may plot on different lines (e.g. fig.8-4 in Winter)
• PERs won’t prove a particular process in occurring,but indicates whether the compositions areconsistent with fractionization
• PER more useful to rule out differentiation for agiven mineral

12
2/19/02 Petrology-Spring 2002, Goeke 23
• Problems:– Because the denominator is the same for the X
& Y axis, a correlation may appear where noreally exists
– Can rule out hypotheses, not prove them!
2/19/02 Petrology-Spring 2002, Goeke 24
Mass-BalanceModels
• Can be done bothmathematically and graphically
• Models based commonly onbivariate diagrams
• For graphic analyses, we use thelever rule to determine therelative proportions of thedifferent phases– S = solid bulk composition– P = parent composition– D = daughter composition– A, B, C = composition of
individual minerals extracted
Figure 8-6. Stacked variation diagrams ofhypothetical components X and Y (eitherweight or mol %). From Ragland (1989). BasicAnalytical Petrology, Oxford Univ. Press.From Winter (2001).
A

13
2/19/02 Petrology-Spring 2002, Goeke 25
• For diagram a:– A single mineral (S) forms
from the primitive magma (P)– Following the rules we used
for 3+ systems, thecomposition of the magmamust go linearly away from S
– Control line = line formed byS-P-D for the mineral S
– The ratio of S:D is calculatedvia the lever principle:
• D/S = SP/PD• %D = 100SP/SD• %S = PD/SD = 100-%D
A
2/19/02 Petrology-Spring 2002, Goeke 26
• For diagram b:– Two minerals (A & B) are
extracted from P to form D– S must fall on the line
connecting A & B as well ason a straight line back from P& D—find the intersection ofAB and the extension of PD
– The ratio of S:D is:• Same as before• For the A:B ratio:
– A/B = BS/AS• For diagram c:
– Three minerals (A, B & C)are extracted from P to formD
A
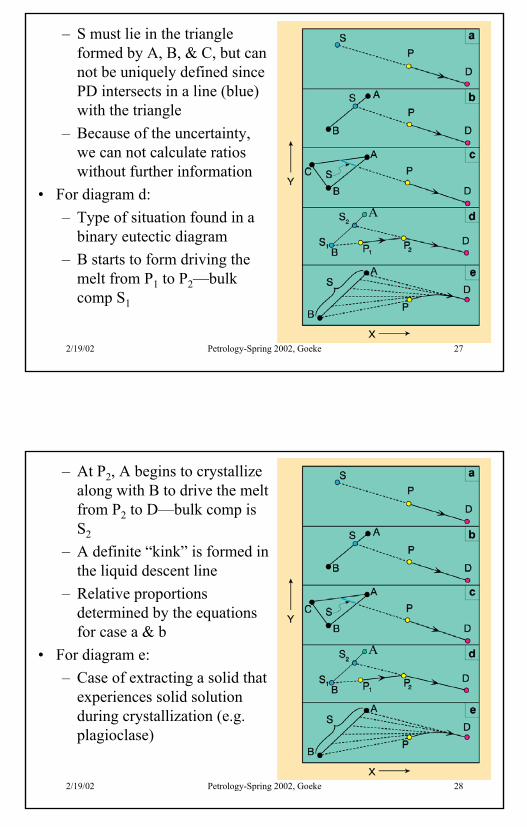
14
2/19/02 Petrology-Spring 2002, Goeke 27
– S must lie in the triangleformed by A, B, & C, but cannot be uniquely defined sincePD intersects in a line (blue)with the triangle
– Because of the uncertainty,we can not calculate ratioswithout further information
• For diagram d:– Type of situation found in a
binary eutectic diagram– B starts to form driving the
melt from P1 to P2—bulkcomp S1
A
2/19/02 Petrology-Spring 2002, Goeke 28
– At P2, A begins to crystallizealong with B to drive the meltfrom P2 to D—bulk comp isS2
– A definite “kink” is formed inthe liquid descent line
– Relative proportionsdetermined by the equationsfor case a & b
• For diagram e:– Case of extracting a solid that
experiences solid solutionduring crystallization (e.g.plagioclase)
A

15
2/19/02 Petrology-Spring 2002, Goeke 29
– The solid variessystematically from B to Aover time
– As the solid bulk extractchanges, the melt compositionmust move away from thestarting composition(P)—curved liquid line ofdescent
• Mass-balance modeling providesa way to test hypotheses, but alsodoes not “prove” an ideadefinitively—better atdiscounting a certain process
A
2/19/02 Petrology-Spring 2002, Goeke 30
Magma Series
• Magma series = group of rocks that share come chemical(possibly mineralogical) characteristics & have aconsistent pattern on a variation diagram (common geneticbackground)– Other words used for the same concept: association,
lineage, magma type, and clan• Original classification by Iddings (1892) as either:
– Alkaline = rich in alkalis, commonly silica-undersaturated
– Subalkaline = silica-saturated to oversaturated

16
2/19/02 Petrology-Spring 2002, Goeke 31
Figure 8-11. Totalalkalis vs. silica
diagram for the alkalineand sub-alkaline rocks
of Hawaii. AfterMacDonald (1968).
GSA Memoir 116 FromWinter (2001).
2/19/02 Petrology-Spring 2002, Goeke 32
Figure 8-12. the basalt tetrahedron (after Yoderand Tilley, 1962). J. Pet., 3, 342-532. From Winter(2001).
• Basalt tetrahedron = Ne-Fo-Q-Dicorners; models basalts well– Di-Ab-En plane is the plane of
silica saturation– Di-Ab-Fo planes is the critical
plane of silica undersaturation– To the left of the plane of silica
saturation olivine is stable– To the left of the critical plane,
alkaline & very silicaundersaturated nepheline isstable
– Alkalines all plot to the left ofthe critical plane andsubalkalines to the right

17
2/19/02 Petrology-Spring 2002, Goeke 33
• If we just look at the Ne-Fo-Qtz base of the tetrahedronalkalines & subalkalines aredivided from each other bythe dividing line proposedby Irvine and Baragar(1971)– The line is close to the
plane of silicaundersaturation
Figure 8-12. the base of the basalt tetrahedron using cationnormative minerals, with the compositions of subalkaline rocks(black) and alkaline rocks (gray) from Figure 8-11, projected fromCpx. After Irvine and Baragar (1971). Can. J. Earth Sci., 8, 523-548. From Winter (2001)
2/19/02 Petrology-Spring 2002, Goeke 34
– Dividing line exists because of the thermal dividepresent in the Ne-Q system at low pressures
– Subalkaline rocks could contain either olivine or quartzdepending on which side the liquid fell
Ne Ab Q
1070 1060
1713
Ab + Tr
Tr + L
Ab + LNe + L
Liquid
Ab + LNe + Ab
ThermalDivide
Fig. 8-13. The thermal divide at the albite composition on the Ne-Q system. From Winter (2001).
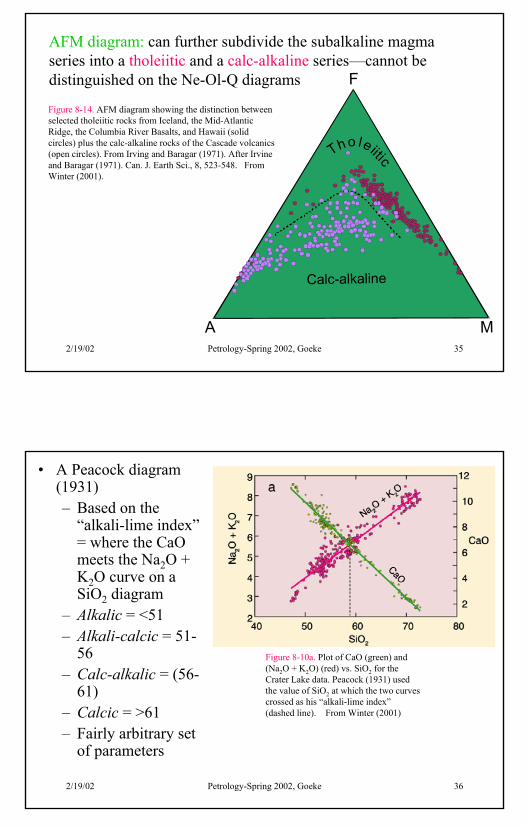
18
2/19/02 Petrology-Spring 2002, Goeke 35
F
A M
Calc-alkaline
Tho leiitic
AFM diagram: can further subdivide the subalkaline magmaseries into a tholeiitic and a calc-alkaline series—cannot bedistinguished on the Ne-Ol-Q diagrams
Figure 8-14. AFM diagram showing the distinction betweenselected tholeiitic rocks from Iceland, the Mid-AtlanticRidge, the Columbia River Basalts, and Hawaii (solidcircles) plus the calc-alkaline rocks of the Cascade volcanics(open circles). From Irving and Baragar (1971). After Irvineand Baragar (1971). Can. J. Earth Sci., 8, 523-548. FromWinter (2001).
2/19/02 Petrology-Spring 2002, Goeke 36
• A Peacock diagram(1931)– Based on the
“alkali-lime index”= where the CaOmeets the Na2O +K2O curve on aSiO2 diagram
– Alkalic = <51– Alkali-calcic = 51-
56– Calc-alkalic = (56-
61)– Calcic = >61– Fairly arbitrary set
of parameters
Figure 8-10a. Plot of CaO (green) and(Na2O + K2O) (red) vs. SiO2 for theCrater Lake data. Peacock (1931) usedthe value of SiO2 at which the two curvescrossed as his “alkali-lime index”(dashed line). From Winter (2001)

19
2/19/02 Petrology-Spring 2002, Goeke 37
• Strand (1927) based rocksbased on total molar alkalivs alumina content:– The ratio of (Na2O +
K2O) / Al2O3 =peralkalinity index
– Peralkaline = Al2O3 <(Na2O + K2O)
– Peraluminous = Al2O3 >(CaO + Na2O + K2O)
– Metaluminous = Al2O3< (CaO + Na2O + K2O)and Al2O3 > (Na2O +K2O)
– Useful for very felsicrocks
Figure 8-10 b. Alumina saturation indices(Shand, 1927) with analyses of theperaluminous granitic rocks from theAchala Batholith, Argentina (Lira andKirschbaum, 1990). In S. M. Kay and C.W. Rapela (eds.), Plutonism fromAntarctica to Alaska. Geol. Soc. Amer.Special Paper, 241. pp. 67-76. FromWinter (2001).
2/19/02 Petrology-Spring 2002, Goeke 38
Further thoughts...• Although the fields look nice and distinct from one another, in
reality there is no clear “gap” between the series—in fact rocksplot on the dividing line!
Fig. 8-17. After LeMaitre (1976) J.Petrol., 17, 589-637.

20
2/19/02 Petrology-Spring 2002, Goeke 39
• All magmas are also not capable of fitting on these seriesdiagrams (e.g. carbonatites)
• Often we want to worry about the differences betweenvarious magmas, not their similarities (which is what thesediagrams bludgeon us with)– The similarities do, however, indicate a parent body
and sequence of derivative magmas– E.g. calc-alkaline rocks are only found at convergent
plate margins; divergent boundaries are characterizedby tholeiitic magmas

1
2/20/02 Petrology-Spring 2002, Goeke 1
Chem Pet: Trace and Isotopes
Chapter 9
2/20/02 Petrology-Spring 2002, Goeke 2
• Trace elements are included or excluded within mineralphases more selectively then major & minor elements, sothey can be extremely useful in determining origin andevolutionary processes of a melt
• Since there are quite a few trace elements out there,experience has taught us only to analyze for the“informative” ones—but every once and awhile, someonecomes along and adds another element previously ignored
• The elements commonly used are:– Transition metals = Sc, Ti, Cr, Mn, Co, Ni, Cu, and Zn– Lanthanides or Rare earth elements (REE) = La, Ce,
Nd, Sm, Eu, Dy, Er, Yb, and Lu– As well as: Rb, Sr, Y, Zr, Nb, Cs, Ba, Hf, Ta, Pb, Th,
and U• Isotopes fractionate based on mass differences or from
radiocative decay

2
2/20/02 Petrology-Spring 2002, Goeke 3
Element Distribution• We use the same basic rules as back in mineralogy when
discussing which elements will swap for each other:– Two ions with the same radius & valence will enter
into solid solution depending on the ratio of the ionsat the time of formation
– Of two ions with similar radius & valence, thesmaller will preferentially go into the solid
– If two ions have a similar radius, but a differentcharge, the higher charged ion is preferentiallyincorporated into the solid
– Electronegativity also plays a role, but its beyond thescope of this course
2/20/02 Petrology-Spring 2002, Goeke 4
• Chemical fractionation = uneven distribution of elementsbetween two phases (e.g. Ca/Na greater in plag then in themelt)
• Distribution constant (KD) = distribution between any twophases at a given P, T, X
KD = Xisolid / Xi
liquid
• Xi = mole fraction of component i• If the concentration of the components are relatively dilute,
CS = Xisolid and CL = Xi
liquid, where C = concentration (ineither ppm or wt. %)
• Distribution coefficient or partition coefficient (D) =simple replacement of KD
D = CS / CL– There are tables of distribution coefficients calculated
for given minerals and certain types of melts for giventrace elements

3
2/20/02 Petrology-Spring 2002, Goeke 5
– Coefficients can range quite a bit depending on compositionand temperature (only a minor amount with pressure), which iswhy they are so useful
• Incompatible = trace elements more concentrated in the melt thenin the solid; D < 1– High field strength (HFS) = smaller, more highly charged
elements (REE, Th, U, Ce, Pb4+, Zr, Hf, Ti, Nb, and Ta)– Large ion lithophile (LIL) = low field strength elements are
more mobile within the melt, especially in the presence of afluid (K, Rb, Cs, Ba, Pb2+, Sr, and Eu2+)
• Compatible = trace elements that concentrate in the solid; D >> 1– Ni, Cr, Cu, W, Ru, Rh, Pd, Os, Ir, Pt, and Au tend to be
compatible• For a rock, we determine the distribution coefficient by summing
the contribution from each mineral (W=weight fraction of mineral) Di = ∑ WADi
A
2/20/02 Petrology-Spring 2002, Goeke 6
• Certain mineralspartition various traceelements more stronglythen others (e.g. nickellikes to go into olivine),so we can use Harkerdiagrams to plot whenolivine is and is notcrystallizing
• Some elements arepreferentiallyconcentrated in the meltand will increase asmore solid is produced(e.g. Zr in basalticrocks)
Figure 9-1a. Ni Harker Diagram for Crater Lake. From datacompiled by Rick Conrey. From Winter (2001) An Introduction toIgneous and Metamorphic Petrology. Prentice Hall.
No olivineolivine
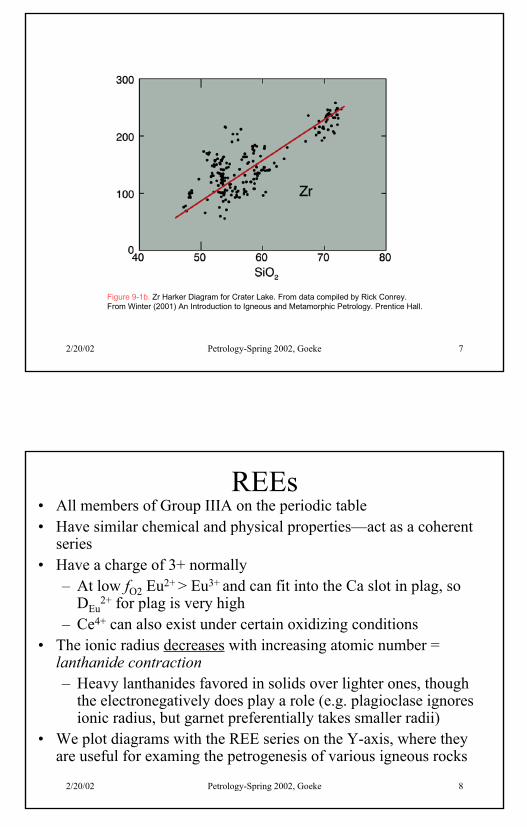
4
2/20/02 Petrology-Spring 2002, Goeke 7
Figure 9-1b. Zr Harker Diagram for Crater Lake. From data compiled by Rick Conrey.From Winter (2001) An Introduction to Igneous and Metamorphic Petrology. Prentice Hall.
2/20/02 Petrology-Spring 2002, Goeke 8
REEs• All members of Group IIIA on the periodic table• Have similar chemical and physical properties—act as a coherent
series• Have a charge of 3+ normally
– At low fO2 Eu2+ > Eu3+ and can fit into the Ca slot in plag, soDEu
2+ for plag is very high– Ce4+ can also exist under certain oxidizing conditions
• The ionic radius decreases with increasing atomic number =lanthanide contraction– Heavy lanthanides favored in solids over lighter ones, though
the electronegatively does play a role (e.g. plagioclase ignoresionic radius, but garnet preferentially takes smaller radii)
• We plot diagrams with the REE series on the Y-axis, where theyare useful for examing the petrogenesis of various igneous rocks

5
2/20/02 Petrology-Spring 2002, Goeke 9
Con
cent
ratio
n
La Ce Nd Sm Eu Tb Er Dy Yb Lu
– Degree of compatibility increases from left to rightacross the diagram
– Don’t usually plot all 15 REE’s, since 9/10 show thepattern well enough
– Normalized to some “standard” value to plotnicely—usually chondrites are standard, but it varies
2/20/02 Petrology-Spring 2002, Goeke 10
• Europium anomaly = pronounced dip in the REE pattern at Euwhen plagioclase is present due to the Eu2+ substitution forCa—may be either positive or negative, depending on whether plagwas removed or accumulated
• Magnitude of the anomaly represented by the Eu/Eu*, where Eu* isthe hypothetical value of Eu if that plagioclase hadn’t interruptedthe system
Figure 9-5. REE diagram for 10%batch melting of a hypotheticallherzolite with 20% plagioclase,resulting in a pronounced negativeEuropium anomaly. From Winter(2001) An Introduction to Igneousand Metamorphic Petrology.Prentice Hall.

6
2/20/02 Petrology-Spring 2002, Goeke 11
• Homework problem: do #3 from Winter, chp. 9—you willneed to get a file from either online or me
2/20/02 Petrology-Spring 2002, Goeke 12
Spider Diagrams• Spider diagram = normalized multi-element diagrams; broader
range of trace elements then a REE diagram– Also normalized to estimates of some primitive
reservoir—usually the primordial Earth (slightly different fromchondrite-values)
Fig. 9-6. Spider diagram for an alkalinebasalt from Gough Island, southernAtlantic. After Sun and MacDonough(1989). In A. D. Saunders and M. J.Norry (eds.), Magmatism in the OceanBasins. Geol. Soc. London Spec.Publ., 42. pp. 313-345. From Winter(2001).
not wellstandardized—variousauthors list the elementsin different orders anduse differentnormalizations

7
2/20/02 Petrology-Spring 2002, Goeke 13
Application
• Trace elements on Harker diagrams can indicate mineralformation (as we saw earlier with Ni & olivine)
• We can look at the patterns of REE diagrams to determinepatterns such as high-pressure vs. low-pressure formation– E.g. garnet & plag are more likely to form at high
pressures; plag encorporating Eu and garnet the HREEs(heavy REEs)
• Ratios of trace elements are also very useful in determiningpossible causes of depletion/enrichment
2/20/02 Petrology-Spring 2002, Goeke 14
0.00
2.00
4.00
6.00
8.00
10.00
56 58 60 62 64 66 68 70 72
sam
ple/
chon
drite
La Ce Nd Sm Eu Tb Er Yb Lu
67% Ol 17% Opx 17% Cpx
0.00
2.00
4.00
6.00
8.00
10.00
56 58 60 62 64 66 68 70 72
sam
ple/
chon
drite
La Ce Nd Sm Eu Tb Er Yb Lu
57% Ol 14% Opx 14% Cpx 14% Grt
0.00
2.00
4.00
6.00
8.00
10.00
sam
ple/
chon
drite
60% Ol 15% Opx 15% Cpx 10%Plag
La Ce Nd Sm Eu Tb Er Yb Lu
• Comparison of low P (nogarnet + plag) to a plag-bearing and plag + garnet-bearing rock
From Winter (2001).

8
2/20/02 Petrology-Spring 2002, Goeke 15
Element Use as a petrogenetic indicator
Ni, Co, Cr Highly compatible elements. Ni (and Co) are concentrated in olivine, and Cr in spinel andclinopyroxene. High concentrations indicate a mantle source.
V, Ti Both show strong fractionation into Fe-Ti oxides (ilmenite or titanomagnetite). If they behavedifferently, Ti probably fractionates into an accessory phase, such as sphene or rutile.
Zr, Hf Very incompatible elements that do not substitute into major silicate phases (although they mayreplace Ti in sphene or rutile).
Ba, Rb Incompatible element that substitutes for K in K-feldspar, micas, or hornblende. Rb substitutesless readily in hornblende than K-spar and micas, such that the K/Ba ratio may distinguish thesephases.
Sr Substitutes for Ca in plagioclase (but not in pyroxene), and, to a lesser extent, for K in K-feldspar. Behaves as a compatible element at low pressure where plagioclase forms early, butas an incompatible at higher pressure where plagioclase is no longer stable.
REE Garnet accommodates the HREE more than the LREE, and orthopyroxene and hornblende doso to a lesser degree. Sphene and plagioclase accommodates more LREE. Eu2+ is stronglypartitioned into plagioclase.
Y Commonly incompatible (like HREE). Strongly partitioned into garnet and amphibole. Spheneand apatite also concentrate Y, so the presence of these as accessories could have asignificant effect.
Table 9-6. A brief summary of some particulary useful trace elements inigneous petrology. After Green (1980). Tectonophys., 63, 367-385.From Winter (2001) An Introduction to Igneous and MetamorphicPetrology. Prentice Hall.
2/20/02 Petrology-Spring 2002, Goeke 16
Which tectonic environment?• Some trace element ratios are very characteristic of a given
tectonic environment (e.g. mid-ocean ridge, rift zone, etc.)• We take the modern values and can apply them to rocks
that have been deformed, displaced, and isolated from theiroriginal location
• If the rock has been metamorphosed, we must chooseelements that are immobile during metamorphism (usuallyY, Ti, Cr, Zr, and Hf)
• Some rocks may plot in different fields depending onwhich diagram is chosen—makes some petrologistsquestion the results

9
2/20/02 Petrology-Spring 2002, Goeke 17
Figure 9-8. (a) after Pearce and Cann (1973), Earth Planet, Sci. Lett., 19, 290-300. (b) after Pearce (1982) inThorpe (ed.), Andesites: Orogenic andesites and related rocks. Wiley. Chichester. pp. 525-548, Coish et al. (1986),Amer. J. Sci., 286, 1-28. (c) after Mullen (1983), Earth Planet. Sci. Lett., 62, 53-62. From Winter (2001).
2/20/02 Petrology-Spring 2002, Goeke 18
• Homework: Problem #5 in the book (no material neededfrom me!)—but be careful when plotting on a triangulardiagram, you will have to normalize to 100% first, so thatthe data plots correctly

10
2/20/02 Petrology-Spring 2002, Goeke 19
Isotopes• Isotope = variants of the same element with different
numbers of neutrons– 6
12C, where 6 = atomic number, C = carbon, and 12 =atomic mass; there are three stable variations for carbon
– H, C, O, S, K, Ar, Rb, Sr, U, Pb, Th, Sm, and Nd arethe most commonly used by petrologists—but scientistsare constantly playing with others to see what worksbest
– Stable isotope = remain indefinitely in that state– Radioactive isotope = unstable and undergo a process
of radioactive decay to become stable; release energy inthe process as well as a particle or gamma ray
• Parent = original isotope• Daughter = product of the radioactive decay
2/20/02 Petrology-Spring 2002, Goeke 20
• Radiogenic isotope = a daughter isotope• Nuclear fission = radioactive decay process some
isotopes undergo causing two daughter isotopes toform
• The daughter isotope may also be unstable anddecay further until a stable state is reached
• Used to determine ages of rocks

11
2/20/02 Petrology-Spring 2002, Goeke 21
Stable Isotopes• Isotopes of a given element are all chemically the same,
but they have different masses—leads to massfractionization– Light isotopes are preferentially fractionated into the
phase with the weaker bonds (vapor over liquid, liquidover solid)
– Tiny differences– To what extent the process will occurs depends on the
mass difference / total mass• E.g. 204Pb and 205Pb do not have a great
fractionization because they are very, very close inweight, however 1H and 3H have a very noticeableweight difference and the fractionization is greater
2/20/02 Petrology-Spring 2002, Goeke 22
• Let’s look at water (because its used not just in petrology,but also in environmental, hydrology, glacial geology, etc.)– There are three stable oxygen isotopes:
16O 99.756%17O 0.039%18O 0.205%
– To use ratios wisely, we need to choose some standardvalue—in oxygen’s case SMOW = standard meanocean water
– Measured in per mil (‰)– Positive δ-values come from 18O enrichment and
negative values from 18O depletion
δ(18O/16O) = [(18O/16O)sample – (18O/16O)SMOW / (18O/16O)SMOW]* 1000

12
2/20/02 Petrology-Spring 2002, Goeke 23
– If water is evaporated, which isotope will bepreferentially found in the vapor?
– What does that make the δ18O value?– The fractionation also depends on temperature, which
means we can use oxygen isotopes as a paleoclimaticindicator
Figure 9-9. Relationshipbetween d(18O/16O) and meanannual temperature formeteoric precipitation, afterDansgaard (1964). Tellus, 16,436-468. From Winter(2001).
16Onegative
2/20/02 Petrology-Spring 2002, Goeke 24
• We can use stable isotopes to distinguish between igneousrocks formed during at mid-ocean ridges and those formedfrom melting sedimentary rocks
• Can also use them to look at hydrothermal alteration andthe source of the water
• Carbon and hydrogen also important for the determinationof the fluid origin
• Stable isotope composition can also indicate the parentalbody of a metamorphic rock and the nature & extent ofmetamorphic fluids
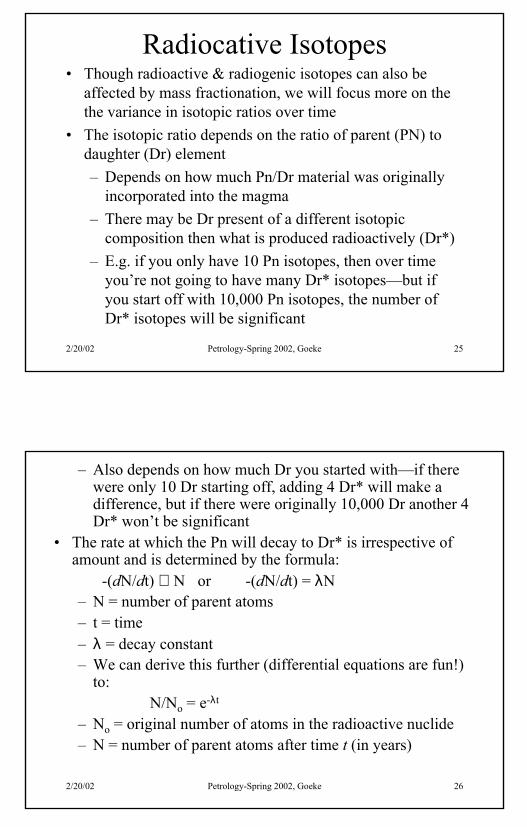
13
2/20/02 Petrology-Spring 2002, Goeke 25
Radiocative Isotopes• Though radioactive & radiogenic isotopes can also be
affected by mass fractionation, we will focus more on thethe variance in isotopic ratios over time
• The isotopic ratio depends on the ratio of parent (PN) todaughter (Dr) element– Depends on how much Pn/Dr material was originally
incorporated into the magma– There may be Dr present of a different isotopic
composition then what is produced radioactively (Dr*)– E.g. if you only have 10 Pn isotopes, then over time
you’re not going to have many Dr* isotopes—but ifyou start off with 10,000 Pn isotopes, the number ofDr* isotopes will be significant
2/20/02 Petrology-Spring 2002, Goeke 26
– Also depends on how much Dr you started with—if therewere only 10 Dr starting off, adding 4 Dr* will make adifference, but if there were originally 10,000 Dr another 4Dr* won’t be significant
• The rate at which the Pn will decay to Dr* is irrespective ofamount and is determined by the formula:
-(dN/dt) ∝ N or -(dN/dt) = λN– N = number of parent atoms– t = time– λ = decay constant– We can derive this further (differential equations are fun!)
to:N/No = e-λt
– No = original number of atoms in the radioactive nuclide– N = number of parent atoms after time t (in years)

14
2/20/02 Petrology-Spring 2002, Goeke 27
– Half-life (T1/2) = time required for half of the parentisotope to decay to the daughter isotope
– Using the above formula, we can determine the age of arock since
D* = No – ND* = N(eλt) – N = N(eλt – 1)
– D* = number of radiogenic daughter present– The most diffucult part is distinguishing Dr* from other
Dr isotopes to correctly gauge D*• Given radiometric dating calculations are practical for only
a certain amount of geologic time; you must choose thecorrect parent-daughter pair for the geologic timeframeexamined
2/20/02 Petrology-Spring 2002, Goeke 28
A few radiometric systems• K-Ar
– 40K can decay to either 40Ca or 40Ar, but since Ca is soabundant, we focus on 40Ar
– Ar also has the benefit that at certain temperatures it isreleased from the system, so that you “reset” the rockback to Ar = 0
– K-Ar is used to determine when a rock passed a certaintemperature on its cooling path—called a cooling age
– K-Ar has been used for bulk rock, muscovite,amphibole, biotite, apatite, and K-feldsparanalyses—each mineral has a different closuretemperature at which point no more Ar is released
– More recently, we have begun to look at 40Ar/39Arratios

15
2/20/02 Petrology-Spring 2002, Goeke 29
– Due to the relationship between 39Ar and 39K and thefact that the 40K/39K ratio was set during rock formation,we can use the 40Ar/39Ar ratio to calculate the 40Ar/40Kratio
– 40Ar/39Ar is a more accurate process• Rb-Sr
– 87Rb → 87Sr + beta particle– 86Sr is a stable isotope– Rb concentrates in micas, amphibole, (K-feldspar)– Sr conentrates in plagioclase and apatite– In a natural sample, the ratio of 88Sr:87Sr:86Sr:84Sr is
10:0.7:1:0.07– 87Sr is also a stable isotope, so the amount in a rock will
equal the original 87Sr + the radiogenic 87Sr—they areimpossible to distinguish from one another, so we can’tuse the sample method as K-Ar
2/20/02 Petrology-Spring 2002, Goeke 30
– Isochron technique = uses 2+ samples and normalizesthe isotopes that vary with time to a constant isotope
• In the case of Rb-Sr, we use 86Sr as our constantisotope and normalize the other values to it
– For ages less then 70 Ga, we can use the formula:87Sr/86Sr = (87Sr/86Sr)o + (87Rb/86Sr)λt
– This formula matches up with the equation for astraight line, which means we plot straight-lineisochrons on a 87Sr/86Sr vs 87Rb/86Sr diagram

16
2/20/02 Petrology-Spring 2002, Goeke 31
a b c to86Sr87Sr
o( )
86Sr
87Sr
86Sr
87Rb
– At to the slope of the line connecting 2+ samples will bezero (a, b, c are rocks in the diagram below)
From Winter,2001.
2/20/02 Petrology-Spring 2002, Goeke 32
a b c
a1b1
c1t1
to
86Sr
87Sr
86Sr
87Rb
86Sr87Sr
o( )
– After some time increment (t0 →t1) each sample losessome 87Rb and gains an equivalent amount of 87Sr
– The slope increases as t increases
From Winter,2001.

17
2/20/02 Petrology-Spring 2002, Goeke 33
a b c
a1b1
c1a2
b2
c2t1
to
t2
86Sr
87Sr
86Sr87Sr
o( )
86Sr
87Rb
– At time t2 each rock system has evolved → new lineand the slope has increased
– The intercept between the line and the 87Sr/86Sr axis isthe original concentration
From Winter,2001.
2/20/02 Petrology-Spring 2002, Goeke 34
– We use the slope of the line to determine the age andthe intercept to determine the original ratio
Figure 9-9. Rb-Sr isochron for the Eagle Peak Pluton, central Sierra Nevada Batholith, California, USA. Filled circles arewhole-rock analyses, open circles are hornblende separates. The regression equation for the data is also given. After Hill etal. (1988). Amer. J. Sci., 288-A, 213-241.

18
2/20/02 Petrology-Spring 2002, Goeke 35
• Homework: problems #6, 7, 8 & 9 in chapter 9; we willhave time to work on this today in lab
2/20/02 Petrology-Spring 2002, Goeke 36
• U-Pb-Th– System is complex due to the large number of
radioactive/radiogenic isotopes involved: 234U, 235U,238U, 206Pb, 207Pb, and 208Pb
– 204Pb is the only non-radiogenic isotope– There are three ways to get lead:
238U → 234U → 206Pb235U → 297Pb232Th → 208Pb
– We can either treat the three systems separately(complicated) or try to deal with several of theequations at the same time
• Combining the two U → Pb systems, produces acurved line called the concordia along which allnatural samples must develop
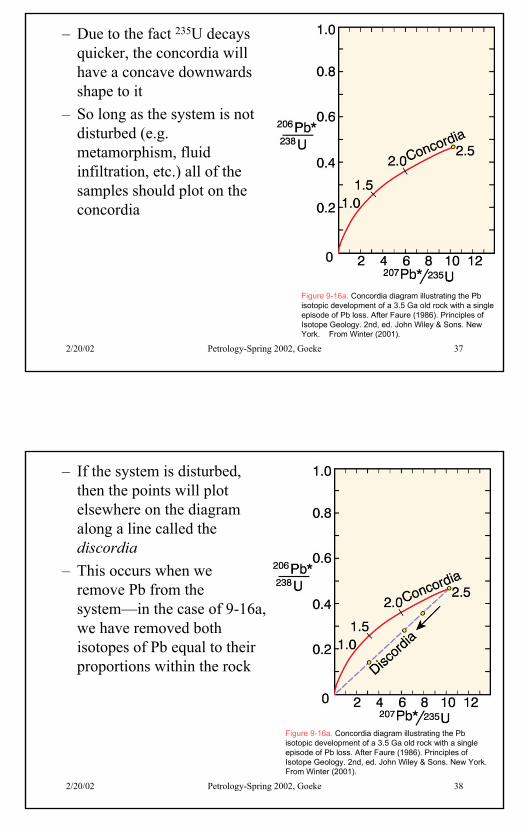
19
2/20/02 Petrology-Spring 2002, Goeke 37
Figure 9-16a. Concordia diagram illustrating the Pbisotopic development of a 3.5 Ga old rock with a singleepisode of Pb loss. After Faure (1986). Principles ofIsotope Geology. 2nd, ed. John Wiley & Sons. NewYork. From Winter (2001).
– Due to the fact 235U decaysquicker, the concordia willhave a concave downwardsshape to it
– So long as the system is notdisturbed (e.g.metamorphism, fluidinfiltration, etc.) all of thesamples should plot on theconcordia
2/20/02 Petrology-Spring 2002, Goeke 38
– If the system is disturbed,then the points will plotelsewhere on the diagramalong a line called thediscordia
– This occurs when weremove Pb from thesystem—in the case of 9-16a,we have removed bothisotopes of Pb equal to theirproportions within the rock
Figure 9-16a. Concordia diagram illustrating the Pbisotopic development of a 3.5 Ga old rock with a singleepisode of Pb loss. After Faure (1986). Principles ofIsotope Geology. 2nd, ed. John Wiley & Sons. New York.From Winter (2001).

20
2/20/02 Petrology-Spring 2002, Goeke 39
• Homework: problem #10 in chapter 9; lab time can bededicated to this work

1
2/25/02 Petrology-Spring 2002, Goeke 1
Mantle Melting&
Basalt GenerationChapter 10
2/25/02 Petrology-Spring 2002, Goeke 2
• Partial melting of mantle usually produces basalt—themost common type of volcanic rock made right now
• Most igneous rocks can be derived from basalticmagmas
• There are three types of common basalt:– Calc-alkaline– Tholeiitic– Alkaline
• Since we only find calc-alkaline at convergent plateboundaries, we’ll take about those basalts in chp 16 & 17
• A greater volume of tholeittes (MOR’s plus intraplate) isproduced then alkaline basalts (only intraplate)
• There are some common petrographic characteristics oftholeiitic and alkaline rocks, though samples seldomlycontain all of the given characteristics

2
2/25/02 Petrology-Spring 2002, Goeke 3
Olivine common and zonedOpx is absentPlag is less common and later insequenceCpx is Ti-augite w/ reddish rims
Olivine rare, unzoned, and maybe partially resorbed or showreaction rims of opxOpx relatively commonEarly plag commonCpx is pale-brown augite
Phenocrysts
Usually fairly coarse,intergrannular to ophiticOlivine commonTi-augite (reddish)Hypersthene rareInterstitial alkali feldspar orfeldspathoid may occurInterstitial glass rare and quartzzoned
Usually fine-grained,intergranularNo olivineCpx = augite (± pigeonite)No alkali feldsparInterstitial glass and/or quartzcommon
Groundmass
AlkalineTholeiitic
Table 10-1. After Hughes (1982) and McBirney (1993). From Winter (2001).
2/25/02 Petrology-Spring 2002, Goeke 4
• We know that the mantle issolid (S-waves pass through it),but somehow we have toderive the magmas eruptingfrom volcanoes from themantle + crust
• Since magams cool as they risethrough the mantle & crust, thetemperature of the magmasgenerated must be higher than1100-1200° C—looking at thegeothermal gradient, that putsthe depth at >100 km
Figure 1-9. Estimated ranges of oceanic and continentalsteady-state geotherms to a depth of 100 km using upperand lower limits based on heat flows measured near thesurface. After Sclater et al. (1980), Earth. Rev. Geophys.Space Sci., 18, 269-311. From Winter (2001).

3
2/25/02 Petrology-Spring 2002, Goeke 5
Mantle Petrology• There are only four ways to directly sample mantle rocks:
– Ophiolites = presumed ancient oceanic crust & uppermantle slabs; only extend down to a max of 7 km inthe mantle• Sheet-like mafic to ultramafic masses• Thrust onto continents or incorporated into
mountain belts• We’ll talk about structure in chp 13• Alpine peridotites = dismembered ophiolitic
ultramafics incorporated into mountain belts thatare deformed
• Other ultramafic ophiolitic samples include:harzburgite, dunite, and wehrlite, lherzolite, &pyroxenite to a lesser extent
2/25/02 Petrology-Spring 2002, Goeke 6
• Dominated by olivine, opx, cpx, with lesser plagand oxides
– Dredge samples from oceanic fracture zones• This method was common in the 60’s and 70’s,
but it leads to not knowing exactly where yoursample comes from or the relationship of thesamples to each other
• More modern practices involve the use ofsubmersibles to directly sample from the fracturewall (e.g. ODP cruise to the Hess Deep)
• Only samples the topmost portion of the uppermantle
• Samples are very similar to those taken fromophiolites
– Nodules in basalts• Approximately fist-sized ultramafic xenoliths

4
2/25/02 Petrology-Spring 2002, Goeke 7
• Usually found in basanites (a feldspathoid olivinebasalt) or alkali basalts
• Most common types are: gabbro, dunite,harzburgite, spinel lherzolite, plagioclaselherzolite, sehrlites, garnet lherzolite, and aneclogite (high P metamorphic rock w/ garnet &pyroxene)
• Can also find xenoliths in basaltic lavas– Not usually found in tholeiites– Must have traveled quickly to the surface for
the xenoliths to still be present– Can include restites (remainder of a rock that
was partially melted) and autoliths (xenolithspicked up near the magma source)
– Xenoliths in kimberlites• We’ll talk about kimberlites in chp 19 in detail
2/25/02 Petrology-Spring 2002, Goeke 8
• Considered the result due to deep upper mantletapping (250-350 km) and rapid movement of thematerial to the surface
• Include a variety of mantle and crustal samples tothe surface as xenoliths
• All known kimberlites occur within continentalareas
• The xenoliths are diverse (heterogeneous uppermantle)—garnet lherzolite and spinel lherzolite aredominant, though
• Only source of deeper mantle petrology• Spinel and garnet lherzolites are the main candidates for
pristine mantle material, if we look at the data above– Have the correct densities and seismic properties for
what has been observed– Basalts can be produced by partially melting them

5
2/25/02 Petrology-Spring 2002, Goeke 9
– We consider lherzolitethe correct answer,because if you look at aplot of magmacomposition basalt,lherzolite, harzburgite,and dunite plot on thesame line—in fact, ifyou were to removebasalt from a lherzolite,you would be left witha residuum ofharzburgite and dunite
– Harzburgite and dunitecan also havecummulatetextures—evidence forfractionalcrystallization
15
10
5
00.0 0.2 0.4 0.6 0.8
Wt.%
Al 2O
3
Wt.% TiO2
DuniteHarzburgite
Lherzolite
Tholeiitic basalt
Partial
Melting
Residuum
Figure 10-1 Brown and Mussett, A. E. (1993), The Inaccessible Earth:An Integrated View of Its Structure and Composition. Chapman &Hall/Kluwer. From Winter (2001).
2/25/02 Petrology-Spring 2002, Goeke 10
• Our aluminous lherzolite isdivided into four-phases:olivine, opx, cpx, and asubordinate aluminous phase(e.g. garnet, plagioclase,spinel, Si in VI-CN)
• Fertile = undepleted mantle,normally considered to bethe aluminous lherzolite
• The chemical composition ofthe various lherzolites(garnet/spinel) are verysimilar—the difference inmineralogy depends onpressure– From low to high: plag,
spinel, garnet, Si in VI-CN
Figure 10-2 Phase diagram of aluminous lherzolite with meltinginterval (gray), sub-solidus reactions, and geothermal gradient.After Wyllie, P. J. (1981). Geol. Rundsch. 70, 128-153. FromWinter (2001).
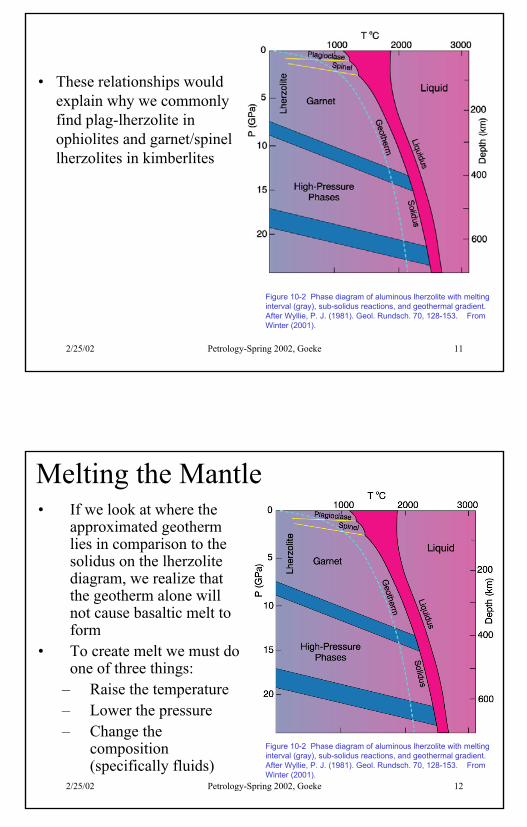
6
2/25/02 Petrology-Spring 2002, Goeke 11
• These relationships wouldexplain why we commonlyfind plag-lherzolite inophiolites and garnet/spinellherzolites in kimberlites
Figure 10-2 Phase diagram of aluminous lherzolite with meltinginterval (gray), sub-solidus reactions, and geothermal gradient.After Wyllie, P. J. (1981). Geol. Rundsch. 70, 128-153. FromWinter (2001).
2/25/02 Petrology-Spring 2002, Goeke 12
Figure 10-2 Phase diagram of aluminous lherzolite with meltinginterval (gray), sub-solidus reactions, and geothermal gradient.After Wyllie, P. J. (1981). Geol. Rundsch. 70, 128-153. FromWinter (2001).
Melting the Mantle• If we look at where the
approximated geothermlies in comparison to thesolidus on the lherzolitediagram, we realize thatthe geotherm alone willnot cause basaltic melt toform
• To create melt we must doone of three things:
– Raise the temperature– Lower the pressure– Change the
composition(specifically fluids)

7
2/25/02 Petrology-Spring 2002, Goeke 13
Raising the Temperature• Simplest method:accumulate heatcreated byradioactive decay
• Mantle has a lowamountradioactivematerial, so itwould take 107
years to raise aperidotite 1°C—thermalconductivity ofrocks woulddissipate the heatlong beforeanything melted
Figure 10-3. Melting by raising the temperature. From Winter (2001).
2/25/02 Petrology-Spring 2002, Goeke 14
• Any melt produced would also take the U, Th, K with it, sothat further radioactive decay would not occur
• A great deal of heat would be required to cause 20-25%partial melting, so this method is probably very unlikely
Figure 10-3. Melting byraising the temperature.From Winter (2001).

8
2/25/02 Petrology-Spring 2002, Goeke 15
• Hot spots seem to be the exception to the lower geothermalgradient—high heat flow characterizes these limited areavolcanic sites– Origin of hot spots not well known, but they are
currently assumed to come from near the mantle-coreboundary
– Only local phenomena, so we need another method toproduce the vast majority of our basalts
– (We’ll talk about them in chp 14)
2/25/02 Petrology-Spring 2002, Goeke 16
Lowering the Pressure• If we could lowerthe pressure whilekeeping the rocks ata constanttemperature, therocks would melt
• Adiabatic =conductive heatloss is zero
• Pure adiabaticprocess in unlikely,but we could comefairly close andonce meltingbegins, excess heatwill be used toxtallize minerals
Figure 10-4. Melting by (adiabatic) pressure reduction. Melting begins when theadiabat crosses the solidus and traverses the shaded melting interval. Greendashed lines represent approximate % melting. From Winter (2001).

9
2/25/02 Petrology-Spring 2002, Goeke 17
• The rising material would have to move quickly in order toavoid losing heat
• Decompression melting = upwelling mantel material thatdiverges from the solidus slowly and produces limitedquantities of melt
• Where can we reduce the pressure?– At divergent plate boundaries
• To produce 20-30% partial melt need for mid-ocean ridgebasalts (MORB), the mantle material would have to risebetween 215-250 km
2/25/02 Petrology-Spring 2002, Goeke 18
Adding Volatiles• Some mantlexenoliths do haveeither biotite oramphibole, whichmeans some H2O ispresent in themantle—less than 0.1wt. % normally andnot uniformlydistributed
• Also could have CO2present (chp 19)
• Research has beendone with H2O-saturated peridotite,but we are unlikely tohave that much H2OFigure 10-4. Dry peridotite solidus compared to several experiments on H2O-saturated peridotites. From Winter (2001)

10
2/25/02 Petrology-Spring 2002, Goeke 19
• What we need to meltthe mantle:
– Free H2O (not inminerals)
– T&P conditions tomelt H2O-saturatedlherzolite
• (a): 2 is met, but not 1• (b): both 1& 2 are met,
so that’s where oceanicmantle melts
Figure 10-6 Phase diagram (partly schematic) for ahydrous mantle system, including the H2O-saturatedlherzolite solidus of Kushiro et al. (1968), thedehydration breakdown curves for amphibole(Millhollen et al., 1974) and phlogopite (Modreskiand Boettcher, 1973), plus the ocean and shieldgeotherms of Clark and Ringwood (1964) andRingwood (1966). After Wyllie (1979). In H. S. Yoder(ed.), The Evolution of the Igneous Rocks. FiftiethAnniversary Perspectives. Princeton UniversityPress, Princeton, N. J, pp. 483-520. From Winter(2001)
2/25/02 Petrology-Spring 2002, Goeke 20
• (c): where melting will occurif biotite instead of amph ispresent in the oceanic mantle
• (d): 1 is met, but not 2• (e): where melting will occur
for shield mantle if amph ispresent—just slightly higherif biotite is present
• Shield geotherm is lowerthen continental, becauseshields are ancient
• Only about 1% meltproduced, so notenough—but may be enoughto explain the low velocityzone

11
2/25/02 Petrology-Spring 2002, Goeke 21
Summarizing
• Limited volatiles cause reduced amounts of possible meltproduction—different case at subduction zones, but we’lltalk about that in chp 16 & 17
• Increasing the temperature is not realistic except at hotspots, ascending areas of convection cells, or rising diapirs
• Pressure reduction is probable at rifts, MORs, or inassociation with any rapid rising material
• Now we need to see if we can get the range of magmasfound at the surface of the Earth from these partiallymelted mantle rocks
2/25/02 Petrology-Spring 2002, Goeke 22
Different Basalts-Same Mantle• We have assumed that the composition is constant, so the
variance in our system must be pressure and/ortemperature
• Though the chemical composition of the mantle is fairlyconstant, we did find mineralogical differences—thesewould translate into different partial melts when they reachthe solidus, because it depends on the mineralogy to definewhat will melt first, second, etc.
• Based on the work we did in chp 7, we know that changingthe pressure will also change where the eutecticcomposition lies on a diagram
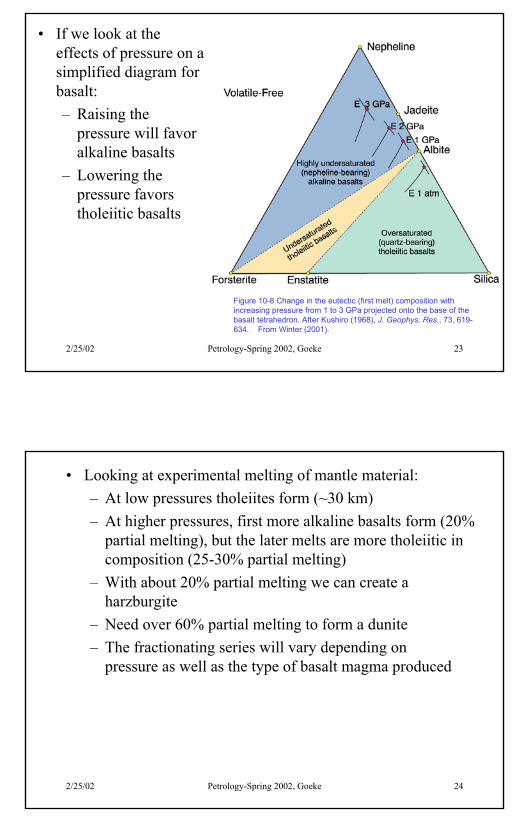
12
2/25/02 Petrology-Spring 2002, Goeke 23
• If we look at theeffects of pressure on asimplified diagram forbasalt:– Raising the
pressure will favoralkaline basalts
– Lowering thepressure favorstholeiitic basalts
Figure 10-8 Change in the eutectic (first melt) composition withincreasing pressure from 1 to 3 GPa projected onto the base of thebasalt tetrahedron. After Kushiro (1968), J. Geophys. Res., 73, 619-634. From Winter (2001).
2/25/02 Petrology-Spring 2002, Goeke 24
• Looking at experimental melting of mantle material:– At low pressures tholeiites form (~30 km)– At higher pressures, first more alkaline basalts form (20%
partial melting), but the later melts are more tholeiitic incomposition (25-30% partial melting)
– With about 20% partial melting we can create aharzburgite
– Need over 60% partial melting to form a dunite– The fractionating series will vary depending on
pressure as well as the type of basalt magma produced
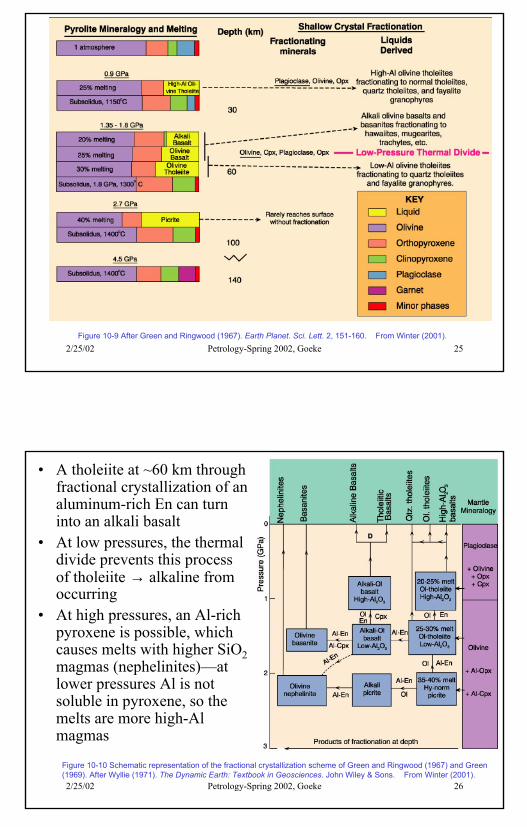
13
2/25/02 Petrology-Spring 2002, Goeke 25Figure 10-9 After Green and Ringwood (1967). Earth Planet. Sci. Lett. 2, 151-160. From Winter (2001).
2/25/02 Petrology-Spring 2002, Goeke 26
• A tholeiite at ~60 km throughfractional crystallization of analuminum-rich En can turninto an alkali basalt
• At low pressures, the thermaldivide prevents this processof tholeiite → alkaline fromoccurring
• At high pressures, an Al-richpyroxene is possible, whichcauses melts with higher SiO2magmas (nephelinites)—atlower pressures Al is notsoluble in pyroxene, so themelts are more high-Almagmas
Figure 10-10 Schematic representation of the fractional crystallization scheme of Green and Ringwood (1967) and Green(1969). After Wyllie (1971). The Dynamic Earth: Textbook in Geosciences. John Wiley & Sons. From Winter (2001).

14
2/25/02 Petrology-Spring 2002, Goeke 27
Quick Summary• Depth of partial melting & segregation, degree of partial
melting, and amount & type of volatile phase will alleffect the composition of the primary basaltic magma
• Fractional crystallization subsequent to the segregationwill also influence a basalt’s composition
• Tholeiites are either formed at low pressures or due toolivine fractionation of magmas formed a greater depths;alkaline are due to low degrees of partial melting andhigher pressures
• H2O will favor tholeiites—CO2 favors alkalines
2/25/02 Petrology-Spring 2002, Goeke 28
Primary Magmas• Several criteria to determine a magma is not primary, but
nothing to prove a magma is!– Simplest: low SiO2, high Mg/(Mg+Fe), low alkalias,
high extrusion temp– MgO/(MgO+FeO) = 0.66-0.75– Cr > 1000 ppm– Ni > 400-500 ppm– Multiply saturated
• Melts that form at eutectic points (i.e.what the firstmelt from a partially melted rock should be), shouldbe saturated in 2+ minerals
• Saturation depends on eutectic location which isdetermined by pressure

15
2/25/02 Petrology-Spring 2002, Goeke 29
Figure 10-12 Anhydrous P-T phase relationships for a mid-ocean ridge basalt suspected of being a primary magma.After Fujii and Kushiro (1977). Carnegie Inst. Wash. Yearb.,76, 461-465. From Winter (2001).
ol → ol + plag
cpx →cpx + plag →ol + cpx + plag
ol + plag + opx + plagMultiply saturated!
2/25/02 Petrology-Spring 2002, Goeke 30
Chemical Models of Mantle
• Fertile or enriched = xenolith with higher concentrationsof Al, Ca, Ti, Na, and K along with lower Mg/(Mg + Fe)and Cr/(Cr + Al) ratios– Potential to release magam before becoming refractory– E.g. garnet & spinel lherzolites
• Depleted = xenolith at the other end of the spectrum froman enriched version– E.g. dunites
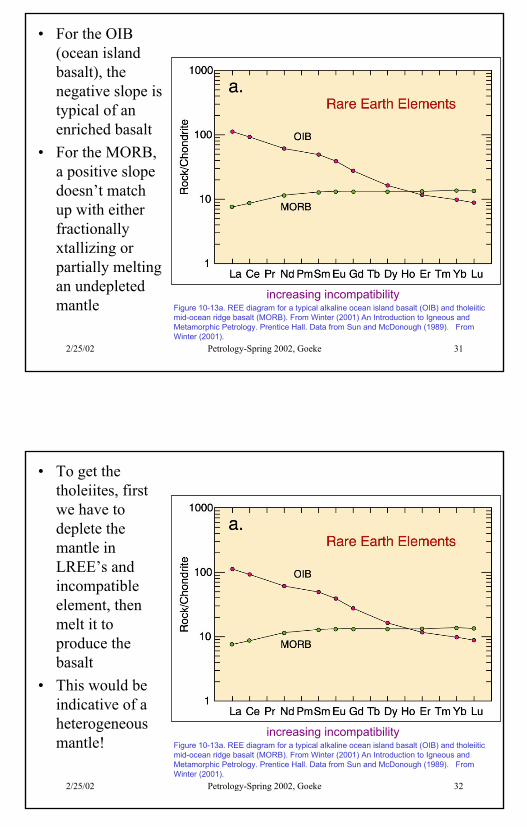
16
2/25/02 Petrology-Spring 2002, Goeke 31
• For the OIB(ocean islandbasalt), thenegative slope istypical of anenriched basalt
• For the MORB,a positive slopedoesn’t matchup with eitherfractionallyxtallizing orpartially meltingan undepletedmantle Figure 10-13a. REE diagram for a typical alkaline ocean island basalt (OIB) and tholeiitic
mid-ocean ridge basalt (MORB). From Winter (2001) An Introduction to Igneous andMetamorphic Petrology. Prentice Hall. Data from Sun and McDonough (1989). FromWinter (2001).
increasing incompatibility
2/25/02 Petrology-Spring 2002, Goeke 32
• To get thetholeiites, firstwe have todeplete themantle inLREE’s andincompatibleelement, thenmelt it toproduce thebasalt
• This would beindicative of aheterogeneousmantle! Figure 10-13a. REE diagram for a typical alkaline ocean island basalt (OIB) and tholeiitic
mid-ocean ridge basalt (MORB). From Winter (2001) An Introduction to Igneous andMetamorphic Petrology. Prentice Hall. Data from Sun and McDonough (1989). FromWinter (2001).
increasing incompatibility

17
2/25/02 Petrology-Spring 2002, Goeke 33
• Looking at trace element datafor various mantle rockssupports this heterogeneous idea
• For spinel & garnet lherzoliteseither a positive or a negativesloping pattern is possible
• If the mantle really were thesame composition as chondrites(what we’re standarizing to),then these lines should have aslope of zero—the mantle rocksmust have been enriched inLREEs from either melts orfluids from below
Figure 10-14 Chondrite-normalized REE diagrams for spinel (a)and garnet (b) lherzolites. After Basaltic Volcanism Study Project(1981). Lunar and Planetary Institute. From Winter (2001).
LREE enriched
LREE depletedor unfractionated
LREE depletedor unfractionated
LREE enriched
2/25/02 Petrology-Spring 2002, Goeke 34
• We can also use isotopes to differentiate between depleted &enriched mantle compositions—in this case 143N/144Nd and 87Sr/86Sr
• Probably represents mixing of a depleted and a non-depletedmagma to make up the compositions in the middle
Figure 10-15 (a) Initial143Nd/144Nd vs. 87Sr/86Sr foroceanic basalts. From Wilson(1989). Igneous Petrogenesis.Unwin Hyman/Kluwer. Datafrom Zindler et al. (1982) andMenzies (1983). From Winter(2001)
enriched
depleted
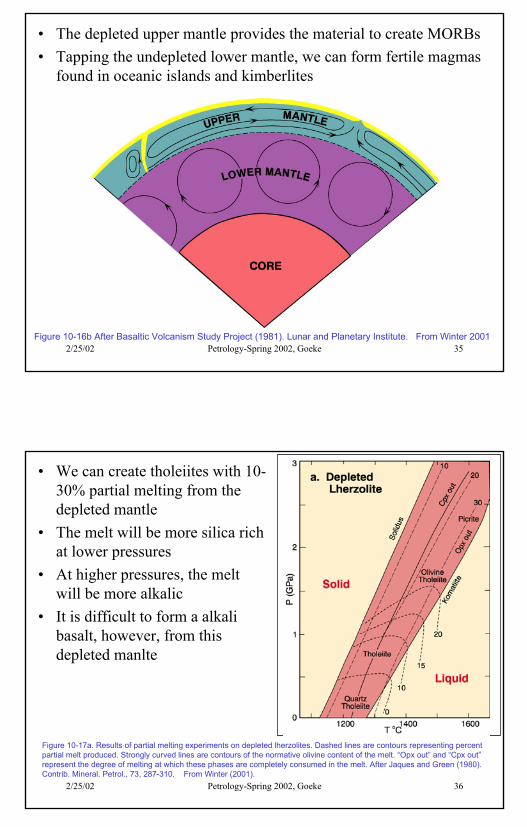
18
2/25/02 Petrology-Spring 2002, Goeke 35
• The depleted upper mantle provides the material to create MORBs• Tapping the undepleted lower mantle, we can form fertile magmas
found in oceanic islands and kimberlites
Figure 10-16b After Basaltic Volcanism Study Project (1981). Lunar and Planetary Institute. From Winter 2001
2/25/02 Petrology-Spring 2002, Goeke 36
• We can create tholeiites with 10-30% partial melting from thedepleted mantle
• The melt will be more silica richat lower pressures
• At higher pressures, the meltwill be more alkalic
• It is difficult to form a alkalibasalt, however, from thisdepleted manlte
Figure 10-17a. Results of partial melting experiments on depleted lherzolites. Dashed lines are contours representing percentpartial melt produced. Strongly curved lines are contours of the normative olivine content of the melt. “Opx out” and “Cpx out”represent the degree of melting at which these phases are completely consumed in the melt. After Jaques and Green (1980).Contrib. Mineral. Petrol., 73, 287-310. From Winter (2001).

19
2/25/02 Petrology-Spring 2002, Goeke 37
• Tholeiites possible from meltscreated at higher pressures for theenriched then the depleted mantle
• Alkaline basalts can be created bypartially melting 5-20% of theenriched mantle
Figure 10-17b. Results of partial melting experiments onfertile lherzolites. After Jaques and Green (1980). Contrib.Mineral. Petrol., 73, 287-310. From Winter (2001).

1
2/27/2002 Petrology-Spring 2002, Goeke 1
Diversification of Magmas
Chapter 11
2/27/2002 Petrology-Spring 2002, Goeke 2
• There are more than just basalts on the Earth, so how do we createthese other magmas?
• Can we form these other magmas by processes of diversification ordo we have to re-evaluate our thoughts on primary magmas?
• What kinds of diversification are possible?– Partial melting– Magmatic differentiation
• Fractional crystallization• Volatile transport• Liquid immiscibility
– Magma mixing– Assimilation– Boundary layers– In situ crystallization– Compositional convection

2
2/27/2002 Petrology-Spring 2002, Goeke 3
Partial Melting
• First melt is always at the eutectic point• You have to attain some minimum value of melt, before
the melt can segregate from the solid (values in theliterature range quite a bit)– Lower viscosity = less melt needed to segregate– More deformation = less melt needed
2/27/2002 Petrology-Spring 2002, Goeke 4
Magmatic Differentiation• Magmatic differentiation = any process by which magma is able
to diversify and produce a magma or rock of a differentcomposition; involves two processes:
– Creation of compositional differences between 1+ phases• Elements partition due to an intensive variable change (e.g.
pressure, temperature, composition)• Partitioning determines the trend of differentiation
– Fractionation = physical process by which different portionsare mechanically separated• Preserves the chemical differences• Effectiveness determines the extent of the differentiation• Depends on density, viscosity, and size/shape• Can be liquid-solid, liquid-liquid, or liquid-vapor

3
2/27/2002 Petrology-Spring 2002, Goeke 5
Fractional Crystallization• Traditional differentiation method• Since most magmas are found to be multiply saturated at low
pressures, this is indication of magma re-equilibration via crystalfractionation as the magma traveled to the surface
• We can analyze for fractionization via variation diagrams• Gravity settling = differential motion of crystals and liquid under
the influence of gravity due to their difference in density (e.g.Bowen saw olivine phenocrysts sinking in his melt experiments)– Cumulate texture (chapter 3) is commonly found due to
gravity settling—normally apparent in thick sills and layeredmafic intrusions
– Accepted method since Bowen (1928) suggested it, but morerecent work has questioned the probability of it working
2/27/2002 Petrology-Spring 2002, Goeke 6
• This variation diagram shows a linear relationship between the mostprimitive glass (stars), olivine extracted (dots to the right of theline), and the resulting magmas (dots to the left of the line)
Figure 11-2 Variation diagram using MgO as the abscissa for lavas associated with the 1959 Kilauea eruption in Hawaii. AfterMurata and Richter, 1966 (as modified by Best, 1982) From Winter (2001).
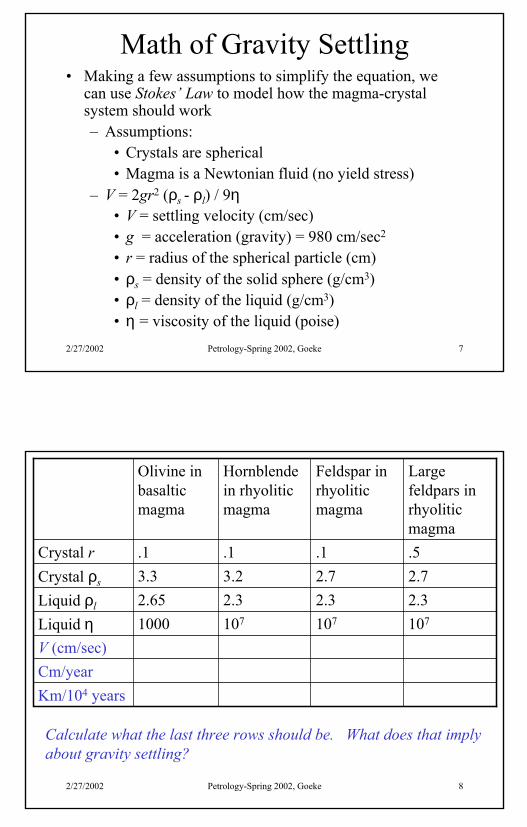
4
2/27/2002 Petrology-Spring 2002, Goeke 7
Math of Gravity Settling• Making a few assumptions to simplify the equation, we
can use Stokes’ Law to model how the magma-crystalsystem should work– Assumptions:
• Crystals are spherical• Magma is a Newtonian fluid (no yield stress)
– V = 2gr2 (ρs - ρl) / 9η• V = settling velocity (cm/sec)• g = acceleration (gravity) = 980 cm/sec2
• r = radius of the spherical particle (cm)• ρs = density of the solid sphere (g/cm3)• ρl = density of the liquid (g/cm3)• η = viscosity of the liquid (poise)
2/27/2002 Petrology-Spring 2002, Goeke 8
Km/104 yearsCm/yearV (cm/sec)
1071071071000Liquid η2.32.32.32.65Liquid ρl
2.72.73.23.3Crystal ρs
.5.1.1.1Crystal r
Largefeldpars inrhyoliticmagma
Feldspar inrhyoliticmagma
Hornblendein rhyoliticmagma
Olivine inbasalticmagma
Calculate what the last three rows should be. What does that implyabout gravity settling?

5
2/27/2002 Petrology-Spring 2002, Goeke 9
Km/104
years
Cm/yearV (cm/sec)Liquid ηLiquid ρl
Crystal ρs
Crystal r
~4100410240.001310002.653.3.1
Olivineinbasalticmagma
~0.66.312 x 10-7
107
2.33.2.1
Hornblendein rhyoliticmagma
~0.272.758.7 x 10-8
107
2.32.7.1
Feldsparinrhyoliticmagma
~6.969.432.2 x 10-6
107
2.32.7.5
Largefeldparsinrhyoliticmagma
10002.72.7.1
Plag inbasalticmagma
How about plagioclase crystals in an Fe-rich basaltic magma?
2/27/2002 Petrology-Spring 2002, Goeke 10
Km/104
years
Cm/yearV (cm/sec)Liquid ηLiquid ρl
Crystal ρs
Crystal r
~4100410240.001310002.653.3.1
Olivineinbasalticmagma
~0.66.312 x 10-7
107
2.33.2.1
Hornblendein rhyoliticmagma
~0.272.758.7 x 10-8
107
2.32.7.1
Feldsparinrhyoliticmagma
~6.969.432.2 x 10-6
107
2.32.7.5
Largefeldparsinrhyoliticmagma
0!0!0!10002.72.7.1
Plag inbasalticmagma
What if the magma was even more Fe-rich (e.g. greater density)?

6
2/27/2002 Petrology-Spring 2002, Goeke 11
• Problems we need to consider based on our assumptions:– Crystals are very rarely spherical—and though other
crystal shapes will settle slower, its difficult to calculatehow much slower
– The assumption that magmas behave like Newtonianfluids is probably only true for basaltic liquids near theirliquidus’ temperatures
• The addition of crystals to the liquids will raise theyield strength
• Experimental calculations for a basalt at 1195° C(McBirney and Noyes, 1979) found a yield strength of60 Pa—requiring an olivine to be several cm indiameter before it could sink!
• The more viscous liquid, the higher the yield strength• Thus gravity settling may only be reasonable for a
mafic magmas near their liquidus temperatures
2/27/2002 Petrology-Spring 2002, Goeke 12
• The math would indicate that only more mafic magmaswould be capable of crystal settling, however evidence forfractional crystallization exists in various silicic bodies:– Evolution of magma bodies over time towards the
minimum eutectic composition– Bivariate diagrams that show progressive
diversification• How can fractional crystallization occur without crystal
settling?

7
2/27/2002 Petrology-Spring 2002, Goeke 13
• Diagram showingthe eutectic point forgranitic magmas ona Qtz-Ab-Ordiagram, whichindicates how theeutectic continuallymoves towards Qtzas the pressurelowers (lines)
• The various dots &shaded areas are thecomposition of mostmagmas, showing aprogression from thehigher P eutectic tothe low P eutectic
Figure 11-3 Position of the H2O-saturated ternary eutectic in the albite-orthoclase-silica system at various pressures. The shaded portion represents the compositionof most granites. Included are the compositions of the Tuolumne Intrusive Series(Figure 4-32), with the arrow showing the direction of the trend from early to latemagma batches. Experimental data from Wyllie et al. (1976). From Winter (2001).
2/27/2002 Petrology-Spring 2002, Goeke 14
• Three possible alternatives to crystal settling:– Filter pressing (compaction) = crystal-liquid system
is squeezed like a sponge—liquid migrates from thecompacted solids out into “open” space• The amount of liquid can range up to 60 vol. %• Can also work in a crystal-laden mush that is
constricted—liquid can move on while the crystalsget “left” behind
– Flow segregation = process by which crystals areconcentrated away from country rock walls in orderto reduce grain dispersive pressure• Motion of magma past stationary country rock
walls causes shear due to the velocity gradient• This differential motion forces magma to flow
around phenocrysts causing pressure constrictionswhen grains are near one another

8
2/27/2002 Petrology-Spring 2002, Goeke 15
• Grain dispersive pressure =pressure that forces grainsapart and away from thecontact caused bydifferential velocities– Effect greatest near
boundary walls anddrops off quicklytowards the center of themagma body
– Requires flow to beparallel (or nearlyparallel) to the countryrock-magma contact
Figures 11-4 Drever and Johnston (1958). Royal Soc.Edinburgh Trans., 63, 459-499. From Winter (2001).
2/27/2002 Petrology-Spring 2002, Goeke 16
– Causes phenocrysts toconcentrate away fromwalls
• Can only produce smallproportion of thediversification seen
– Separation & rise of buoyantliquids from boundary layers• Crystals form in situ
(without moving)
Figures 11-5 Relative grain size and concentration of olivinephenocrysts in small dikes on the Isle of Skye. Drever andJohnston (1958). Royal Soc. Edinburgh Trans., 63, 459-499.From Winter (2001).

9
2/27/2002 Petrology-Spring 2002, Goeke 17
• A few more considerations:– The old model of a magma chamber considered the
system to be isobaric, but more modern views see themagma rising during differentiation
• Changes in which minerals are stable depending onpressure (e.g. garnet to spinel to plagioclase)
• Shift of eutectic point with pressure (e.g. ↓ P = ↑ inthe olivine field)
– Fractional crystallization can’t form all of the magmasfound on the Earth
– The amount of basalt need to fractionate to form agranite is ~20:1—where did the basalt go that formedthe huge granite batholiths commonly found out west?
– Fractional crystallization important, but something elsemust also be at work to provide for all of the differentmagmas
2/27/2002 Petrology-Spring 2002, Goeke 18
Volatile Transport• Chemical differentiation can also occur in the presence
of a free-fluid phase• There are several ways to have a free-fluid phase:
– Heating hydrated or carbonated wall rocks– Release of a fluid phase due to decompression of a
melt (lower pressure, less fluid a melt can dissolve)– Advanced fractional crystallization will concentrate
the dissolved fluid within the melt until it becomessaturated and forms a free phase• Occurs due to the fact the primary minerals to
crystallize are anhydrous• The fluid phase will have a lower density then the
surrounding melt and will rise to concentrate near theroof of the magma chamber

10
2/27/2002 Petrology-Spring 2002, Goeke 19
• The elements in the system will partition themselvesbetween the free-fluid and the magma– Produces a silica-saturated vapor phase and a vapor-
saturated silicate phase– Vapor phase may include:
• H2O, CO2, S, Cl, F, B, and P• Incompatible (LIL) and chalcophile elements
• Release of a free-fluid phase may result in an increase inpressure—causes fracturing of the roof rock in shallowintrusions– Vapor phase & late melt may escape along the fractures
and crystallize– Dikes/Sills commonly consists of quartz & feldspar
with a “sugary” texture = aplite
2/27/2002 Petrology-Spring 2002, Goeke 20
• Pegmatite is technically a textural descriptive word, butmost pegmatites are formed by the following method:– Large grain size is due to poor nucleation and very high
diffusivity in the H2O-rich phase– “simple pegmatite” = essentially a coarse granite– More complex pegmatites contain large concentrations
of incompatible elements & a wide variety of mineralphases
• Commonly displays a concentric zonation• Vapors may cool and crystallize low-temperature minerals
(e.g. sulfides)• Miarolitic pods or cavities = small fluid segregations
trapped within a plutonic host– They appear to be coarse mineral clusters (several cm
across) when exposed at the surface

11
2/27/2002 Petrology-Spring 2002, Goeke 21
– Centers of the pods are hollow voids and minerals may extendinto them
• Since the presence of H2O within a magma lowers the meltingtemperature, removing H2O suddenly may cause rapidcrystallization of the magma with no temperature change—causeporphyritic texture!
Figure 11-6 Sections of three zonedfluid-phase deposits (not at the samescale). a. Miarolitic pod in granite(several cm across). b. Asymmetriczoned pegmatite dike with aplitic base(several tens of cm across). c.Asymmetric zoned pegmatite withgranitoid outer portion (several metersacross). From Jahns and Burnham(1969). Econ. Geol., 64, 843-864.From Winter (2001).
2/27/2002 Petrology-Spring 2002, Goeke 22
LiquidImmiscibility
• Caused by two liquids thatwill not mix (e.g. oil andwater), though they willhomogenize at highertemperatures
• On the Fo-Si diagram, wehad an immiscibility gapwhich produced twoliquids
• Problems:– Liquid immiscibility
occurs at >1700° C inthe Fo-Si system Figure 6-12. Isobaric T-X phase diagram of the system Fo-Silica at 0.1
MPa. After Bowen and Anderson (1914) and Grieg (1927). Amer. J. Sci.From Winter (2001).

12
2/27/2002 Petrology-Spring 2002, Goeke 23
– The gapdoesn’t existwhen alkalis+ Al + Caare added!
• Though popularup into the early1900’s, theseproblems soondropped theconcept downto “old idea”status
Figure 7-4. Isobaric diagramillustrating the cotectic andperitectic curves in the systemforsterite-anorthite-silica at 0.1MPa. After Anderson (1915) A.J. Sci., and Irvine (1975) CIWYearb. 74. From Winter (2001).
2/27/2002 Petrology-Spring 2002, Goeke 24
• Renewed interestcame in the 50’safter Roedder’sdiscovery of alow-temperatureimmiscibility gapin the fayalite-leucite-silicasystem—possible in Fe-richmagmas
• Roedder (‘71)also pointed outdozens of naturalimmiscibilityreferencesincluding quite afew moon rocks
Figure 11-7. Two immiscibility gaps in the system fayalite-leucite-silica (after Roedder,1979). Yoder (ed.), The Evolution of the Igneous Rocks. Princeton University Press. pp.15-58. Projected into the simplified system are the compositions of natural immisciblesilicate pair droplets from interstitial Fe-rich tholeiitic glasses (Philpotts, 1982). Contrib.Mineral. Petrol., 80, 201-218. From Winter (2001).

13
2/27/2002 Petrology-Spring 2002, Goeke 25
• There are three magmatic systems that have immiscibleliquids:
– Fe-rich tholeiitic basalts, which during late stages offractionization have a “granitic” melt (>75% SiO2)separate from the basalt melt (~40% SiO2)• Density differences would normally cause separation,
but may be countered by the high crystal content thatprevents magma movement
• Droplets found in interstitial glass support the idea ofimmiscible melts, but separation of the two liquids isless obvious
• May work fine for late-stage mafic systems (e.g. topsof Palisades Sill or Skaergård intrusion), but unlikelyfor large-scale granitic bodies
– Sulfide-rich silicate magmas also separate into a sulfide-rich liquid and a sulfide-saturated silicate liquid
2/27/2002 Petrology-Spring 2002, Goeke 26
• It only takes <0.1% sulfur to over-saturate asilicate melt, so the formation of a secondary iron-sulfide melt containing Cu, Ni, other chalcophileelements is fairly easy
• Massive sulfide segregations have formed largeportions of layer mafic complexes and areeconomically important
– The presence of CO2 in an alkaline melt can alsocause the separation of the melt into two phases: onesilica- & alkali-rich and the other carbonate-rich
• Causes the nephelinite-carbonatite relationship,which is talked about in section 19.2.5.2 of Winter(2001)
– There are also possibilities of liquid separation inlamprohyres, komatiites, lunar mare, and some othervolcanics

14
2/27/2002 Petrology-Spring 2002, Goeke 27
Tests for Liquid Immiscibility
• Either the magmas must be immiscible uponexperimental heating or plot on the boundaries of aknown gap
• The two liquids must be in equilibrium with the sameminerals, since they’re in equilibrium with each other
• Partitioning of trace and major elements must follow therules discussed in chapters 8 & 9
• Though immiscibility is now well-accepted, it still is nota likely candidate for producing a large percentage of theevolved magmatic rocks found on the Earth
2/27/2002 Petrology-Spring 2002, Goeke 28
Magma Mixing• At the beginning of the 20th century, one hypothesis for
producing the wide variety of magmas found was theconcept of magma mixing– If there were two primary magma types, one derived
from the mantle (basaltic) and one from the crust(rhyolitic), then all the magmas of intermediatecomposition could be created by mixing the two end-members
– Bowen’s fractional crystallization caused the waning ofthis idea
– But, as all things go, the current literature is returningto ideas of magma mixing to explain some systems

15
2/27/2002 Petrology-Spring 2002, Goeke 29
• We should be able to test for magma mixing on variationdiagrams, though once again, this can’t prove one processoccurred
• Textural evidence may be the best way to distinguish afractionally crystallized melt from a magma-mixing melt
• Magma mixing depends on:– Viscosity, temperature, composition, and volatile
content– Location and turbulence with which one magma enters
the chamber• Comingled = swirls of two magmas that have such
different properties that they don’t become onehomogenous liquid
2/27/2002 Petrology-Spring 2002, Goeke 30
Basalt pillowsaccumulating at the bottom
of a in granitic magmachamber, Vinalhaven
Island, Maine
Comingled basalt-RhyoliteMt. McLoughlin, Oregon
Figure 11-8 and 11-9. From Winter (2001)An Introduction to Igneous andMetamorphic Petrology. Prentice Hall

16
2/27/2002 Petrology-Spring 2002, Goeke 31
• The most probably occurence of magma mixing is in thereplenishment of evolved magma chambers by moreprimitive magmas injected in from below; evidence:– Structure: cross-cutting dikes and layers– Minerals: going back up a liquid line of descent; maybe
becoming too hot to crystallize one phase previouslysaturated
– Texture: phenocryst resorption; zoning reversals– Geochemical: reverses on variation diagrams– Isotopes: changes in the proportions of ions
2/27/2002 Petrology-Spring 2002, Goeke 32
Assimilation
• Assimilation = incorporation of chemical components ofthe wall or roof rock into the magma
• Depending on the country rock composition, this candrastically change the composition of the magma—traceelements more sensitive than majors/minors
• Evidence: altered and resorbed contacts and the presenceof xenoliths
• The extent of assimilation will depend on the amount ofheat the magma can donate to the project of melting thecountry rock
17
2/27/2002 Petrology-Spring 2002, Goeke 33
What’s left?• Recent petrologists have come up with a few other ideas about how
differentiation can occur—most of them involving in situ processes• An important concept (that was developed by a Swiss chemist Soret)
deals with the thermal diffusion or Soret effect– In a stagnant homogeneous binary solution, a concentration
gradient will form when the solution is subjected to atemperature gradient
– The heavier element will “drift” towards the cooler end and thelighter elements towards the warmer end
– This will lower the overall energy of the solution, which makesit more stable
– Has been experimentally seen in basaltic magmas (Walker et al.,1981; and Walker and DeLong, 1982) for gradients of 50°C/mm—not realistic in “real situations”
2/27/2002 Petrology-Spring 2002, Goeke 34
• It is assumed that the volcanic material that spewed outfirst was at the top of the magma chamber and the lastmaterial to be erupted was at the bottom of the chamber– Looking at the variation in a volcanic sequence, then,
might reveal magma chamber layering– Field & lab work on this basis has suggested for several
silicic chambers that stratification into layers occurred

18
2/27/2002 Petrology-Spring 2002, Goeke 35
Figure 11-12Formation ofboundary layersalong the wallsand top of amagma chamber.From Winter(2001) AnIntroduction toIgneous andMetamorphicPetrology.Prentice Hall
• Zoned wall boundarylayers and stratifiedcap boundary layershave also beenobserved and areprobably caused bywater saturation of theadjacentmagma—more H2O,more buoyant—or bysimply cooling themagma near thecontact quickerthen—less temp is alsomore buoyant
2/27/2002 Petrology-Spring 2002, Goeke 36
Figure 11-11. Schematic section through a rhyolitic magma chamber undergoing convection-aided in-situdifferentiation. After Hildreth (1979). Geol. Soc. Amer. Special Paper, 180, 43-75. From Winter (2001).
• Idea of compositional gradients based on H2O-enrichmentof the melt directly in contact with wall-rock—melt risesand forms a non-convecting fluid-rich melt cap

19
2/27/2002 Petrology-Spring 2002, Goeke 37
Mixing Processes
• As in all things, most systems probably have multipledifferentiation processes occurring at the same time

1
3/18/02 Petrology-Spring 2002, Goeke 1
Mid-Ocean Ridges
Chapter 13
3/18/02 Petrology-Spring 2002, Goeke 2
Mid-Ocean Ridges (MOR)• MORs stand about 1-3 km above the abyssal plain and are
about 2000 km wide• Together, the ridges form a continuous chain of volcanic
mountains that is about 65,000 km long• Volcanism and topography are normally symmetrical
across the MOR parallel to the rift direction, but thisdoesn’t have to always hold true
• MORs are also high-activity seismic areas and high heat-flow areas
• Spreading rates at MORs also range from < 3 cm/year(slow) to > 4cm/year (fast)—the East Pacific is at 8-9cm/year and the Mid-Atlantic 1-2 cm/year

2
3/18/02 Petrology-Spring 2002, Goeke 3
Figure 13-1. After Minster et al. (1974) Geophys. J. Roy. Astr. Soc., 36, 541-576. From Winter (2001).
3/18/02 Petrology-Spring 2002, Goeke 4
• Slow vs. fast rifts look different• Slow-intermediate:
– Axial valley are 30-50 km wide, 1-5 km deep– Step-like inward-facing scarps (similar to continental
rift valleys)– Inner rift valley = contained within the larger valley; 3-
9 km wide with a flat floor• Concentrated location of volcanism and crustal
extension• Fissure open and pillow lavas form on the flat floor• Constrained by the scarp walls, most of the flows
are parallel to the axial direction• Activity is not evenly distributed; volcanic mounds
>300 m high can form coalescing cones 10-20 kmlong

3
3/18/02 Petrology-Spring 2002, Goeke 5
• One formed, the cones are split (not symmetrically),dismembered by faulting, and carried away from theaxis
– Fast:• Smoother and less disrupted by large fault
displacements• Central rift valley is small/poorly developed/absent• Most segments have an axial summit caldera
– ~100 km high, few km wide, extends for manytens of km along the axis
• Zone of ~continuous volcanism 0.5-2 km wide• Center of ridge has small pillow lava hills, which are
flanked by smooth lava plains• Away from the ridge, the rocks are older (not
uniform) and more fractured
3/18/02 Petrology-Spring 2002, Goeke 6
• Huge amount of material has been produced at MORs– 1.4 x 10⁹ km3 for 140 Ma– 5% of the size of the upper mantle in 1.4 Ga– Can deplete the mantle to a great extent—may be
replenished by subduction• Fracture zones = sub-parallel large-scale zones that off-set
the ridges, which are perpendicular to the axis ridge– Transform faults = seismically active portion between
the major offset ridges; strike-slip faults
4
3/18/02 Petrology-Spring 2002, Goeke 7
Structure of MORs• Since it is difficult to sample all of the layers of the MOR
directly (we’ve never managed to drill all the way to theMoho), petrologists base quite a bit of our knowledge onophiolites
• We divide the MOR into 4 sections based on: 1. Ophiolitesand 2. Characteristic P-wave velocities
• Layer 1 = thin layer of pelagic sediment; absent on thenewly formed basaltic crust, but thickens as the basaltmoves away from the ridge
• Layer 2 = basaltic layer; subdivided into:– Layer 2A = pillow basalts; seismic studies suggest the
upper portion are porous, but lower portions have mostlikely been filled by diagenetic minerals
3/18/02 Petrology-Spring 2002, Goeke 8
– Layer 2B = vertical sheeted dikes; emplaced in theshallow brittle extensional environment through whichmagma reached the surface
• Layer 3 = gabbros; commonly assumed to havecrystallized from a shallow axial magma chamber– Layer 3A = uppermost isotropic gabbros & middle
gabbros, which are somewhat foliated (“transitional”)– Layer 3B = layered gabbros with common cumulate
textures• Layering can be either horizontal or dips up to 90°
– At the top of layer 3 in some of the ophiolite sequencesis a plagiogranite layer—small discontinuous dioriteand tonalite bodies
• Layer 4 = ultramafics– Upper portion is considered to be layered and is a
cumulate from the axial magma chamber

5
3/18/02 Petrology-Spring 2002, Goeke 9
– The lower portion is the original, unlayered, residualmantle material
• This brings up the question of where is the Moho– Seismic Moho = where P-wave velocities go from 7.3
km/s to 8.1 km/s; regardless of ultramafic origin– Petrologic Moho = top of the original ultramafics not
including those created by cumulate processes
3/18/02 Petrology-Spring 2002, Goeke 10
Figure 13-4.Modified afterBrown and Mussett(1993) TheInaccessible Earth:An Integrated Viewof Its Structure andComposition.Chapman & Hall.London.Figure 13-3.Lithology andthickness of atypical ophiolitesequence, based onthe SamialOphiolite in Oman.After Boudier andNicolas (1985)Earth Planet. Sci.Lett., 76, 84-92.From Winter(2001).
Proposed MORTypical Ophiolite

6
3/18/02 Petrology-Spring 2002, Goeke 11
MORB Petrography & Majors• If we could define a “typical” MORB, it would be:
– Olivine tholeiite– Low K2O (<0.2%)– Low TiO2 (<2.0%)– Glassy to phyric in texture (rarely gabbroic)– Common phenocrysts are:
• Plagioclase (An40-An88)• Olivine (Fo65-Fo91)• Mg-Cr spinel
– Groundmass = plagioclase and cpx microlites with a Fe-Ti oxidephase
• Glass samples are used to define the liquid composition, since thephyric samples may have been modified by crystal accumulation
3/18/02 Petrology-Spring 2002, Goeke 12
• Low pressureexperimental &textural dataindicates that thecrystallizationorder is: ol (± Mg-Cr spinel) → ol +plag (± Mg-Crspinel) → ol +plag + cpx
• Other sequenceswould be possiblewith differentcompositions,pressures, andfractionationprocesses Figure 7-2. After Bowen (1915), A. J. Sci., and Morse (1994), Basalts and Phase
Diagrams. Krieger Publishers. From Winter (2001).

7
3/18/02 Petrology-Spring 2002, Goeke 13
• Since Fe-Ti oxides are onlyin the groundmass, theyformed late
• MORBs have a range ofchemical compositions, butare still restrictive incomparison to otherpetrogenetic associations
• Note that quartz-hyperstheneare in the norm compositionand the very low K2O values
Table 13-2. Average Analyses and CIPW Norms of MORBs (BVTP Table 1.2.5.2)
Oxide (wt%) All MAR EPR IORSiO2 50.5 50.7 50.2 50.9TiO2 1.56 1.49 1.77 1.19Al2O3 15.3 15.6 14.9 15.2FeO* 10.5 9.85 11.3 10.3MgO 7.47 7.69 7.10 7.69CaO 11.5 11.4 11.4 11.8Na2O 2.62 2.66 2.66 2.32K2O 0.16 0.17 0.16 0.14P2O5 0.13 0.12 0.14 0.10Total 99.74 99.68 99.63 99.64
Normq 0.94 0.76 0.93 1.60or 0.95 1.0 0.95 0.83ab 22.17 22.51 22.51 19.64an 29.44 30.13 28.14 30.53di 21.62 20.84 22.5 22.38hy 17.19 17.32 16.53 18.62ol 0.0 0.0 0.0 0.0mt 4.44 4.34 4.74 3.90il 2.96 2.83 3.36 2.26ap 0.30 0.28 0.32 0.23All: Ave of glasses from Atlantic, Pacific and Indian Ocean ridges.MAR: Ave. of MAR glasses. EPR: Ave. of EPR glasses.IOR: Ave. of Indian Ocean ridge glasses.
3/18/02 Petrology-Spring 2002, Goeke 14
• Increase of FeO relative to MgOcharacteristic for tholeiites
• Compatible with fractionalcrystallization of:– Olivine: raise FeO/MgO ratio– Ca-plag: decrease Al2O3 and
CaO– However, the CaO/Al2O3 ratio
probably indicates the removalof another phenocryst beyondplag—perhaps cpx?—howeverthis trend does not alwaysoccur and may indicate onlyoccasional involvement
Figure 13-5. “Fenner-type” variation diagrams forbasaltic glasses from the Afar region of the MAR. Notedifferent ordinate scales. From Stakes et al. (1984) J.Geophys. Res., 89, 6995-7028. From Winter (2001).

8
3/18/02 Petrology-Spring 2002, Goeke 15
• Though considered earlier in igneous petrology to beuniform, MORBs obviously do vary some
• MORBs also show trends consistent with fractionalcrystallization—MORBs are not primary magmas– Fractional crystallization most likely took place in a
shallow magma chamber– Taking the increase in K2O, TiO2 and P2O5 of 200-
300%, we can calculate that 50-67% fractionalcrystallization might have occurred
– The MORBs are kept at intermediate compositionprobably through periodic injection of more primitivemagmas
3/18/02 Petrology-Spring 2002, Goeke 16
• Fast and slow ridges also showvariation in their compositions– Fast: broader compositional
range and a larger number ofevolved liquids
• Magmas that erupt off-axis are more evolved
– Variations also exist alongthe axes
Figure 13-8. Histograms of over 1600 glasscompositions from slow and fast mid-ocean ridges.After Sinton and Detrick (1992) J. Geophys. Res., 97,197-216. From Winter (2001).

9
3/18/02 Petrology-Spring 2002, Goeke 17
• To compare samples from different locations, we try to minimizethe effect of differing amounts of fractional crystallization bylooking at samples with the same Mg#—still have a wide variation,as seen in the K2O, TiO2, or P2O5 vs. Mg# diagrams
• Suggests that there are different MORB source regions!
Figure 13-9. Variation inK2O vs.. Mg# for MORBsfrom the Mid-Atlantic Ridge.Data from Schilling et al.(1983). From Winter (2001).
3/18/02 Petrology-Spring 2002, Goeke 18
• N-MORB = normal MORB; taps the depleted,incompatible-poor mantle
• E-MORB or P-MORB = enriched (“plume”) MORB; tapsdeeper, incompatible-richer mantle
• But does this really hold true for trace elements?

10
3/18/02 Petrology-Spring 2002, Goeke 19
MORB: Trace & Isotopes• Theredefinitely issomecorrelationbetweenLREE-depletionand N-MORBSand LREE-enrichmentand E-MORBS
Figure 13-10. Data from Schilling et al. (1983) Amer. J. Sci., 283, 510-586.From Winter (2001).
3/18/02 Petrology-Spring 2002, Goeke 20
• To look at the datafrom multiple analyses,we use ratios of variousREE’s and plot them ona variation diagram
• On a La/Sm vs. Mg#graph there are threefields:
– Blue squares = E-MORB (>1.5-1.8La/Sm)
– Green circles = T-MORB(“transitional”)
– Red triangles = N-MORB (<0.7La/Sm)
Figure 13-11. Data fromSchilling et al. (1983) Amer.J. Sci., 283, 510-586. FromWinter (2001).

11
3/18/02 Petrology-Spring 2002, Goeke 21
• T-MORBs are most likely just a result of mixing the othertwo
• Since isotopes won’t fractionate during partial melting orfraction crystallization, we should be able to use them toindicate source variations
Figure 13-12. Data from Ito etal. (1987) Chemical Geology,62, 157-176; and LeRoex etal. (1983) J. Petrol., 24, 267-318. From Winter (2001).
3/18/02 Petrology-Spring 2002, Goeke 22
• Though all the MORBs plot in the more depleted fieldfrom the bulk Earth, E-MORBs are relatively moreenriched then N-MORBs
• Note the difference between Atlantic and Pacific N-MORBs—why do you think that exists?
Figure 13-12. Data from Ito etal. (1987) Chemical Geology,62, 157-176; and LeRoex etal. (1983) J. Petrol., 24, 267-318. From Winter (2001).

12
3/18/02 Petrology-Spring 2002, Goeke 23
How do MORBs form?• Let’s go back toour REE data tohelp us decidewhat the parentrock of theMORB might be
• Assuming we’rein one of the fourlherzolite fields,what are ouroptions foraluminous phases?How would theymanifestthemselves on thisdiagram?
Figure 13-10. Data from Schilling et al. (1983) Amer. J. Sci., 283,510-586. From Winter (2001).
No Eu anomaly-no plag
HREE isn’tdepleted-no garnet
3/18/02 Petrology-Spring 2002, Goeke 24
• Experimental results to discover where opx + cpx + olivineare multiply saturated are 0.8-1.2 Ga
• How deep is that?• Does it correspond to the phase you chose based on the
REE data?• And this means?
– Multiple saturation = last point melt in equilibrium withthe solid mantle phases—controls major elements &mineralogy
• Separation depth = minimum depth of origin– Incompatible trace & isotopes = equilibrium with the
ultimate source reservoir
25-35 km

13
3/18/02 Petrology-Spring 2002, Goeke 25
• As the magma partially melts andseparates, what do you envisionoccurring to it? What lies beneaththe MOR?
Figure 13-14. From Byran and Moore (1977) Geol. Soc. Amer. Bull., 88, 556-570. Figure 13-15. AfterPerfit et al. (1994) Geology, 22, 375-379. From Winter (2001)
3/18/02 Petrology-Spring 2002, Goeke 26
Figure 13-16 After Sinton and Detrick (1992) J. Geophys. Res., 97, 197-216. From Winter(2001).
Along strike—only pockets of magma, explaining why onlysome portions of the ridge erupt.

14
3/18/02 Petrology-Spring 2002, Goeke 27
Also have a different idea for the rare-erupting slow ridge.
Distance (km)10 105 50
2
4
6
8
Dep
th (k
m)
Moho
Transitionzone
Mush
Gabbro
Rift ValleyFigure 13-16 AfterSinton and Detrick(1992) J. Geophys.Res., 97, 197-216.From Winter(2001).

1
3/18/02 Petrology-Spring 2002, Goeke 1
Subduction—Island Arcs
Chapter 16
3/18/02 Petrology-Spring 2002, Goeke 2
• Subduction-related volcanism is distinctively differentfrom the mainly basaltic provinces we’ve dealt with so far
• Volcanism tends to be more diverse & silicic as well asexplosive
• The subducting plate is always oceanic (due to density),but the overriding plate can be either oceanic (forms anisland arc) or continental (forms a continental arc or activecontinental margin)
• Subduction produces:– Characteristic igneous rocks– Distinctive metamorphic belts (chp 25)– Orogeny

2
3/18/02 Petrology-Spring 2002, Goeke 3
Figure 16-1. Principal subduction zones associated with orogenic volcanism and plutonism. Triangles are on the overriding plate. PBS =Papuan-Bismarck-Solomon-New Hebrides arc. SAfter Wilson (1989) Igneous Petrogenesis, Allen Unwin/Kluwer. From Winter (2001).
3/18/02 Petrology-Spring 2002, Goeke 4
Island-Arc Volcanism• Island arcs commonly are between 200 and 300 km long• Trench is normally >11 km deep• Rate of subduction ranges from 0.9-10.8 cm/yr
Figure 16-2. Schematic cross section througha typical island arc after Gill (1981),Orogenic Andesites and Plate Tectonics.Springer-Verlag. HFU= heat flow unit (4.2 x10⁻⁶
joules/cm2/sec) From Winter (2001).

3
3/18/02 Petrology-Spring 2002, Goeke 5
• The angle of subduction will range from 30°-nearlyvertical (average 45°)– Hotter (younger) crust = shallower dip– Thicker crust (e.g. aseismic ridges, oceanic plateaus) =
shallower dip
Figure 16-2. Schematic cross section througha typical island arc after Gill (1981),Orogenic Andesites and Plate Tectonics.Springer-Verlag. HFU= heat flow unit (4.2 x10⁻⁶
joules/cm2/sec) From Winter (2001).
3/18/02 Petrology-Spring 2002, Goeke 6
• Wadati-Benioff zone (X’s on diagram) represents a seriesof earthquakes that are observed on the upper boundary ofthe subducting slab—only found at subduction zones
• Deep EQ’s extend up to 700 km into the Earth along thezone
Figure 16-2. Schematic cross section througha typical island arc after Gill (1981),Orogenic Andesites and Plate Tectonics.Springer-Verlag. HFU= heat flow unit (4.2 x10⁻⁶
joules/cm2/sec) From Winter (2001).

4
3/18/02 Petrology-Spring 2002, Goeke 7
• Using the Wadati Benioff zone, we can calculate the dip angle:– The vertical depth from the volcano to the zone (h) is almost
always ~110 km– We only need to measure the distance from the trench to the
volcano to find the dip
Figure 16-2. Schematic cross section througha typical island arc after Gill (1981),Orogenic Andesites and Plate Tectonics.Springer-Verlag. HFU= heat flow unit (4.2 x10⁻⁶
joules/cm2/sec) From Winter (2001).
3/18/02 Petrology-Spring 2002, Goeke 8
• Fore arc = portion between trench and volcanic arc; immaturesediment eroded from arc and oceanic sediment scraped off thedown-going plate
• Accretionary prism = accumulation of oceanic sediment, crust, andmantle that are highly deformed and imbricated by thrusting
Figure 16-2. Schematic cross section througha typical island arc after Gill (1981),Orogenic Andesites and Plate Tectonics.Springer-Verlag. HFU= heat flow unit (4.2 x10⁻⁶
joules/cm2/sec) From Winter (2001).
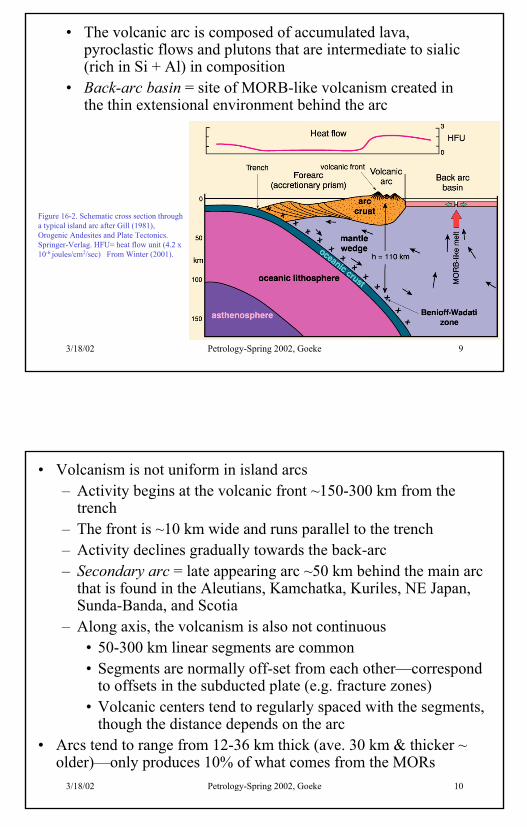
5
3/18/02 Petrology-Spring 2002, Goeke 9
• The volcanic arc is composed of accumulated lava,pyroclastic flows and plutons that are intermediate to sialic(rich in Si + Al) in composition
• Back-arc basin = site of MORB-like volcanism created inthe thin extensional environment behind the arc
Figure 16-2. Schematic cross section througha typical island arc after Gill (1981),Orogenic Andesites and Plate Tectonics.Springer-Verlag. HFU= heat flow unit (4.2 x10⁻⁶
joules/cm2/sec) From Winter (2001).
3/18/02 Petrology-Spring 2002, Goeke 10
• Volcanism is not uniform in island arcs– Activity begins at the volcanic front ~150-300 km from the
trench– The front is ~10 km wide and runs parallel to the trench– Activity declines gradually towards the back-arc– Secondary arc = late appearing arc ~50 km behind the main arc
that is found in the Aleutians, Kamchatka, Kuriles, NE Japan,Sunda-Banda, and Scotia
– Along axis, the volcanism is also not continuous• 50-300 km linear segments are common• Segments are normally off-set from each other—correspond
to offsets in the subducted plate (e.g. fracture zones)• Volcanic centers tend to regularly spaced with the segments,
though the distance depends on the arc• Arcs tend to range from 12-36 km thick (ave. 30 km & thicker ~
older)—only produces 10% of what comes from the MORs

6
3/18/02 Petrology-Spring 2002, Goeke 11
Rocks and Magma Series• Confusion due to a lack of homogeneity in terms applied• Basalts, dacites, and rhyolites are normally rare—andesites
dominate at convergent plate boundaries• Calc-alkaline series considered to be the “hallmark” of convergent
magmatism, but tholeiitic and alkaline also occur at subductionzones
Table 16-1. Relative Proportions of Quaternary Volcanic
Locality B B-A A D RTalasea, Papua 9 23 55 9 4Little Sitkin, Aleutians 0 78 4 18 0Mt. Misery, Antilles (lavas) 17 22 49 12 0Ave. Antilles 17 42 39 2Ave. Japan (lava, ash falls) 14 85 2 0After Gill (1981, Table 4.4) B = basalt B-A = basaltic andesiteA = andesite, D = dacite, R = rhyolite
Island Arc Rock Types
From Winter (2001)
3/18/02 Petrology-Spring 2002, Goeke 12
• The next two diagrams were constructed in 1946 based on100 volcanic centers in ~30 arcs
• Alkaline rocks are much rarer then subalkaline (calc-alkaline and tholeiites) rocks
• Tholeiites, however, are present in about equal numbers asthe calc-alkalines
Figure 16-3a and b.Data compiled byTerry Plank (Plankand Langmuir,1988) Earth Planet.Sci. Lett., 90, 349-370. From Winter(2001).

7
3/18/02 Petrology-Spring 2002, Goeke 13
• Though both diagrams distinguish between tholeiites andcalc-alkaline rocks, they show different results for thesame series of samples—this is due to how we define whatis tholeiitic and calc-alkaline for each diagram
• Best bet: plot a series of rocks on the diagram and hopethat helps
Figure 16-3a and c.Data compiled byTerry Plank (Plankand Langmuir,1988) Earth Planet.Sci. Lett., 90, 349-370. From Winter(2001).
3/18/02 Petrology-Spring 2002, Goeke 14
• Gill (1981) chose to useK2O to differentiatebetween different series ofandesites and came up withfour series:– Low K– Medium K– High K– Shoshonite (very rare)
Figure 16-4. The three andesite series of Gill (1981) OrogenicAndesites and Plate Tectonics. Springer-Verlag. Contours representthe concentration of 2500 analyses of andesites stored in the largedata file RKOC76 (Carnegie Institute of Washington). FromWinter (2001).

8
3/18/02 Petrology-Spring 2002, Goeke 15
• This method becomesuseful when we combineit with the FeO/MgOdiagram anddistinguishes six series
• Though we find a scatterwithin the six series:– Low-K is mainly
tholeiitic = “islandarc tholeiite”
– Medium-K isdominated by calc-alkalines
– High-K is a mix ofboth
Figure 16-5. Combined K2O - FeO*/MgO diagram in which the Low-K to High-Kseries are combined with the tholeiitic vs. calc-alkaline types, resulting in sixandesite series, after Gill (1981) Orogenic Andesites and Plate Tectonics.Springer-Verlag. The points represent the analyses in the appendix of Gill (1981).From Winter (2001).
3/18/02 Petrology-Spring 2002, Goeke 16
Major Chemistry
• We’ll look at a series of diagrams for three types ofsubduction-related volcanic rocks:– Tonga-Kermedec (low-K tholeiite)– Guatemala (med-K calc-alkaline)– Papua New Guinea Highlands (high-K calc-alkaline)

9
3/18/02 Petrology-Spring 2002, Goeke 17
• Less variation amongthe basalts as thetrends converge atmore primitivecompositions—evolution causesdifferentiation
• Differentiation occursthrough fractionalcrystallization ormagma mixing
• Crustal contaminationlow since the crustcomposition ~igneous composition
Figure 16-6. a. K2O-SiO2 diagram distinguishing high-K, medium-K and low-Kseries. Large squares = high-K, stars = med.-K, diamonds = low-K series fromTable 16-2. Smaller symbols are identified in the caption. Differentiation within aseries (presumably dominated by fractional crystallization) is indicated by thearrow. Different primary magmas (to the left) are distinguished by verticalvariations in K2O at low SiO2. After Gill, 1981, Orogenic Andesites and PlateTectonics. Springer-Verlag. From Winter (2001)
3/18/02 Petrology-Spring 2002, Goeke 18
• In general thehigher the K2O,the lower theFeO* enrichment
• All three seriesshow the typicalFeO/MgO →alkalis trend
• Note the changeof the Guatamala(white arrow)from plotting inthe tholeiiticfield to the calc-alkalinearea—notunusual
Figure 16-6. b. AFM diagram distinguishing tholeiitic and calc-alkaline series. Arrows representdifferentiation trends within a series. From Winter (2001).

10
3/18/02 Petrology-Spring 2002, Goeke 19
• The mediumseries straddlesthe two fields andappears moretholeiitic innature
• Let’s look atsome Harkerdiagrams toaddress the majorelement variationmore closely(diagramsrepresent morethan 1 volcano)
• Do the varioustrends makesense?
Figure 16-6. c. FeO*/MgO vs. SiO2 diagram distinguishing tholeiitic and calc-alkaline series.From Winter (2001).
3/18/02 Petrology-Spring 2002, Goeke 20Figure 16-6. From Winter (2001) An Introduction to Igneous and Metamorphic Petrology. Prentice Hall.

11
3/18/02 Petrology-Spring 2002, Goeke 21
• SiO2 variations have to be observedon different diagrams:– Calc-alkaline rocks have a steady
increase throughout the series– Tholeiites have a fairly constant
SiO2 content until the late stagesof formation
• How about differences in FeO*enrichment between calc-alkaline andtholeiitic rocks?
Tholeiitic silica in theSkaergård Intrusion. From
Winter (2001).
No
chan
geN
o ch
ange
Fe-enrichment in tholeiiticrocks—no enrichment incalc-alkaline
3/18/02 Petrology-Spring 2002, Goeke 22
Spatial and Temporal Variations• Arcs tend not just to have one magmatic series association
with them, but multiple ones—even single volcanoes mayhave multiple series!
• K-h relationship = correlation between the K2Oconcentration and h (depth to subducting plate)– Low-K tholeiites near the trench– Medium- and high-K rocks (mainly calc-alkaline)
farther away from the trench• Some arcs also vary depending on where you are (e.g.
Antilles N → S has low-K tholeiites → calk-alkaline →alkaline)
• Differences in composition over time can alsooccur—tholeiites early on grading into calc-alkalines (andeven alkaline) as the arc matures

12
3/18/02 Petrology-Spring 2002, Goeke 23
Petrography• Most island arc volcanic rocks are
phyric—tholeiites may be less so• Plag: complex zoning & resorption
– An50–An70 (up to An90)– What was the average for MORBs?– More Ca-rich due to high H2O, why?
• Olivine (Fo70–Fo85) or augite (Mg# 85–90) inall the series’ mafic rocks + low-K andesites
• Cpx is more Al-rich then MORBs also due tohigh H2O
• Med- to high-K have blackhornblende—only occurs in melts with >3wt.% H2OFigure 16-9. Major phenocryst mineralogy of the low-K tholeiitic, medium-K calc-alkaline, and
high-K calc-alkaline magma series. B = basalt, BA = basaltic andesite, A = andesite, D = dacite,R = rhyolite. Solid lines indicate a dominant phase, whereas dashes indicate only sporadicdevelopment. From Wilson (1989) Igneous Petrogenesis, Allen-Unwin/Kluwer. From Winter(2001).
3/18/02 Petrology-Spring 2002, Goeke 24
Trace Elements• Primitive island arcs:
– Ni = 75-150 ppm– Cr = 200-400 ppm– V = 200-400 ppm– Primary mantle partial melts?
• Andesites:– Ni = 10-60 ppm– Cr = 25-100 ppm– V = 100-200 ppm– Drop is evidence of what process?

13
3/18/02 Petrology-Spring 2002, Goeke 25
• How do the patterns vary dueto:– Change in SiO2? Why?– Change in K2O?
• What do the slopes of eachtrend indicate about sources ofthe melt?
• We can’t derive one seriesfrom the others, since fractionalcrystallization wouldn’t varythe REEs at low depths (at highdepths it might work)
Figure 16-10. REE diagrams for some representative Low-K (tholeiitic),Medium-K (calc-alkaline), and High-K basaltic andesites and andesites.An N-MORB is included for reference (from Sun and McDonough,1989). After Gill (1981) Orogenic Andesites and Plate Tectonics.Springer-Verlag. From Winter (2001).
3/18/02 Petrology-Spring 2002, Goeke 26
• Testing an idea: somescientists believe the meltcomes directly from meltingthe subducting plate– If basalt was subducted it
would turn into eclogite by110 km
– Eclogite contains garnet +cpx
– Is there evidence for thepresence of garnet?
– Thumbs up or down on themelting the down-goingplate idea?
Figure 16-10. REE diagrams for some representative Low-K (tholeiitic),Medium-K (calc-alkaline), and High-K basaltic andesites and andesites.An N-MORB is included for reference (from Sun and McDonough,1989). After Gill (1981) Orogenic Andesites and Plate Tectonics.Springer-Verlag. From Winter (2001).

14
3/18/02 Petrology-Spring 2002, Goeke 27
• On a MORB normalizedspider diagram for IA basalts,we see a very characteristicpattern– Why basalts?– Which are the LILs and the
HFSs?– If the rock had the exact
same values as a MORBspider diagram, how wouldit plot?
– What is the LILrelationship to the MORB?
– What is the HFSrelationship?
– Why would theserelationships occur?
Figure 16-11a. MORB-normalized spider diagrams forselected island arc basalts. Using the normalization andordering scheme of Pearce (1983) with LIL on the left andHFS on the right and compatibility increasing outward fromBa-Th. Data from BVTP. Composite OIB from Fig 14-3 inyellow. From Winter (2001).
3/18/02 Petrology-Spring 2002, Goeke 28
• Let’s look a bit more closely atthe HFS:– Y–Yb have implications
regarding the formation ofgarnet—if garnet wasinvolved, they should bedepleted
– The slightly lower values ofHFS to MORBs could eitherbe due to:
• Which MORBs wechose to compare it to
• IA basalts are even moredepleted then MORBs
Figure 16-11a. MORB-normalized spider diagrams forselected island arc basalts. Using the normalization andordering scheme of Pearce (1983) with LIL on the left andHFS on the right and compatibility increasing outward fromBa-Th. Data from BVTP. Composite OIB from Fig 14-3 inyellow. From Winter (2001).

15
3/18/02 Petrology-Spring 2002, Goeke 29
Isotopes• There are a widerange of resultswhen we look at theisotopic evidence forIAs
• A large group plotnear the limiteddepleted range of theMORBs—suggesting what?
• The rest of theresults extend alonga “mantle array” thatgoes from depletedto enrichedvalues—but its a mixbetween MORB andAtlantic sediments
Figure 16-12. Nd-Sr isotopic variation in some island arc volcanics. MORB and mantle arrayfrom Figures 13-11 and 10-15. After Wilson (1989), Arculus and Powell (1986), Gill (1981),and McCulloch et al. (1994). Atlantic sediment data from White et al. (1985). From Winter(2001).
3/18/02 Petrology-Spring 2002, Goeke 30
• The trend could beexplained bymixing somepartially melteddepleted mantlesource and thesediments residingon the down-goingplate
Figure 16-12. Nd-Sr isotopic variation in some island arc volcanics. MORB and mantle arrayfrom Figures 13-11 and 10-15. After Wilson (1989), Arculus and Powell (1986), Gill (1981),and McCulloch et al. (1994). Atlantic sediment data from White et al. (1985). From Winter(2001).

16
3/18/02 Petrology-Spring 2002, Goeke 31
• Overlap ofMORB andsomearcs—depletedmantle source
• Most of the IAsare enrichedtowards marinesediment—afurtherindication thatthere must besome sedimentinput in thesystem, but wecan’t tell if theenrichment wasrecent or not
Figure 16-13. Variation in 207Pb/204Pb vs. 206Pb/204Pb for oceanic island arc volcanics. Includedare the isotopic reservoirs and the Northern Hemisphere Reference Line (NHRL) proposed inChapter 14. The geochron represents the mutual evolution of 207Pb/204Pb and 206Pb/204Pb in asingle-stage homogeneous reservoir. Data sources listed in Wilson (1989). From Winter (2001).
3/18/02 Petrology-Spring 2002, Goeke 32
• To tell when theenrichment occurred,we can use 10Be
• 10Be is created by theinteraction of cosmicrays with oxygen andnitrogen—only has ahalf life of 1.5 Ma(undetectable >10 Ma)
• 10Be is readilyincorporated into clay-rich sediment, so wecan use it to distinguishbetween “recent” and“old” sedimentenrichment
Figure 16-14. 10Be/Be(total) vs. B/Be for six arcs. After Morris (1989) Carnegie Inst.of Washington Yearb., 88, 111-123. From Winter (2001).

17
3/18/02 Petrology-Spring 2002, Goeke 33
• Since 9Be is stable, itworks well as a directnormalization factor
• Be is can be measuredin oceanic sediments,but exists inundetectable amountsin MORBs, OIBs, andcontinental crust
• B also has be briefresidence time, but itsin more enriched inaltered oceanic crustthen in sediment
• So, what do the resultsreveal?
Figure 16-14. 10Be/Be(total) vs. B/Be for six arcs. After Morris (1989) Carnegie Inst.of Washington Yearb., 88, 111-123. From Winter (2001).
3/18/02 Petrology-Spring 2002, Goeke 34
Petrogenesis• The first problem with how to develop magma at a
subduction zone is the thermal regime, which is controlledby:– Rate of subduction– Age of the subduction zone– Age of the subducting slab– Extent to which the subducting slab induces flow in the
mantle wedge– A few other minor factors (e.g. metamorphic fluid flow,
dip of the slab, etc.)• For the first three factors, what values would make the
thermal regime warmer?

18
3/18/02 Petrology-Spring 2002, Goeke 35
• What happens to theisotherms near thesubducting slab?
• Which numbers on thediagram are unlikely tobe involved inproducing the magma?Why?
• Could we meltanhydrous materialwith this thermalregime? Do we haveevidence of H2O?
Figure 16-15. Cross section of a subduction zone showing isotherms (red-afterFurukawa, 1993, J. Geophys. Res., 98, 8309-8319) and mantle flow lines (yellow-after Tatsumi and Eggins, 1995, Subduction Zone Magmatism. Blackwell. Oxford).From Winter (2001).
3/18/02 Petrology-Spring 2002, Goeke 36
• Pressure-temperature-time path or P-T-t path =sequence of pressures andtemperatures that a rockundergoes
• The yellow lines representthe paths of various agedarcs
• Age of the subducted slabalso matters, as seen bythe pink lines
• Water is required, so theline for chlorite (lowest T)and hornblende (highest T)have been included– Others between those
two; what are they?
Figure 16-16. Subducted crust pressure-temperature-time (P-T-t) paths forvarious situations of arc age (yellow curves) and age of subducted lithosphere(red curves, for a mature ca. 50 Ma old arc) assuming a subduction rate of 3cm/yr (Peacock, 1991). Included are some pertinent reaction curves, includingthe wet and dry basalt solidi (Figure 7-20), the dehydration of hornblende(Lambert and Wyllie, 1968, 1970, 1972), chlorite + quartz (Delaney andHelgeson, 1978). Winter (2001). An Introduction to Igneous and MetamorphicPetrology. Prentice Hall.

19
3/18/02 Petrology-Spring 2002, Goeke 37
• D = cases where the rockhas dehydrated (free H2Oavailable), but wet solidushas not beenreached—occurs for olderarc material
• M = cases where the rockis dehydrated above thewet solidus and meltingwill occur—very youngarcs
• The orange question areadepends on when the arcis hydrated (whatminerals are present)whether or not it will melt
Figure 16-16. Subducted crust pressure-temperature-time (P-T-t) paths forvarious situations of arc age (yellow curves) and age of subducted lithosphere(red curves, for a mature ca. 50 Ma old arc) assuming a subduction rate of 3cm/yr (Peacock, 1991). Included are some pertinent reaction curves, includingthe wet and dry basalt solidi (Figure 7-20), the dehydration of hornblende(Lambert and Wyllie, 1968, 1970, 1972), chlorite + quartz (Delaney andHelgeson, 1978). Winter (2001). An Introduction to Igneous and MetamorphicPetrology. Prentice Hall.
3/18/02 Petrology-Spring 2002, Goeke 38
• Arguments against slab melting:– Many workers believe that once the water is released
via dehydration it rises and leaves the system—we’reback at drying to melt dry rock
– Instead of melt forming, an anhydrous eclogite formsthrough metamorphism of the basalt
– This is where people begin to argue over whether its thecrust (eclogite + H2O) melting or the overlying mantle
– What is some evidence against the eclogite melting?– Erupted magmas are normally >1100°—too hot for the
slab to be melting

20
3/18/02 Petrology-Spring 2002, Goeke 39
• At the currentmoment, the moregenerally acceptedmodel is one ofupper plate mantlemelting caused byhydration
• Water released fromthe down-goingplate rises into theupper plate andtransforms thelherzolite topargasiticamphibole &phlogopite (pink)
Figure 16-11b. A proposed model for subduction zone magmatism with particularreference to island arcs. Dehydration of slab crust causes hydration of the mantle(violet), which undergoes partial melting as amphibole (A) and phlogopite (B)dehydrate. From Tatsumi (1989), J. Geophys. Res., 94, 4697-4707 and Tatsumi andEggins (1995). Subduction Zone Magmatism. Blackwell. Oxford. From Winter (2001).
3/18/02 Petrology-Spring 2002, Goeke 40
• Due to mantle flow,the amphibole &phlogopite are carrieddownwards to Awhere they are heatedup and cause melting
• Two different arcsmay be due to the factthat hornblende-periodite should meltat ~100 km, butphlogopite-perioditeat ~200 km
• Fluid transfer shouldaccount for the LIL,10Be, B, and otherincompatible elementenrichments
Figure 16-11b. A proposed model for subduction zone magmatism with particularreference to island arcs. Dehydration of slab crust causes hydration of the mantle(violet), which undergoes partial melting as amphibole (A) and phlogopite (B)dehydrate. From Tatsumi (1989), J. Geophys. Res., 94, 4697-4707 and Tatsumi andEggins (1995). Subduction Zone Magmatism. Blackwell. Oxford. From Winter (2001).

21
3/18/02 Petrology-Spring 2002, Goeke 41
Figure 16-18. Some calculated P-T-t pathsfor peridotite in the mantle wedge as itfollows a path similar to the flow lines inFigure 16-15. Included are some P-T-tpath range for the subducted crust in amature arc, and the wet and dry solidi forperidotite from Figures 10-5 and 10-6. Thesubducted crust dehydrates, and water istransferred to the wedge (arrow). AfterPeacock (1991), Tatsumi and Eggins(1995). Winter (2001). An Introduction toIgneous and Metamorphic Petrology.Prentice Hall.
First arc Second arc• The depletedmantlecharacteristics aredue to the mantlewedge—and willbecome furtherdepleted as the arcages
3/18/02 Petrology-Spring 2002, Goeke 42
Summary• Subducted oceanic crust undergoes dehydration below
the wet basalt solidus, so no partial melting on a largescale, though there may be local melting (especially inyoung arcs or young subducted material)
• The released fluid rises into the overriding plate takingwith it the incompatible elements
• Fluid hydrates the mantle material, which is thendragged down to to greater depths where it dehydratesabove the wet periodite solidus and melts—an olivinetholeiitic basalt forms with only 1-2 wt.% H2O
• The tholeiitic magma ponds at the base of the arc crustand fractionates to form the high-alumina magma;heating may also cause partial melting of the crustalsilicic magmas that mix with the more mafic magmasnear the surface

22
3/18/02 Petrology-Spring 2002, Goeke 43
• Differentiation (fractional crystallization, assimilation,magma mixing) of the tholeiitic and calc-alkaline rocksto form the wide spectrum of igneous material found atarcs
• More alkaline rocks may be found further away from thetrench where water is not as abundant
• Mantle flow can cause back-arc rifting behind the arc

1
3/18/02 Petrology-Spring 2002, Goeke 1
Subduction—Continental Arcs
Chapter 17
3/18/02 Petrology-Spring 2002, Goeke 2
Possible Differences
• Crust contamination is much more likely, since themagmas generated must rise up to 70 km through theupper plate
• The crustal density is fairly low, which may retard therise of the mafic/intermediate bodies—more assimilationand/or differentiation of stagnant bodies likely
• Since the melting point of the continental crust may belower, we may have a considerable addition of silicicmagmatism to the system

2
3/18/02 Petrology-Spring 2002, Goeke 3
• Example: western side of the Americas• Some areas are undergoing subduction
with little to no volcanism, whileothers are experiencing activevolcanism
• Subduction dip angles vary and theangle of collision can also be differentfrom fairly normal to oblique(“transpression”) to pure strike-slip(e.g. San Andreas)
• Allochthonous or exotic terranes(offshore island arcs/continentalfragments) have also collided
Figure 17-1. Map of western South America showing the plate tectonic framework,and the distribution of volcanics and crustal types. NVZ, CVZ, and SVZ are thenorthern, central, and southern volcanic zones. After Thorpe and Francis (1979)Tectonophys., 57, 53-70; Thorpe et al. (1982) In R. S. Thorpe (ed.), (1982). Andesites.Orogenic Andesites and Related Rocks. John Wiley & Sons. New York, pp. 188-205;and Harmon et al. (1984) J. Geol. Soc. London, 141, 803-822. Winter (2001) AnIntroduction to Igneous and Metamorphic Petrology. Prentice Hall.
3/18/02 Petrology-Spring 2002, Goeke 4
• Three actives zones in the Andes:– NVZ = northern volcanic zone;
young continent = 30-45 km thick• ~140 km trench → arc
– CVZ = central volcanic zone; oldcontinent = up to 75 km thick
• ~140 km trench → arc– SVZ = southern volcanic zone;
young continent = 30-45 km thick• ~90 km trench → arc
• What could account for the differentdistances between the trench and thearc?
Figure 17-1. Map of western South America showing the plate tectonic framework,and the distribution of volcanics and crustal types. After Thorpe and Francis (1979)Tectonophys., 57, 53-70; Thorpe et al. (1982) In R. S. Thorpe (ed.), (1982). Andesites.Orogenic Andesites and Related Rocks. John Wiley & Sons. New York, pp. 188-205;and Harmon et al. (1984) J. Geol. Soc. London, 141, 803-822. Winter (2001) AnIntroduction to Igneous and Metamorphic Petrology. Prentice Hall.
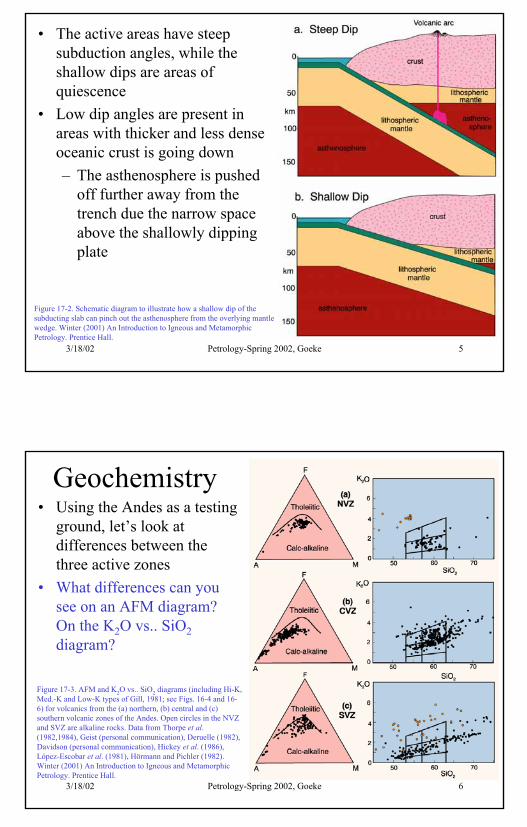
3
3/18/02 Petrology-Spring 2002, Goeke 5
• The active areas have steepsubduction angles, while theshallow dips are areas ofquiescence
• Low dip angles are present inareas with thicker and less denseoceanic crust is going down– The asthenosphere is pushed
off further away from thetrench due the narrow spaceabove the shallowly dippingplate
Figure 17-2. Schematic diagram to illustrate how a shallow dip of thesubducting slab can pinch out the asthenosphere from the overlying mantlewedge. Winter (2001) An Introduction to Igneous and MetamorphicPetrology. Prentice Hall.
3/18/02 Petrology-Spring 2002, Goeke 6
Geochemistry• Using the Andes as a testing
ground, let’s look atdifferences between thethree active zones
• What differences can yousee on an AFM diagram?On the K2O vs.. SiO2diagram?
Figure 17-3. AFM and K2O vs.. SiO2 diagrams (including Hi-K,Med.-K and Low-K types of Gill, 1981; see Figs. 16-4 and 16-6) for volcanics from the (a) northern, (b) central and (c)southern volcanic zones of the Andes. Open circles in the NVZand SVZ are alkaline rocks. Data from Thorpe et al.(1982,1984), Geist (personal communication), Deruelle (1982),Davidson (personal communication), Hickey et al. (1986),López-Escobar et al. (1981), Hörmann and Pichler (1982).Winter (2001) An Introduction to Igneous and MetamorphicPetrology. Prentice Hall.

4
3/18/02 Petrology-Spring 2002, Goeke 7
Petrology• SVZ = olivine, two pyroxenes and plagioclase are the
common phenocrysts– High alumina basalts & basaltic andesites on top of
older andesites in the south– In the northern end, silicic hornblende-bearing andesite-
dacite is dominant• NVZ = olivine and two pyroxenes as phenocrysts
– Basaltic andesites and andesites as well as evolveddacites and rhyolites
– More calc-alkaline in the west and potassic andesiteand latite to the east then alkaline and shoshonitic in thevery far east (K-h relationship)
3/18/02 Petrology-Spring 2002, Goeke 8
• CVZ = plagioclase is the dominant phenocryst (thougholivine and pyroxene in the basaltic andesites); hornblendeand biotite as well– Diverse basaltic to rhyolitic range—andesites and
dacites most common– Hint of K-h relationship with low-K in west and
alkaline & shoshonites in the east
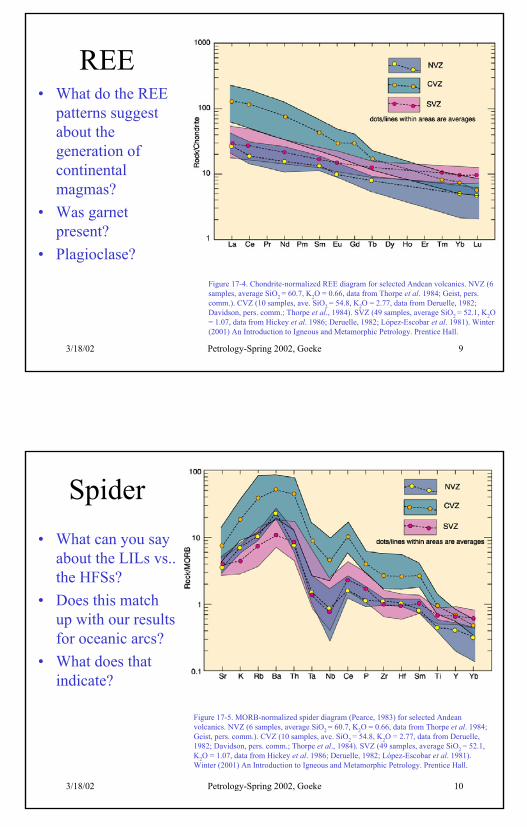
5
3/18/02 Petrology-Spring 2002, Goeke 9
REE• What do the REE
patterns suggestabout thegeneration ofcontinentalmagmas?
• Was garnetpresent?
• Plagioclase?
Figure 17-4. Chondrite-normalized REE diagram for selected Andean volcanics. NVZ (6samples, average SiO2 = 60.7, K2O = 0.66, data from Thorpe et al. 1984; Geist, pers.comm.). CVZ (10 samples, ave. SiO2 = 54.8, K2O = 2.77, data from Deruelle, 1982;Davidson, pers. comm.; Thorpe et al., 1984). SVZ (49 samples, average SiO2 = 52.1, K2O= 1.07, data from Hickey et al. 1986; Deruelle, 1982; López-Escobar et al. 1981). Winter(2001) An Introduction to Igneous and Metamorphic Petrology. Prentice Hall.
3/18/02 Petrology-Spring 2002, Goeke 10
Spider• What can you say
about the LILs vs..the HFSs?
• Does this matchup with our resultsfor oceanic arcs?
• What does thatindicate?
Figure 17-5. MORB-normalized spider diagram (Pearce, 1983) for selected Andeanvolcanics. NVZ (6 samples, average SiO2 = 60.7, K2O = 0.66, data from Thorpe et al. 1984;Geist, pers. comm.). CVZ (10 samples, ave. SiO2 = 54.8, K2O = 2.77, data from Deruelle,1982; Davidson, pers. comm.; Thorpe et al., 1984). SVZ (49 samples, average SiO2 = 52.1,K2O = 1.07, data from Hickey et al. 1986; Deruelle, 1982; López-Escobar et al. 1981).Winter (2001) An Introduction to Igneous and Metamorphic Petrology. Prentice Hall.

6
3/18/02 Petrology-Spring 2002, Goeke 11
Isotopes
• What do theisotopes suggest?
• How does thisrelate to the islandarc results?
Figure 17-6. Sr vs.. Nd isotopic ratios for the three zones of the Andes. Data from James etal. (1976), Hawkesworth et al. (1979), James (1982), Harmon et al. (1984), Frey et al.(1984), Thorpe et al. (1984), Hickey et al. (1986), Hildreth and Moorbath (1988), Geist(pers. comm), Davidson (pers. comm.), Wörner et al. (1988), Walker et al. (1991), deSilva(1991), Kay et al. (1991), Davidson and deSilva (1992). Winter (2001) An Introduction toIgneous and Metamorphic Petrology. Prentice Hall.
3/18/02 Petrology-Spring 2002, Goeke 12
• What is therelationship betweenthe arc (dots) andMORBs?
• How does thatcompare with islandarcs?
• What is that indicativeof?
Figure 17-7. 208Pb/204Pb vs.. 206Pb/204Pb and207Pb/204Pb vs.. 206Pb/204Pb for Andean volcanicsplotted over the OIB fields from Figures 14-7 and14-8. Data from James et al. (1976), Hawkesworthet al. (1979), James (1982), Harmon et al. (1984),Frey et al. (1984), Thorpe et al. (1984), Hickey et al.(1986), Hildreth and Moorbath (1988), Geist (pers.comm), Davidson (pers. comm.), Wörner et al.(1988), Walker et al. (1991), deSilva (1991), Kay etal. (1991), Davidson and deSilva (1992). Winter(2001) An Introduction to Igneous and MetamorphicPetrology. Prentice Hall.

7
3/18/02 Petrology-Spring 2002, Goeke 13
• There are several different ratios plotted on the nextdiagram vs. latitude for the Andes:– 87Sr/86Sr– 143Nd/144Nd– ∆7/4 deals with enrichment of 207Pb over NHRL from
figure 17-7– ∆8/4 deals with enrichment of 208Pb over NHRL from
figure 17-7– δ18O (oceanic 5-6 per mil, 10-25 per mil for continental
crust)• For each diagram:
– Does it vary over latitude?– What do the numbers indicate?
3/18/02 Petrology-Spring 2002, Goeke 14
Figure 17-8. 87Sr/86Sr, D7/4, D8/4,and d18O vs.. Latitude for theAndean volcanics. ∆7/4 and ∆8/4are indices of 207Pb and 208Pbenrichment over the NHRL valuesof Figure 17-7 (see Rollinson,1993, p. 240). Shaded areas areestimates for mantle and MORBisotopic ranges from Chapter 10.Data from James et al. (1976),Hawkesworth et al. (1979), James(1982), Harmon et al. (1984),Frey et al. (1984), Thorpe et al.(1984), Hickey et al. (1986),Hildreth and Moorbath (1988),Geist (pers. comm), Davidson(pers. comm.), Wörner et al.(1988), Walker et al. (1991),deSilva (1991), Kay et al. (1991),Davidson and deSilva (1992).Winter (2001) An Introduction toIgneous and MetamorphicPetrology. Prentice Hall.

8
3/18/02 Petrology-Spring 2002, Goeke 15
Petrogenesis
• Island arcs and continental arcs probably originate in thesame manner, however crustal interactions play a rolewhere the magma travels through older & thicker crust (e.g.CVZ)

1
3/18/02 Petrology-Spring 2002, Goeke 1
Granitoid Rocks
Part of Chapter 17 & all of Chapter 18
3/18/02 Petrology-Spring 2002, Goeke 2
Plutons related to Arcs• Cordilleran-type batholith = large composite plutons
created in mountain belts at a leading plate edge• These plutons are a group of hundreds to thousands of
individual intrusions that make up the composite body– Can span 107 to 108 years– Composition ranges from gabbros to granites– E.g. Coastal Batholith (Peru) 7-16% gabbro & diorite,
48-60% tonalite, granodiorite 20-30%, and true granite1-4 %
– Granitoid = coarse-grained felsic rock, can range froma tonalite to a syenite
• Usually found in sections where volcanism is not active, sothat erosion and uplift can reveal the batholiths– Why might volcanism cease?

2
3/18/02 Petrology-Spring 2002, Goeke 3
Figure 17-15a. Majorplutons of the NorthAmerican Cordillera,a principal segmentof a continuousMesozoic-Tertiarybelt from theAleutians toAntarctica. AfterAnderson (1990,preface to The Natureand Origin ofCordilleranMagmatism. Geol.Soc. Amer. Memoir,174. The Sr 0.706line in N. America isafter Kistler (1990),Miller and Barton(1990) andArmstrong (1988).Winter (2001) AnIntroduction toIgneous andMetamorphicPetrology. PrenticeHall.
Figure 17-15b. Majorplutons of theSouthAmericanCordillera, aprincipalsegment of acontinuousMesozoic-Tertiary beltfrom theAleutians toAntarctica.After USGS.From Winter(2001).
3/18/02 Petrology-Spring 2002, Goeke 4
• Batholiths tend to be linear and parallel to the plateboundary
• Unit = group of plutons with similar texture and mode• Super-unit or suite or sequence = plutons with a distinctive
mineralogical, chemical and textural patterns evident overa range of compositions; normally easy to recognize evenwhen separated by 100’s of kilometers
• Huge volumes created at once? Generation processessimilar so that smaller pulses create nearly identicalplutons?
• Complex = nested group of plutons regularly spaced apart(~120 km)

3
3/18/02 Petrology-Spring 2002, Goeke 5
• 3-D maps of batholiths show individual bell-jar (flat-topped & steep-sided) plutons– Flat sides parallel to regional fracture
patterns—partially induced by the pluton emplacement– Wall rocks have little to no distortion– Emplaced at shallow depths by cauldron subsidence
(stopping of huge fault-bounded crustal blocks) androof-uplift
Figure 17-16. Schematiccross section of theCoastal batholith ofPeru. The shallow flat-topped and steep-sided“bell-jar”-shapedplutons are stoped intoplace. Successive pulsesmay be nested at asingle locality. Theheavy line is the presenterosion surface. FromMyers (1975) Geol. Soc.Amer. Bull., 86, 1209-1220. From Winter(2001).
3/18/02 Petrology-Spring 2002, Goeke 6
Batholith Geochemistry• Batholith
compositionscorrespondclosely to theassociatedvolcanics
• What are thetrendsindicative of?
Figure 17-17. Harker-type and AFMvariation diagrams for the Coastalbatholith of Peru. Data span severalsuites from W. S. Pitcher, M. P.Atherton, E. J. Cobbing, and R. D.Beckensale (eds.), Magmatism at aPlate Edge. The Peruvian Andes.Blackie. Glasgow. Winter (2001)

4
3/18/02 Petrology-Spring 2002, Goeke 7
• In the field, we can find:– Diffuse concentric zonation of a single pluton—in situ
differentiation– Sharp internal contacts indicative of separate surges
from the chamber below– Some suites are differentiated, but the pulses of
magmatism are scattered between a number of differentplutons in the field—deeper and larger parentalchambers
– Evidence for magma mixing
3/18/02 Petrology-Spring 2002, Goeke 8
• The REE patterns forvolcanics and batholiths areremarkably similar
• Presence of plagioclaseevident?
• Garnet?• Enriched or depleted mantle
source?
Figure 17-18. Chondrite-normalized REE abundances for theLinga and Tiybaya super-units of the Coastal batholith of Peruand associated volcanics. From Atherton et al. (1979) In M. P.Atherton and J. Tarney (eds.), Origin of Granite Batholiths:Geochemical Evidence. Shiva. Kent. Winter (2001) AnIntroduction to Igneous and Metamorphic Petrology. PrenticeHall.

5
3/18/02 Petrology-Spring 2002, Goeke 9
• For diagram (a)– Lima segment
into youngerrocks—not muchcontamination
– Arequipa &Toquepalasegment intrudeoldercraton—elevatedratios due tocontamination
• What does (b)mean?
Figure 17-19. a. Initial 87Sr/86Sr ranges for three principal segments of the Coastal batholith of Peru (after Beckinsale et al., 1985) in W. SPitcher, M. P. Atherton, E. J. Cobbing, and R. D. Beckensale (eds.), Magmatism at a Plate Edge. The Peruvian Andes. Blackie. Glasgow, pp.177-202. . b. 207Pb/204Pb vs.. 206Pb/204Pb data for the plutons (after Mukasa and Tilton, 1984) in R. S. Harmon and B. A. Barreiro (eds.), AndeanMagmatism: Chemical and Isotopic Constraints. Shiva. Nantwich, pp. 235-238. ORL = Ocean Regression Line for depleted mantle sources(similar to oceanic crust). Winter (2001) An Introduction to Igneous and Metamorphic Petrology. Prentice Hall.
3/18/02 Petrology-Spring 2002, Goeke 10
• Batholiths tend to be moreevolved and felsic then thevolcanic arc rocks
• Most mafic rocks occur early inthe batholiths history andtonalites dominate in laterstages– Mafic rocks due to partial
melting of mantle wedge– Tonalites due to remelting
of basaltic magmas thatpond at the base of the crust
– Proposed process for thelatter, is a two-step processof extension followed bycompression
Figure 17-20. Schematic diagram illustrating (a) the formation of agabbroic crustal underplate at an continental arc and (b) the remeltingof the underplate to generate tonalitic plutons. After Cobbing andPitcher (1983) in J. A. Roddick (ed.), Circum-Pacific PlutonicTerranes. Geol. Soc. Amer. Memoir, 159. pp. 277-291. From Winter(2001).

6
3/18/02 Petrology-Spring 2002, Goeke 11
Across-Axis Variations• Similar to the K-h relationships
of the volcanics, somebatholiths also have distance-to-trench relationships—not allthough– Relationship: mafic near
trench to more SiO2 andK2O rich further away
• Some batholiths also showtemporal trends– Older ages near the trench
and younger further away Figure 17-21. Isotopic age vs.. distance across (a) the Western Cordilleraof Peru (Cobbing and Pitcher, 1983 in J. A. Roddick (ed.), Circum-PacificPlutonic Terranes. Geol. Soc. Amer. Memoir, 159. pp. 277-291) and (b) thePeninsular Ranges batholith of S. California/Baja Mexico (Walawander etal. 1990 In J. L. Anderson (ed.), The Nature and Origin of CordilleranMagmatism. Geol. Soc. Amer. Memoir, 174. pp. 1-8). From Winter (2001)
3/18/02 Petrology-Spring 2002, Goeke 12
• Isotopicly, the trends tend toshow enrichment as youmove away from the trench;isotopes used for thisevidence:– REEs– 87Sr/86Sr– U/Pb– 143Nd/144Nd– δ18O
• Does this trend make sense?• Same source for both the
western & eastern rocks? Figure 17-22. Range and average chondrite-normalized rare earth elementpatterns for tonalites from the three zones of the Peninsular Rangesbatholith. Data from Gromet and Silver (1987) J. Petrol., 28, 75-125.Winter (2001) An Introduction to Igneous and Metamorphic Petrology.Prentice Hall.

7
3/18/02 Petrology-Spring 2002, Goeke 13
Starting with Chapter 18• Granitoids also occur in other localities then subduction
zones, so we need to explore them in different settings• We’ll continue to focus on intrusive rocks, but keep in
mind that extrusive felsic volcanism also occurs• Three main generalizations to granitoid petrogenesis:• Granitoids with large volumes occur in areas of
continental crust thickening– Occur at continental arc subduction zones or in
continent-continent collision areas– Many post-date the thickening event by 10s Ma
• Thermal disturbances are required to provide the liquidfor granitoid genesis—why?
3/18/02 Petrology-Spring 2002, Goeke 14
• Most igneous petrologists consider granitoids a result ofcrustal anatexis
– Some mantle contribution may occur either as asource of heat or material

8
3/18/02 Petrology-Spring 2002, Goeke 15
Petrography• General features:
– Medium to coarse grain size– Evidence of volatiles, especially H2O– Plagioclase, quartz and alkali feldspar dominant
phases—do all three need to exist for our currentdefinition of granitoid?
– Which of the three would be an early vs.. late phase?– Hornblende and biotite are the dominant mafic phases– Muscovite occurs in Al-rich granitoids either as a
primary or as a secondary mineral– Layering and cumulates very rare
• Sub-solvus granite = low Ca alkaline granite with both aNa- and K-feldspar; formed in a system with high H2Opressure—more common
3/18/02 Petrology-Spring 2002, Goeke 16
• Hypersolvus granite = low Ca alkaline granite with only asingle alkaline feldspar; low H2O pressure
• Common accessory minerals include:– Zircon– Apatite– Ilmenite– Monazite– Sphene– Allanite– Tourmaline– Pyrite– Fluorite– Magnetite– Which ones are useful for dating? Which one is useful
for determining the paleolatitude of the sample?

9
3/18/02 Petrology-Spring 2002, Goeke 17
• Restite = solid refractory material remainingafter partial melting of a source rock; ingranitoids, it may contain garnet, cordierite,opx, corundum, or an aluminosilicate
• Xenocryst = foreign crystal within a rock• Zircons are extremely durable to both
chemical and physical weathering as well asbeing hard to melt– Metamorphic zircon ~ unzoned– Igneous zircon ~ zoned– Granitoids can inherit Pb from either
sedimentary rocks or wall rocks andhave erroneously high ages
– What happened to this zircon?
Figure 18-1. Backscattered electron image of a zircon from the Strontian Granite, Scotland. The grain has a rounded, un-zoned core (dark)that is an inherited high-temperature non-melted crystal from the pre-granite source. The core is surrounded by a zoned epitaxial igneousovergrowth rim, crystallized from the cooling granite. From Paterson et al. (1992), Trans. Royal. Soc. Edinburgh. 83, 459-471. Also Geol.Soc. Amer. Spec. Paper, 272, 459-471. From Winter (2001).
3/18/02 Petrology-Spring 2002, Goeke 18
Table 18-1. The Various Types of Enclaves
Name Nature Margin Shape FeaturesXenolith piece of country sharp to angular contact metamorphic
rocks gradual to ovoid texture and mineralsXenocryst isolated foreign sharp angular corroded
crystal reaction rimSurmicaceous residue of melting sharp, lenticular metamorphic texture Enclave (restite) biotite rim micas, Al-rich minerals
Schlieren disrupted enclave gradual oblate coplanar orientation
Felsic Micro- disrupted sharp to ovoid fine-granied granular Enclave fine-grained margin gradual igneous texture
Mafic Micro- Blob of coeval mostly ovoid fine-granied granular Enclave mafic magma sharp igneous texture
Cumulate Enclave disrupted mostly ovoid coarse-grained (Autolith) cumulate gradual cumulate textureAfter Didier and Barbarin (1991, p. 20).
Table 18-1. Didier, J. and Barbarin (1991) The different type of enclaves in granites: Nomenclature. In J. Didier and B. Barbarin (1991)(eds.), Enclaves in Granite Petrology. Elsevier. Amsterdam, pp. 19-23. From Winter (2001).
• Enclave = any igneous inclusion• A number of the common ones are listed below, though
this list is not all-inclusive

10
3/18/02 Petrology-Spring 2002, Goeke 19
Geochemistry
• No standard set of elements that are analyzed for• Lower crustal rocks tend to have lower SiO2, alkalis,
incompatible and LIL trace elements• What are the factors that control the chemical composition
of the igneous rock?• Calc-alkaline varieties are more common than tholeiitic,
but alkali-calcic and alkaline plutons– Characteristics hold true for the entire magma series, so
they must be due to parent body & its melting
3/18/02 Petrology-Spring 2002, Goeke 20
Figure 18-2. Alumina saturation classes based on the molar proportions ofAl2O3/(CaO+Na2O+K2O) (“A/CNK”) after Shand (1927). Common non-quartzo-feldspathicminerals for each type are included. After Clarke (1992). Granitoid Rocks. Chapman Hall.From Winter (2001).

11
3/18/02 Petrology-Spring 2002, Goeke 21
Figure 18-3. The Ab-Or-Qtz system with the ternary cotectic curves and eutectic minima from 0.1 to 3 GPa. Included is the locus of mostgranite compositions from Figure 11-2 (shaded) and the plotted positions of the norms from the analyses in Table 18-2. Note the effects ofincreasing pressure and the An, B, and F contents on the position of the thermal minima. From Winter (2001) An Introduction to Igneous andMetamorphic Petrology. Prentice Hall.
3/18/02 Petrology-Spring 2002, Goeke 22
Figure 18-4. MORB-normalized spider diagramsfor the analyses in Table 18-2 . From Winter(2001) An Introduction to Igneous andMetamorphic Petrology. Prentice Hall.
If these rocks have thesame values as MORBs,how should they plot?
What are the implicationsof these two differentpatterns?

12
3/18/02 Petrology-Spring 2002, Goeke 23
Crustal Melting• When we start to talk about crustal
anatexis and the reactions thataccompany raising the temperatureof the crust, we cross into the hazyfield between metamorphic andigneous rocks
• With dehydration of your typicalpelitic rock (e.g. muscovite-biotite-Al2SiO3-garnet-quartz-feldspar gneiss), we can startmelting the rock at ~650°– How much melt forms will
depend on the mode of thephases present
Figure 18-5. a. Simplified P-T phase diagram after Clarke(1992) Granitoid Rocks. Chapman Hall, London; andVielzeuf and Holloway (1988) Contrib. Mineral. Petrol.,98, 257-276. Shaded areas in (a) indicate melt generation.Winter (2001) An Introduction to Igneous and MetamorphicPetrology. Prentice Hall.
3/18/02 Petrology-Spring 2002, Goeke 24
• The reaction to form melt usuallyoccurs at one temperature due tothe low amounts of muscovite (#1in diagram)—low amount of melt,so it usually stays trapped in rock
• Migmatite = gneiss with blebs,lenses, or small dikelets ofgranitic melt
• When the biotite begins to breakdown (#2), usually enough melt isformed that it can escape and riseaway from the metamorphic rock
• The remaining material in ourhypothetical rock will require asubstantial amount of heatincrease before it melts, since itsnow anhydrous
Figure 18-5. b. quantity of melt generated during the melting ofmuscovite-biotite-bearing crustal source rocks, after Clarke(1992) Granitoid Rocks. Chapman Hall, London; and Vielzeufand Holloway (1988) Contrib. Mineral. Petrol., 98, 257-276.Winter (2001) An Introduction to Igneous and MetamorphicPetrology. Prentice Hall.

13
3/18/02 Petrology-Spring 2002, Goeke 25
Classification• We can classify granitoids based on mineralogy (e.g. chapter 2), but
we can also use chemical composition to classify based on sourceand tectonic setting
• There are more than one genetic classifications, but the majority ofthe literature will use the S-I-A-M classification
Table 18-3. The S-I-A-M Classification of Granitoids
Type SiO2 K2O/Na2O Ca, Sr A/(C+N+K)* Fe3+/Fe2+ Cr, Ni δ18O 87Sr/86Sr Misc PetrogenesisM 46-70% low high low low low < 9‰ < 0.705 Low Rb, Th, U Subduction zone
Low LIL and HFS or ocean-intraplateMantle-derived
I 53-76% low high in low: metal- moderate low < 9‰ < 0.705 high LIL/HFS Subduction zonemafic uminous to med. Rb, Th, U Infracrustalrocks peraluminous hornblende Mafic to intermed.
magnetite igneous sourceS 65-74% high low high low high > 9‰ > 0.707 variable LIL/HFS Subduction zone
high Rb, Th, Umetaluminous biotite, cordierite Supracrustal
Als, Grt, Ilmenite sedimentary sourceA high Na2O low var var low var var low LIL/HFS Anorogenic
→ 77% high peralkaline high Fe/Mg Stable craton high Ga/Al Rift zone
High REE, ZrHigh F, Cl
* molar Al2O3/(CaO+Na2O+K2O) Data from White and Chappell (1983), Clarke (1992), Whalen (1985)
From Winter (2001)
3/18/02 Petrology-Spring 2002, Goeke 26
• I-type granitoid ~ igneous source material; two-stageremelts of underplates– E.g. continental arc granitoids
• S-type granitoid ~ partial melting of sedimentary sourcerocks– Mixing of I and S can occur due to assimilation and
may be common– E.g. crustal melts
• M-type granitoid ~ direct mantle source; single-stagemantle melts– A range between I and M is very likely– E.g. immature arc plutons, oceanic “Plagiogranite” in
ophiolites• A-type granitoid ~ anorogenic granitoids
– Occur in non-orogenic settings; common intraplatetrace element signature

14
3/18/02 Petrology-Spring 2002, Goeke 27
Tectonic Classification• Though the “alphabet” classification is probably the most
common, several igneous petrologists (including Winter)would prefer a more tectonically-based differentiation ofgranitoids
• In the classification scheme of Pitcher (1983, 1993) andBarbarin (1990) the following terms are defined slightlydifferently:– Orogenic = mountain building due to compressive
stresses associated with subduction– Anorogenic = magmatism within a plate or a a
spreading margin– Post-orogenic = occurs after the true orogenic event;
has also been classified as orogenic, anorogenic, andtransitional
3/18/02 Petrology-Spring 2002, Goeke 28
Table 18-4. AClassification ofGranitoid Rocks Based onTectonic Setting. AfterPitcher (1983) in K. J.Hsü (ed.), MountainBuilding Processes,Academic Press, London;Pitcher (1993), TheNature and Origin ofGranite, Blackie,London; and Barbarin(1990) Geol. Journal, 25,227-238. Winter (2001)An Introduction toIgneous and MetamorphicPetrology. Prentice Hall.

15
3/18/02 Petrology-Spring 2002, Goeke 29
• Continent-continent collision (e.g. Himalayas) will becharacterized by suture zones (fault zones separatingterranes with different lithologies, fossils, etc)
• Dehydration of the lower, overthickened crust will providethe required H2O and radiogenic heating (U, Th, K) foranatexis to occur in the upper portions of the crust
Figure 18-7. Schematic cross section of the Himalayas showing the dehydration and partial melting zones that produced the leucogranites.After France-Lanord and Le Fort (1988) Trans. Roy. Soc. Edinburgh, 79, 183-195. Winter (2001) An Introduction to Igneous andMetamorphic Petrology. Prentice Hall.
3/18/02 Petrology-Spring 2002, Goeke 30
Role of Mantle in Petrogenesis• A question that concerns granitoids is how much of a role
does the mantle play in creating granitoids– Just a heat source?– Supply melt?
• An addition of heat, would mean we’re recycling the crustover and over again
• If melt is supplied from the mantle, then the crust must begrowing over time
• In many ways, this discussion is going to depend on wherethe granitoid formed—why?

1
3/29/02 Petrology-Spring 2002, Goeke 1
Intro to Metamorphism
Chapter 21
3/29/02 Petrology-Spring 2002, Goeke 2
Where does metamorphism end?• Metamorphism = change in form; a change in a rock’s
mineralogy, texture and/or composition that occurs in asolid state (almost always)
• The lower boundary of metamorphism is relative to the endof sedimentary processes (e.g. weathering, diagenesis)– The boundary between diagenesis and very low-grade
metamorphism is rather hazy– An IUGS committee is trying to decide where to draw
boundaries, but the arguments continue online (mainlythrough email)—generally metamorphism occurs attemperatures > 100-150 C
• At the other end, the boundary between igneous andmetamorphic realms is blurred by several things:– Inability to distinguish between silica-saturated fluid
and fluid-saturated melt deposits

2
3/29/02 Petrology-Spring 2002, Goeke 3
– Since the whole rock won’t melt at the same point,where do we distinguish between a metamorphic rockwith only small pockets of melt (migmatite) and anigneous rock with xenoliths?
• Most metamorphic rocks are crustal samples and did notreach pressures above 3 GPa
• Metamorphic petrologists normally do not deal with:– Coal– Petroleum– Ore deposits
• As Lukas Baumgartner said to me on my first day ofmetamorphic petrology “You can’t do metamorphicpetrology without an understanding of structural geology”,so there will be some overlap during these lectures
3/29/02 Petrology-Spring 2002, Goeke 4
What factors change the rock?• We’re going to talk about four agents of metamorphism:• Temperature
– Probably the most considered agent when dealingwith a metamorphic rock
– Heat can come from either burying the rock(geothermal gradient) or by putting a hot body next toa colder one (e.g. igneous intrusion)
– Effects of an increase in T:• Recrystallization—increased grain size, since less
surface area = more stable grain• Minerals react to form more stable assemblages
for that particular T• Devolitization = removal of volatiles from low-
temperature minerals at higher T’s

3
3/29/02 Petrology-Spring 2002, Goeke 5
• At low temperatures, disequilibrium is commondue to the fact that the rock can not acquireenough activation energy to re-equilibrate—raising the T may provide enoughenergy for reactions and diffusion to make thesystem stable
• Pressure– Lithospheric pressure or confining pressure =
uniform pressure exerted by burying a rock to a givendepth
– Since increasing depth will increase not only thepressure, but also the temperature, the two are closelylinked
– The relationship between the pressure/temperatureincrease is determined by the geothermal gradient,which varies depending on tectonic situation (e.g.subduction zones = low gradient, rifting = highgradient)
3/29/02 Petrology-Spring 2002, Goeke 6
– Just as there are temperature stability limits forvarious minerals, there are also pressure constraints
– High pressure metamorphism favors high densityminerals
• Deviatoric stress– Stress = state a rock experiences while under a
specific pressure; force per unit area– If the pressure is unequal in the various directions,
then the rocks undergoes a deviatoric or differentialstress:• σ = stress direction; we use three mutually
perpendicular stresses to define things• σ1 = maximum principal stress• σ2 = intermediate principal stress• σ3 = minimum principal stress• In a lithospheric situation σ1 = σ2 = σ3

4
3/29/02 Petrology-Spring 2002, Goeke 7
– The overall pressure and temperature will determinehow the rock will behave
• Low P&T = brittle behavior (e.g. things break)• High P&T = ductile behavior (e.g. things flow like
silly putty)– Strain = deformation of the rock in response to stress;
does not have to be proportionally related to thestress that caused it
– Differential stress can change what the textures,structures, and minerals are present within a rock—itcan not, however, change what the kinetically stablemineral assemblage will be
– We’ll deal with three types of differential stress:• Tension = σ3 is negative• Compression = σ1 is dominant and positive• Shear = σ1 is at an angle to deformation direction
3/29/02 Petrology-Spring 2002, Goeke 8
• Tension usually occurs at shallow depths and causesbrittle fracturing of the rock
• Tension gash or fracture = gap that opens (yellow below)within a rock/mineral that fills with precipitatedminerals from the fluid phase
Figure 21-2. a. Tension, in which one stress in negative. “Tension fractures” may open normal to the extension direction and becomefilled with mineral precipitates. Winter (2001) An Introduction to Igneous and Metamorphic Petrology. Prentice Hall.

5
3/29/02 Petrology-Spring 2002, Goeke 9
• Compression can resultin either folding (top) orby flattening (bottom)
• During flattening,elongate minerals arerotated to beingapproximately parallelwith one another
• New minerals will alsogrow in the minimumstress direction
• Foliation = non-geneticterm referring to planartextures or structures
Figure 21-2. b. Compression, causing flattening or folding. Winter (2001) AnIntroduction to Igneous and Metamorphic Petrology. Prentice Hall.
Figure 21-3. Flattening of a ductile homogeneous sphere (a)containing randomly oriented flat disks or flakes. In (b), thematrix flows with progressive flattening, and the flakes arerotated toward parallelism normal to the predominant stress.Winter (2001) An Introduction to Igneous and MetamorphicPetrology. Prentice Hall.
3/29/02 Petrology-Spring 2002, Goeke 10
• Metamorphic foliations include:– Cleavage– Schisosity– Gneissic or gneissose structure
• For a planar foliation to form σ1 > σ2 = σ3
• You can also form a lineation, where the elongateminerals either rotate or grow so that the maximumelongation is parallel to the longest axis of thedeformed ellipsoid (e.g. amphiboles align inneedles)— σ1 = σ2 > σ3 will form a pure lineationwith no foliation, but you can get both a lineationand foliation with σ1 > σ2 > σ3 (squish it from thetop more then you squish it from the sides)

6
3/29/02 Petrology-Spring 2002, Goeke 11
• Shear is like pushing on the top of the deck ofcards—things get rotated and flattened
Figure 21-2. The three main types of deviatoric stress with an example of possible resulting structures. b. Shear, causing slip alongparallel planes and rotation. Winter (2001) An Introduction to Igneous and Metamorphic Petrology. Prentice Hall.
3/29/02 Petrology-Spring 2002, Goeke 12
• Metamorphic fluids– Metamorphic fluid = either a liquid or a gas present as an
intergranular phase• Super-critical fluid = phase present above the critical
point, where gas and liquid are not separate phases– Difficult to actually see, since the fluids escape easily
during uplift and erosion• Evidence:
– fluid inclusions (could be either primary orsecondary)
– Presence of hydrous or carbonate minerals• CO2 and H2O dominant components, though other may
be present– Present due to: meteoric sources, juvenile magmatic source,
subducted material, trapped sedimentary brines,dehydrating metamorphics or degassing of the mantle

7
3/29/02 Petrology-Spring 2002, Goeke 13
– Fluids may move various chemical components overlong distances
– Metasomatism = substantial chemical change of a rockdue to the movement of a fluid phase through a rockduring metamorphism
– Most metamorphic reactions are isochemical (chemicalcomposition remains constant), though the fluid phasemay change things to a minor extent
3/29/02 Petrology-Spring 2002, Goeke 14
Types• There are varying types of metamorphism that geologists
deal with—some more common then others• One system of classifying types is to use the following
terms:– Thermal metamorphism = change due mainly to heat– Dynamic metamorphism = the dominant agent is
deviatoric stress (deformation and recrystallization)– Dynamo-thermal metamorphism = combination of
temperature and stresses• We are going to use the more tradition (e.g. what we talk
about in physical) classification scheme, which is what Iwill outline in the next few slides

8
3/29/02 Petrology-Spring 2002, Goeke 15
• Contact metamorphism– Due to thermal & metasomatic influences of intruding
a pluton into country rock– You can also have some differential pressure changes
due to the emplacement of the pluton, but this tends tobe a factor that quite a few people “ignore”
– Contact aureole = metamorphosed country rocksurrounding the pluton
– Easier to spot in shallow crustal rocks, since the deeprocks are already metamorphosed to higher grades
– We use heat-flow models to determine what the effectthe pluton will have on the rocks surrounding, whichdepend on:• Temperature of country rock• Temperature of igneous intrusion• Composition of country rock
3/29/02 Petrology-Spring 2002, Goeke 16
• Composition of igneous intrusion• Fluid composition and amount• Thickness of intrusion
Figure 21-5. Temperature distribution within a 1-km thick vertical dike and in the country rocks (initially at 0oC) as a function of time. Curves arelabeled in years. The model assumes an initial intrusion temperature of 1200oC and cooling by conduction only. After Jaeger, (1968) Cooling andsolidification of igneous rocks. In H. H. Hess and A. Poldervaart (eds.), Basalts, vol. 2. John Wiley & Sons. New York, pp. 503-536. FromWinter (2001).

9
3/29/02 Petrology-Spring 2002, Goeke 17
– Fluid can change how the system looks ratherdrastically, changing not only how far out the contactmetamorphism reaches but where the maximumtemperature occurs
– Pyrometamorphism = rare type of metamorphism dueto the contact of a volcanic deposit with the countryrock—normally accompanied by partial melting
• Regional metamorphism– Occurs over a wide geographical area and can occur
due to:• Orogeny
– Due to collision (either continent-continent,ocean-continent, or ocean-ocean)
– Involves changes in temperature and deviatoricstresses
– Rocks tend to be foliated
3/29/02 Petrology-Spring 2002, Goeke 18
– Metamorphism may continue on afterdeformation finishes and may also occur inmultiple phases (polymetamorphism)
– Contact metamorphism occurs locally, but is notthe dominant form of metamorphism
• Burial– Low-grade metamorphism in sedimentary basins
due to burial by continued deposition– Change in temperature and pressure– Evidence of fluid-driven reactions, so
hydrothermal metamorphism may play animportant part of this process
• Processes at the MOR– Considerable metasomatic alteration of basalts
produced at the MOR at low pressures, but alarge range of temperatures

10
3/29/02 Petrology-Spring 2002, Goeke 19
– Normally is seen as a loss of Ca and Siconcurrent with a gain in Na and Mg
– Black and white smokers are evidence of theinteraction between the heated seawater and therocks
– The cold seawater descends through fracturesinto the warm basalt, is heated and dissolvesvarious elements from the rock, then rises andcools, at which point it re-precipitates the ions
• Fault-zone metamorphism– Occur in areas of high shear stress, with a low
thermal change– Can be referred to as either dislocation
metamorphism or shear-zone metamorphism
3/29/02 Petrology-Spring 2002, Goeke 20
– Depends on the temperature (whichis dependent on what?) of the rocksyou started with:• Cataclasis = minerals are bent,
broken, or crushed (brittlebehavior) with little or norecrystallization—lowtemperature– Fault breccia = product of
cataclasis; broken and crushedfilling within a fault zone
– Fault gouge = alteration of abreccia to clays via interactionwith groundwater
• Mylonite = minerals are foldedand stretched (ductilebehavior)—higher temperatures
Figure 21-7. Schematic cross section across faultzones. After Mason (1978) Petrology of theMetamorphic Rocks. George Allen & Unwin.London. From Winter (2001).

11
3/29/02 Petrology-Spring 2002, Goeke 21
• More esoteric types of metamorphism– Shock metamorphism = due to impact of a meteorite
or the explosion of a bomb, plane, building, etc.– Lightening metamorphism = sudden increase in
temperature due to a lightening bolt
3/29/02 Petrology-Spring 2002, Goeke 22
Time and Metamorphism• We divide our metamorphic reactions into two categories:
– Prograde = an increase in grade due to an increase intemperature and/or pressure
– Retrograde = a decrease in metamorphic grade astemperatures and/or pressures wane
– You may see both types of reactions in the same set ofrocks, so that some of the reactions occurred on theprograde path and some on the retrograde path
• Progressive metamorphism = concept that if the rock sawhigh-grade metamorphism, it must have also seen low- andmedium-grade either somewhere on its journey
• P-T-t path = pressure-temperature-time path

12
3/29/02 Petrology-Spring 2002, Goeke 23
• Metamorphic rocks are not at equilibrium at the surface ofthe Earth, but we assume that they record normally themaximum metamorphic grade—as research progresses,however, this assumption is being called into question
• We use geothermobarometry, which is applying theconcepts of physical chemistry (e.g. thermodynamics) toreal-rock situations—not a precise art, but we’ll discussthis very important concept in greater detail later
3/29/02 Petrology-Spring 2002, Goeke 24
What are our protolith choices?• Basically, if its a rock, we can metamorphose it, but we tend to
divide rocks into six broad categories for easy referral:
High Si, Na, K, AlArkose, granitoids, rhyolitesQuartzo-feldspathic
Nearly pure SiO2Cherts, quartz-sandstonesQuartz
High Ca, Mg, CO2Limestones, dolostonesCalcareous
High Al, K, SiShales, clays, siltsPelitic
High Ca, Mg, FeBasalts, gabbros, graywackesMafic
v.high Mg, Fe, Ni, CrMantle, komatiites, cumulatesUltramafic
Elemental make-upParent rockCategory

13
3/29/02 Petrology-Spring 2002, Goeke 25
Some more terms...• Index mineral = a characteristic mineral within a
metamorphic area; indicates an approximate temperatureand pressure
• Isograd = first occurrence of an index mineral; connectsareas of approximately equal pressure and temperature
• Metamorphic zone = region characterized by a specificmineralogy, named based on the index mineral (e.g.chlorite zone, biotite zone) and is bounded on by isograds
• Barrovian series or zones = sequence of metamorphiczones characteristic for regional metamorphism at higherpressures; type locality is the Scottish Highlands that weremapped by Barrow (late 1800’s, early 1900’s)
• Buchan or Abukuma series = low pressure metamorphicPT path; contains andalusite instead of sillimanite
3/29/02 Petrology-Spring 2002, Goeke 26
Figure 21-9. The P-T phase diagram for the system Al2SiO5 showing the stability fields for the three polymorphs andalusite, kyanite, andsillimanite. Also shown is the hydration of Al2SiO5 to pyrophyllite, which limits the occurrence of an Al2SiO5 polymorph at low grades in thepresence of excess silica and water. The diagram was calculated using the program TWQ (Berman, 1988, 1990, 1991). From Winter (2001).

14
3/29/02 Petrology-Spring 2002, Goeke 27
• Metamorphic facies = defined by a specific pressure andtemperature regime; irregardless of mineralogy, so goodfrom transferring from one protolith to another; named,however, based on what occurs to a basalt at variousconditions (e.g. greenschist, amphibolite)
• Paired metamorphic belts = parallel metamorphic belts,which are also parallel to the subduction trench– Inner belt (furthest away from trench) is a low P-style
metamorphic series—granitoids common– Outer belt (closer to trench) is typically high P, low T
metamorphic facies—blueschists common
3/29/02 Petrology-Spring 2002, Goeke 28
Figure 21-12. The Sanbagawa and Ryokemetamorphic belts of Japan. From Turner (1981)Metamorphic Petrology: Mineralogical, Field,and Tectonic Aspects. McGraw-Hill andMiyashiro (1994) Metamorphic Petrology.Oxford University Press. From Winter (2001).
Figure 21-13. Some of the paired metamorphic belts inthe circum-Pacific region. From Miyashiro (1994)Metamorphic Petrology. Oxford University Press.From Winter (2001).

1
4/15/02 Petrology-Spring 2002, Goeke 1
Microstructural Analysisa.k.a. Metamorphic Textures and
Structures
Chapter 23
4/15/02 Petrology-Spring 2002, Goeke 2
• Texture or fabric = small-scale features that are penetrative(occurs in virtually all of the rock body at the microscopiclevel)
• Structure = larger-scale features; found in hand-sample,outcrop, or regional scale
• Microstructure = advocated term (instead of texture) formicroscope-scale features
• This chapter will mainly deal with microstructural analysis,however what we find on the thin section scale is oftenmirrored by structures found at the hand-sample and largerscale—so looking at thin sections can help us understandthe structural history of a region
• Growth of new minerals depends on:– Detachment of ions from the reacting minerals– Diffusion of the ions to where the new minerals will
grow

2
4/15/02 Petrology-Spring 2002, Goeke 3
– Nucleation of the new mineral(s)– Growth of the new mineral(s)
• What will be the rate-determining factor?• Deformation, recovery, recrystallization, and timing of
deformation vs. crystallization also influence what themicrostructure will look like– Alone they processes cause clear microstructures, but if two
or more occur concurrently it can make analysiscomplicated
• -blast or –blastic = microstructure that is metamorphic in origin• Blasto- or relict = microstructure is NOT metamorphic in
origin; inherited from parent rock• Idioblastic = euhedral; hybidioblastic = subhedral; xenoblastic
= anhedral• Winter has taken a great deal of this chapter from Passchier and
Trouw (1998)—I’ll leave it in the room
4/15/02 Petrology-Spring 2002, Goeke 4
Deformation, Recovery, andRecrystallization
• Deformation depends on:– Mineralogy– Grain size and orientation– Presence, composition, and mobility of intergranular
fluid phases– Temperature– Pressure– Deviatoric stress– Fluid pressure– Strain rate

3
4/15/02 Petrology-Spring 2002, Goeke 5
• The following list is in order of increasing temperatureand/or decreasing strain-rate:
• Cataclastic flow = mechanical fragmentation of a rockaccompanied by the sliding and rotation of the fragments
– Products: fault gouge, breccia, or cataclasite• Pressure solution = grain contacts at a high angle to σ1
become highly strained → higher energy; mineraldissolves readily at the contact, then the dissolvedmaterial migrates to areas of low energy to reprecipitate
– Works better with a fluid phase involved– Low-energy = low strain rate
• Intracrystalline deformation of a plastic type =permanent changes in the position of ions, normallydealing with the breaking of chemical bonds
– No cohesion loss of the rock– Often multiple processes happens concurrently
4/15/02 Petrology-Spring 2002, Goeke 6
Figure 23-2 a. Highest strain in areas near grain contacts (hatchpattern). b. High-strain areas dissolve and material precipitatesin adjacent low-strain areas (shaded). The process isaccompanied by vertical shortening. c. Pressure solution of aquartz crystal in a deformed quartzite (σ1 is vertical). Pressuresolution results in a serrated solution surface in high-strainareas (small arrows) and precipitation in low-strain areas (largearrow). ~ 0.5 mm across. The faint line within the grain is ahematite stain along the original clast surface. After Hibbard(1995) Petrography to Petrogenesis. Prentice Hall. FromWinter (2001).
Little arrows are dissolving,big arrow is where mineralis precipitating

4
4/15/02 Petrology-Spring 2002, Goeke 7
– Defect = places within a crystal lattice where the ionsare not in the correct location
• Point defect = an individual ion either out of place(interstitial) or missing (vacancy)
• Line defect = a plane of ions in the “wrong” placeeither by an “extra” half-plane added (edgedislocation) or a half-plane shifted over from whereit should be (screw dislocation)
– Edge and screw dislocations can be connected toone another
• Fig. 3.7 from Passchier and Trouw: (a) point defects, (b)line defects, (c) combo edge and screw dislocation– Defects can migrate under deformation as the crystal
tries to become more stable– Dislocation glide = movement of dislocations within
the crystal
4/15/02 Petrology-Spring 2002, Goeke 8
Figure 23-2. a. Migration of avacancy in a familiar game.b. Plastic horizontal shortening of acrystal by vacancy migration. FromPasschier and Trouw (1996)Microtectonics. Springer-Verlag.Berlin. From Winter (2001).
Fig. 3.9 fromPasschier and Trouwto talk about elasticvs. permanent andmigration

5
4/15/02 Petrology-Spring 2002, Goeke 9
– Slip direction = the only way the dislocation can move dueto crystallographic constraints; defined by a Miller index(e.g. [010])
– Slip plane = plane along which slip can occur; characterizedby a Miller index (e.g. (001))
– Slip system = describes both the slip direction and plane byusing Miller indices (e.g. (001)[010]); usually determined byTEM
• In some minerals, several slip systems can be active (e.g.calcite, quartz), but in others only one way will work
– Strain hardening = when different slip systems run into oneanother, the dislocations can become tangled and nowrequire a higher amount of stress to move further, causingthe mineral to be more difficult to deform
• e.g. if you take a piece of wire and bend it back and forth,it will first become more difficult to bend then finallybreak
4/15/02 Petrology-Spring 2002, Goeke 10
• Strain hardening promotes brittle behavior ofminerals over ductile deformation
• Movement of vacancies to the tangle can overcomestrain hardening, by allowing the dislocation to“climb” over the tangle and escape = dislocationcreep
– Lattice-preferred orientation (LPO) = preferredorientation of the lattice due to the movement ofdislocations through a rock
– Undulose extinction = heterogeneous extinction of acrystal due to bending of the crystal lattice
• Can be either “sweeping” (due to large-scale regularbending of crystal) or patchy & irregular (caused bymicroscopically invisible fractures and kinks)
• Common in quartz

6
4/15/02 Petrology-Spring 2002, Goeke 11
Figure 23-4 a. Undulose extinction and (b) elongatesubgrains in quartz due to dislocation formation andmigration Winter (2001) An Introduction to Igneousand Metamorphic Petrology. Prentice Hall.
a
b
4/15/02 Petrology-Spring 2002, Goeke 12
– Deformation twinning or mechanical twinning =dislocation to accommodate a limited about of strain;only occurs in specific crystallographic orientations• Common in plagioclase and calcite• Twins taper inwards instead of being nice and
straight all the way through• Occurs at low temperatures
• Recovery = lowering of strain energy by:– Migration of vacancies to dislocation tangles →
straightens out blocked and tangled areas– Migration can straighten bent dislocations– Migration of dislocations can allow them to arrange
themselves into more stable networks– Two dislocations can meet and cancel each other out

7
4/15/02 Petrology-Spring 2002, Goeke 13
– During deformation, recovery and dislocation occursimultaneously and will depend on temperature,strain rate, etc. for which one is the dominant feature
– Recovery dominates once deformation begins to diedown
– Subgrains = portions of a grain in which the latticesdiffer by a small angle; caused by dislocationsconcentrating in planar arrays
– Recovery reduces the amount of potential energy inthe system, so that the grain can be “more”metastable
• Recrystallization = movement or development of newgrain boundaries to reduce lattice strain energy
– Produce different grains, with high-angle orientationdifferences from their neighbors (in contrast tosubgrains)
4/15/02 Petrology-Spring 2002, Goeke 14
Figure 23-5. Illustration of a recovery process in whichdislocations migrate to form a subgrain boundary. Winter (2001)An Introduction to Igneous and Metamorphic Petrology. PrenticeHall.

8
4/15/02 Petrology-Spring 2002, Goeke 15
– Grain boundary migration (GBM) = growth of a lowdislocation density crystal at the expense of a neighboringhigh dislocation density crystal• Bulging = the boundary may push its way into the high
dislocation density crystal and form a new, independentcrystal
• A new crystal may also nucleate in the middle of a highlydeformed grain, but this is rare
• No chemical difference between the old and new grains isrequired, but it may occur (e.g. feldspars have beenobserved to have a small compositional difference)
– Subgrain rotation (SR) = dislocations are continuously addedto a subgrain boundary• Dislocations must be able to move from one lattice plane to
another• Gradually the the angle between the two sides of the
subgrain boundary increases until its a new grain
4/15/02 Petrology-Spring 2002, Goeke 16
Figure 23-6. Recrystallization by (a) grain-boundary migration(including nucleation) and (b) subgrain rotation. From Passchier andTrouw (1996) Microtectonics. Springer-Verlag. Berlin. FromWinter (2001).
Figure 23-7a. Recrystallized quartz with irregular(sutured) boundaries, formed by grain boundarymigration. Width 0.2 mm. From Borradaile et al.(1982). From Winter (2001).

9
4/15/02 Petrology-Spring 2002, Goeke 17
– Dynamic recrystallization = processes ofrecrystallization during deformation
• Tends to produce elongated grains and well-developed schistosity
– Annealing or static recrystallization = post-deformationrecrystallization
– Solid-state diffusion creep = deformation of crystals byonly the migration of vacancy sites through the lattice;occurs at high temperatures
– Crystalplastic deformation = term used whendislocation creep and diffusion creep can not bedistinguished from one another
– Grain boundary sliding = in fine-grained aggregatescrystals may slide past one another
• Voids prevented by solid-state diffusion creep orsolution and precipitation of a fluid phase
4/15/02 Petrology-Spring 2002, Goeke 18
– Grain Boundary Area Reduction (GBAR) = decrease inthe total surface area of grain boundaries to reduce theinternal free energy
• Straight boundaries and polygonal shapes arefavored
• Though GBAR may occur during deformation, itdominates only after deformation hasceased—especially at high temperatures
• How a specific mineral will react depends greatly ontemperature—different minerals undergo differentprocesses at the same temperature– E.g. at 200-300 C quartz is ductile, but feldspars still
act brittlely

10
4/15/02 Petrology-Spring 2002, Goeke 19
Contact Metamorphism Textures• Remember: Winter considers contact metamorphism—as
do quite a few other petrologists—not to have a largeamount of deviatoric stress involved
• So, if we assume little to no deviatoric stress, what shouldthe texture be?
Near-static environmentLack of preferred mineral orientationRandom orientation of elongated mineralsEquidimensional minerals preferredCommon relict textures
4/15/02 Petrology-Spring 2002, Goeke 20
• Granoblastic polygonal or polygonal mosaic = textureoccurring in monomineralic aggregates caused by GBAR;all grains meet along straight boundaries with triplejunction contacts at ~120°– Occurs if no particular face has lower or higher energy
levels then the other faces; e.g. calcite and quartz– What will size depend on?
• Decussate = an arrangement of randomly oriented elongategrains– For grains that do have higher & lower surface energy
faces, the lower energy faces will tend to grow largerthan their counterparts; e.g. micas and amphiboles
• In polymineralic aggregates, the contact between twodifferent types of minerals commonly has a lower surfaceenergy then two grains of the same composition, sometamorphism will favor contact between differentminerals; e.g. quartz grains separated by biotite grains

11
4/15/02 Petrology-Spring 2002, Goeke 21
Figure 23-9. Typical textures of contactmetamorphism. From Spry (1969)Metamorphic Textures. Pergamon.Oxford. From Winter (2001).
• Porphyroblast =larger grains in amatrix of smallergrains
• Poikiloblast =porphyroblast thatincorporate numerousinclusions—occur inquickly growinggrains
• Skeletal or web orspongy = extremepoikiloblasttexture—extremelyquick growth
4/15/02 Petrology-Spring 2002, Goeke 22
• Porphyroblasts occur due to low nucleation rates forcertain minerals, which means that ions must diffuse overgreater distances for the grain to continue growing– Depletion halo = area surrounding a porphyroblast from
which certain ions have been removed in order to growthe grain; can refer to a lack of certain elements or alack of certain minerals
Depletion halo around garnetporphyroblast. Boehls Butte area,Idaho From Winter (2001).
Progressive development of adepletion halo about agrowing porphyroblast. FromBest (1982). Igneous andMetamorphic Petrology. W.H. Freeman. San Francisco.From Winter (2001).

12
4/15/02 Petrology-Spring 2002, Goeke 23
• Nodular = ovoid porphyroblasts; common infine grained rocks
• Spotted = small porphyroblasts in hand-sample; can be ovoid in shape– Spotted shales and spotted phyllites are
relatively common due to low-graderegional metamorphism
Figure 23-14. Overprint of contactmetamorphism on regional. a. Nodulartexture of cordierite porphyroblastsdeveloped during a thermal overprintingof previous regional metamorphism (notethe foliation in the opaques). Approx. 1.5x 2 mm. From Bard (1986) Microtexturesof Igneous and Metamorphic Rocks.Reidel. Dordrecht. b. Spotted phyllite inwhich small porphyroblasts of cordieritedevelop in a preexisting phyllite. Winter(2001) An Introduction to Igneous andMetamorphic Petrology. Prentice Hall.From Winter (2001).
4/15/02 Petrology-Spring 2002, Goeke 24
• Whether or not a grain is euhedral is dependent on the typeof mineral—unlike igneous grains when time ofcrystallization determined shape
• Depending on surface energy, lattice structure, etc. somegrains are just naturally more euhedral then others; thefollowing list goes from most commonly euhedral to mostcommonly anhedral:– Sphene, rutile, pyrite, spinel– Garnet, sillimanite, staurolite, tourmaline– Epidote, magnetite, ilmenite– Andalusite, pyroxene, amphibole– Mica, chlorite, dolomite, kyanite– Calcite, vesuvianite, scapolite– Feldspar, quartz, cordierite

13
4/15/02 Petrology-Spring 2002, Goeke 25
High-Strain Textures• What occurs at shallow vs. deep depths?• Shredded = thin sheets of phyllosilicates that bend or break
due to slip at high strain rates• Undulose extinction is very, very, very common• Porphyroclasts = large pieces of broken material within a a
matrix of crushed material; survived either because theywere larger to start with or they were more resistant tobreakage
• Mortar = large porphyroclasts surrounded by a matrix ofcrushed material
• Pseudotachylite = irregular deformed grains suspended ina glassy matrix caused by localize melting due to shearheating
4/15/02 Petrology-Spring 2002, Goeke 26
a
b
Figure 23-15.Progressivemylonitization of agranite. From Shelton(1966). GeologyIllustrated. Photoscourtesy © John Shelton.From Winter (2001).
Undeformedgranite
Mortartexture

14
4/15/02 Petrology-Spring 2002, Goeke 27
• At greaterdepths,twinningandelongationareprevalent—mylonites
• Ribbons =highlyelongatequartzgrains
d
c
4/15/02 Petrology-Spring 2002, Goeke 28
• Polygonization = result of recovery processes that formsubgrains
• Coalescence = larger grains form from subgrains or by theaddition of smaller grains by grain boundary migrationrecrystallization
Figure 23-16a. Large polygonized quartzcrystals with undulose extinction andsubgrains that show sutured grainboundaries caused by recrystallization.Compare to Figure 23-15b, in which little,if any, recrystallization has occurred.From Urai et al. (1986) Dynamicrecrystallization of minerals. In B. E.Hobbs and H. C. Heard (eds.), Mineraland Rock Deformation: LaboratoryStudies. Geophysical Monograph 36.AGU. From Winter (2001).

15
4/15/02 Petrology-Spring 2002, Goeke 29
Shear Sense Indicators• This is material I really learned about during my structure
class—which was taught by a metamorphic petrologist ☺• This is really where we start using microstructure to say
something about the tectonics of what occurred• The sense of the shear will tell us which one of the two
opposite possible motions associated with a given sheardirection actually occurred—and is, unfortunately, moredifficult to distinguish than just the direction of shear
• Since shear occurs in 3-D, we need to be extremely carefulwhen looking at something in 2-D, which all thin sectionsare!– Hand samples are oriented at the outcrop with a
Brunton
4/15/02 Petrology-Spring 2002, Goeke 30
– Thin sections are carefully cut parallel or perpendicularto the direction of motion—depends on what you wantto study
– Thin sections are also marked so we can relate themback to the outcrop orientation
• If life was easy, we could just use offset dikes or someother linear/planar structure to determine what the sense ofshear was—not a normal feature, though
Figure 23-17. Some features that permit the determination ofsense-of-shear. All examples involve dextral shear. σ1 is orientedas shown. a. Passive planar marker unit (shaded) and foliationoblique to shear planes. After Passchier and Trouw (1996)Microtectonics. Springer-Verlag. From Winter (2001).

16
4/15/02 Petrology-Spring 2002, Goeke 31
Figure 23-17. Some features that permit the determination of sense-of-shear. All examples involve dextral shear. σ1 is oriented as shown.a. Passive planar marker unit (shaded) and foliation oblique to shear planes. After Passchier and Trouw (1996) Microtectonics. Springer-Verlag. Winter (2001).
• Oblique foliation = cuts across the the S-foliation developed due to shear
When we try todeform a deck ofcards that have aline on them, theplane of thecontact betweenthe cards willrotate more thenthe line we drewon them—they’llapproach parallel,but never getthere.
4/15/02 Petrology-Spring 2002, Goeke 32
• Shear bands = spaced cleavages that cut acrossa well-developed mineral foliation that formsimultaneously; “C” in the diagram to the right
• Shear band cleavage or S-C texture = thecombined feature of shear bands and mineralfoliations– “C” surfaces parallel to shear plane– Sense of shear determined from angle
between “S” and “C”
Figure 23-17. Some features that permit the determination of sense-of-shear. All examples involve dextral shear. σ1 is oriented as shown.a. Passive planar marker unit (shaded) and foliation oblique to shear planes. After Passchier and Trouw (1996) Microtectonics. Springer-Verlag. Winter (2001).

17
4/15/02 Petrology-Spring 2002, Goeke 33
• Mantle porphyroclasts = porphyroclast with a rim of finegrained material; e.g. more resistant feldspars surroundedby micas, quartz, and other feldspars– Mantle forms by ductile deformation– Augen = more resistant grains within mantles– Tail = extension of mantle into the foliation– Different types of tails can form:
• θ-type = no tail• φ-type = symmetrical tails
Figure 23-19. Mantled porphyroclasts and “mica fish” as sense-of-shear indicators. After Passchier and Simpson (1986) Porphyroclastsystems as kinematic indicators. J. Struct. Geol., 8, 831-843. From Winter (2001).
4/15/02 Petrology-Spring 2002, Goeke 34
Figure 23-19. Mantled porphyroclasts and “mica fish” as sense-of-shear indicators. After Passchier and Simpson (1986) Porphyroclast systemsas kinematic indicators. J. Struct. Geol., 8, 831-843. From Winter (2001).
• σ-type or stair-step = asymmetrical tails; foliationdrags at the softer mantle probably to form these
• δ-type = believed to begin as a σ-type, whose corewas further rotated to bend the tail further around it
• We can use the σ-type and the δ-type to get sense ofshear, though you have to be careful not to confusethe two—you would get the opposite sense of shear!

18
4/15/02 Petrology-Spring 2002, Goeke 35
• Continued rotation of the core can cause complexobjects that are even more funky
• Mica fish = single mica grains shaped like σ-type grains;the (001) plane be either // or at an angle to the slipdirection (as shown by the two different drawings below)
Figure 23-19. Mantled porphyroclasts and “mica fish” as sense-of-shear indicators. AfterPasschier and Simpson (1986) Porphyroclast systems as kinematic indicators. J. Struct.Geol., 8, 831-843. From Winter (2001).
Figure 23-38. “Snowball garnet” withhighly rotated spiral Si. Porphyroblastis ~ 5 mm in diameter. From Yardleyet al. (1990) Atlas of MetamorphicRocks and their Textures. Longmans.From Winter (2001).
4/15/02 Petrology-Spring 2002, Goeke 36
• Quarter structures = unmantledporphyroclasts around which smallfolds in the foliation have beendragged by shear
• Quarter mats = concentration ofmica in the extension directionthat formed from the dissolvedgrains in the shortened quadrants
• Asymmetric folds = folds that donot have mirror symmetry
• Pairs of dikes can also be used, ifthey were once at a big enoughangle to each other
Figure 23-20. Other methods to determine sense-of-shear. Winter(2001) An Introduction to Igneous and Metamorphic Petrology. PrenticeHall.
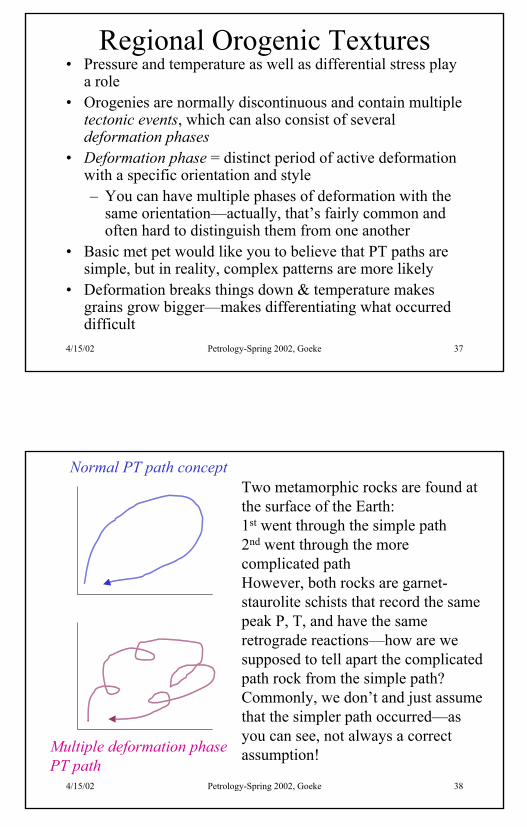
19
4/15/02 Petrology-Spring 2002, Goeke 37
Regional Orogenic Textures• Pressure and temperature as well as differential stress play
a role• Orogenies are normally discontinuous and contain multiple
tectonic events, which can also consist of severaldeformation phases
• Deformation phase = distinct period of active deformationwith a specific orientation and style– You can have multiple phases of deformation with the
same orientation—actually, that’s fairly common andoften hard to distinguish them from one another
• Basic met pet would like you to believe that PT paths aresimple, but in reality, complex patterns are more likely
• Deformation breaks things down & temperature makesgrains grow bigger—makes differentiating what occurreddifficult
4/15/02 Petrology-Spring 2002, Goeke 38
Normal PT path concept
Multiple deformation phasePT path
Two metamorphic rocks are found atthe surface of the Earth:1st went through the simple path2nd went through the morecomplicated pathHowever, both rocks are garnet-staurolite schists that record the samepeak P, T, and have the sameretrograde reactions—how are wesupposed to tell apart the complicatedpath rock from the simple path?Commonly, we don’t and just assumethat the simpler path occurred—asyou can see, not always a correctassumption!

20
4/15/02 Petrology-Spring 2002, Goeke 39
Tectonites, Foliations, andLineations
• Tectonite = a microstructure that records the deformationby developing a preferred mineral orientation
• Foliation = any planar texture element; e.g. cleavage,bedding
• Lineation = a linear texture element; e.g. alignedamphiboles along their c-axes
• Primary = pre-deformation; e.g. bedding• Secondary = deformational; e.g. schistosity
4/15/02 Petrology-Spring 2002, Goeke 40
Foliations• A number of different foliations are
possible:• Compositional layering• Preferred orientation of platy
minerals• Shape of deformed grains• Grain size variation• Preferred orientation of platy
minerals in a matrix withoutpreferred orientation
• Preferred orientation of lenticularmineral aggregates
• Preferred orientation of fractures• Combinations of the above
Figure 23-21. Types of fabric elements that may define a foliation. FromTurner and Weiss (1963) and Passchier and Trouw (1996). From Winter(2001).

21
4/15/02 Petrology-Spring 2002, Goeke 41
• Continuous = foliationdoes not vary acrossarea of thin section
• Spaced = thin sectionhas microlithons(unfoliated areas) andcleavage domains(fractures orconcentrations of platyminerals)
Figure 23-22. A morphological (non-genetic) classification of foliations. After Powell(1979) Tectonophys., 58, 21-34; Borradaile et al. (1982) Atlas of Deformational andMetamorphic Rock Fabrics. Springer-Verlag; and Passchier and Trouw (1996)Microtectonics. Springer-Verlag. From Winter (2001).
4/15/02 Petrology-Spring 2002, Goeke 42
• Crenulation cleavage = two foliations; 1st
cleavage/schistosity, 2nd is microfolding ofthe existing foliation; can be eithersymmetrical or asymmetrical
• We can sometimes still find primary beddingin thin sections (right photomicrograph)
Figure 23-24a. Symmetricalcrenulation cleavages inamphibole-quartz-rich schist.Note concentration of quartz inhinge areas. From Borradaile etal. (1982) Atlas ofDeformational and MetamorphicRock Fabrics. Springer-Verlag.From Winter (2001).
Figure 23-24b. Asymmetric crenulation cleavagesin mica-quartz-rich schist. Note horizontalcompositional layering (relict bedding) andpreferential dissolution of quartz from one limb ofthe folds. From Borradaile et al. (1982) Atlas ofDeformational and Metamorphic Rock Fabrics.Springer-Verlag. From Winter (2001).
Figure 23-25. Stages in the development of crenulation cleavage as a function of temperatureand intensity of the second deformation. From Passchier and Trouw (1996) Microtectonics.Springer-Verlag. From Winter (2001).

22
4/15/02 Petrology-Spring 2002, Goeke 43
Lineations• Preferred orientation of
elongated mineralaggregates
• Preferred orientation ofelongate minerals
• Lineation defined byplaty minerals
• Fold axes (especially ofcrenulations)
• Intersecting planarelements (e.g. bedding& cleavage, cleavage &cleavage)
Figure 23-26. Types of fabric elements that define alineation. From Turner and Weiss (1963) Structural Analysisof Metamorphic Tectonites. McGraw Hill. From Winter(2001).
4/15/02 Petrology-Spring 2002, Goeke 44
Mechanisms of Development• Mechanical
rotation =minerals as rigidbodies rotate; lowT
• Oriented mineralgrowth = mineralsgrow in low stressdirection
• Competitivegrowth = σ3aligned mineralsgrow at theexpense of σ1aligned minerals
Figure 23-27. Proposed mechanisms for the development of foliations. After Passchierand Trouw (1996) Microtectonics. Springer-Verlag. From Winter (2001).
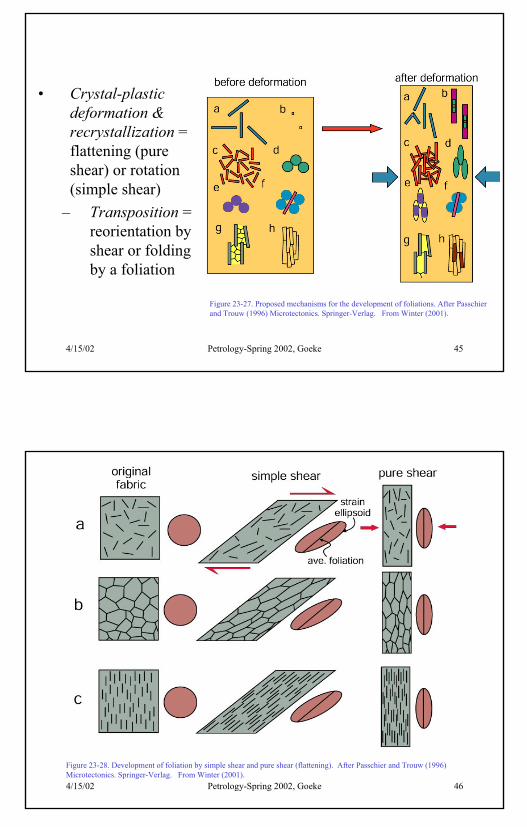
23
4/15/02 Petrology-Spring 2002, Goeke 45
• Crystal-plasticdeformation &recrystallization =flattening (pureshear) or rotation(simple shear)
– Transposition =reorientation byshear or foldingby a foliation
Figure 23-27. Proposed mechanisms for the development of foliations. After Passchierand Trouw (1996) Microtectonics. Springer-Verlag. From Winter (2001).
4/15/02 Petrology-Spring 2002, Goeke 46
Figure 23-28. Development of foliation by simple shear and pure shear (flattening). After Passchier and Trouw (1996)Microtectonics. Springer-Verlag. From Winter (2001).

24
4/15/02 Petrology-Spring 2002, Goeke 47
• Pressure solutionand solutiontransfer = dissolveminerals from theσ1 direction andreprecipitate themin the σ3 direction;causes elongateminerals; moreeffective if fluidpresent
• Combination of (a)and (e)
• Constraints placedby neighboringgrains may alsocause elongategrowth
Figure 23-27. Proposed mechanisms for the development of foliations. After Passchierand Trouw (1996) Microtectonics. Springer-Verlag. From Winter (2001).
4/15/02 Petrology-Spring 2002, Goeke 48
• Mimetic = growthduring a post-deformational stagethat mimics theorientation of thesyn-deformationalcrystal growth
• Thermodynamicequilibrium isassumed to occurquicker thentexturalequilibrium—butboth depend ontime Figure 23-27. Proposed mechanisms for the development of foliations. After Passchier
and Trouw (1996) Microtectonics. Springer-Verlag. From Winter (2001).

25
4/15/02 Petrology-Spring 2002, Goeke 49
Gneissose Structure and Layers
• Metamorphic differentiation = a not-well understoodconcept of how metamorphic rocks segregate into mafics +felsics with increasing temperature
• Winter discusses some of the current (& past) ideas, butlet’s just leave it with the idea that at higher temperaturesthe rocks forms secondary layering
4/15/02 Petrology-Spring 2002, Goeke 50
Other Textures...• In addition to foliations, lineations, and
gneissic textures, we can also find:– Folds– Kink bands = zones bounded by
parallel planes in which some featurehas a different orientation; usuallydevelops in conjunction withcleavages
– Boudinage = less ductile elementsthan their surroundings stretch andseparate into tablets or sausage-shapes (boudins) as the surroundingmaterial flows around them
Figure 23-30. Kink bands involving cleavage indeformed chlorite. Inclusions are quartz (white),and epidote (lower right). Field of view ~ 1 mm.Winter (2001) An Introduction to Igneous andMetamorphic Petrology. Prentice Hall.
http://www.geol-alpes.com/0_accueil/glossaire_tecto.html

26
4/15/02 Petrology-Spring 2002, Goeke 51
Deformation vs. Mineral Growth• Foliations are defined as S-surfaces (we use S for short)
and lineations as L-tectonites (L for short)• If multiple foliations or lineations are present, we start
using subscripts– S0 or L0 = primary structures– S1, S2, S3, etc = secondary structures in the order they
formed– Normally when first working in an area, you don’t
really know how many foliations/lineations you’regoing to find—or what the earliest will be—sotraditionally the first foliation you discover is Sx andthen successive foliations either become Sx+1 or Sx-1
– We also use the subscripts to delineate betweendifferent deformational (D) and metamorphic (M)phases
4/15/02 Petrology-Spring 2002, Goeke 52
Figure 23-42.(left)Asymmetriccrenulationcleavage (S2)developed overS1 cleavage. S2is folded, as canbe seen in thedark sub-vertical S2bands. Fieldwidth ~ 2 mm.Right:sequentialanalysis of thedevelopment ofthe textures.From Passchierand Trouw(1996)Microtectonics.Springer-Verlag. FromWinter (2001).

27
4/15/02 Petrology-Spring 2002, Goeke 53
• We use the terms pre-, syn-, post- and inter-kinematic todistinguish between mineral growth that occurred before,during, after, and between two phases of deformation
• When a mineral formed, however, is usually notblatantly clear, so some care must be taken in assigning atime-designation to it—and some minerals will havegrown during multiple phases
• Porphyblasts are probably one of the most useful toolsfor determining what happened to the rock over time forseveral reasons:
– Tend to be more resistant, so they are commonlyporphyroclasts during deformation (sense-of-shearindicators)
– The inclusions within a given porphyroblast mayimpart information about the deformational history
4/15/02 Petrology-Spring 2002, Goeke 54
Figure 23-33. Illustration of an Al2SiO5 poikiloblast that consumes moremuscovite than quartz, thus inheriting quartz (and opaque) inclusions. The natureof the quartz inclusions can be related directly to individual beddingsubstructures. Note that some quartz is consumed by the reaction, and that quartzgrains are invariably rounded. From Passchier and Trouw (1996) Microtectonics.Springer-Verlag. From Winter (2001).
• We can sometimes find aligned inclusionswithin a porphyroblast which form aninternal-S (Si)
• Which came first: the porphyroblast or thefoliation? What principle from physicalgeology can you use to determine this?
The foliation must have been therebefore the porphyroblast, since thetheory of cross-cutting relationshipsstates that to either cross-cut a featureor to include it within a second body, itmust have been their first!

28
4/15/02 Petrology-Spring 2002, Goeke 55
• Armored relic = relict phaseprotected as an inclusionwithin a porphyroblast evenafter the remaining matrixgrains of that phase havebeen consumed by a reaction
• Evidence for pre-kinematiccrystals
• Bent crystal with unduloseextinction
• Foliation wrapped around aporphyroblast
• Pressure shadow or fringe• Kink bands or folds• Microboudinage• Deformation twins
Figure 23-34. Typical textures of pre-kinematic crystals. FromSpry (1969) Metamorphic Textures. Pergamon. Oxford. FromWinter (2001).
4/15/02 Petrology-Spring 2002, Goeke 56
• Evidence forPost-kinematiccrystals
• Helicitic folds• Randomly
oriented crystals• Polygonal arcs• Chiastolite• Late, inclusion-
free rim on apoikiloblast—this is only apossibility, not aguarantee
• Randomaggregatepseudomorph
Figure 23-35. Typical textures of post-kinematic crystals. From Spry (1969)Metamorphic Textures. Pergamon. Oxford. From Winter (2001).

29
4/15/02 Petrology-Spring 2002, Goeke 57
• It is much more difficult to determineconcretely whether or not a mineral insyn-kinematic, even though its probablythe most common type ☺
• If we look at the micro-boudinageoccurring to the right, as the mineralbreaks, a new composition of our originalphase forms
• As the crystal continues to break apart,new layers are added to the grainseventually forming a zoned crystal
• This has been seen in amphiboles(Wintsch et al., 1999), which changecolor as you vary their compositions
• You need the zoning + the micro-boudinage to say it is syn-kinematic
Figure 23-36. Syn-crystallization micro-boudinage. Syn-kinematic crystal growth canbe demonstrated by the color zoning that growsand progressively fills the gap between theseparating fragments. After Misch (1969)Amer. J. Sci., 267, 43-63. From Winter (2001).
4/15/02 Petrology-Spring 2002, Goeke 58
• The variance of theinclusion trail orientationfrom core to rim hasbeen used as evidence forsyn-kinematic growth ofporphyroblasts
• This diagram is oneinterpretation of how thepictured garnet grew: theporphyroblast rotated asit grew into a spiralpattern
• Not everyone acceptsthis interpretation—somebelieve its the foliationmoving around thegrain—they giveopposite senses of shear!
Figure 23-38. Traditional interpretation of spiral Si train in which a porphyroblastis rotated by shear as it grows. From Spry (1969) Metamorphic Textures.Pergamon. Oxford. From Winter (2001).
Figure 23-38. “Snowball garnet” withhighly rotated spiral Si. Porphyroblastis ~ 5 mm in diameter. From Yardleyet al. (1990) Atlas of MetamorphicRocks and their Textures. Longmans.From Winter (2001).

30
4/15/02 Petrology-Spring 2002, Goeke 59
Figure 23-37. Si characteristics of clearly pre-, syn-, and post-kinematic crystals as proposed by Zwart (1962). a. Progressively flattened Sifrom core to rim. b. Progressively more intense folding of Si from core to rim. c. Spiraled Si due to rotation of the matrix or theporphyroblast during growth. After Zwart (1962) Geol. Rundschau, 52, 38-65. From Winter (2001).
Traditional view...but we can come up with other explanations!
4/15/02 Petrology-Spring 2002, Goeke 60
Crystallography Controlled Inclusions• Some types of inclusions occur because by either the
lattice or growth surfaces of the porphyroblast• Chiastolite cross = cross found in andalusite, which
most likely develops in a few steps:– Preferential attachment of impurities during growth
(e.g. graphite) at the rapidly growing corners of thegrain
– Retardation of crystal growth due to the impurities– Overgrowth of the impurity by the porphyroblast
• Sector zoning = faster-growing faces preferentiallyincorporate inclusions—if it only occurs on one pair ofgrowing faces, you get an hour-glass pattern
• Exsolution also falls into this category either of 1feldspar to 2 feldspars, or from biotite to biotite + rutile

31
4/15/02 Petrology-Spring 2002, Goeke 61
Figures 23-50 and 23-51
4/15/02 Petrology-Spring 2002, Goeke 62
Replacements & Reaction Rims• Replacement textures are probably one of the neatest/most
frustrating things to see when trying to derive the geologichistory from a thin section– Record at least one reaction that did not go to
completion– May give a good indication of the path the rock took– Screw up any chance of trying to do thermobarometry
(we’ll discuss this in chp 27)– Can range from a reaction frozen that was almost
complete, to half-finished, to just started• Pseudomorph = reaction products retain the shape of the
original grain• Symplectite = wormy-looking intergrowths of two minerals
that replaced some other phase

32
4/15/02 Petrology-Spring 2002, Goeke 63
Pseudomorph pics (chlorite + quartz aftergarnet in ERG-3b) and symplectite pic(microprobe image from the allanitesample)—also have the nice reactiontexture pics from NEK97-13 (cordieritesample)
4/15/02 Petrology-Spring 2002, Goeke 64
• Reaction rim = partial reaction of one phase to another thatoccurs at the rim of the grain; rim can include 1+ phases
• Corona = rim that completely encircles the original phase
Several ERG-32b pics of chlorite rimming garnet

Questions for Chapter 24Stable Mineral Assemblages in Metamorphic Rocks
While I’m gone for NC-SE GSA, I’m going to leave you a chapter to read in your Wintertextbook. To help you focus on the text, I have formulated the following questions. If I ask thequestion here, I can ask the question on the exam. Do not settle for the quickest answer, butmake sure you have the complete answer! If you have questions, we can talk about them onTuesday, but otherwise I will consider this material covered and move on.
1. What fixes the equilibrium mineralogy of a rock?
2. What do metamorphic petrologists use to assume equilibria? Explain each one briefly. (There are six forms of evidence.)
3. What is the phase rule?
a. What does each of the letters stand for?
b. Why can we assume that F � 2?
c. How can we use (b) to evaluate whether a rock is at equilibrium or not?
d. What are the implications if 1 > C ?
e. What will determine how long a reaction can occur?

f. In a metamorphic rock that went along a path from the garnet to chlorite zone,how can garnet still be present within the rock? (hint: look at the formula ofchlorite to determine what must be present for it to form)
4. Chemographic Diagramsa. Do metamorphic petrologist and igneous petrologists plot compositions based on
the same quantitative basis? If yes, how do they differ?
b. Plot the following phases on a ternary diagram:i. Aii. Biii. Civ. B2Cv. A2BCvi. AC
c. What are the five stable mineral assemblages for the ternary diagram in (b)? Draw tie-line connecting the stable assemblages.
d. What are the assumptions behind the ternary diagram condition-wise?
e. If we plot the bulk composition in a smaller triangle bounded by tie-lines, whichminerals will be present?
f. What is we plot the bulk composition directly on a tie-line?
g. What is the difference between diagram 24-2 and 24-3? Which one is probablymore realistic?
h. Why must the two stable phases for bulk composition (f) in diagram 24-3 plotdirectly on the edge of the solid solution areas?

i. What will happen to a chemographic diagram as we change metamorphicconditions?
5. ACF diagrama. What do “A”, “C”, and “F” stand for?
b. Why are H2O and SiO2 not plotted on this diagram?
c. What minerals must be present within the rock for the ACF diagram to be valid? Why?
d. For diagram 24-4, write down the formula for each mineral plotted on the diagram.
6. AKF diagrama. What do “A”, “K”, and “F” stand for?
b. Why did Eskola decide to construct a different kind of diagram from the ACFdiagram?
c. For diagram 24-6, write down the formula for each mineral present (most of themyou already have for part (d) of #5)
7. Projectionsa. What is the main assumption when choosing to project from some point on a
diagram onto a simpler diagram?
b. For the ACF and AKF diagram, what were we essentially projecting from? Why?c. What is the major problem in using projection diagrams?

8. Thompson Diagramsa. J.B. Thompson developed the AKFM diagram in the 50's. What is it commonly
called?
b. What do “A”, “K”, “F” and “M” stand for?
c. What kind of rocks is the diagram meant for?
d. Why separate Mg and Fe?
e. What assumptions did Thompson have to make to construct his diagram?
f. What did Thompson choose to project his 3D diagram into a 2D diagram from? Why?
g. Where does biotite plot on a Thompson diagram? Why?
h. Is there a difference between what we project from for low temperature and hightemperature metamorphic rocks? If yes, what?
i. What do we use for the three corners to plot an AFM diagram?
j. What are the minerals plotted on figure 24-19? List their formulas.

1
15 April, 2002 Petrology-Spring 2002, Goeke 1
Metamorphic Faciesand
Mafic Rocks
Chapter 25
15 April, 2002 Petrology-Spring 2002, Goeke 2
Metamorphic Facies• Facies = a rock a chemical equilibrium for a specific
metamorphic pressure and temperature that is independentof the bulk chemical composition of the rock
• Zone = chemical equilibrium for a pressure andtemperature that depends on chemical composition of therock; based on specific isograds (e.g. in pelitic systems thegarnet, staurolite, and cordierite isograds define differentzones)
• Eskola was the first proponent of using facies and basedhis names on metamorphic mafic rocks based onincreasing temperature and/or pressure– Greenschist, amphibolite, hornfels, sanidinite, eclogite– Later added: granulite, epidote-amphibolite,
glaucophane-schist and change hornfels to pyroxenehornfels

2
15 April, 2002 Petrology-Spring 2002, Goeke 3
• Other workers have added a few more phases:– Coombs: zeolite, prehnite-pumpellyite– Fyfe: albite-epidote hornfels, hornblende hornfels– A few others have been suggested/used in the
literature, but aren’t very common—the problem withmetamorphic rocks is that the IUGS is only trying tostandardize them right now, so there are someproblems with nomenclature still to be resolved
• We divide facies into four groups:• High pressure
– Blueschist (glaucophane schist) and eclogite facies– Both develop in the high P/low T subduction
environment, though eclogite can also occur due todeep crust or mantle metamorphism
15 April, 2002 Petrology-Spring 2002, Goeke 4
Fig. 25-2. Temperature-pressure diagram showing thegenerally accepted limits ofthe various facies used in thistext. Boundaries areapproximate and gradational.The “typical” or averagecontinental geotherm is fromBrown and Mussett (1993).Winter (2001) AnIntroduction to Igneous andMetamorphic Petrology.Prentice Hall.

3
15 April, 2002 Petrology-Spring 2002, Goeke 5
• Medium pressure– Greenschist, amphibolite, and granulite facies– The majority of rocks at the surface fall into one of
these three categories, since they follow the “typical”continental geothermal gradient
• Low pressure– Albite-epidote hornfels, hornblende hornfels, and
pyroxene hornfels facies– Develop commonly due to contact metamorphism,
but can also occur in regional terranes with very highgeothermal gradients
– Sanidinite is rare and normally only found as eitherxenoliths in basic magmas or directly adjacent to amagma body in contact aureoles
• Low grades– Zeolite and prehnite-pumpellyite facies
15 April, 2002 Petrology-Spring 2002, Goeke 6
– Commonly referred to as the sub-greenschist facies– At low grades, equilibrium is difficult to attain, so these
facies are not always represented (rocks skips fromunaltered to greenschist facies directly)
– Most common in burial or hydrothermal metamorphism• Facies are defined based on mineral isograds in mafic
rocks, but the boundaries are gradational due to fluidcontent and bulk rock composition
• Facies are useful when trying to compare rocks of differentbulk compositions to one another

4
15 April, 2002 Petrology-Spring 2002, Goeke 7
Pyralspite garnet + omphacitic pyroxeneEclogite
Glaucophane + lawsonite or epidote (+ albite ±chlorite)
Blueschist
Opx + cpx + plagioclase ± garnet ± hornblendeGranulite
Hornblende + plagioclase (oligoclase –andesine) ± garnet
Amphibolite
Chlorite + albite + epidote (or zoisite) + quartz± actinolite
Greenschist
Prehnite + pumpellyite (+ chlorite + albite)Prehnite-pumpellyite
Zeolites: laumontite, airakite, anacimeespecially
Zeolite
Definitive Mineral Assemblage in MaficRocksFacies
15 April, 2002 Petrology-Spring 2002, Goeke 8
Facies Series• Facies series = progressive sequence of facies that
should be encountered on a large-scale traverse throughany metamorphic terrane
• Three main series (“basic types”) were defined byMiyashiro:
• High P/T series– Subduction zones where “normal” geothermal
gradients are depressed by the rapid descent– Goes through: zeolite – prehnite-pumpellyite –
blueschist – eclogite facies• Medium P/T series
– Typical of orogenic belts– Sequence is: zeolite – prehnite-pumpellyite –
greenschist – amphibolite – granulite facies

5
15 April, 2002 Petrology-Spring 2002, Goeke 9
– Granulite may not exist due to H2O-saturated meltingof the crust
• Low P/T series– High-heat flow orogenic belts, rift areas, or contact
metamorphism– Either the same sequence as #2 with the substitution
of cordierite and/or andalusite in the aluminous rocksor: zeolite – albite-epidote hornfels – hornblendehornfels – pyroxene hornfels
15 April, 2002 Petrology-Spring 2002, Goeke 10
Fig. 25-3.Temperature-pressure diagramshowing the threemajor types ofmetamorphic faciesseries proposed byMiyashiro (1973,1994). Winter(2001) AnIntroduction toIgneous andMetamorphicPetrology. PrenticeHall.
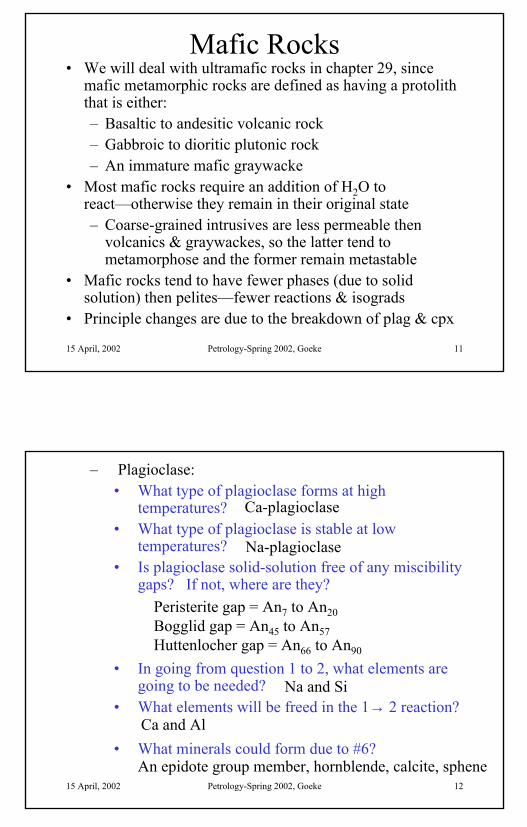
6
15 April, 2002 Petrology-Spring 2002, Goeke 11
Mafic Rocks• We will deal with ultramafic rocks in chapter 29, since
mafic metamorphic rocks are defined as having a protoliththat is either:– Basaltic to andesitic volcanic rock– Gabbroic to dioritic plutonic rock– An immature mafic graywacke
• Most mafic rocks require an addition of H2O toreact—otherwise they remain in their original state– Coarse-grained intrusives are less permeable then
volcanics & graywackes, so the latter tend tometamorphose and the former remain metastable
• Mafic rocks tend to have fewer phases (due to solidsolution) then pelites—fewer reactions & isograds
• Principle changes are due to the breakdown of plag & cpx
15 April, 2002 Petrology-Spring 2002, Goeke 12
– Plagioclase:• What type of plagioclase forms at high
temperatures?• What type of plagioclase is stable at low
temperatures?• Is plagioclase solid-solution free of any miscibility
gaps? If not, where are they?
• In going from question 1 to 2, what elements aregoing to be needed?
• What elements will be freed in the 1→ 2 reaction?
• What minerals could form due to #6?
Ca-plagioclase
Na-plagioclase
Peristerite gap = An7 to An20Bogglid gap = An45 to An57Huttenlocher gap = An66 to An90
Na and Si
Ca and Al
An epidote group member, hornblende, calcite, sphene

7
15 April, 2002 Petrology-Spring 2002, Goeke 13
– Clinopyroxene• What’s the formula of cpx?
• What minerals could form due to its breakdown?
• What will determine which mineral will form?
Ca(Mg, Fe)(SiO3)2
Chlorite, epidote, actinolite, hornblende,metamorphic pyroxene
What the pressure and temperature ofmetamorphism is
15 April, 2002 Petrology-Spring 2002, Goeke 14
Low Grade Mafics
Fig. 25-4. ACF diagrams illustrating representative mineral assemblages for metabasites in the (a) zeolite and (b)prehnite-pumpellyite facies. Actinolite is stable only in the upper prehnite-pumpellyite facies. The composition range ofcommon mafic rocks is shaded. Winter (2001) An Introduction to Igneous and Metamorphic Petrology. Prentice Hall.

8
15 April, 2002 Petrology-Spring 2002, Goeke 15
Fig. 25-5. Typicalmineral changes thattake place in metabasicrocks during progressivemetamorphism in thezeolite, prehnite-pumpellyite, andincipient greenschistfacies. Winter (2001)An Introduction toIgneous andMetamorphic Petrology.Prentice Hall.
15 April, 2002 Petrology-Spring 2002, Goeke 16
Medium P/T Series• Greenschist facies ACF
diagram• What are the new phases
on this diagram vs. thelow grade triangle?
• What are the newminerals’ formulas?
• What are the reactionsthat occurred?
Fig. 25-6. ACF diagram illustratingrepresentative mineral assemblages formetabasites in the greenschist facies.The composition range of commonmafic rocks is shaded. Winter (2001)An Introduction to Igneous andMetamorphic Petrology. Prentice Hall.

9
15 April, 2002 Petrology-Spring 2002, Goeke 17
• ACF diagram foramphibolite facies
• What are the new phases onthis diagram vs. the lowgrade triangle?
• What are the new minerals’formulas?
• What are the reactions thatoccurred?
• What differentiates betweena rock that contains garnetvs. a rock with cpx?
• Where would cordierite ploton this diagram? Whatkind of composition isrequired for it +anthophyllite to form?
Fig. 25-7. ACF diagram illustrating representative mineralassemblages for metabasites in the amphibolite facies. Thecomposition range of common mafic rocks is shaded.Winter (2001) An Introduction to Igneous and MetamorphicPetrology. Prentice Hall.
15 April, 2002 Petrology-Spring 2002, Goeke 18
• The amphibolite →granulite transition occursat about 650-800 C– Quartzo-feldspathic
rocks that containwater will start to melt~600-650 C at low tomedium pressures
– Partially melting of thefelsic rock mayproduce a residue thatis H2O-deficient thatwill make it togranulite facies
– Mafic rocks requirehigh T’s even withwater to melt
Fig. 25-8. ACF diagram illustrating representative mineralassemblages for metabasites in the granulite facies. Thecomposition range of common mafic rocks is shaded. Winter(2001) An Introduction to Igneous and Metamorphic Petrology.Prentice Hall.

10
15 April, 2002 Petrology-Spring 2002, Goeke 19
Fig. 25-9. Typical mineral changes that take place in metabasic rocks during progressive metamorphism in the mediumP/T facies series. The approximate location of the pelitic zones of Barrovian metamorphism are included for comparison.Winter (2001) An Introduction to Igneous and Metamorphic Petrology. Prentice Hall.
15 April, 2002 Petrology-Spring 2002, Goeke 20
Low P/T Series
• For mafic rocks, this series doesn’t look very different thenthe medium P/T rocks—its really just for pelitic rockswe’ll deal with this series

11
15 April, 2002 Petrology-Spring 2002, Goeke 21
High P/T Series• We’re going to focus on
this series for basalticcompositions, since thereactions tend to be moredrastic for mafics
• Where do we find thecorrect thermal gradientfor these rocks?
• Blueschists arecharacterized by thepresence of whichamphibole?
• Albite will transform towhat minerals on thisdiagram?
Fig. 25-10. ACF diagram illustrating representative mineralassemblages for metabasites in the blueschist facies. The compositionrange of common mafic rocks is shaded. Winter (2001) An Introductionto Igneous and Metamorphic Petrology. Prentice Hall.
15 April, 2002 Petrology-Spring 2002, Goeke 22
• Which pyroxene forms inthe eclogite facies? Whatcolor is it?
• Do the garnets containsCa?
• What reactionscharacterizes the transitionfrom blueschist to eclogitefacies?
• What reactions wouldcharacterize the granuliteto eclogite transition?
Fig. 25-11. ACF diagram illustrating representative mineralassemblages for metabasites in the eclogite facies. Thecomposition range of common mafic rocks is shaded. Winter(2001) An Introduction to Igneous and Metamorphic Petrology.Prentice Hall.

12
15 April, 2002 Petrology-Spring 2002, Goeke 23
P-T-t paths• Pressure-temperature-time paths are used in metamorphic
petrology to determine the cycle the rock must have gonethrough to become metamorphosed (e.g. burial, uplift,erosion)
• What are some ways we might see evidence of a path andnot just one moment in the metamorphic history?
• Clockwise P-T-t path = metamorphic history that has agreater increase in pressure then temperature, followed bya decrease in pressure, then a decrease in temperature;typically due to crustal thickening followed by uplift
• Counterclockwise P-T-t path = equal increase in pressureand temperature followed by isobaric cooling; suggested tooccur due to an intrusion of mafic magma into the low- andmid-crust
15 April, 2002 Petrology-Spring 2002, Goeke 24
Fig. 25-12. Schematic pressure-temperature-time paths based on heat-flow models. The Al2SiO5 phase diagram and twohypothetical dehydration curves are included. Facies boundaries, and facies series from Figs. 25-2 and 25-3. Winter(2001) An Introduction to Igneous and Metamorphic Petrology. Prentice Hall.

1
4/18/02 Petrology-Spring 2002, Goeke 1
Metamorphic Reactions
Chapter 26
4/18/02 Petrology-Spring 2002, Goeke 2
• In examining the sequence of what occurred within a rockand the maximum temperatures/pressures the rock reachedwe depend heavily on first and last appearances of certainminerals
• Mineral-out isograd = line that connects geographic pointsof a minerals last occurrence
• Multiple reactions can occur to produce the same mineral,so its often more important to know what the reaction isthat produced a given mineral than where the isograd is

2
4/18/02 Petrology-Spring 2002, Goeke 3
Order of the Day
• Phase transformations• Exsolution• Solid-solid net-transfer• Devolatilization• Continuous• Ion exchange• Oxidation/reduction• Dissolved species
4/18/02 Petrology-Spring 2002, Goeke 4
Phase Transformations• Polymorphs are probably the easiest reactions to
understand, since we only have to deal with acrystallographic and not a chemical change
• What are a few common polymorphs?• Whether you have one or a different polymorph depends
on what? What might mix this simple answer up a bit?• If you had two polymorphs is the same rock, could you
automatically assume that both were in equilibrium? Whyor why not?
• We can put about twice as much Fe3+ in andalusite as inkyanite/sillimanite, which would influence the system howaccording to Le Chatelier’s Principle?

3
4/18/02 Petrology-Spring 2002, Goeke 5
Exsolution
• How does this occur?• What are two common examples?
4/18/02 Petrology-Spring 2002, Goeke 6
Solid-Solid Net-Transfer
• Involve solids of differing compositions and result inchanges of modal amounts of the various phases
• Volatiles consumed during reaction, so there’s no freefluid phase in the system
• These reactions are discontinuous in systems withrestricted solid solution—what does discontinuous mean?
• Solid-solution promotes continuous reactions—what’s acontinuous reaction?

4
4/18/02 Petrology-Spring 2002, Goeke 7
Devolatilization• The most common type of metamorphic reactions are those
that either consume or release volatiles• Dehydration = involving H2O• Decarbonization = involving CO2
• Can also deal with:– O2
– H2
– CH4
– F– Cl– SO2
4/18/02 Petrology-Spring 2002, Goeke 8
• The partial pressure of thefluid phase will alsocontribute to the progress ofa devolatilization reaction;according to Le Chatelier,which should occur at alower temperature—a 70%saturated or 30% saturatedreaction?
• Which side should thehydrous assemblage be onalmost always?
• What are two ways to makePH2O < Plith?
Figure 26-2. P-T phase diagram for the reaction Ms + Qtz = Kfs +Al2SiO5 + H2O showing the shift in equilibrium conditions as pH2Ovaries (assuming ideal H2O-CO2 mixing). Calculated using the programTWQ by Berman (1988, 1990, 1991). Winter (2001) An Introduction toIgneous and Metamorphic Petrology. Prentice Hall.

5
4/18/02 Petrology-Spring 2002, Goeke 9
• The implication of theseprocesses is that isogradsdependent on some form ofdevolatilization will be verysensitive to the partialpressure & content of thefluid phase present
• We can use a T-Xfluid phasediagram to examine therelationship between molesof fluid, temperature, andwhen a specific reaction willoccur– The x-axis will either be
the mole fraction of CO2or H2O most of the time
Figure 26-4. T-XH2O phase diagram for the reaction Ms + Qtz = Kfs +Sil + H2O at 0.5 GPa assuming ideal H2O-CO2 mixing, calculated usingthe program TWQ by Berman (1988, 1990, 1991). Winter (2001) AnIntroduction to Igneous and Metamorphic Petrology. Prentice Hall.
Pressure must be specified
4/18/02 Petrology-Spring 2002, Goeke 10
What would be the 5 types of devolatilization reactions asyou increase temperature?Can you give examples of each?
• Dehydration– Ms + Qtz = Kfs + Als + water
• Decarbonization– Cal + Qtz = Wo + carbon dioxide
• Combined dehydration-decarbonization– 5Mgs + Tlc = 4Fo + 5carbon dioxide + water
• Prograde reactions that consume H2O and liberate CO2
– 3Mgs + 4Qtz + water = Tlc + carbon dioxide• Prograde reactions that consume CO2 and liberate H2O
– 2Zo + carbon dioxide = 3An + Cal + water

6
4/18/02 Petrology-Spring 2002, Goeke 11
• The fluid phase produced/consumed in these reactions maybe mobile and will depend on:– Pressure– Temperature– Progress of reaction– Permeability of rock (remember, a permeable rock must
also be porous)• High permeability will can allow an external fluid
source to control the composition—external sourcecontrols mineralogy
• Low permeability will make the fluid more likely toremain in equilibrium with the minerals aroundit—mineralogy controls fluid content
4/18/02 Petrology-Spring 2002, Goeke 12
ContinuousReactions
• The composition of one ormore solid solution phases(normally most if not all ofthem) varies over time
• The proportions of theminerals will change inrelationship to thecomposition until one of thereactants is completelyconsumed and the reactionsstops
• E.g. during the reaction, theMg/Fe ratio will increasefor chlorite and garnet
Fig. 26-9. Schematic isobaric T-XMg diagram representing the simplifiedmetamorphic reaction Chl + Qtz → Grt + H2O. From Winter (2001) AnIntroduction to Igneous and Metamorphic Petrology. Prentice Hall. Winter(2001) An Introduction to Igneous and Metamorphic Petrology. PrenticeHall.

7
4/18/02 Petrology-Spring 2002, Goeke 13
Ion Exchange• Ion exchange deals with the reciprocal exchange of ions
between 2+ phases—can consider either anions or cations,but the latter has been studied more
• The Fe-Mg exchange occurs between quite a few pairs ofminerals and is often the basis for thermobarometryequations (will get to how that works in chp 27), since thereactions are commonly temperature (or pressure)dependent– E.g. En + Hd = Fs + Di– E.g. Annite + Pyrope = Phlogopite + Almandine
• The modal proportions of the phases will remain constantas the reaction progresses (unlike continuous reactions)
• Blockage or closure temperature = point on a coolingcurve at which ion exchange is prevented by kinetics
4/18/02 Petrology-Spring 2002, Goeke 14
Oxidation/Reduction
• Redox = oxidation/reduction reaction that deals with ionsor ionic compounds that occur in more that one state– E.g. Fe2+ and Fe3+, Cu+ and Cu2+, Mn2+ and Mn4+, O0
and O2-, S0 and S2-, C0 and C4-, and so on• Oxygen buffer = system where only one variable is free
and is either P,T or pO2—usually T is variable and partial
pressure of oxygen (expressed as oxygen fugacity) and Pare fixed– Which types of oxygen buffer depends on the redox
reaction that is occurring

8
4/18/02 Petrology-Spring 2002, Goeke 15
Dissolved Species Involvement
• Fluids can transport various ions through a rock andinteract with the mineral assemblage
• Fluid-rock interaction = approach to equilibrium betweena fluid and mineral assemblage; will not occur if the flowrate is too fast and/or an external source is controlling thefluid composition
• Hydrolysis = change in mineral composition due to theaddition of water– E.g. 2Kfs + 2H+
(aq) + H2O = Kln + SiO2 (aq) + 2K+(aq)
• We’ll deal more with this topic in chapter 30
4/18/02 Petrology-Spring 2002, Goeke 16
Chemographics
• What are the different reactions that could occur accordingto this binary diagram?
• What would determine which reactions did occur?
MgO SiO2
Per Fo En Qtz
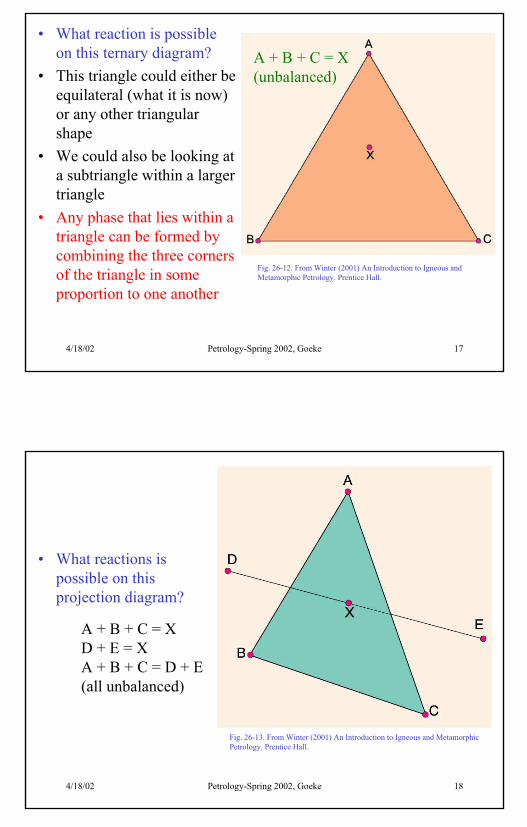
9
4/18/02 Petrology-Spring 2002, Goeke 17
• What reaction is possibleon this ternary diagram?
• This triangle could either beequilateral (what it is now)or any other triangularshape
• We could also be looking ata subtriangle within a largertriangle
• Any phase that lies within atriangle can be formed bycombining the three cornersof the triangle in someproportion to one another
Fig. 26-12. From Winter (2001) An Introduction to Igneous andMetamorphic Petrology. Prentice Hall.
A + B + C = X(unbalanced)
4/18/02 Petrology-Spring 2002, Goeke 18
• What reactions ispossible on thisprojection diagram?
Fig. 26-13. From Winter (2001) An Introduction to Igneous and MetamorphicPetrology. Prentice Hall.
A + B + C = XD + E = XA + B + C = D + E(all unbalanced)

10
4/18/02 Petrology-Spring 2002, Goeke 19
• What are the possiblestable mineralassemblages on thisdiagram?
Fig. 26-14a. From Winter (2001) An Introduction to Igneous and MetamorphicPetrology. Prentice Hall.
X-A-DA-D-BC-A-BD-B-Y
4/18/02 Petrology-Spring 2002, Goeke 20
• What’s thereactionoccurring inthissequence ofdiagrams?
At the isograd
Above theisograd
Below theisograd
Fig. 26-14. From Winter (2001) An Introduction to Igneous and Metamorphic Petrology. Prentice Hall.
A + B = D + C
• What are the stable assemblages abovethe isograd? X-A-D
A-D-CC-B-DB-D-Y
This is called atie-line flip

11
4/18/02 Petrology-Spring 2002, Goeke 21
Multicomponent Phase Diagrams• Many metamorphic reactions involve not one, but multiple
reactions occurring concurrently• We use petrogenetic grids to illustrate the various
reactions that could occur in a given systemFig. 26-19.Simplifiedpetrogeneticgrid formetamorphosedmafic rocksshowing thelocation ofseveraldeterminedunivariantreactions in theCaO-MgO-Al2O3-SiO2-H2O-(Na2O)system(“C(N)MASH”)Winter (2001).
4/18/02 Petrology-Spring 2002, Goeke 22
• Lab today:• Do problem #1 (all parts!) on p. 534 in Winter• A Schreinermaker’s Law problem?

1
4/18/02 Petrology-Spring 2002, Goeke 1
Metamorphic Thermodynamics
Chapter 27
4/18/02 Petrology-Spring 2002, Goeke 2
Review
• Gibbs free energy = measure of the energy content in achemical system; specified at a pressure and temperaturefor a given phase– G = H – TS– ∆G = ∑(nproductsGproducts – nreactantsGreactants)– d∆G = ∆VdP – ∆SdT– The minimum Gibbs energy phase is the stable one
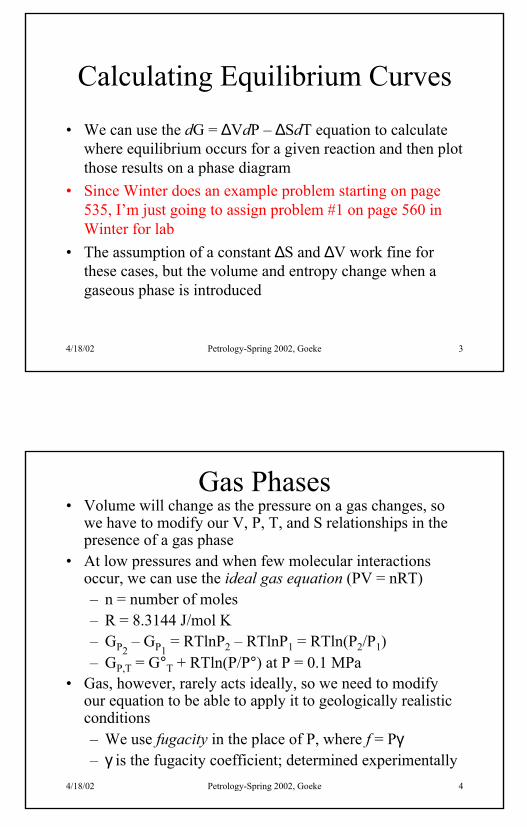
2
4/18/02 Petrology-Spring 2002, Goeke 3
Calculating Equilibrium Curves
• We can use the dG = ∆VdP – ∆SdT equation to calculatewhere equilibrium occurs for a given reaction and then plotthose results on a phase diagram
• Since Winter does an example problem starting on page535, I’m just going to assign problem #1 on page 560 inWinter for lab
• The assumption of a constant ∆S and ∆V work fine forthese cases, but the volume and entropy change when agaseous phase is introduced
4/18/02 Petrology-Spring 2002, Goeke 4
Gas Phases• Volume will change as the pressure on a gas changes, so
we have to modify our V, P, T, and S relationships in thepresence of a gas phase
• At low pressures and when few molecular interactionsoccur, we can use the ideal gas equation (PV = nRT)– n = number of moles– R = 8.3144 J/mol K– GP2
– GP1 = RTlnP2 – RTlnP1 = RTln(P2/P1)
– GP,T = G°T + RTln(P/P°) at P = 0.1 MPa• Gas, however, rarely acts ideally, so we need to modify
our equation to be able to apply it to geologically realisticconditions– We use fugacity in the place of P, where f = Pγ– γ is the fugacity coefficient; determined experimentally

3
4/18/02 Petrology-Spring 2002, Goeke 5
– The fugacity coefficient depends on proportions of thevarious gases, T and P
– ∆GP,T = ∆G°T + ∆VS(P – P°) + RTln(f / P°)– ∆VS is for solids only in the above equation– The diagram below is typical for for most
devolitalization curves
Figure 27-2. Pressure-temperature phasediagram for the reaction muscovite +quartz = Al2SiO5 + K-feldspar + H2O,calculated using SUPCRT (Helgeson etal., 1978). Winter (2001) AnIntroduction to Igneous andMetamorphic Petrology. Prentice Hall.
4/18/02 Petrology-Spring 2002, Goeke 6
Compositional Variation
i
i
• Most phases are not compositionally homogeneous, so we alsoneed to amend our Gibbs free energy calculations to include thisnew factor
• How much a given component influences the free energy isgoing to depend on the number of moles:– dG = VdP – SdT + ∑ µidni
– µ = chemical potential = manner in which the free energy ofa phase changes with the number of moles of a givencomponent in the phase, if all other components were heldconstant
• The other definition of the G is: G = ∑ µidni
• At equilibrium the chemical potential of a given componentmust be the same in every coexisting phase that contains it

4
4/18/02 Petrology-Spring 2002, Goeke 7
• Activity (aAi)= difference between the chemical potential of a
given component at a given P and T, and the chemicalpotential at the reference state– “A” = whatever phase we’re discussing– µA
i = µ°i + RTln(aAi)
– For an ideal gas: aAi = Pi / P°i
– For a real gas: aAi = fi / P°i
– The activity of a pure phase in the reference state(whatever P and T we choose) is 1
• Doing a bit of substitution and rearranging, we end up with:– ∆G° = – RTlnK– K = equilibrium constant = the activities of the reactants
multiplied by each other divided by the activities of theproducts multiplied together
• E.g. 4Opx + Plag = Grt + Cpx + Qtz would give youK = (aopx)4(aplag)/(agrt)(acpx)(aqtz)
4/18/02 Petrology-Spring 2002, Goeke 8
• Unfortunately, figuring out what the activity of a given componentin a phase is not easy and we have to come up with models todescribe what the activity of a phase will be as we vary thecomponents– Solution models are used to determine how the activity will vary,
but they range from simple equations that don’t really fit thedata (ideal solution) to complicated combinations of matrixesand differential equations (real solution)
– We need to use mole fractions (XAi) to calculate solution models
• XAi = ni / (ni + nj + nk + ...)
• aAi = (XA
i)y for ideal situations• y = number of crystallographic sites on which the mixing
takes place• aA
i = (γiXAi)y for real situations
• γi = activity coefficient = modify X to conform to real models

5
4/18/02 Petrology-Spring 2002, Goeke 9
Figure 27-3. Activity-composition relationships for the enstatite-ferrosilite mixture in orthopyroxene at 600oC and 800oC. Circles are datafrom Saxena and Ghose (1971); curves are model for sites as simple mixtures (from Saxena, 1973) Thermodynamics of Rock-FormingCrystalline Solutions. Winter (2001) An Introduction to Igneous and Metamorphic Petrology. Prentice Hall.
Ideal (grey straight lines) vs. simple mixture model (“real” model);dots are what have been observed experimentally
4/18/02 Petrology-Spring 2002, Goeke 10
Geothermobarometry• Using the info on the last few slides, petrologists have
calculated methods to estimate the temperature and/orpressure at which a rock equilibrated
• Geothermometry = temperature calculation• Geobarometry = pressure calculation• Different thermometers and barometers exist depending on
the mineral assemblage of the rock—Winter lists a numberof them in table 27-4– Each thermometer/barometer has a certain
pressure/temperature range over which it can be applied– Most thermometers & barometers also limit what
compositions of minerals you can use– If you want to look at how to develop a
thermometer/barometer either read section 27.4.1 inWinter or chapter 15 in the Spear

6
4/18/02 Petrology-Spring 2002, Goeke 11
Applying Geothermobarometry• There are some requirements for applying a thermometer
and/or a barometer:– EQUILIBRIUM—now, no metamorphic rock at the
surface of the Earth is at equilibrium, so we have toassume local equilibrium (at a certain scale the rock isin equilibrium)
– A fit between your rocks and the rocks that were usedto calibrate the thermometer/barometer
– Good chemical analyses (usually with a microprobe)– Estimation of the Fe3+/Fe2+ ratio (can’t be done with a
microprobe)
4/18/02 Petrology-Spring 2002, Goeke 12
Zoned Crystals
• Zonation of a crystal is a guarantee that that grain is not atequilibrium, but examining the zonation can also give usan idea of the conditions that phase formed under
• Garnets in pelitic rocks have been studied in gory detail bymetamorphic petrologists to the extent that just examiningthe zoning pattern can indicate whether the garnet grew ina prograde or retrograde situation
• You can also use inclusions within a given zoned crystal tocalculate a P and/or T if you think they are still in localequilibrium (e.g. biotite inclusions within garnet)