Embed Size (px)
Citation preview

PFC Energy North American Onshore ServiceSeptember 2012

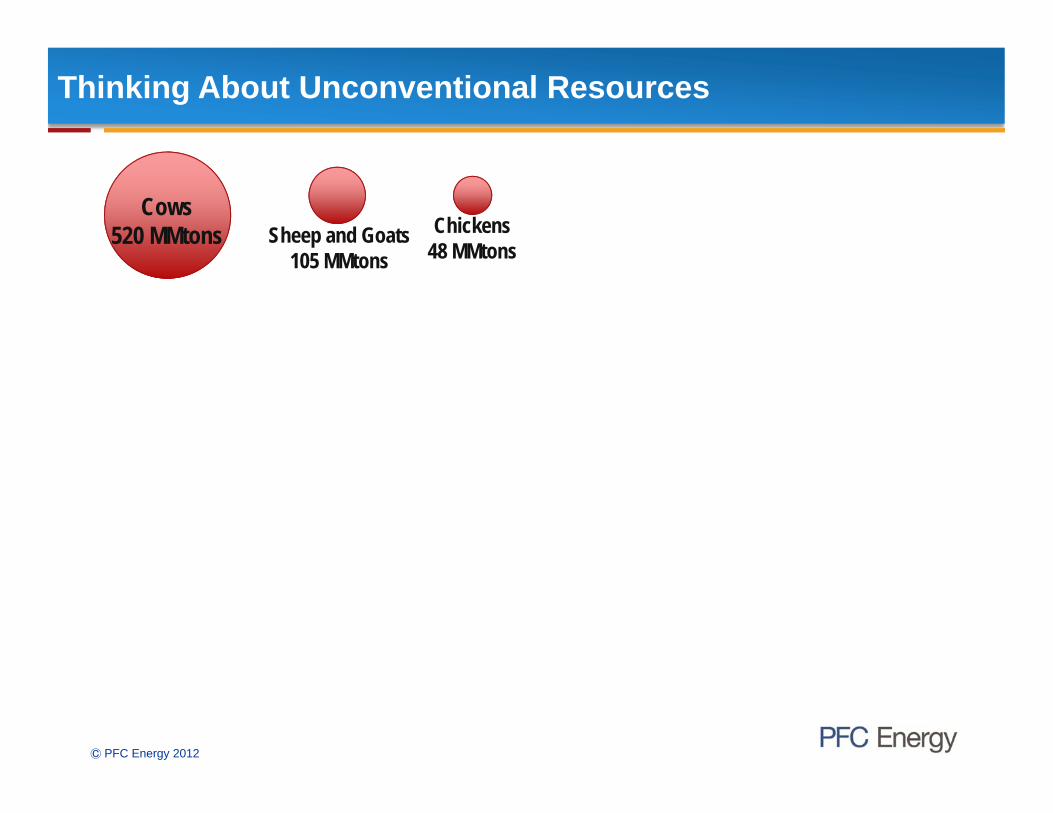
Thinking About Unconventional Resources
Chickens48 MMtons
Sheep and Goats10 MM
Cows520 MMtons 48 MMtons105 MMtons
Presentation Name | © PFC Energy | Page 3Ⓒ PFC Energy 2012

Question 1: What About Ants? (Yes, Ants)
What is the total estimated biomass of all the ants in the world, in kilotons?
a) 25
b) 75b) 75
c) 600
d) 5,000
Presentation Name | © PFC Energy | Page 4

Thinking About Unconventional Resources
Chickens48 MMtons
Sheep and Goats10 MM
Cows520 MMtons 48 MMtons105 MMtons
AntsAnts5,000 MMtons
Hydrocarbons are naturally distributed such that difficult and expensive
Presentation Name | © PFC Energy | Page 5
Hydrocarbons are naturally distributed such that difficult and expensive resources are much larger than easy and cheap oil and gas.
Ⓒ PFC Energy 2012
Graphic courtesy of Steve Sonnenberg, Colorado School of Mines

Technology Has Evolved to Overcome Energy Inefficiency
The Problem with Ants (and Unconventional Resources):If you pick them up and peat them one at a time, energy output is
The Solution
output is greater than input.
Horizontal Drilling
Presentation Name | © PFC Energy | Page 6Ⓒ PFC Energy 2012

We Are Getting After It…
Unconventionals (shale, tight, and CBM) have come to dominate new source production
80%
90%
100%Contribution to Total Peak Output from New Wells
50%
60%
70%
80%
20%
30%
40%
50%
0%
10%
20%
an-0
1
ul-0
1
an-0
2
ul-0
2
an-0
3
ul-0
3
an-0
4
ul-0
4
an-0
5
ul-0
5
an-0
6
ul-0
6
an-0
7
ul-0
7
an-0
8
ul-0
8
an-0
9
ul-0
9
an-1
0
ul-1
0
an-1
1
ul-1
1
Presentation Name | © PFC Energy | Page 7
Ja J Ja J Ja J Ja J J a J J a J J a J J a J J a J J a J J a J
Unconventional Conventional
Source: PFC Energy, DrillingInfo, RigData, state databases

But the Transition to Liquids is Slow
Wells with >50% Liquids account for half of all wells drilled But most of the gain has come from Dry Gas activity falling
Lower 48: New Wells by Fluid Type
100%4,000
G
Lower 48: New Wells by Fluid Type
Oil (90%+Liq) Gassy Oil (50%-90% Liq) Wet Gas (50%-90% Gas)Dry Gas (90%+ Gas) Gassy Oil and Oil as %
60%
80%
100%
2 500
3,000
3,500
4,000
Gassy O
il ands Pe
r mon
th
40%
60%
1 000
1,500
2,000
2,500 d Oil as %
oNew
Wel
ls
0%
20%
0
500
1,000 f Total
Presentation Name | © PFC Energy | Page 8
Month of Well's First ProductionSource: PFC Energy, DrillingInfo, RigData, state databasesNote: Excludes non-Marcellus wells in Appalachia reported only annually

Question 2: So Is It Working?
Which countries has the combination of Bakken + Eagleford surpassed in terms of total wellhead liquids production?
a) Ecuador (OPEC member)a) Ecuador (OPEC member)
b) UK
c) Indonesia
d) All of the above
e) None of the abovee) None of the above
Presentation Name | © PFC Energy | Page 9
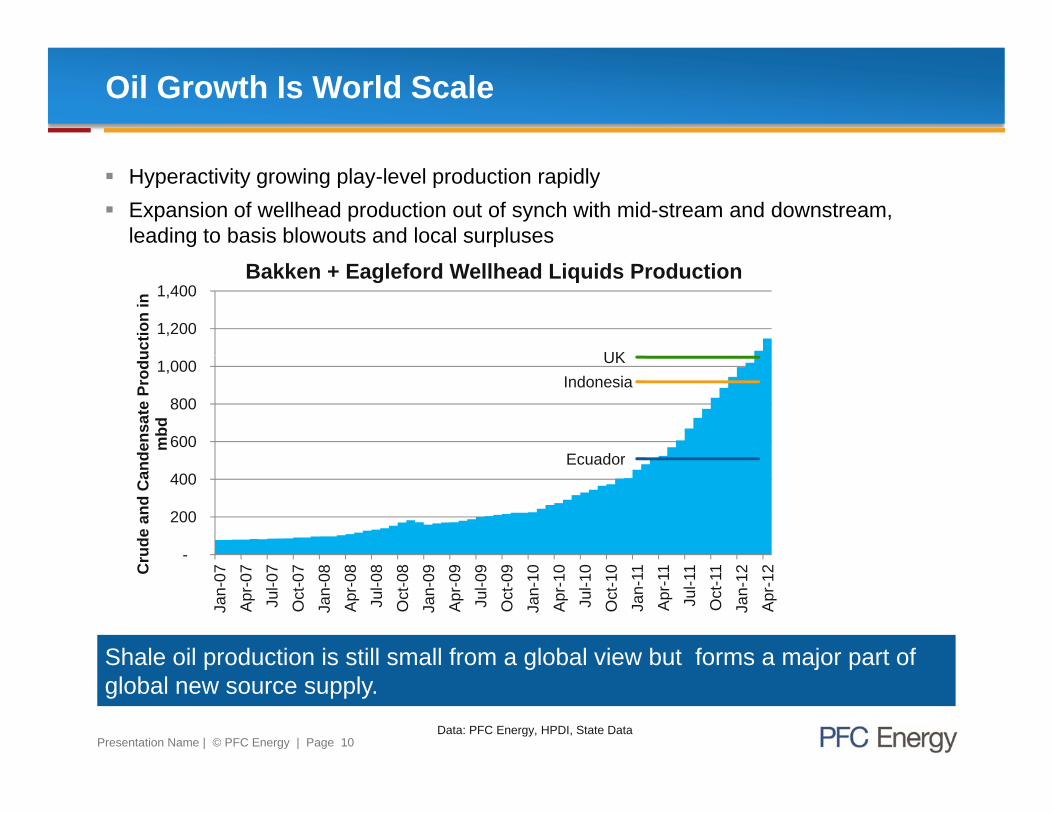
Oil Growth Is World Scale
Hyperactivity growing play-level production rapidly Expansion of wellhead production out of synch with mid-stream and downstream,
leading to basis blowouts and local surpluses
UK
1,200
1,400
uctio
n in
Bakken + Eagleford Wellhead Liquids Production
UK
Ecuador
Indonesia
600
800
1,000
dens
ate
Prod
um
bd
Ecuador
-
200
400
rude
and
Can
d
Shale oil production is still small from a global view but forms a major part of
Jan-
07A
pr-0
7Ju
l-07
Oct
-07
Jan-
08A
pr-0
8Ju
l-08
Oct
-08
Jan-
09A
pr-0
9Ju
l-09
Oct
-09
Jan-
10A
pr-1
0Ju
l-10
Oct
-10
Jan-
11A
pr-1
1Ju
l-11
Oct
-11
Jan-
12A
pr-1
2Cr
Presentation Name | © PFC Energy | Page 10
Shale oil production is still small from a global view but forms a major part of global new source supply.
Data: PFC Energy, HPDI, State Data
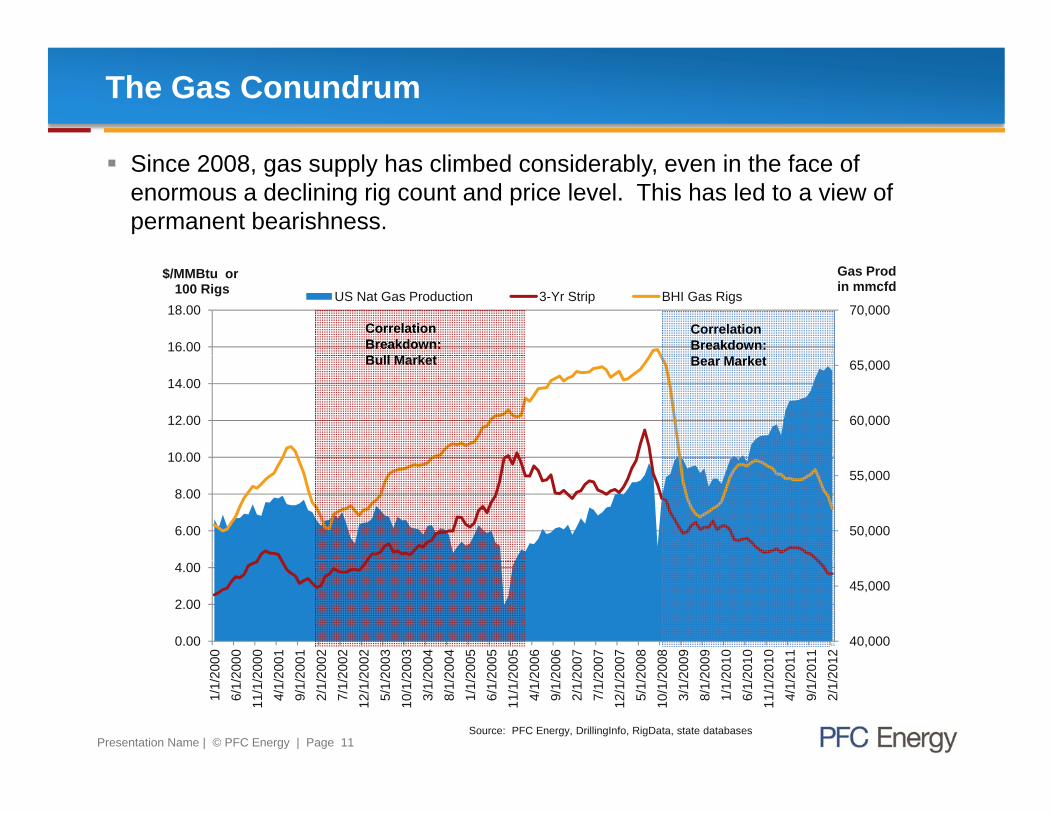
The Gas Conundrum
Since 2008, gas supply has climbed considerably, even in the face of enormous a declining rig count and price level. This has led to a view of permanent bearishness.
70,000
16.00
18.00
Gas Prod in mmcfd
$/MMBtu or100 Rigs US Nat Gas Production 3-Yr Strip BHI Gas Rigs
Correlation Breakdown: B ll M k t
Correlation Breakdown:
60,000
65,000
10 00
12.00
14.00
Bull Market Bear Market
50,000
55,000
6.00
8.00
10.00
40,000
45,000
0.00
2.00
4.00
00 00 00 01 01 02 02 02 03 03 04 04 05 05 05 06 06 07 07 07 08 08 09 09 10 10 10 11 11 12
Presentation Name | © PFC Energy | Page 11
1/1/
200
6/1/
200
11/1
/200
4/1/
200
9/1/
200
2/1/
200
7/1/
200
12/1
/200
5/1/
200
10/1
/200
3/1/
200
8/1/
200
1/1/
200
6/1/
200
11/1
/200
4/1/
200
9/1/
200
2/1/
200
7/1/
200
12/1
/200
5/1/
200
10/1
/200
3/1/
200
8/1/
200
1/1/
206/
1/20
11/1
/20
4/1/
209/
1/20
2/1/
20
Source: PFC Energy, DrillingInfo, RigData, state databases
Question 3: The Source of the Gas “Problem”
Gas production in the US has been incredibly resilient even though prices and rig activity have continued to fall dramatically. This is due to many reasons but the single most important one in 2011 was:many reasons, but the single most important one in 2011 was:
a) Impressive high-grading of drilling locations by industry
b) The wave of associated gas being produced in the stampede to liquids.
) W ll d ti it i d t b tt ll t h l d l tic) Well productivity gains due to better well technology and completion techniques
Presentation Name | © PFC Energy | Page 12

We’re Skewed!
Plays are not created equally. Thus, the NA supply system is composed of a relatively small number of highly productive wells and long tail of very small contributors– Stop looking at the gas rig count simplistically
What matters is the trend within the categories– What matters is the trend within the categories
4,500
5,000
WellCount NewWellsbyAbsoluteCategory
180%
200%
NewWellsbyCategoryIndexedtoPeak
2 500
3,000
3,500
4,000
100%
120%
140%
160%Peak of Drilling
1,000
1,500
2,000
2,500
40%
60%
80%
100%
‐
500
2001Q1
2001Q3
2002Q1
2002Q3
2003Q1
2003Q3
2004Q1
2004Q3
2005Q1
2005Q3
2006Q1
2006Q3
2007Q1
2007Q3
2008Q1
2008Q3
2009Q1
2009Q3
2010Q1
2010Q3
2011Q1
0%
20%
2001Q1
2001Q3
2002Q1
2002Q3
2003Q1
2003Q3
2004Q1
2004Q3
2005Q1
2005Q3
2006Q1
2006Q3
2007Q1
2007Q3
2008Q1
2008Q3
2009Q1
2009Q3
2010Q1
2010Q3
2011Q1
Presentation Name | © PFC Energy | Page 13
Data Source: PFC Energy; State oil and gas databases; Drillinginfo Excludes GOM Deepwater, CBM & non-Marcellus Appalachian wells from states with annual/quarterly reporting

Focus on What MattersAnnual “Base” and “Wedge”
While focus is on emerging plays, well-established plays are the backbone of new source gas production
Relatively few plays are operators can
Growth
Maintenance Annual Wedgeol
ume
gCombine to Form Production
Relatively few plays are operators can move the needle for the US Base
Wedge
Time
Vo
Jan Dec
Haynesville Shale28%
Uinta Tight Gas2%
GOM Deepwater1%
All Oth Pl
2011 Gas Wedge By Play
CHESAPEAKE13%
EXXONMOBIL6%
2011 Gas Wedge by Operator
Pi Ti ht G
GOM Shelf3%
Cotton Valley2%
Misc TX & LA Gulf Coast
2%
All Other Plays16%
ENCANA6%
EXCOSAMSON
OTHER30%
Marcellus Shale13%
Eagleford ShaleFayetteville Shale
6%
Pinedale/Jonah4%
Anadarko Wash Plays4%
Piceance Tight Gas3%
5%
ANADARKO5%
BHP4%RANGE
RESOURCESWILLIAMS
EL PASO1%
APACHE1%
CHEVRON1%
SAMSON1%
Presentation Name | © PFC Energy | Page 15
Barnett Shale10%
g6%
SOUTHWESTERN5%
DEVON4%
SHELL3%
EOG3%CABOT
2%
QEP2%
ULTRA Petroleum
2%TALISMAN
2%
RESOURCES2%
WILLIAMS2%
Source: PFC Energy-Guggenheim, DrillingInfo, RigData, state databases

What Will Happen As the Plays Evolve?
It is a mistake to treat plays as static; they pass through distinct life stages Each stage requires a different set of skills and resources to succeed
O
ily TuscaloosaBakkenNiobrara
WolfcampMississippian
Monterey
id T
ype>
Granite Wash
Eagleford OilUticaBone Spring
Smackover
<
Flui Granite Wash
BarnettEagleford Pinedale/
Prove It(Infancy)
Optimize It(Adolescence)
Standardize It(Adulthood)
Re-invent It(2nd Career)
Gas
sy Barnett
FayettevilleHaynesville
EaglefordGas Pinedale/
JonahMarcellus
Presentation Name | © PFC Energy | Page 16
Life Stages of Unconventional Plays (Infancy) (Adolescence) (Adulthood) (2nd Career)

What Matters for the Future of a Particular Play?
Each play is unique and unfolds in three dimensions:1. Spatially – How does the play develop geographically and where are the
sweet spots?sweet spots?
2. Distributionally – How good is good?
3. Temporally – How does the play change over time?
L t’ t k “li ” l k t th l t h h f th t Let’s take a “live” look at three plays to show each of these aspects of the play.
Presentation Name | © PFC Energy | Page 17

Quality Map of the Bakken
Presentation Name | © PFC Energy | Page 18
Well productivity is not randomly distributed, but rather clusters in sweet spots.

Question 4: How Far Ahead?
Looking at relative peak per lateral foot productivity of all wells in the Bakken, the most productive quintile is how much better than the bottom quintile?bottom quintile?
a) 10% better
b) 100% better (twice as productive)
) 1 000% (10 d ti )c) 1,000% (10x as productive)
d) 10,000% (100x as productive)
Presentation Name | © PFC Energy | Page 19

Plays Exhibit Widely Variable Results
The inherent variability of rock productivity is far larger than differences in cost
Presentation Name | © PFC Energy | Page 20
The inherent variability of rock productivity is far larger than differences in cost structures or operational practices.
Question 5: How Fast Are We Learning?
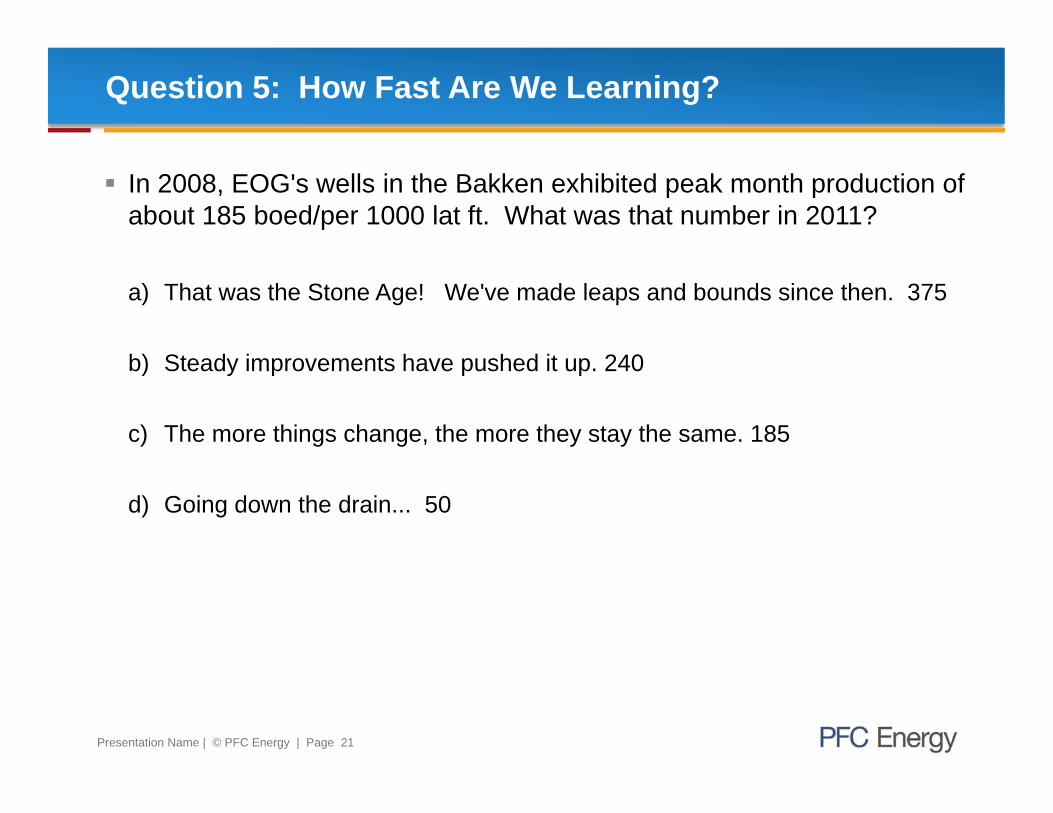
In 2008, EOG's wells in the Bakken exhibited peak month production of about 185 boed/per 1000 lat ft. What was that number in 2011?
a) That was the Stone Age! We've made leaps and bounds since then. 375
b) St d i t h h d it 240b) Steady improvements have pushed it up. 240
c) The more things change, the more they stay the same. 185
d) Going down the drain... 50
Presentation Name | © PFC Energy | Page 21
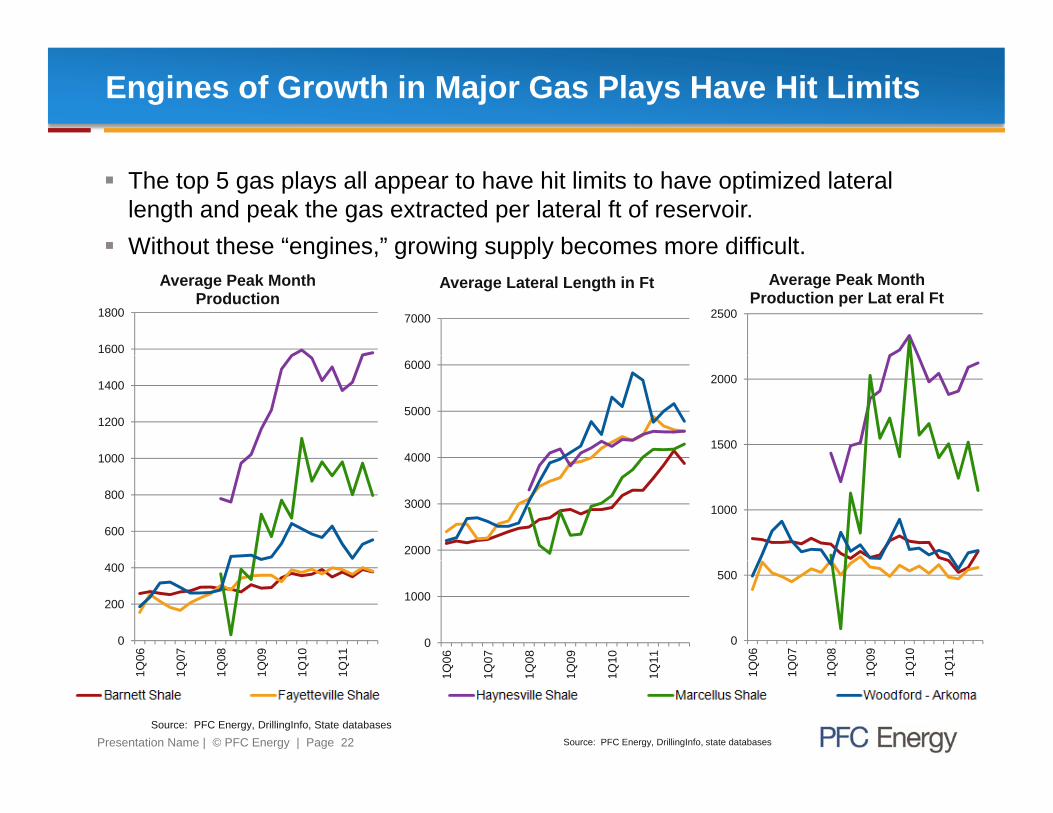
Engines of Growth in Major Gas Plays Have Hit Limits
The top 5 gas plays all appear to have hit limits to have optimized lateral length and peak the gas extracted per lateral ft of reservoir.
Without these “engines,” growing supply becomes more difficult.Without these engines, growing supply becomes more difficult.
1600
1800
Average Peak Month Production
7000
Average Lateral Length in Ft
2500
Average Peak Month Production per Lat eral Ft
1000
1200
1400
4000
5000
6000
1500
2000
600
800
1000
2000
3000
4000
1000
0
200
400
Q06
Q07
Q08
Q09
Q10
Q11
0
1000
06 07 08 09 10 110
500
Q06
Q07
Q08
Q09
Q10
Q11
Presentation Name | © PFC Energy | Page 22
1Q 1Q 1Q 1Q 1Q 1Q 1Q 1Q 1Q 1Q 1Q 1Q 1 Q 1Q 1Q 1Q 1Q 1Q
Source: PFC Energy, DrillingInfo, State databasesSource: PFC Energy, DrillingInfo, state databases

Eating the Power Bars and Leaving the Popcorn?
EOG Peak Per Lat Ft in the Bakken
Companies rightly seek to exploit the sweet spots first but this leads over time
Presentation Name | © PFC Energy | Page 23
Companies rightly seek to exploit the sweet spots first, but this leads over time to quality degradation in the play unless technology leaps forward.

Question 6: Life in the Basement
No one should be drilling in the Haynesville today. The play is uneconomic.
a) True. Those guys are setting money on fire.
b) F l Thi i th t d ti l i th tb) False. This is the most productive play in the country.
c) Kinda…sorta…it depends.
Presentation Name | © PFC Energy | Page 24

Play Works…for Some
Haynesville Signal-to-Drill is a better indicator than spot prices of the returns seen by an E&P company.
1st Quintile wells modestly profitable, but most locations play are far from being economic. Prices would need to rise to induce significant new drilling.
Presentation Name | © PFC Energy | Page 25Source: NYMEX, PFC Energy, DrillingInfo, State databases

Key Takeaways
1. Unconventional oil and gas are down the resource pyramid -- much larger than conventional resources, but difficult and expensive
2 Oil and gas are booming and the results are world scale2. Oil and gas are booming, and the results are world-scale3. The North American supply system exhibits enormous skew both
between and within plays4. Plays pass through a number of life stages, and the main
contributors to new source volumes are mature5. Within in an unconventional play, there is enormous, inherent
variability, separating winners from losers: the chess board is set6. Future production gains will have to struggle against
– The petering out of growth accelerants which characterized early stagesg g y g– Sweet spot exhaustion/quality degradation, which may well outpace
technology gains7. We will be drilling these plays for decades, but activity levels and
Presentation Name | © PFC Energy | Page 26
g p y ybreakeven prices will need to rise from here
PFC Energy Locations and Contact Information
ASIA
PFC Energy, Kuala LumpurLevel 27, UBN Tower #21
EUROPE
PFC Energy, France19 rue du Général Foy
NORTH AMERICA
PFC Energy, Washington1300 Connecticut Avenue, NW ,
10 Jalan P. Ramlee50250 Kuala Lumpur, MalaysiaTel +60 3 2172 3400Fax +60 3 2072 3599
PFC E Chi
y75008 Paris, France Tel +33 1 4770 2900Fax +33 1 4770 5905
,Suite 800Washington, DC 20036, USATel +1 202 872 1199 Fax +1 202 872 1219
PFC E H t PFC Energy, China89 Jianguo RoadChina Central Place # 4-1602 Chaoyang District, Beijing 100025, ChinaTel +86 10 6530 7010Fax +86 10 6530 5093
PFC Energy, Houston2727 Allen Parkway, Suite 1300Houston, Texas 77019, USA Tel +1 713 622 4447 Fax +1 713 622 4448
PFC Energy, Singapore9 Temasek Boulevard#09-01 Suntec Tower TwoSingapore 038989Tel +65 6407 1440Fax +65 6407 1501
www pfcenergy com | info@pfcenergy com
Presentation Name | © PFC Energy | Page 27
www.pfcenergy.com | [email protected]