Embed Size (px)
Citation preview

California Energy Commission
PG&E Planning Area Forecast
Energy Commission Staff
June 26, 2009
IEPR Committee Workshop
CALIFORNIA ENERGY DEMAND 2011-2022 PRELIMINARY STAFF FORECAST
August 30, 2011 — 10:00 am
PG&E Planning Area Electricity and Peak Forecast
Demand Analysis Office Electricity Supply Analysis Division
California Energy Commission
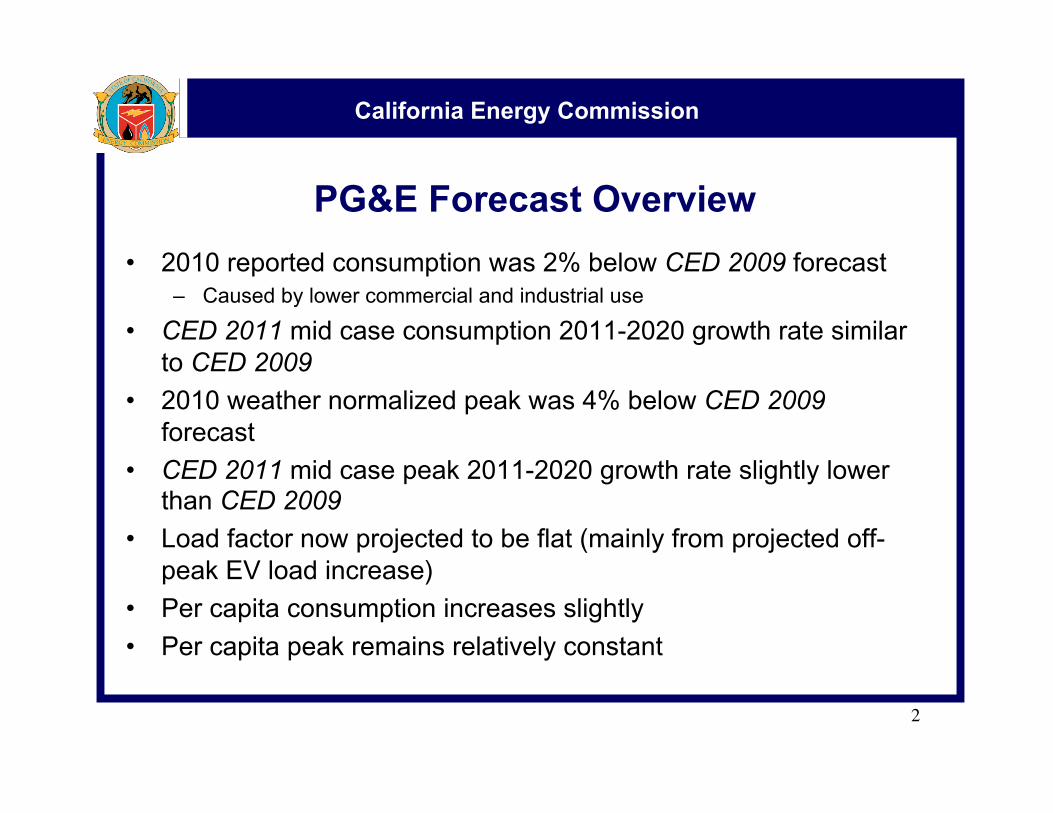
PG&E Forecast Overview
2
• 2010 reported consumption was 2% below CED 2009 forecast – Caused by lower commercial and industrial use
• CED 2011 mid case consumption 2011-2020 growth rate similar to CED 2009
• 2010 weather normalized peak was 4% below CED 2009 forecast
• CED 2011 mid case peak 2011-2020 growth rate slightly lower than CED 2009
• Load factor now projected to be flat (mainly from projected off-peak EV load increase)
• Per capita consumption increases slightly
• Per capita peak remains relatively constant
California Energy Commission
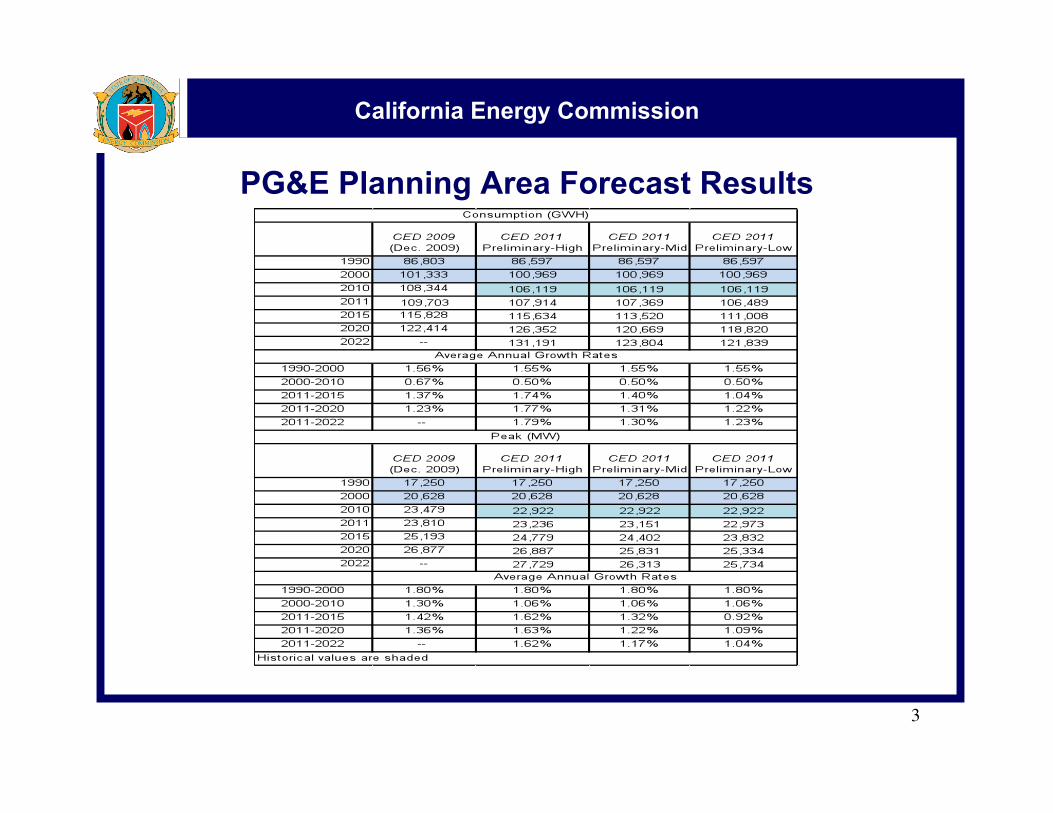
PG&E Planning Area Forecast Results
3
California Energy Commission
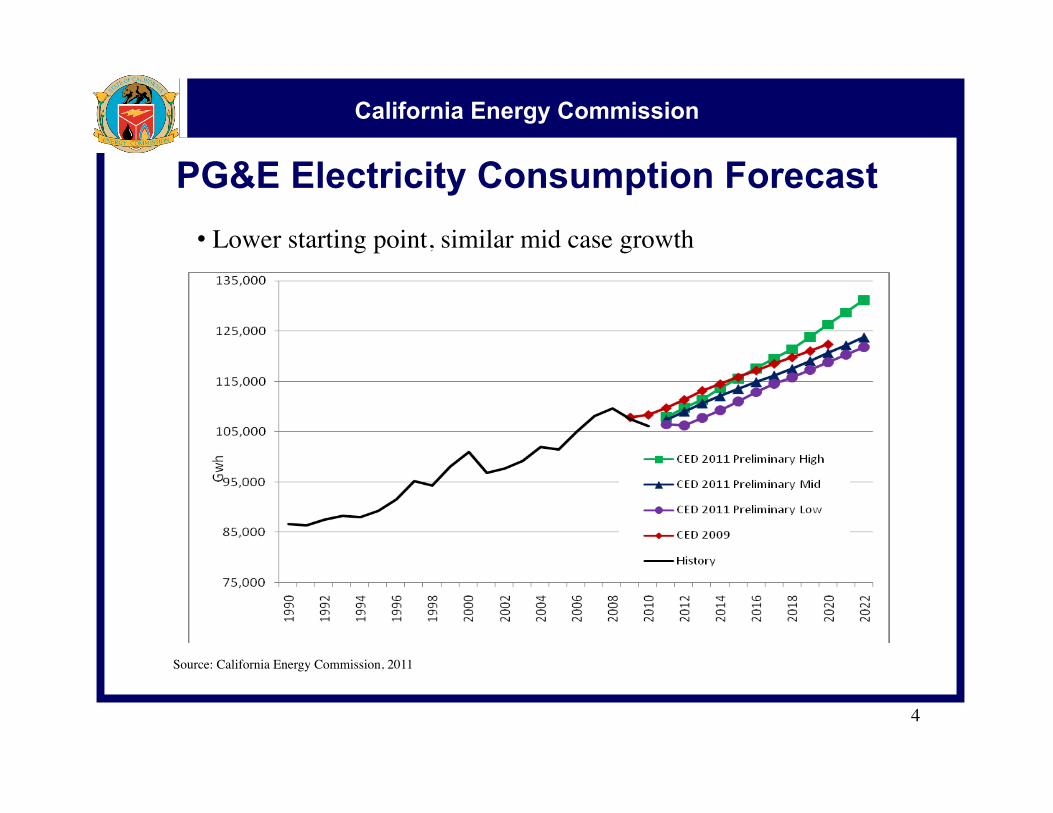
PG&E Electricity Consumption Forecast
4
• Lower starting point, similar mid case growth
Source: California Energy Commission, 2011
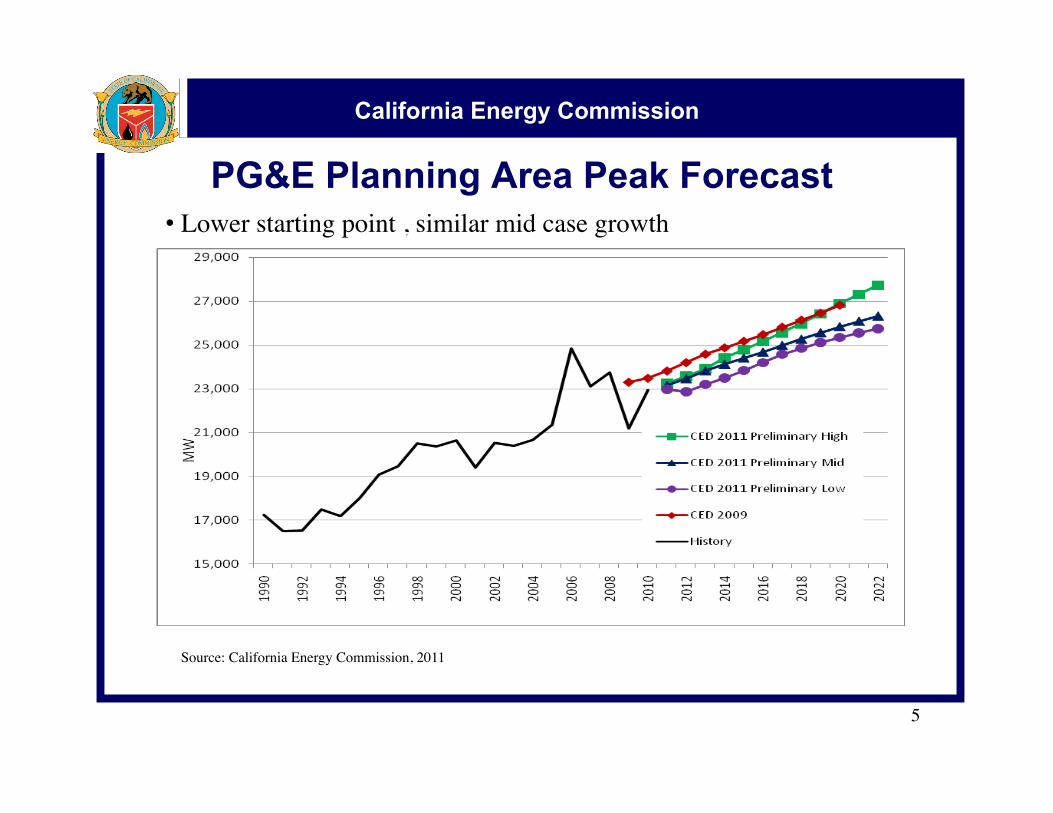
California Energy Commission
PG&E Planning Area Peak Forecast
5
• Lower starting point , similar mid case growth
Source: California Energy Commission, 2011
California Energy Commission
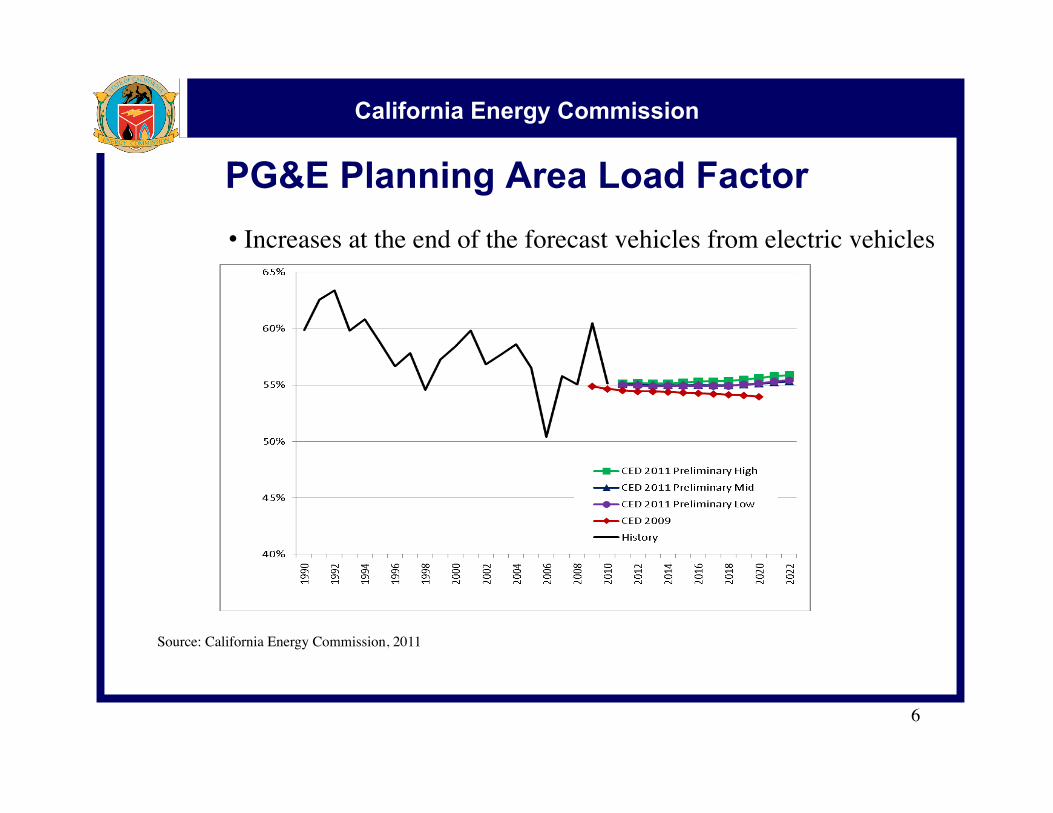
PG&E Planning Area Load Factor
6
• Increases at the end of the forecast vehicles from electric vehicles
Source: California Energy Commission, 2011
California Energy Commission
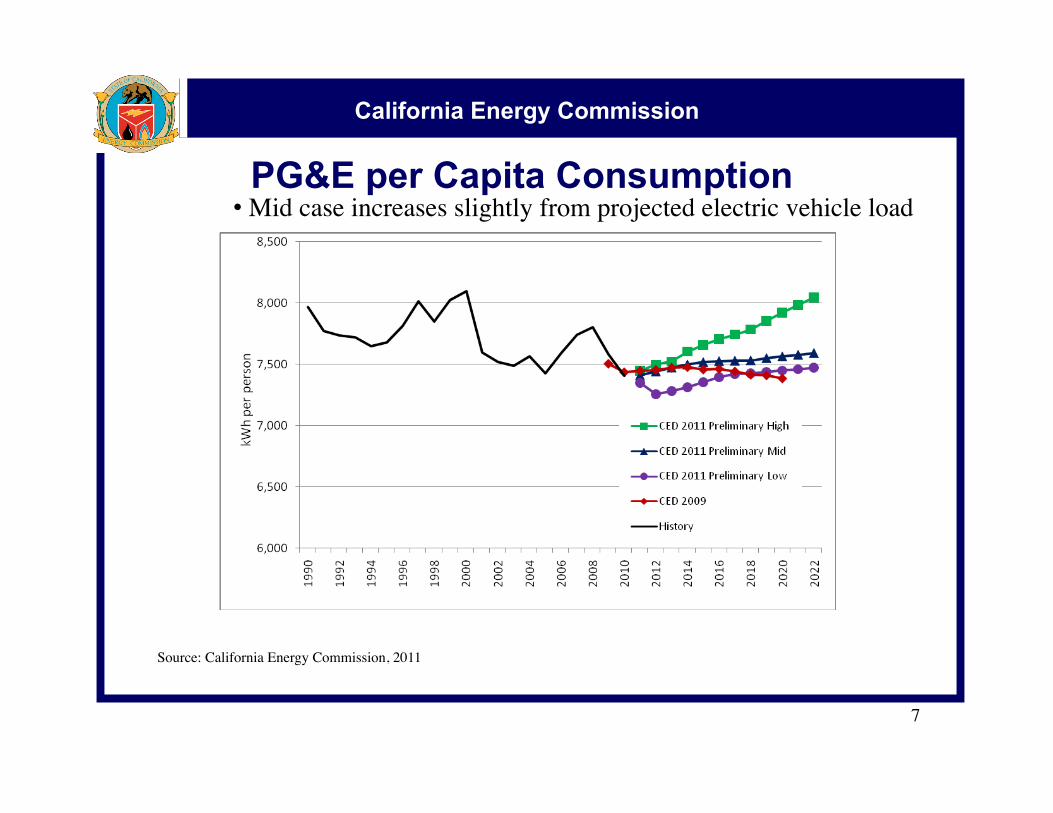
PG&E per Capita Consumption
7
• Mid case increases slightly from projected electric vehicle load
Source: California Energy Commission, 2011
California Energy Commission
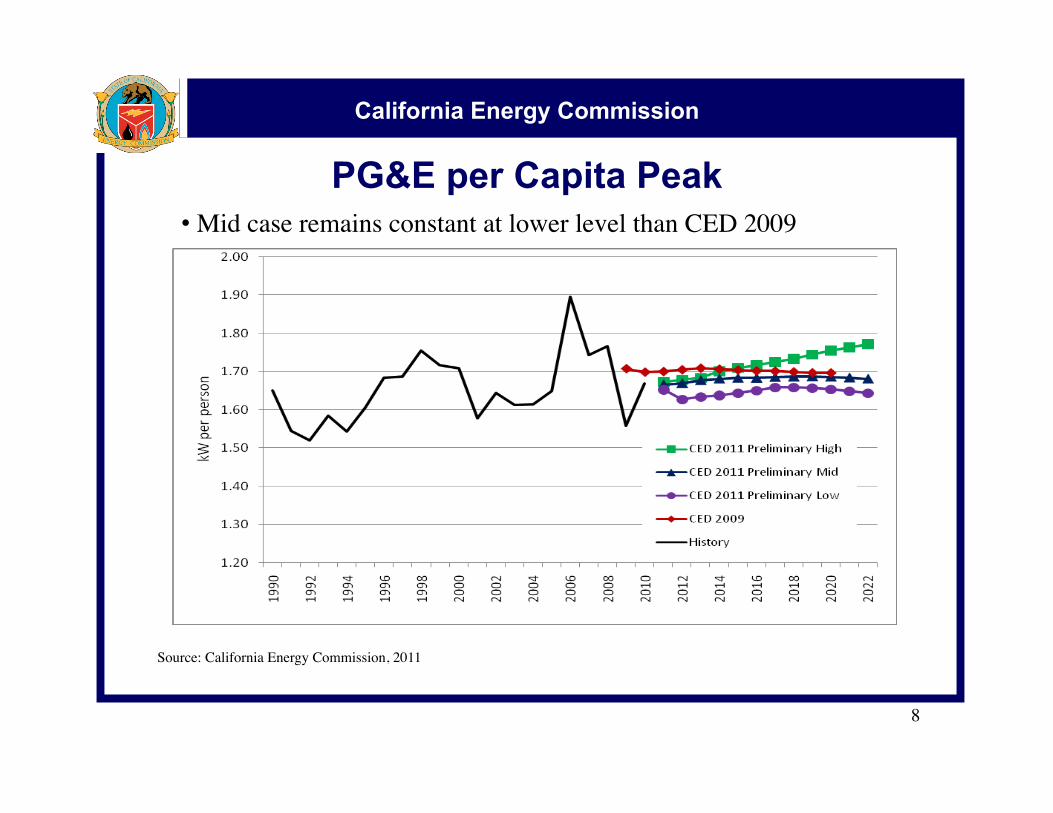
PG&E per Capita Peak
8
• Mid case remains constant at lower level than CED 2009
Source: California Energy Commission, 2011
California Energy Commission
PG&E Residential Forecast • Slightly lower growth than CED 2009
• Fewer households in mid and low cases than CED 2009 – Combination of lower population and revised persons per household
forecasts
• Household income (persons per household * per capita income) grows at a faster rate than CED 2009
• Use per household increases in the long term from impact of EV’s and increased income effects
9
California Energy Commission
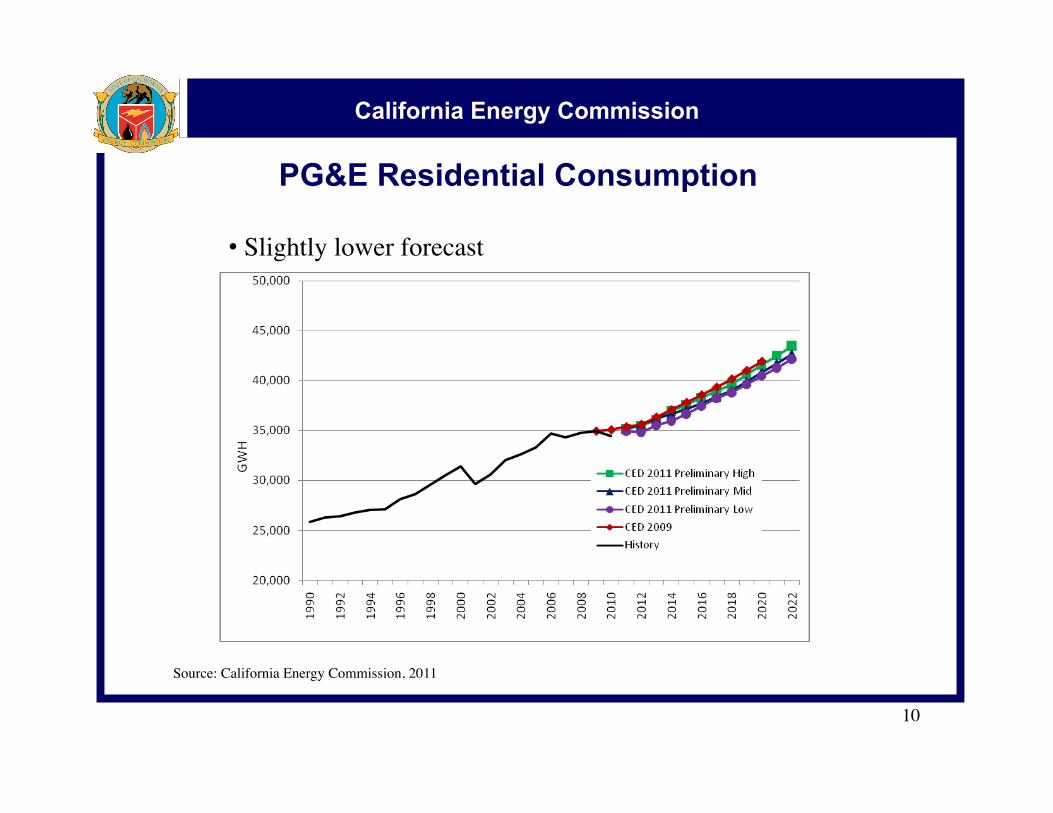
PG&E Residential Consumption
10
• Slightly lower forecast
Source: California Energy Commission, 2011
California Energy Commission
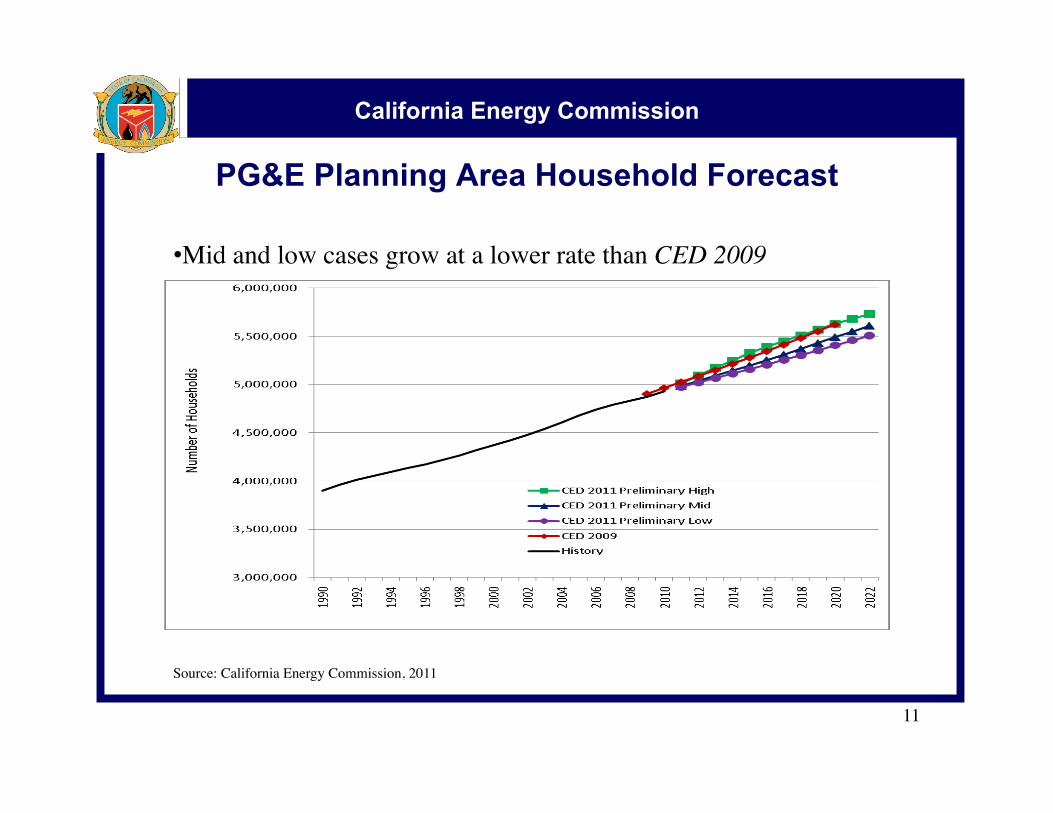
PG&E Planning Area Household Forecast
11
• Mid and low cases grow at a lower rate than CED 2009
Source: California Energy Commission, 2011
California Energy Commission
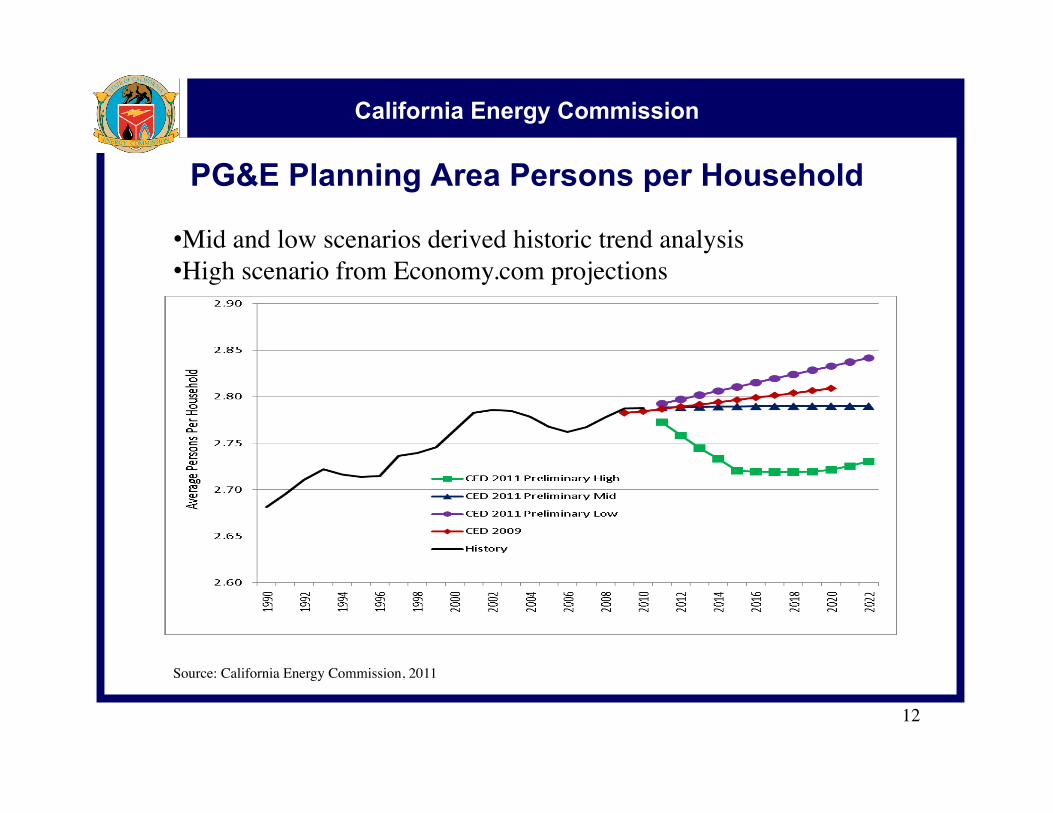
PG&E Planning Area Persons per Household
12
• Mid and low scenarios derived historic trend analysis • High scenario from Economy.com projections
Source: California Energy Commission, 2011
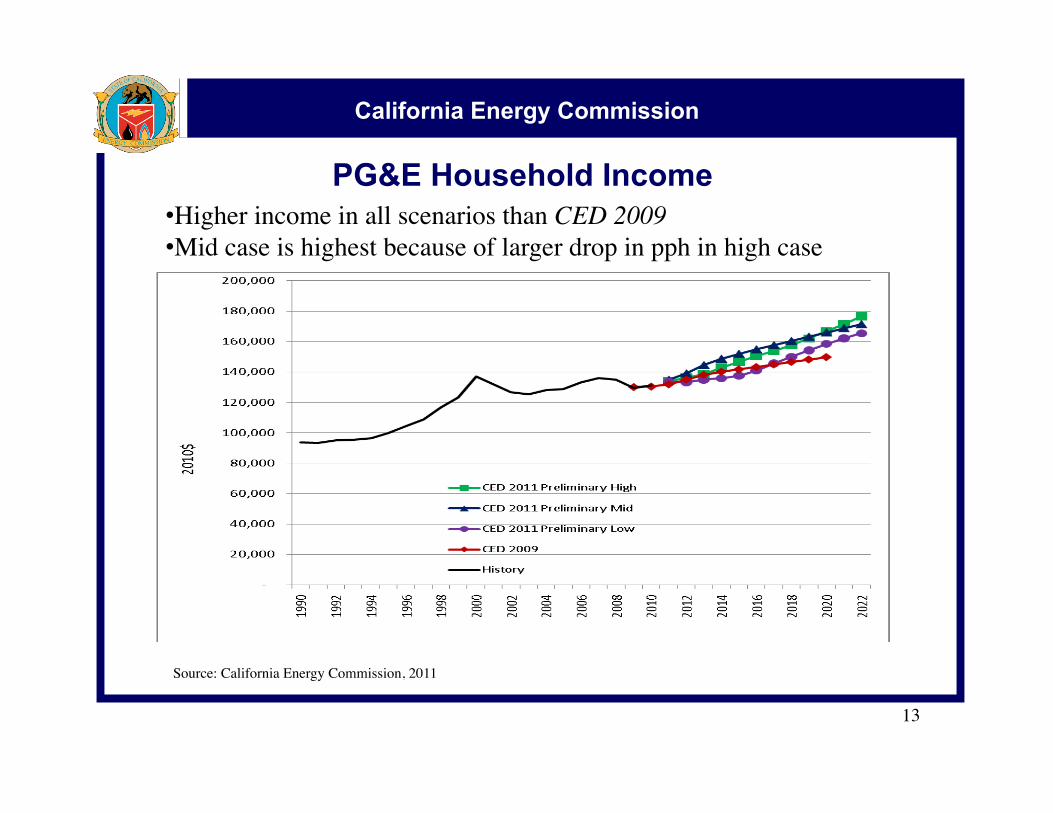
California Energy Commission
PG&E Household Income
13
• Higher income in all scenarios than CED 2009 • Mid case is highest because of larger drop in pph in high case
Source: California Energy Commission, 2011
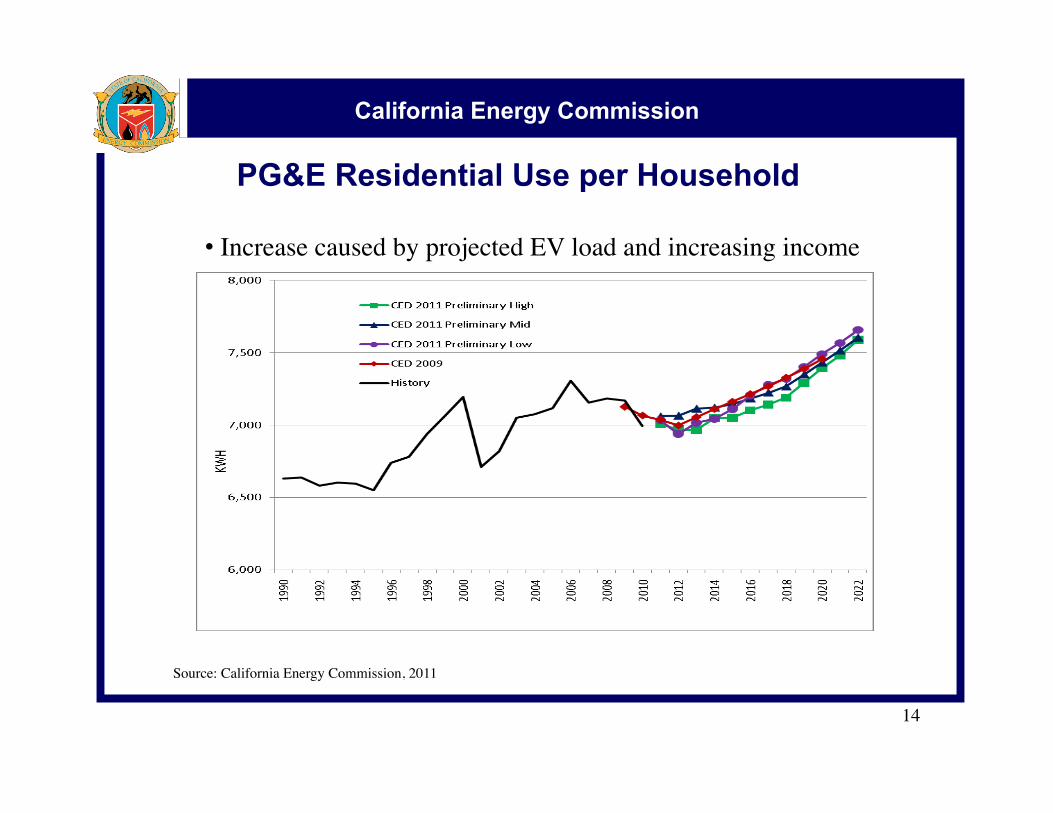
California Energy Commission
PG&E Residential Use per Household
14
• Increase caused by projected EV load and increasing income
Source: California Energy Commission, 2011
California Energy Commission
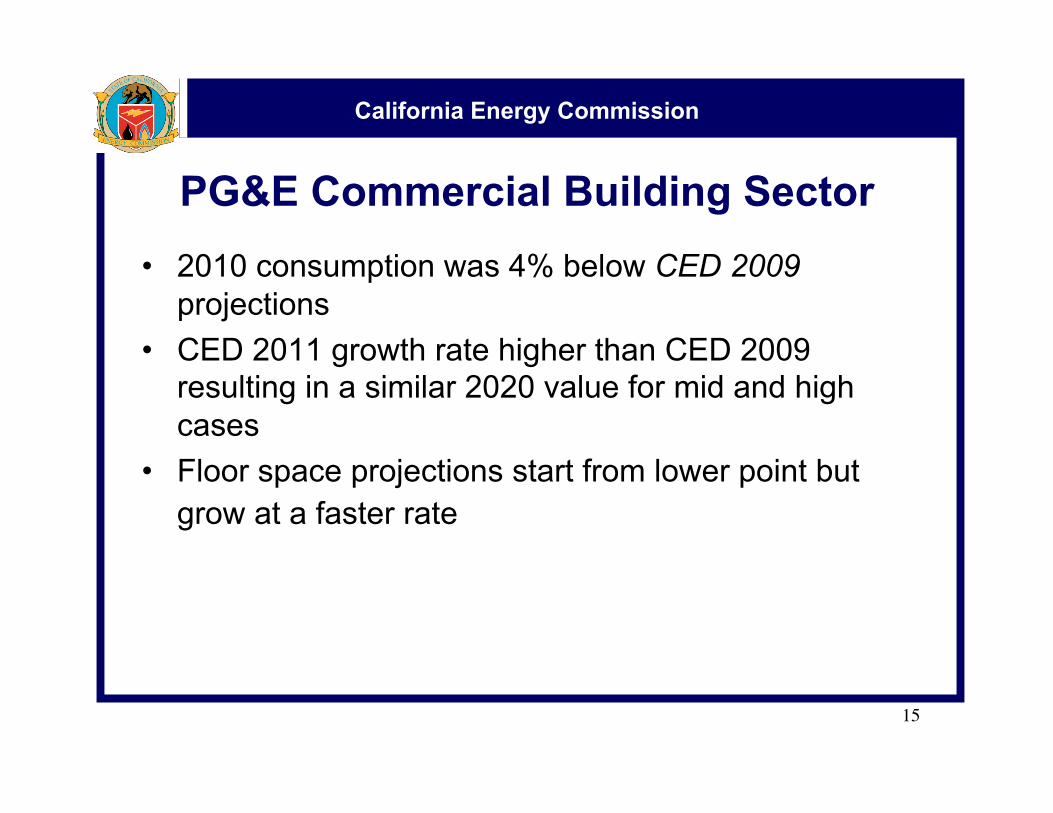
PG&E Commercial Building Sector
• 2010 consumption was 4% below CED 2009 projections
• CED 2011 growth rate higher than CED 2009 resulting in a similar 2020 value for mid and high cases
• Floor space projections start from lower point but grow at a faster rate
15
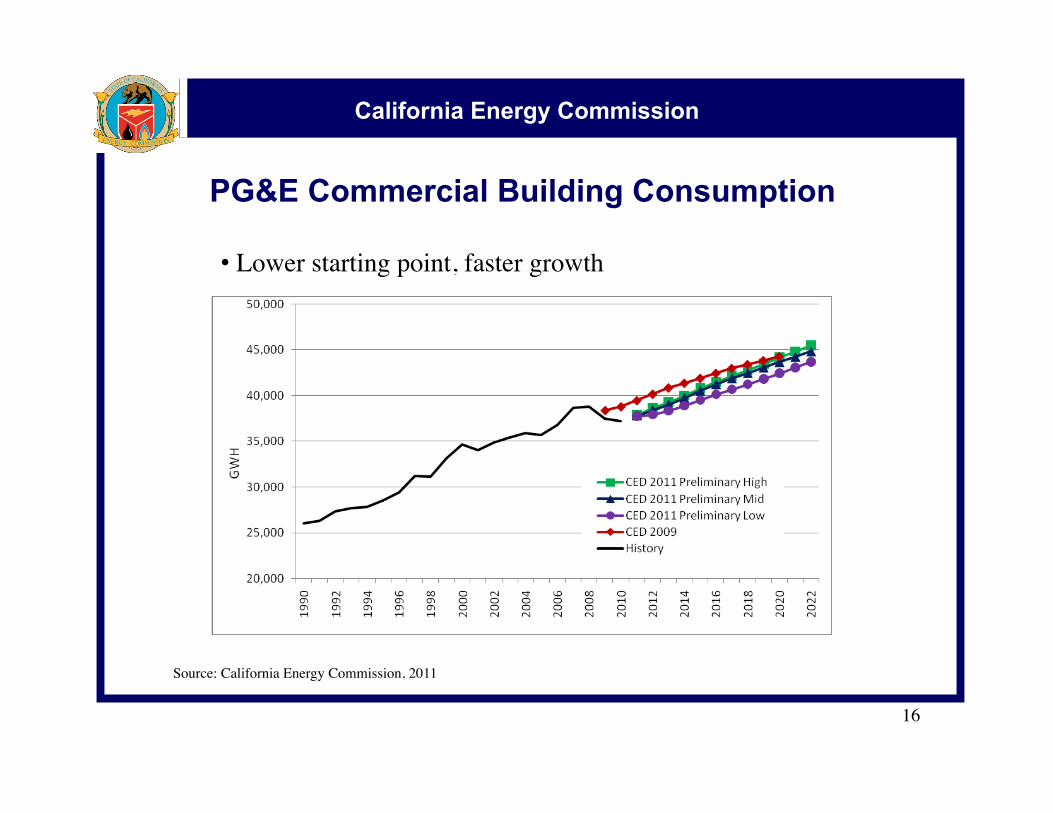
California Energy Commission
PG&E Commercial Building Consumption
16
• Lower starting point, faster growth
Source: California Energy Commission, 2011
California Energy Commission
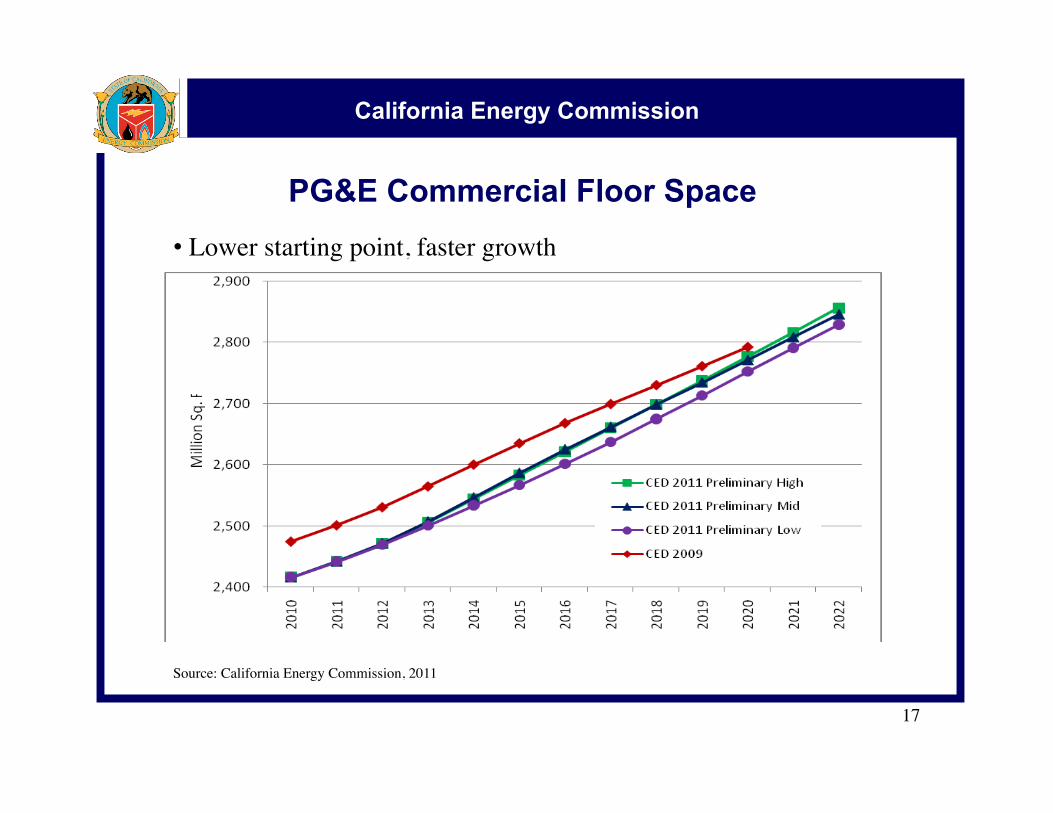
PG&E Commercial Floor Space
17
• Lower starting point, faster growth
Source: California Energy Commission, 2011
California Energy Commission
PG&E Industrial and Mining Sector
• 2010 consumption was over 4% lower than CED 2009 forecast
• Mid case growth similar to CED 2009 but starting from a lower level
• Scenario differences driven by difference in output assumptions
18
California Energy Commission
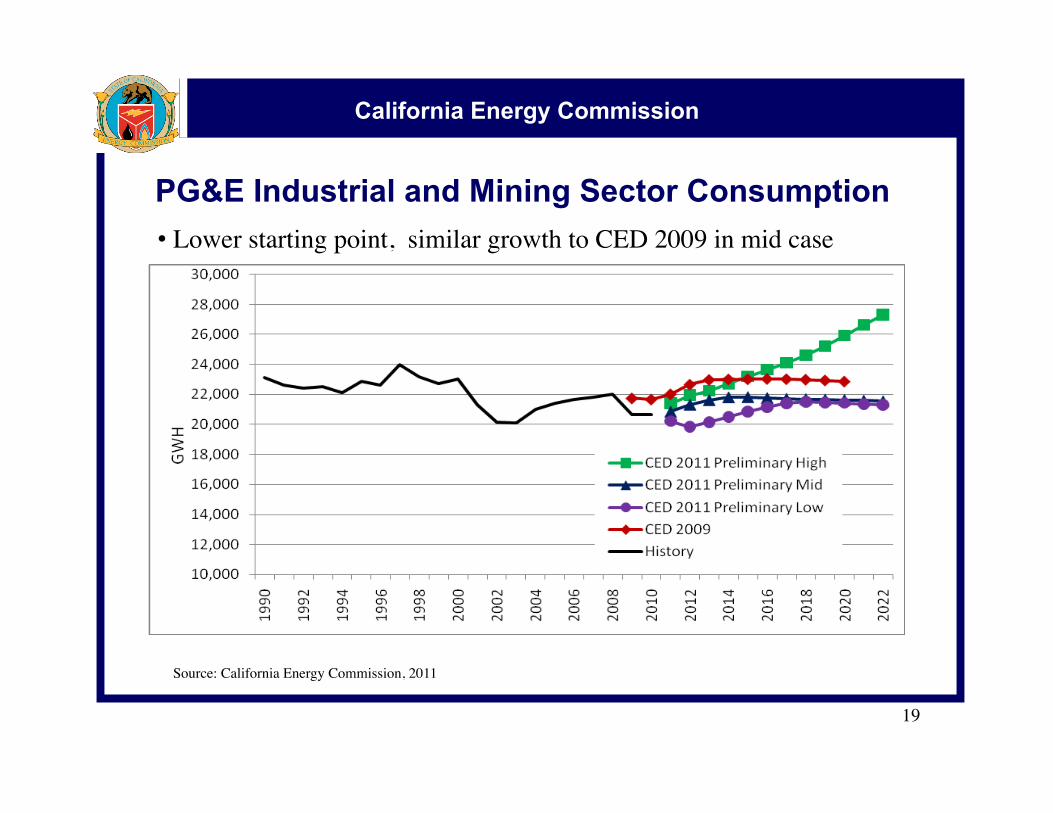
PG&E Industrial and Mining Sector Consumption
19
• Lower starting point, similar growth to CED 2009 in mid case
Source: California Energy Commission, 2011
California Energy Commission
PG&E Other Sectors
• Remaining sectors comprise 12% of total 2010 consumption: – 5% Transportation, communications and utilities (lower starting
point)
– 6% Agriculture and Water Pumping
– 1% Streetlighting
• Only Ag forecast is significantly different than CED 2009
• Electric vehicle use is projected increase total consumption by about 1.7% by 2022
20
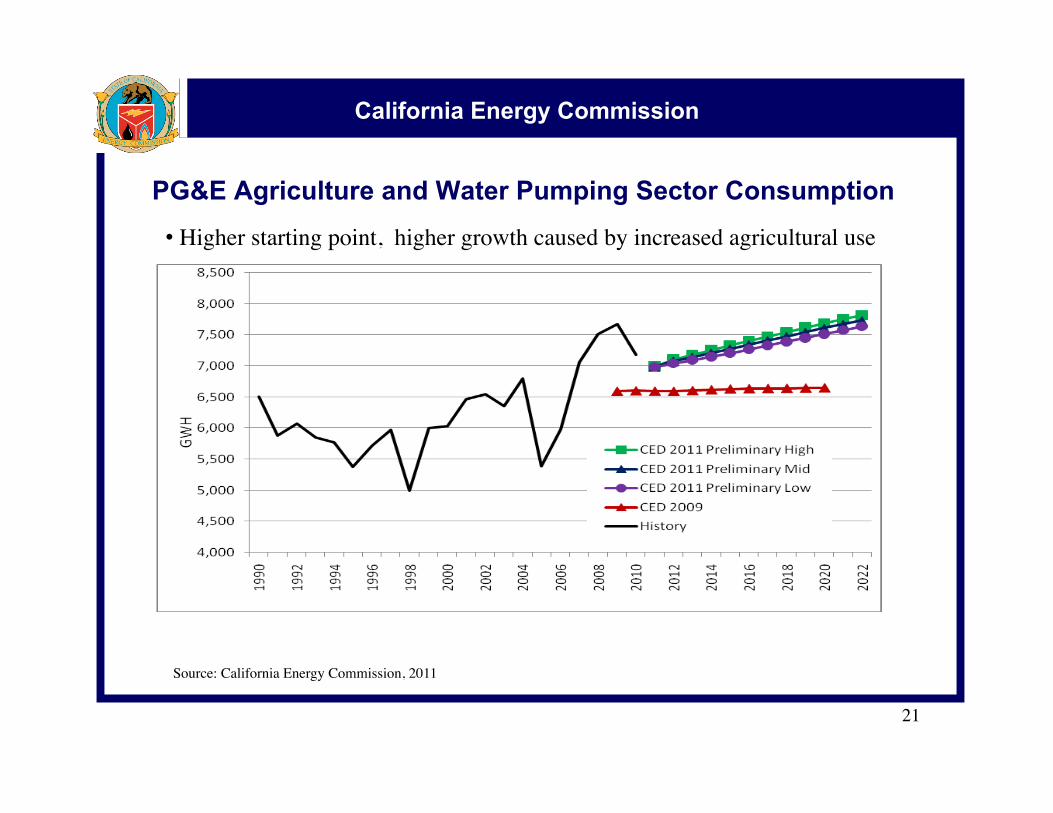
California Energy Commission
PG&E Agriculture and Water Pumping Sector Consumption
21
• Higher starting point, higher growth caused by increased agricultural use
Source: California Energy Commission, 2011

California Energy Commission
PG&E Electric Vehicle Forecast
22
• Peak impacts are projected to be from 90 and 100 MW in 2022
Source: California Energy Commission, 2011
California Energy Commission
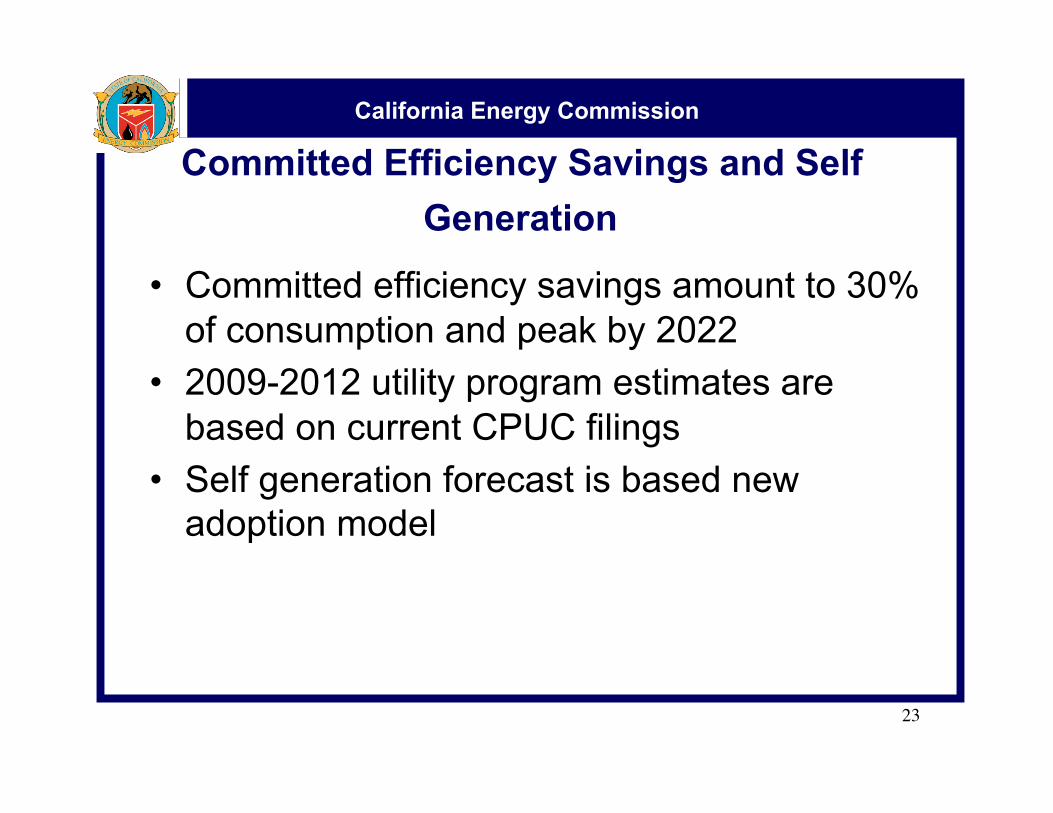
Committed Efficiency Savings and Self
Generation
• Committed efficiency savings amount to 30% of consumption and peak by 2022
• 2009-2012 utility program estimates are based on current CPUC filings
• Self generation forecast is based new adoption model
23

California Energy Commission
PG&E Committed Efficiency Savings Estimates
24
• Results follow historic trend
Source: California Energy Commission, 2011
California Energy Commission
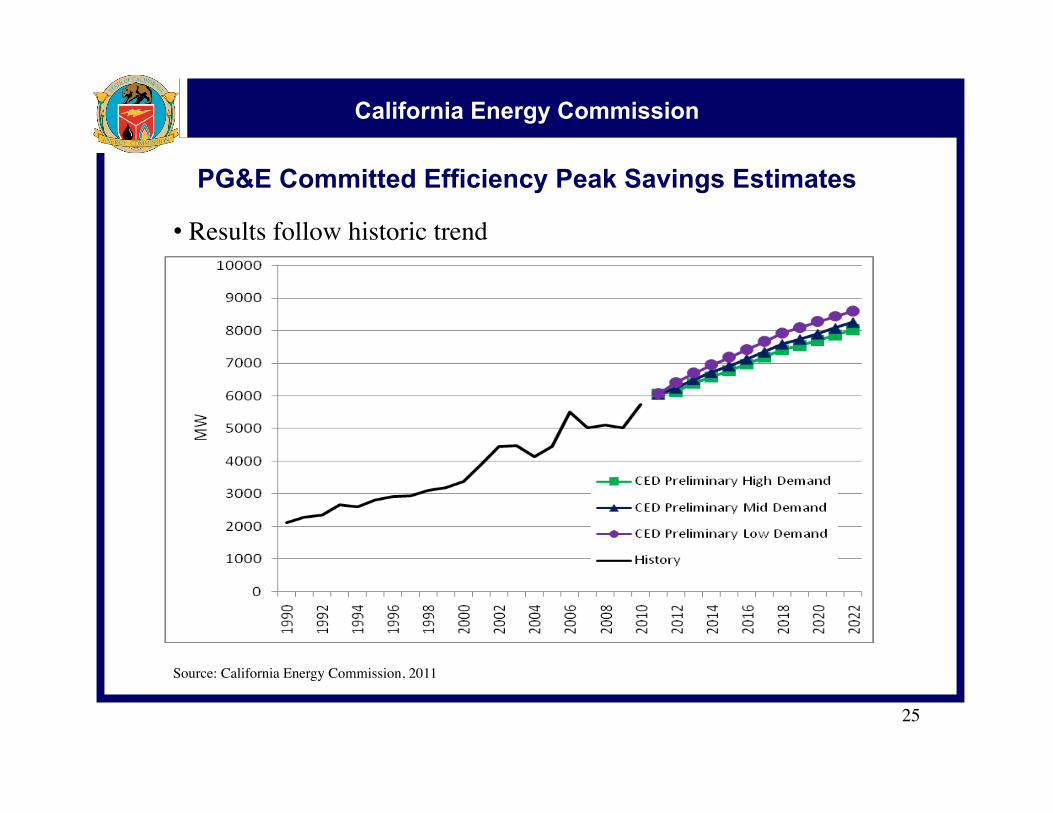
PG&E Committed Efficiency Peak Savings Estimates
25
• Results follow historic trend
Source: California Energy Commission, 2011
California Energy Commission
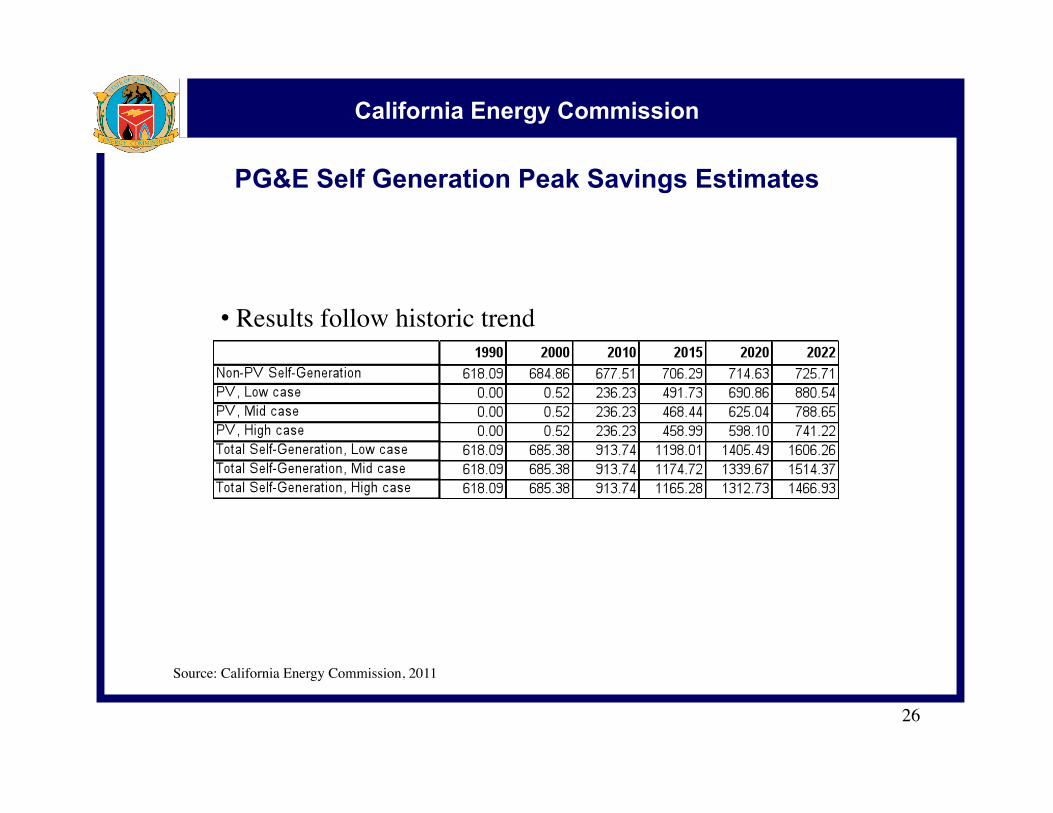
PG&E Self Generation Peak Savings Estimates
26
• Results follow historic trend
Source: California Energy Commission, 2011
California Energy Commission
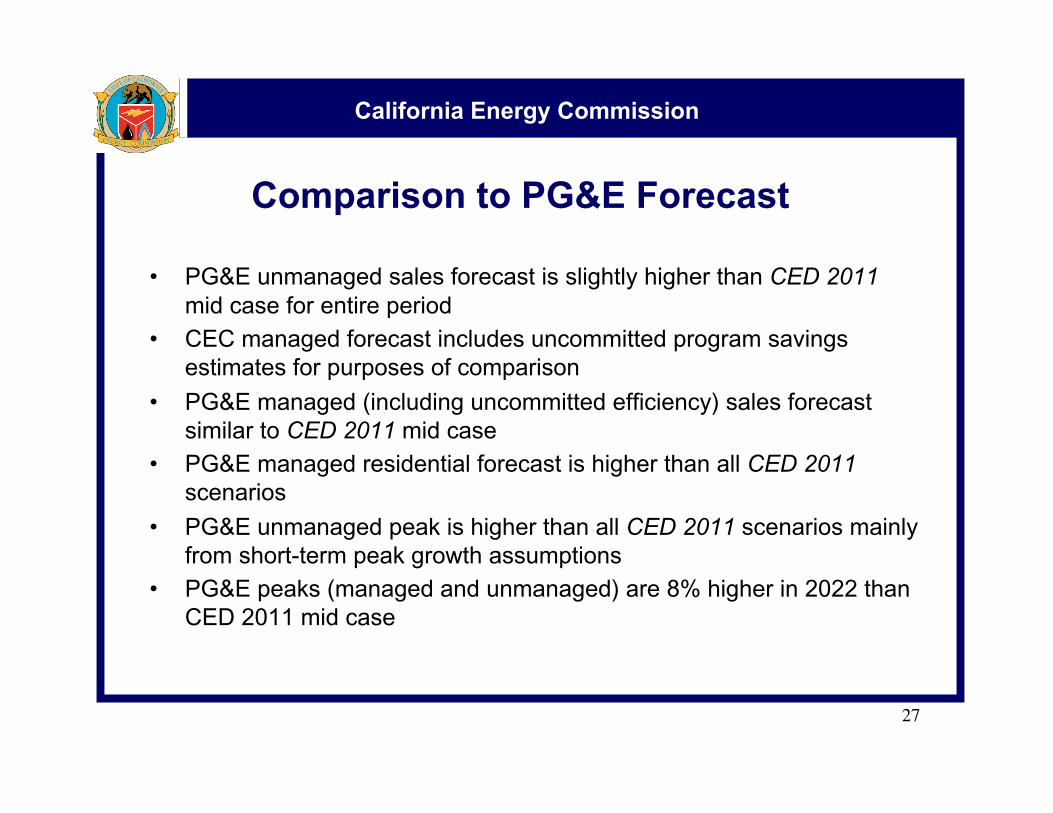
Comparison to PG&E Forecast
• PG&E unmanaged sales forecast is slightly higher than CED 2011 mid case for entire period
• CEC managed forecast includes uncommitted program savings estimates for purposes of comparison
• PG&E managed (including uncommitted efficiency) sales forecast similar to CED 2011 mid case
• PG&E managed residential forecast is higher than all CED 2011 scenarios
• PG&E unmanaged peak is higher than all CED 2011 scenarios mainly from short-term peak growth assumptions
• PG&E peaks (managed and unmanaged) are 8% higher in 2022 than CED 2011 mid case
27

California Energy Commission
PG&E Unmanaged Forecast Comparison
28
• PG&E slightly above CEC mid case
Source: California Energy Commission, 2011
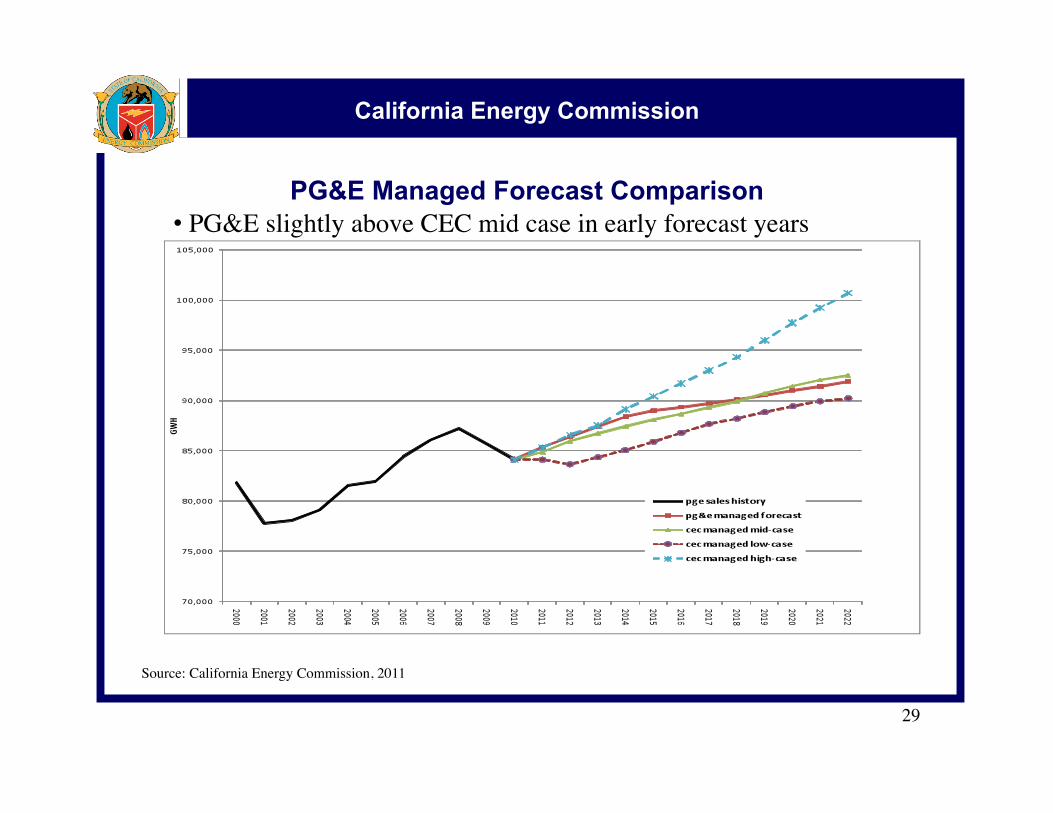
California Energy Commission
PG&E Managed Forecast Comparison
29
• PG&E slightly above CEC mid case in early forecast years
Source: California Energy Commission, 2011
California Energy Commission
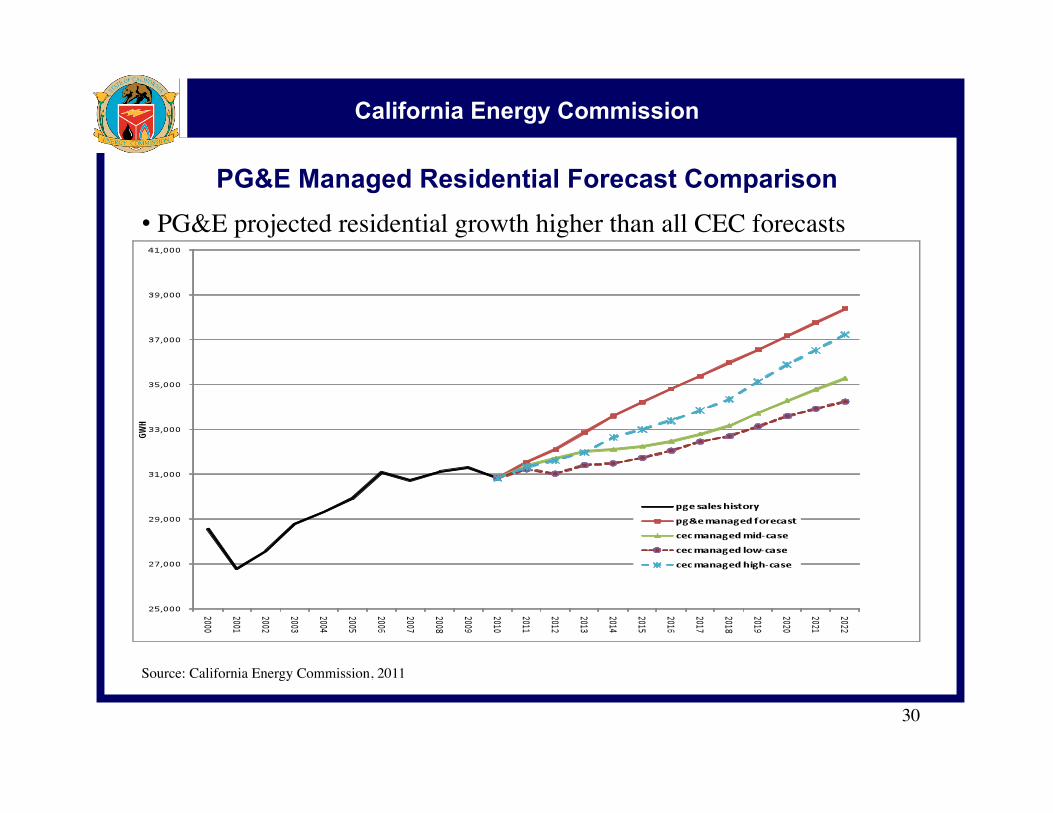
PG&E Managed Residential Forecast Comparison
30
• PG&E projected residential growth higher than all CEC forecasts
Source: California Energy Commission, 2011
California Energy Commission
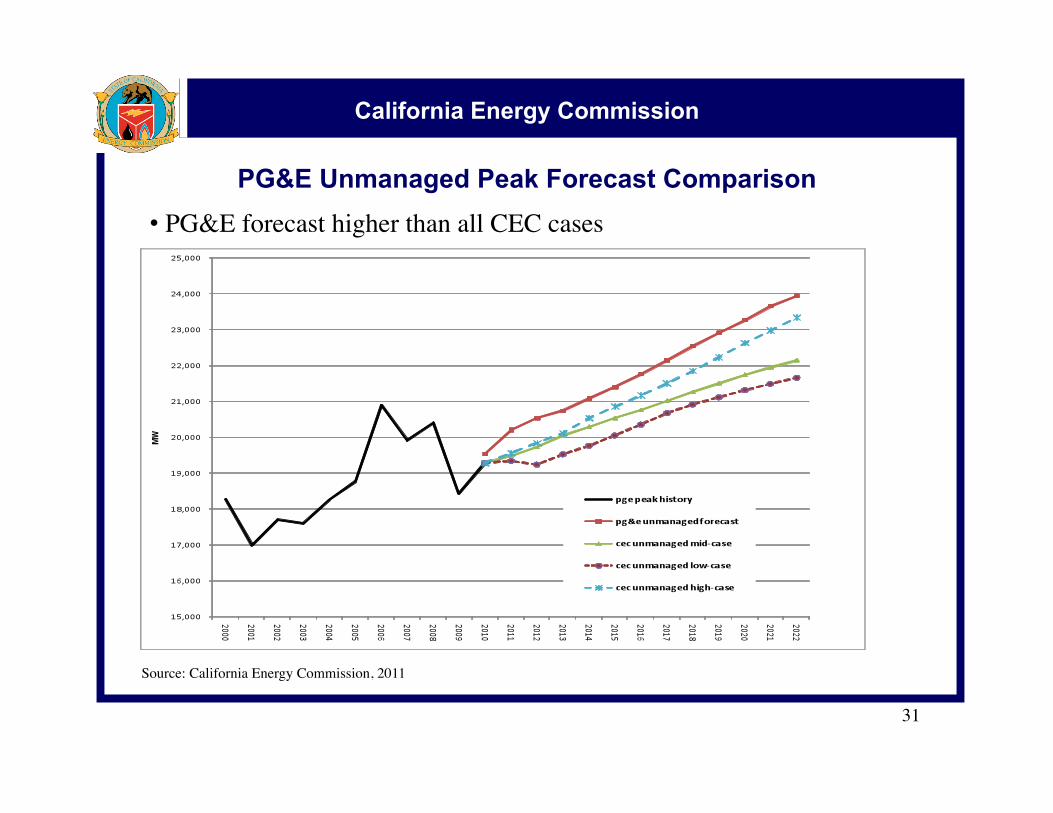
PG&E Unmanaged Peak Forecast Comparison
31
• PG&E forecast higher than all CEC cases
Source: California Energy Commission, 2011
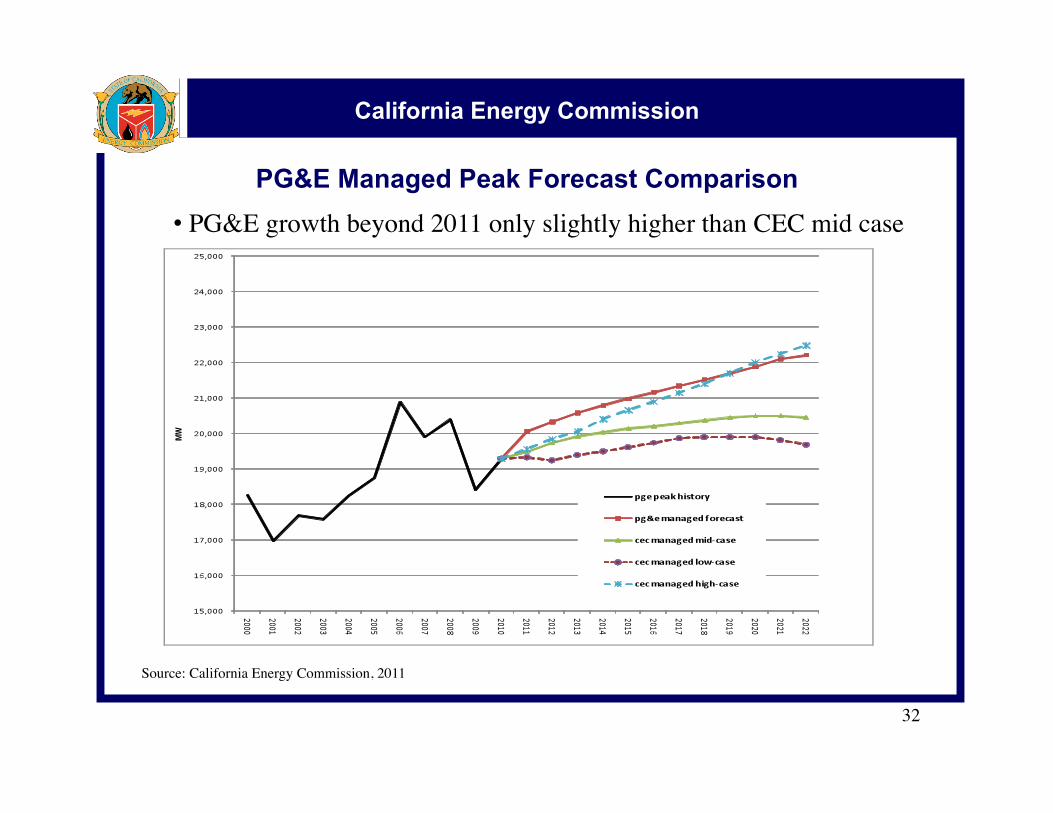
California Energy Commission
PG&E Managed Peak Forecast Comparison
32
• PG&E growth beyond 2011 only slightly higher than CEC mid case
Source: California Energy Commission, 2011