Embed Size (px)
DESCRIPTION
This guide, produced by the National Business Group on Health’s Pharmaceutical Council, is designed to educate employers on pharmaceutical benefit design – to deepen understanding and simplify decision making, helping benefits professionals keep up with a rapidly evolving pharmaceutical industry and maintain fair and affordable benefits.
Citation preview
PHARMACEUTICALBenefitDesign:
HELPING EMPLOYERSUnderstand, Assess,Select and ManagePharmacy Benefits

2businessgrouphealth.org Pharmaceutical Benefit Design: Helping Employers Understand, Assess, Select and Manage Pharmacy Benefits
This report was funded by members of the National Business Group on Health and is fortheir exclusive use. To protect proprietary and confidential information, it can only beshared, in either print or electronic formats, within and among Business Group membercompanies. All other uses require permission from the National Business Group on Health.
3businessgrouphealth.org Pharmaceutical Benefit Design: Helping Employers Understand, Assess, Select and Manage Pharmacy Benefits
TABLE OF CONTENTS
I. Introduction . . . . . . . . . . . . . . . . . . . . . . . . . . . . . . . . . . . . . .4
II. Background . . . . . . . . . . . . . . . . . . . . . . . . . . . . . . . . . . . . .5
III. U.S. Health Care Spending . . . . . . . . . . . . . . . . . . . . . . . .10
a. Drug Utilization . . . . . . . . . . . . . . . . . . . . . . . . . . . . . . . . . . . . . . . . . .11
b. Drug Prices and Cost . . . . . . . . . . . . . . . . . . . . . . . . . . . . . . . . . . . . .12
IV. An Employer Perspective . . . . . . . . . . . . . . . . . . . . . . . . .14
a. About the Supply Chain . . . . . . . . . . . . . . . . . . . . . . . . . . . . . . . . . . . .14
b. How Dollars Flow . . . . . . . . . . . . . . . . . . . . . . . . . . . . . . . . . . . . . . . . .16
V. Pharmaceutical Benefit Design Today . . . . . . . . . . . . . . . .18
a. Managing the Benefit . . . . . . . . . . . . . . . . . . . . . . . . . . . . . . . . . . . . . .19
b. Employer Pharmacy Benefit Design . . . . . . . . . . . . . . . . . . . . . . . . . .21
VI. The Role of the Employer as PharmaceuticalBenefit Purchaser . . . . . . . . . . . . . . . . . . . . . . . . . . . . . . . .23
a. Role of the Pharmacy Benefit Manager (PBM) . . . . . . . . . . . . . . . . . .25
b. Working with Your PBM . . . . . . . . . . . . . . . . . . . . . . . . . . . . . . . . . . . .26
c. Questions to Ask Your PBM . . . . . . . . . . . . . . . . . . . . . . . . . . . . . . . .28
d. Hints for Optimizing Cost-Containment and Cost-Effective Goals . . .30
VII. The Challenge of Specialty Pharmacy . . . . . . . . . . . . . . .31
VIII. Additional Issues in Pharmacy Benefit Design . . . . . . . .35
a. Appropriate Medication Usage . . . . . . . . . . . . . . . . . . . . . . . . . . . . . .35
b. Adherence . . . . . . . . . . . . . . . . . . . . . . . . . . . . . . . . . . . . . . . . . . . . . .35
c. Racial-Ethnic Disparities . . . . . . . . . . . . . . . . . . . . . . . . . . . . . . . . . . .38
d. Off-Label Medication Usage . . . . . . . . . . . . . . . . . . . . . . . . . . . . . . . .38
e. Misuse, Abuse, Dependence and Addiction . . . . . . . . . . . . . . . . . . . .39
f. Aging Workforce, Retiree Coverage and Medicare Part D . . . . . . . . . .40
g. High-Deductible Health Plans . . . . . . . . . . . . . . . . . . . . . . . . . . . . . . .41
h. Marketing: Direct-to-Consumer and Direct-to-Physician . . . . . . . . . .41
4businessgrouphealth.org Pharmaceutical Benefit Design: Helping Employers Understand, Assess, Select and Manage Pharmacy Benefits
TABLE OF CONTENTS CONTINUED
IX. The Value of Pharmaceutical Coverage . . . . . . . . . . . . . .43
a. Integration . . . . . . . . . . . . . . . . . . . . . . . . . . . . . . . . . . . . . . . . . . . . . .44
b. Cost Containment . . . . . . . . . . . . . . . . . . . . . . . . . . . . . . . . . . . . . . . .44
c. Comprehensive Approach to Pharmaceutical Benefits . . . . . . . . . . . .45
X. Pharmaceutical Benefit Design Case Studies . . . . . . . . . .46
a. Pitney Bowes . . . . . . . . . . . . . . . . . . . . . . . . . . . . . . . . . . . . . . . . . . . .47
b. The Asheville Project . . . . . . . . . . . . . . . . . . . . . . . . . . . . . . . . . . . . . .49
c. Mohawk Industries, Inc. . . . . . . . . . . . . . . . . . . . . . . . . . . . . . . . . . . . .51
d. Wake Forest University Baptist Medical Center . . . . . . . . . . . . . . . . .52
e. University of Michigan . . . . . . . . . . . . . . . . . . . . . . . . . . . . . . . . . . . . .54
XI. Conclusion . . . . . . . . . . . . . . . . . . . . . . . . . . . . . . . . . . . .55
XII. References . . . . . . . . . . . . . . . . . . . . . . . . . . . . . . . . . . .57
XIII.Appendix A: Terms and Definitions . . . . . . . . . . . . . . . . . .61
5businessgrouphealth.org Pharmaceutical Benefit Design: Helping Employers Understand, Assess, Select and Manage Pharmacy Benefits
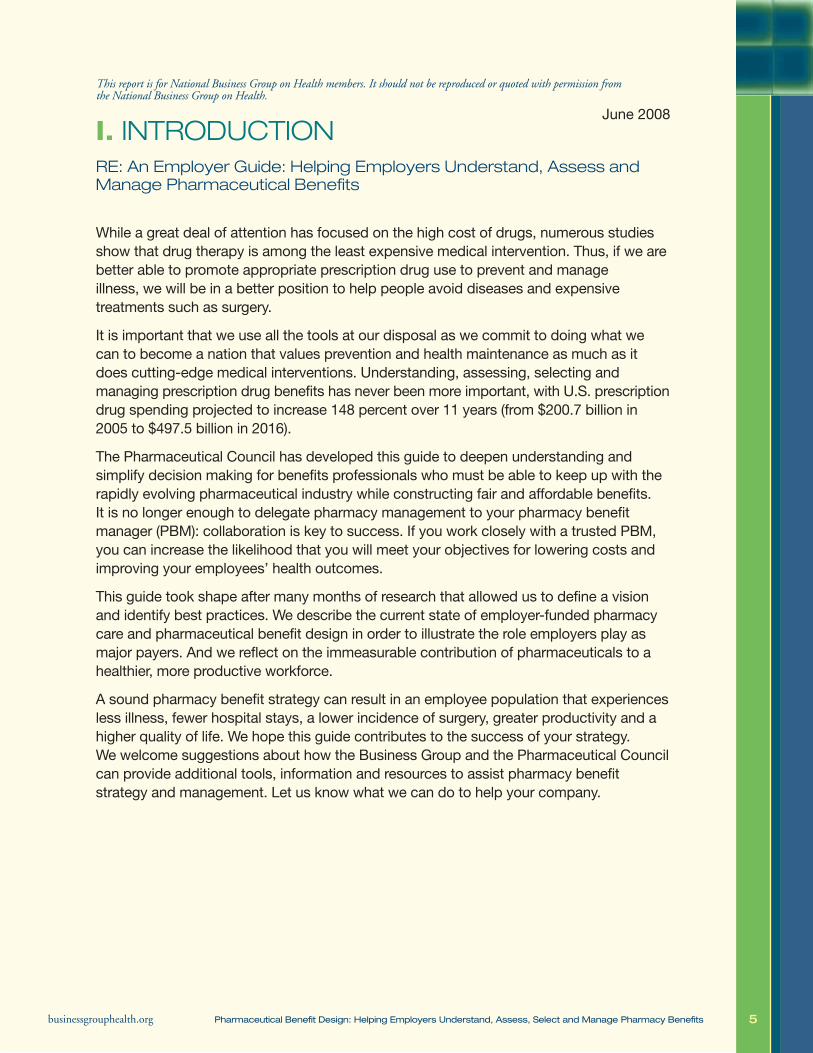
I. INTRODUCTION
While a great deal of attention has focused on the high cost of drugs, numerous studiesshow that drug therapy is among the least expensive medical intervention. Thus, if we arebetter able to promote appropriate prescription drug use to prevent and manageillness, we will be in a better position to help people avoid diseases and expensivetreatments such as surgery.
It is important that we use all the tools at our disposal as we commit to doing what wecan to become a nation that values prevention and health maintenance as much as itdoes cutting-edge medical interventions. Understanding, assessing, selecting andmanaging prescription drug benefits has never been more important, with U.S. prescriptiondrug spending projected to increase 148 percent over 11 years (from $200.7 billion in2005 to $497.5 billion in 2016).
The Pharmaceutical Council has developed this guide to deepen understanding andsimplify decision making for benefits professionals who must be able to keep up with therapidly evolving pharmaceutical industry while constructing fair and affordable benefits.It is no longer enough to delegate pharmacy management to your pharmacy benefitmanager (PBM): collaboration is key to success. If you work closely with a trusted PBM,you can increase the likelihood that you will meet your objectives for lowering costs andimproving your employees’ health outcomes.
This guide took shape after many months of research that allowed us to define a visionand identify best practices. We describe the current state of employer-funded pharmacycare and pharmaceutical benefit design in order to illustrate the role employers play asmajor payers. And we reflect on the immeasurable contribution of pharmaceuticals to ahealthier, more productive workforce.
A sound pharmacy benefit strategy can result in an employee population that experiencesless illness, fewer hospital stays, a lower incidence of surgery, greater productivity and ahigher quality of life. We hope this guide contributes to the success of your strategy.We welcome suggestions about how the Business Group and the Pharmaceutical Councilcan provide additional tools, information and resources to assist pharmacy benefitstrategy and management. Let us know what we can do to help your company.
RE: An Employer Guide: Helping Employers Understand, Assess andManage Pharmaceutical Benefits
June 2008
This report is for National Business Group on Health members. It should not be reproduced or quoted with permission fromthe National Business Group on Health.

6businessgrouphealth.org Pharmaceutical Benefit Design: Helping Employers Understand, Assess, Select and Manage Pharmacy Benefits
II. BACKGROUND
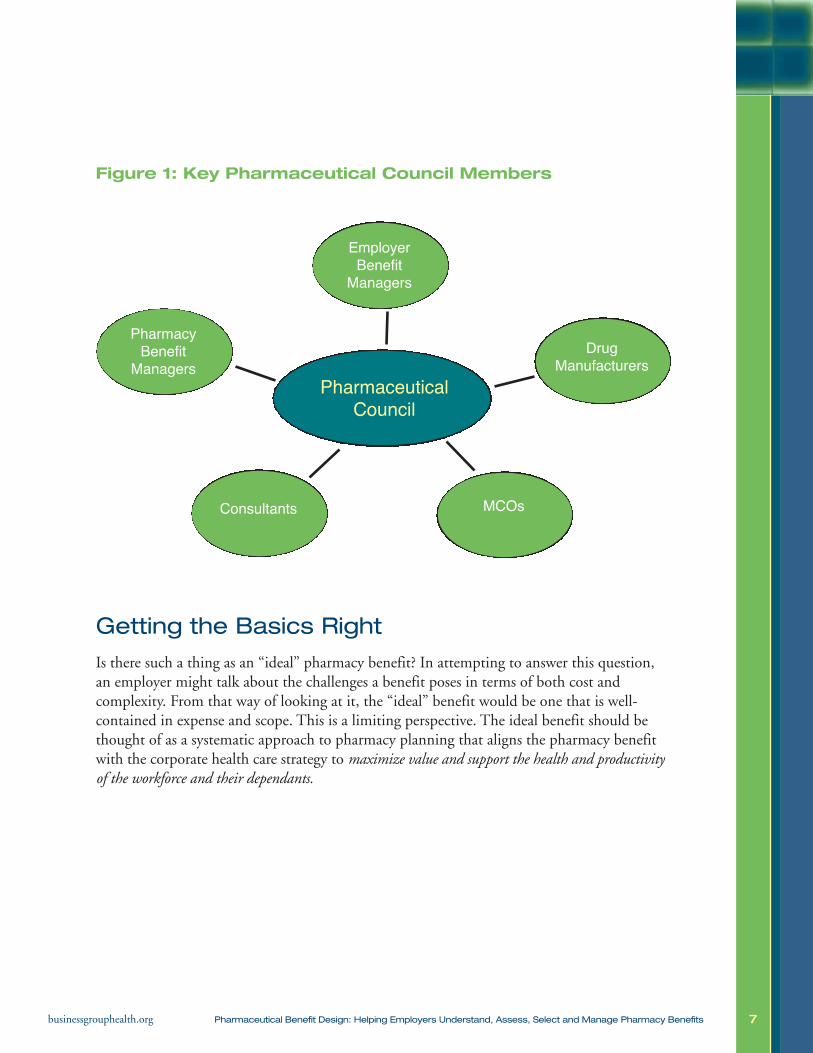
The Pharmaceutical Council was established in 2001 to provide tools and informationabout pharmaceutical companies and pharmacy benefits for members of the NationalBusiness Group on Health. The Pharmaceutical Council’s primary objective is to supportthe sustainability of employer-sponsored prescription drug benefits. Council membersrepresent the following major players in the pharmaceutical system:
• Employer benefit managers
• Pharmacy benefit managers (PBMs)
• Pharmaceutical manufacturers
• Retailers
• Consultants
• Managed care organizations (MCOs)
These diverse players participate in the Pharmaceutical Council because they share thefollowing vision:
• Employer-sponsored prescription drug benefits should be maintained and supported.
• Pharmaceutical care should be affordable and appropriate to medical need.
• Accuracy, quality and cost drive value.
• Value in pharmaceutical spending must be defined and acknowledged.
The Pharmaceutical Council’s activities support the vision by educating employers aboutthe following:
• Best practices for optimizing pharmaceutical benefit value;
• The role of pharmaceutical companies in total health care spending;
• Links between medication adherence and health and productivity;
• Practical solutions for future pharmacy benefit design and health care management;
• The business case for pharmaceutical coverage; and
• Return-on-investment methodologies that evaluate effectiveness relative to:
– Overall health care costs, and
– Employee health and productivity.
This report is for National Business Group on Health members. It should not be reproduced or quoted with permission fromthe National Business Group on Health.
7businessgrouphealth.org Pharmaceutical Benefit Design: Helping Employers Understand, Assess, Select and Manage Pharmacy Benefits
Figure 1: Key Pharmaceutical Council Members
Getting the Basics Right
Is there such a thing as an “ideal” pharmacy benefit? In attempting to answer this question,an employer might talk about the challenges a benefit poses in terms of both cost andcomplexity. From that way of looking at it, the “ideal” benefit would be one that is well-contained in expense and scope. This is a limiting perspective. The ideal benefit should bethought of as a systematic approach to pharmacy planning that aligns the pharmacy benefitwith the corporate health care strategy to maximize value and support the health and productivityof the workforce and their dependants.
EmployerBenefit
Managers
PharmaceuticalCouncil
DrugManufacturers
MCOsConsultants
PharmacyBenefit
Managers

8businessgrouphealth.org Pharmaceutical Benefit Design: Helping Employers Understand, Assess, Select and Manage Pharmacy Benefits
Value, moreover, should be thought of as more than just total dollars spent. It shouldacknowledge the extent to which the benefit does the following:
• Supports the maintenance and improvement of employee productivity;
• Drives waste from the system;
• Encourages use of medications that are clinically effective; and
• Saves employer spending on other health-related initiatives (e.g., medical and disabilitycosts) while also saving employee spend.
Proper valuation requires understanding that there is a vastdifference between cost and price. In addition to seeking tooptimize the unit price of each prescription drug, employers needstrategies to optimize their overall pharmacy utilization. This wouldinclude optimizing the therapeutic mix and taking advantage of theopportunities provided by generic pharmaceuticals. While unitprices are important, employers should focus primarily on managing net cost for the overallpharmacy benefit without compromising health outcomes or inappropriately shifting coststo employees.
All employer-sponsored health care spending is strongly interrelated. The structure anddesign of one benefit impacts the use, and thus the cost, of the others. For this reason, totalpharmaceutical value needs to consider not only overall employee health but also how muchtime an employee spends in a hospital, in a doctor’s office, on disability leave and at work butnot feeling well. These represent costs due to lost productivity stemming from absenteeismand presenteeism (i.e., not showing up for work or not performing well while at work).
“If you look for a cost-containment solution by focusing only on benefit design,you’re getting ahead of yourself. You’ve overlooked the more fundamental problem,which is to understand the prescription drug benefit’s building blocks and how theyfit together … benefit changes alone are not sufficient to solve the problem of cost.This requires a more holistic approach tackling delivery and dispensing, providercontracting, drug product availability, and ultimately benefit design as well.”
—Milliman (ss)Benefits Perspective
Current Issues in Employee Benefits
In the world ofpharmaceuticals,there is a vastdifference betweencost and price.
9businessgrouphealth.org Pharmaceutical Benefit Design: Helping Employers Understand, Assess, Select and Manage Pharmacy Benefits
Employees lose about 10.4 productive workdays a year as a direct result of family illness orpoor personal health.1 These lost workdays cost employers nearly $2,000 per employee peryear. While these costs are ”soft,” difficult to measure and require multiple assumptions formodeling, several studies assessing the cost-effectiveness of pharmaceutical treatment forchronic and recurrent health conditions show that providing pharmaceutical benefits can infact save employers money by avoiding medical treatment, preventing sick days or both.2
An Optimal Pharmacy Benefit Strategy
Employers and their PBMs need to work together to develop a pharmacy benefit plan thatcan do the following:
• Cover medications that are effective in treating patients by improving significant clinicaloutcomes and reducing overall medical costs;
• Encourage prescribers to select medications that are in accordance with an evidence-basedpractice of medicine;
• Preserve appropriate access to pharmacies while enhancing an employer’s ability toleverage volume, safety, and price;
• Monitor and encourage patient adherence with drug therapies;
• Maintain and use patient-medication records to prevent unnecessary and potentiallyharmful drug interactions and other problems;
• Monitor employee drug usage for over- and under-utilization; and
• Promote prudent utilization of pharmaceuticals by plan members with benefit designsthat provide a mixture of incentives and disincentives to facilitate access and supportcost- and quality-effective choices.
Ultimately, the pharmacy benefit should be designed to meet the medical, educational,economic and physical needs of most beneficiaries. Employers should manage unusualsituations as exceptions to broad policy, rather than build the benefit around these potentialexceptions.
10businessgrouphealth.org Pharmaceutical Benefit Design: Helping Employers Understand, Assess, Select and Manage Pharmacy Benefits
Other Opportunities for Cost Savings
Use the pharmacy benefit design to promote more prudent prescription drug usage by doingthe following:
• Supporting appropriate use of generic drugs;
• Promoting the use of over-the-counter medications where appropriate;
• Encouraging reduced use of drugs that are not proven to be optimally effective; and
• Shifting toward mail-order pharmacy services where appropriate and share savingsbetween both the employer and the beneficiary (e.g., for maintenance medications).
Promote adherence: Adherence is essential to the cost-effective use of medications.For example, a recent study revealed that a 20 percent increase in adherence to a diabeticmedication resulted in an average return on investment (ROI) of 7.1 to 1.3 A similar increasein adherence to cholesterol-lowering medication produced an average ROI of 5.1 to 1.3 20percent rise in patient adherence to a cardiovascular medication resulted in an average ROIof 5.1 to 1.3 In summary, for patients with diabetes, hypertension or hypercholesterolemia,this study showed that high levels of adherence with condition-specific drugs were associatedwith lower medical costs, despite the increased drug costs.3
Get employees immunized: A cost-benefit analysis indicates that every dollar investedin vaccines dose saves $2 to $27 in health care expenses in the United States.4
11businessgrouphealth.org Pharmaceutical Benefit Design: Helping Employers Understand, Assess, Select and Manage Pharmacy Benefits
III. U.S. HEALTH CARE SPENDING
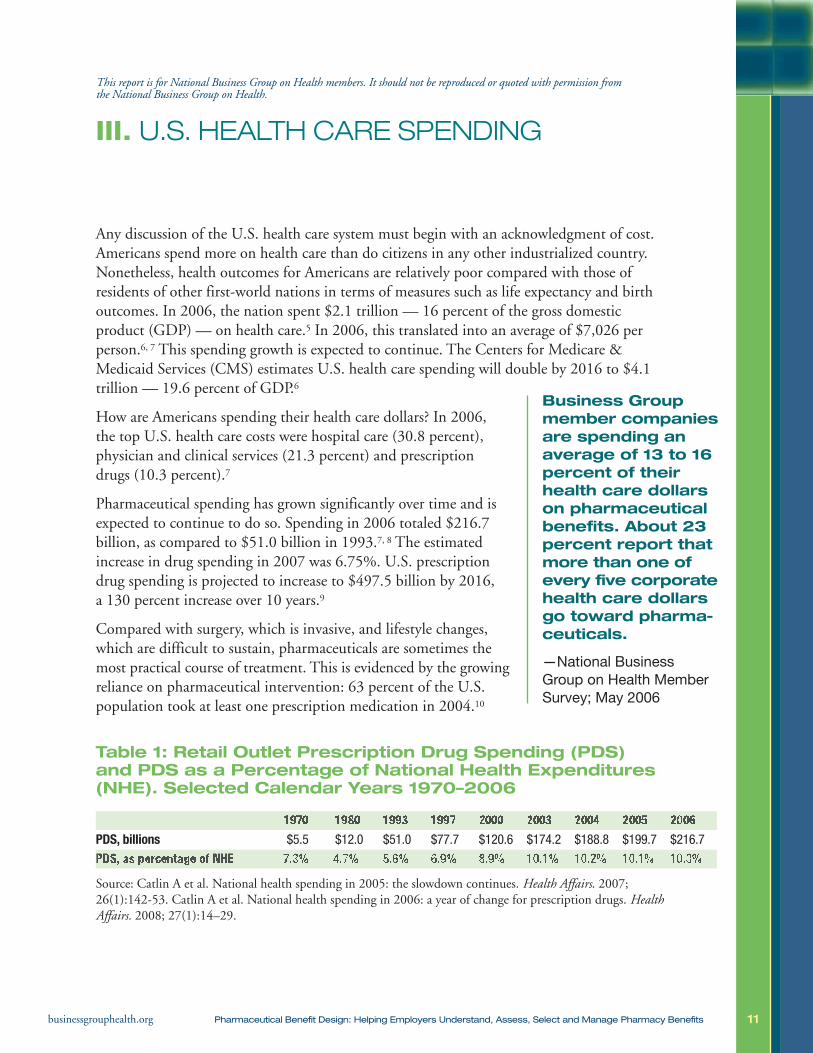
Any discussion of the U.S. health care system must begin with an acknowledgment of cost.Americans spend more on health care than do citizens in any other industrialized country.Nonetheless, health outcomes for Americans are relatively poor compared with those ofresidents of other first-world nations in terms of measures such as life expectancy and birthoutcomes. In 2006, the nation spent $2.1 trillion — 16 percent of the gross domesticproduct (GDP) — on health care.5 In 2006, this translated into an average of $7,026 perperson.6, 7 This spending growth is expected to continue. The Centers for Medicare &Medicaid Services (CMS) estimates U.S. health care spending will double by 2016 to $4.1trillion — 19.6 percent of GDP.6
How are Americans spending their health care dollars? In 2006,the top U.S. health care costs were hospital care (30.8 percent),physician and clinical services (21.3 percent) and prescriptiondrugs (10.3 percent).7
Pharmaceutical spending has grown significantly over time and isexpected to continue to do so. Spending in 2006 totaled $216.7billion, as compared to $51.0 billion in 1993.7, 8 The estimatedincrease in drug spending in 2007 was 6.75%. U.S. prescriptiondrug spending is projected to increase to $497.5 billion by 2016,a 130 percent increase over 10 years.9
Compared with surgery, which is invasive, and lifestyle changes,which are difficult to sustain, pharmaceuticals are sometimes themost practical course of treatment. This is evidenced by the growingreliance on pharmaceutical intervention: 63 percent of the U.S.population took at least one prescription medication in 2004.10
Table 1: Retail Outlet Prescription Drug Spending (PDS)and PDS as a Percentage of National Health Expenditures(NHE). Selected Calendar Years 1970–2006
Source: Catlin A et al. National health spending in 2005: the slowdown continues. Health Affairs. 2007;26(1):142-53. Catlin A et al. National health spending in 2006: a year of change for prescription drugs. HealthAffairs. 2008; 27(1):14–29.
Business Groupmember companiesare spending anaverage of 13 to 16percent of theirhealth care dollarson pharmaceuticalbenefits. About 23percent report thatmore than one ofevery five corporatehealth care dollarsgo toward pharma-ceuticals.
—National BusinessGroup on Health MemberSurvey; May 2006
1970 1980 1993 1997 2000 2003 2004 2005 2006PDS, billions $5.5 $12.0 $51.0 $77.7 $120.6 $174.2 $188.8 $199.7 $216.7
PDS, as percentage of NHE 7.3% 4.7% 5.6% 6.9% 8.9% 10.1% 10.2% 10.1% 10.3%
This report is for National Business Group on Health members. It should not be reproduced or quoted with permission fromthe National Business Group on Health.
12businessgrouphealth.org Pharmaceutical Benefit Design: Helping Employers Understand, Assess, Select and Manage Pharmacy Benefits
Drug Utilization
Prescription drug utilization is at an all-time high. Two factors determine drug utilizationrates: prevalence and intensity. “Prevalence” refers to the number of people who are beingtreated with a prescription medication; “intensity” refers to the number of prescriptionspeople take each year.
What drives prevalence of prescription drug use? The following three factors are key:
• Demographic patterns — The U.S. population is aging. In 2000, people 65 yearsof age and older represented 12.4 percent of the population; by 2030, they will make up20 percent of the population.11 Compared to younger patients, older patients:
– Experience a higher prevalence of disease;
– Are more likely to have multiple chronic conditions;
– Experience more-severe diseases or disabilities;12 and
– Are more likely to be obese.
• Greater prevalence of identified and treated disease — Rates of diagnoseddisease are increasing for a variety of reasons. Some diseases (e.g., asthma) appear to beincreasing in prevalence; others (e.g., hyperlipidemia) have recently seen their treatmentguidelines broadened. Still other conditions (e.g., restless leg syndrome) have experiencedan increase in public awareness, often the result of direct-to-consumer advertising. As aresult of these factors, many more people now have diagnoses that are treatable withprescription drugs.12
• Expanding treatment opportunities — The numberof medications on the market is continuing to increase becauseof the introduction of new therapeutic classes, the retooling ofestablished drug formulations and increased availability ofgeneric alternatives.
What drives intensity?
• Increasing quantities (dosing) of medication perpatient — Intensity changes when a provider increases ordecreases medication dosages (e.g., more medication is requiredover the same time period, treatment is required for a longerperiods of time).
• Duration of treatment—How long do people stay on medication regimens. Manywith chronic diseases are expected to take medication for the rest of their lives.
Direct-to-consumeradvertising impactsboth the prevalenceof prescription druguse and the intensityof treatment.It increases publicawareness of agreater number ofconditions as wellas the possibility oftreatment thoughpharmacotherapy.
13businessgrouphealth.org Pharmaceutical Benefit Design: Helping Employers Understand, Assess, Select and Manage Pharmacy Benefits
Drug Prices and Cost
What affects the price of medications? Ultimately, there are three drivers of pharmaceuticalprice over time: inflation, altered usage patters of available pharmaceuticals (mix), andentrance of new products (new therapeutic agents and generics) to the market.
What drive price?
• Inflation — Increased charges for existing therapies.
• Altered usage patterns of available pharmaceuticals — Given a variety ofpharmaceutical treatment options, the percentage of patients on any given medicationmay shift over time. This can happen for a variety of reasons (e.g., new medical evidencesuggesting one drug should be use over another, changing provider practice patterns,marketing, and pressure from consumers of health plan sponsors). This shifting mix cancause price to increase or decrease, depending on whether the shift is toward more or lessexpensive products.
• Entrance of new products to market — Introduction of a new drug can increaseprice if it is relatively more expensive than products currently available. The reverse inalso possible; new drugs can reduce spending if they are cheaper and bring price competi-tion to a given therapeutic category, such as with the introduction of a new generic drug.
How much of the increase in pharmaceutical spending is due to increased price versus thevarious factors affecting utilization? Consider the nation’s experience during 2006:
• The number of prescription drugs purchased increased more rapidly in 2006 than in2005.13, 14 Growth in medication usage accounted for roughly half of the nation’s increaseddrug spending in 2006 as compared to only 20 percent of the growth in 2005.15
• Introduction of new medications had a minimal effect on spending in 2006.
• The generic drug dispensing rate reached 63 percent in 2006, a 7 percent increase overthe previous year.18
• Shifts in the therapeutic mix (changes in the relative shares of drugs within a class oramong classes, or in strengths of existing drugs) contributed to the growth in retailprescription drug spending in 2006.16 Given a variety of treatment options, the percentageof patients on any given medication shifts over time. This can happen for a variety ofreasons (e.g., new medical evidence suggesting one drug should be used over another,changing provider practice patterns, marketing and pressure from consumers or healthplan sponsors).
14businessgrouphealth.org Pharmaceutical Benefit Design: Helping Employers Understand, Assess, Select and Manage Pharmacy Benefits
• Full implementation of Medicare Part D (Medicare drug benefit) affected overallprescription drug spending by changing the payer mix and affecting access. In 2006,retail drug spending grew by 8.5 percent, as compared to an almost 30-year low of 5.8percent in 2005.13
• Double-digit increases in the utilization of specialty medications (see Section VII: TheChallenge of Specialty Pharmacy).
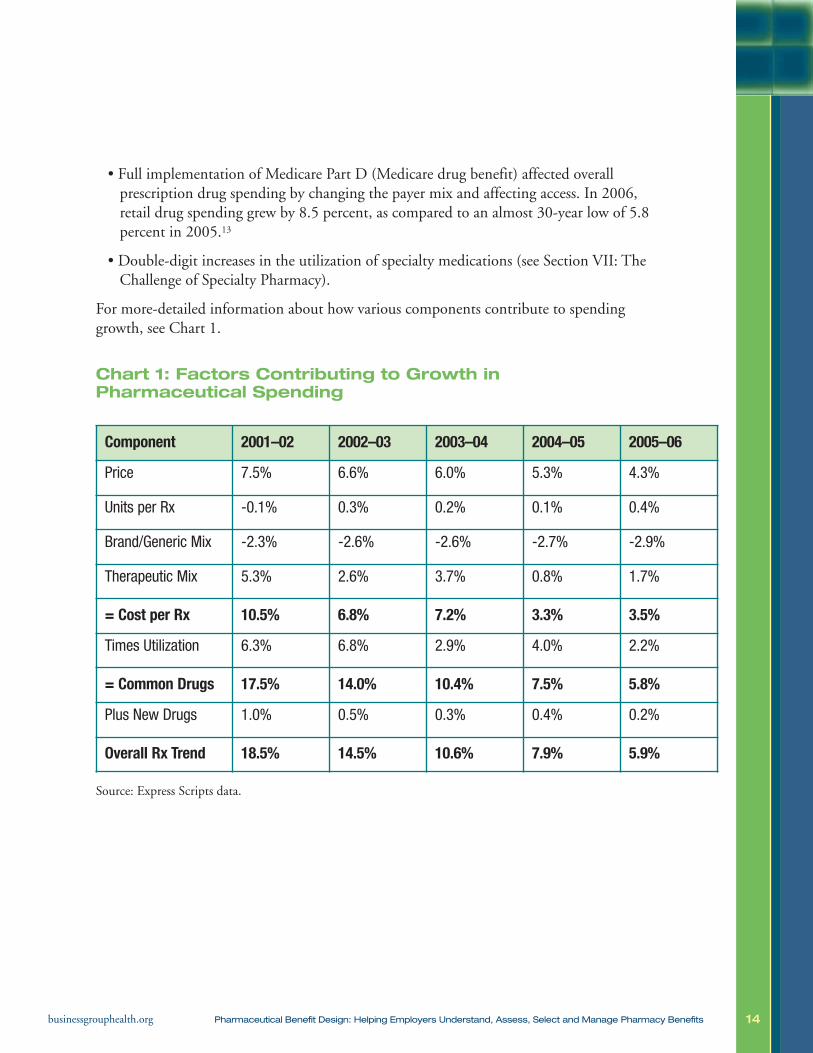
For more-detailed information about how various components contribute to spendinggrowth, see Chart 1.
Chart 1: Factors Contributing to Growth inPharmaceutical Spending
Source: Express Scripts data.
Component 2001–02 2002–03 2003–04 2004–05 2005–06
Price 7.5% 6.6% 6.0% 5.3% 4.3%
Units per Rx -0.1% 0.3% 0.2% 0.1% 0.4%
Brand/Generic Mix -2.3% -2.6% -2.6% -2.7% -2.9%
Therapeutic Mix 5.3% 2.6% 3.7% 0.8% 1.7%
= Cost per Rx 10.5% 6.8% 7.2% 3.3% 3.5%
Times Utilization 6.3% 6.8% 2.9% 4.0% 2.2%
= Common Drugs 17.5% 14.0% 10.4% 7.5% 5.8%
Plus New Drugs 1.0% 0.5% 0.3% 0.4% 0.2%
Overall Rx Trend 18.5% 14.5% 10.6% 7.9% 5.9%
15businessgrouphealth.org Pharmaceutical Benefit Design: Helping Employers Understand, Assess, Select and Manage Pharmacy Benefits
IV. AN EMPLOYER PERSPECTIVE
Employer-sponsored insurance covers about 158 million non-elderly Americans.19 Nearly all(98 percent) covered workers in employer-sponsored health plans had a prescription drugbenefit in 2006.20 For this reason, employers must be considered primary players in thepharmaceutical system.
The pharmaceutical system is complicated and often poorly understood. It involves numerousplayers, a complex drug path and complicated financing arrangements. To be an effectivepurchaser (payer), an employer must understand:
• How medications flow from manufacturer to user (i.e., the drug supply chain); and
• How money flows from end user, via the payer, through the distributor, and back to themanufacturer (i.e., financial logistics).
About the Supply Chain
The path of pharmaceuticals from manufacturer to consumer is multi-step (see Figure 2).
• Drug manufacturers send their products to wholesalers or distributors that managedispensing to pharmacies, hospitals and physicians’ offices.
• Health plans and PBMs enter the pharmaceutical system where financing anddistribution meet. They provide multiple services, all aimed at helping purchasersmanage a complicated pharmaceutical system. More specifically, they:
– Negotiate pricing with manufacturers, leveraging volume, market share and formu-lary placement in return for discounts and rebates for plan sponsors and individualsenrolled in their plans;
– Contract with retail pharmacies, establish payment levels for provider pharmacies andadjudicate pharmacy claims;
– Enhance safety by checking for drug interactions for individual patients receiving carefrom multiple prescribers and dispensing pharmacies;
– Offer manage mail-order pharmacies to facilitate the purchase and dispensing ofmaintenance medications for patients with chronic conditions; and
– Adjudicate pharmacy claims in accordance with the plan sponsor’s benefit design,serving as an intermediary between the payer and the pharmacy.
This report is for National Business Group on Health members. It should not be reproduced or quoted with permission fromthe National Business Group on Health.
16businessgrouphealth.org Pharmaceutical Benefit Design: Helping Employers Understand, Assess, Select and Manage Pharmacy Benefits
• Pharmacies dispense drugs. They receive payment from the health plan or PBM fordrugs dispensed to plan beneficiaries on the basis of negotiated formulas. In 2003, thenumber of brick-and-mortar pharmacies (independent, chain, mass merchant, andsupermarket) in the United States was estimated at nearly 57,000.21 These retailers filled3.2 billion prescriptions.22
• Individuals with employer-sponsored insurance coverage purchase medication at apharmacy or another point-of-sale. They pay a copayment or coinsurance. The specificsof cost sharing are determined by the plan sponsor’s benefit design. Individuals who lackcoverage pay the pharmacy’s retail price (also known as the usual and customary, orU&C, price) for their medications.
• Physicians and other providers may act as medication-distribution points.Health plans and PBMs may negotiate the payments these providers receive for drugsadministered directly to beneficiaries (e.g., immunizations, allergy shots and biologics).
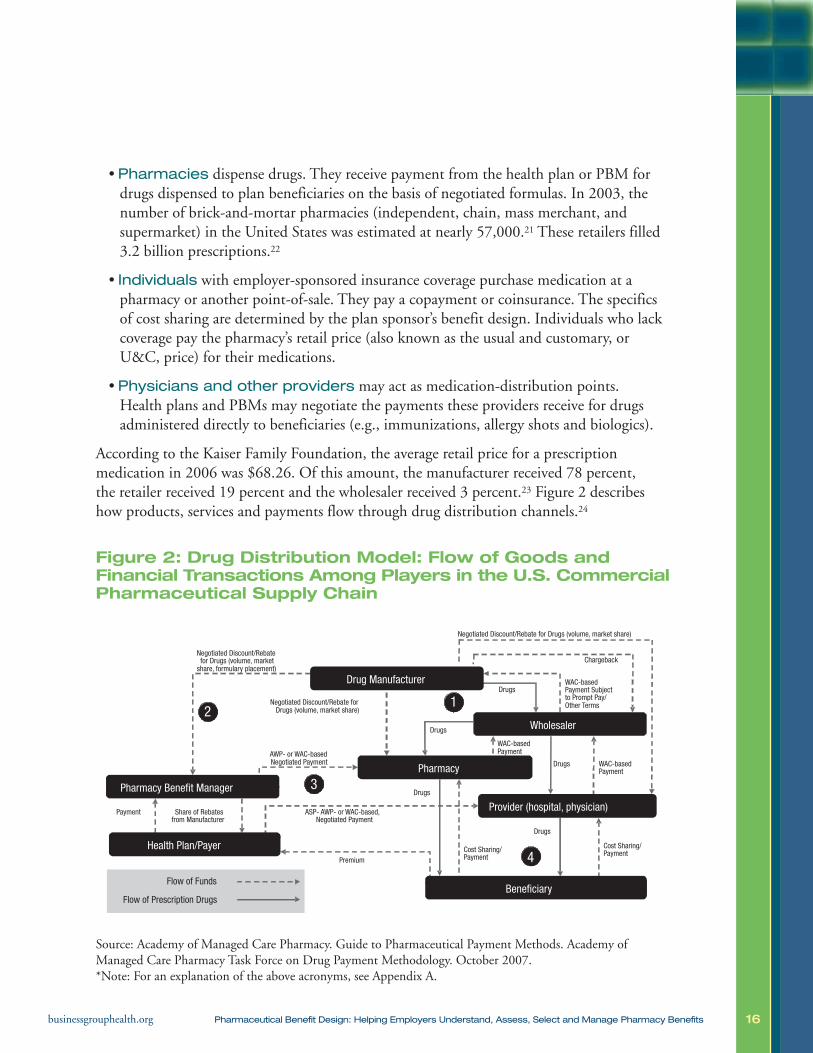
According to the Kaiser Family Foundation, the average retail price for a prescriptionmedication in 2006 was $68.26. Of this amount, the manufacturer received 78 percent,the retailer received 19 percent and the wholesaler received 3 percent.23 Figure 2 describeshow products, services and payments flow through drug distribution channels.24
Figure 2: Drug Distribution Model: Flow of Goods andFinancial Transactions Among Players in the U.S. CommercialPharmaceutical Supply Chain
Source: Academy of Managed Care Pharmacy. Guide to Pharmaceutical Payment Methods. Academy ofManaged Care Pharmacy Task Force on Drug Payment Methodology. October 2007.*Note: For an explanation of the above acronyms, see Appendix A.
17businessgrouphealth.org Pharmaceutical Benefit Design: Helping Employers Understand, Assess, Select and Manage Pharmacy Benefits
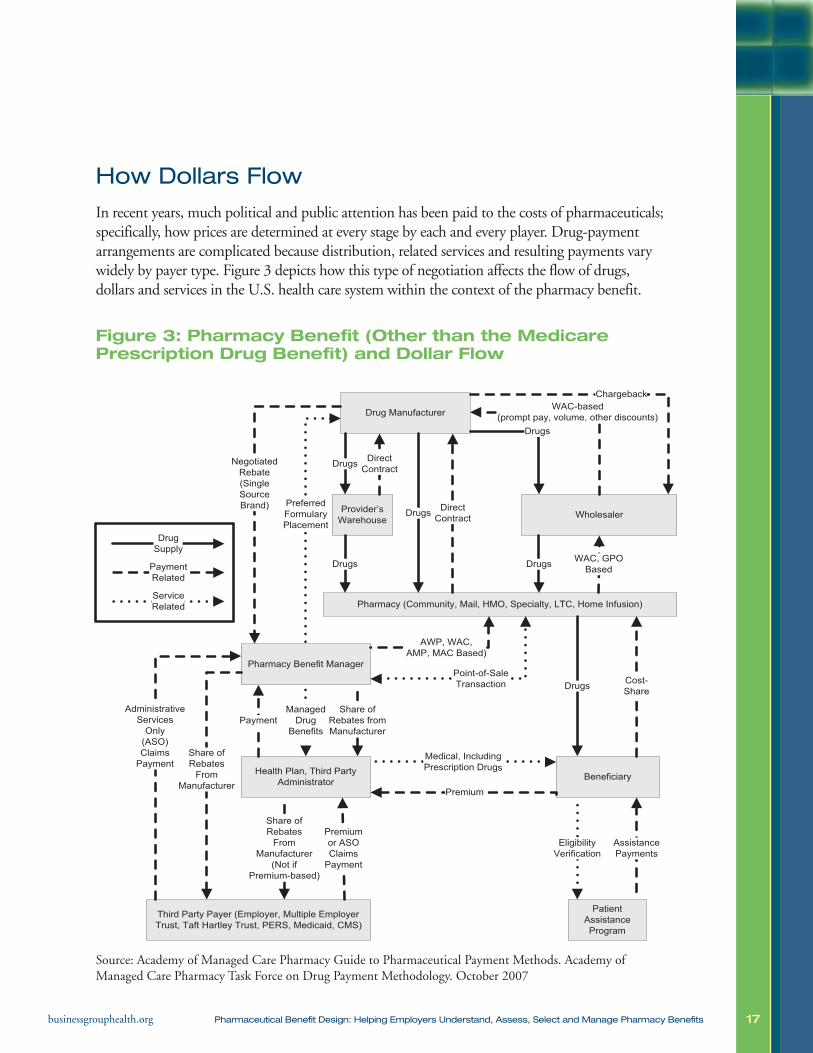
How Dollars Flow
In recent years, much political and public attention has been paid to the costs of pharmaceuticals;specifically, how prices are determined at every stage by each and every player. Drug-paymentarrangements are complicated because distribution, related services and resulting payments varywidely by payer type. Figure 3 depicts how this type of negotiation affects the flow of drugs,dollars and services in the U.S. health care system within the context of the pharmacy benefit.
Figure 3: Pharmacy Benefit (Other than the MedicarePrescription Drug Benefit) and Dollar Flow
Source: Academy of Managed Care Pharmacy Guide to Pharmaceutical Payment Methods. Academy ofManaged Care Pharmacy Task Force on Drug Payment Methodology. October 2007
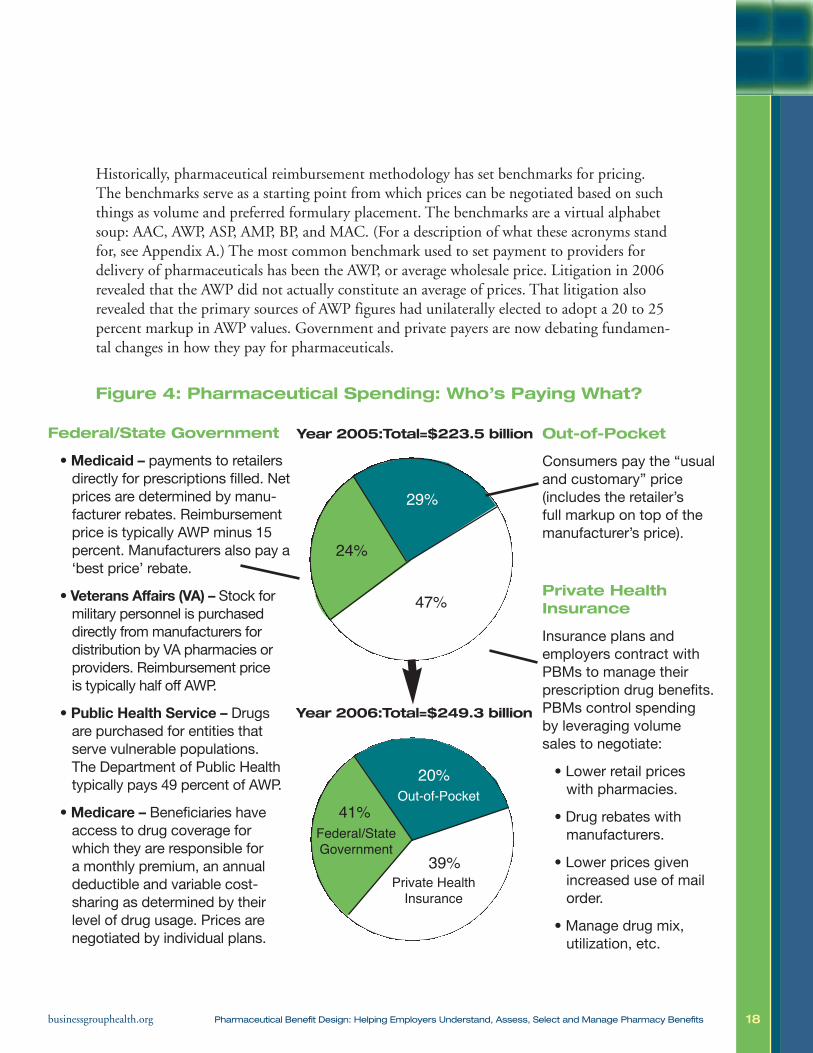
Historically, pharmaceutical reimbursement methodology has set benchmarks for pricing.The benchmarks serve as a starting point from which prices can be negotiated based on suchthings as volume and preferred formulary placement. The benchmarks are a virtual alphabetsoup: AAC, AWP, ASP, AMP, BP, and MAC. (For a description of what these acronyms standfor, see Appendix A.) The most common benchmark used to set payment to providers fordelivery of pharmaceuticals has been the AWP, or average wholesale price. Litigation in 2006revealed that the AWP did not actually constitute an average of prices. That litigation alsorevealed that the primary sources of AWP figures had unilaterally elected to adopt a 20 to 25percent markup in AWP values. Government and private payers are now debating fundamen-tal changes in how they pay for pharmaceuticals.
Figure 4: Pharmaceutical Spending: Who’s Paying What?
18businessgrouphealth.org Pharmaceutical Benefit Design: Helping Employers Understand, Assess, Select and Manage Pharmacy Benefits
Out-of-Pocket
Consumers pay the “usualand customary” price(includes the retailer’sfull markup on top of themanufacturer’s price).
Private HealthInsurance
Insurance plans andemployers contract withPBMs to manage theirprescription drug benefits.PBMs control spendingby leveraging volumesales to negotiate:
• Lower retail priceswith pharmacies.
• Drug rebates withmanufacturers.
• Lower prices givenincreased use of mailorder.
• Manage drug mix,utilization, etc.
Federal/State Government
•Medicaid – payments to retailersdirectly for prescriptions filled. Netprices are determined by manu-facturer rebates. Reimbursementprice is typically AWP minus 15percent. Manufacturers also pay a‘best price’ rebate.
• Veterans Affairs (VA) – Stock formilitary personnel is purchaseddirectly from manufacturers fordistribution by VA pharmacies orproviders. Reimbursement priceis typically half off AWP.
• Public Health Service – Drugsare purchased for entities thatserve vulnerable populations.The Department of Public Healthtypically pays 49 percent of AWP.
•Medicare – Beneficiaries haveaccess to drug coverage forwhich they are responsible fora monthly premium, an annualdeductible and variable cost-sharing as determined by theirlevel of drug usage. Prices arenegotiated by individual plans.
29%
47%
24%
Year 2005:Total=$223.5 billion
Year 2006:Total=$249.3 billion
39%
41%
20%Out-of-Pocket
Private HealthInsurance
Federal/StateGovernment
19businessgrouphealth.org Pharmaceutical Benefit Design: Helping Employers Understand, Assess, Select and Manage Pharmacy Benefits
V. PHARMACEUTICAL BENEFITDESIGN TODAY
Nearly all covered employees (98 percent) in employer-sponsored plans have prescription drugcoverage.20 There are two ways by which an employer can administer the pharmaceuticalbenefit: the employer can include it in the medical benefit (carve in) or administer it separately(carve out) from the medical benefit. Carving in the benefit delegates the responsibility for allcompany-related health care spending, including pharmaceuticals, to the employer’s health plan.Employers that choose to carve out their pharmacy benefit separate pharmaceutical plan designand spending from other components of health plan design and spending. Pharmacy spendingis managed separately by in-house company personnel, a PBM or both. There are two typesof carve-outs: of design (i.e., different cost sharing than found in the medical plan); and ofadministration (i.e., the pharmacy benefit is administered by a different vendor than the medicalplan). Managing the pharmaceutical benefit involves determining what pharmaceuticals arecovered, at what price, and by whom, and adopting tools to accomplish the goals of the benefit.
There is an association between the size of a company and whether or not it chooses to carvein or out its pharmacy benefit. The larger a company is, the more likely it is to carve out itspharmacy benefit.25 About 60 percent of companies with 5,000 or more employees and 78percent of companies with more than 19,000 employees carve out their pharmaceutical benefit.26
An employer’s decision on whether to carve in or carve out a pharmaceutical benefit isusually determined by two factors:
1.Which arrangement the company believes will offer the greater leverage in terms ofnegotiating pharmaceutical prices; and
2.What the company is able to manage given its size, budget and employee resources.
Companies that carve in their pharmaceutical benefits lump their benefit costs into a largerisk pool in which medical and pharmacy benefits are combined. Companies that carve outtheir pharmaceutical benefits believe that they will achieve greater value by managing thepharmaceutical benefit separately.
This report is for National Business Group on Health members. It should not be reproduced or quoted with permission fromthe National Business Group on Health.
20businessgrouphealth.org Pharmaceutical Benefit Design: Helping Employers Understand, Assess, Select and Manage Pharmacy Benefits
Managing the Benefit
For an employer, the best way to control pharmaceutical costs is to make appropriatedecisions about the design of the pharmacy benefit plan. Through the plan’s design, theemployer can influence pharmaceutical utilization and associated costs.
Employers can use benefit design to enhance cost- and quality-management efforts. Pharma-ceutical benefit design has evolved over time to incorporate various cost-sharing mechanisms(e.g., copayments, coinsurance and deductibles), along with utilization management pro-grams, as a means to affect drug usage.
The degree of cost sharing can influence medication usage. Closed or highly restrictiveformularies cover only certain drugs or drug classes, thereby discouraging use of other drugs.If an enrollee uses a non-formulary drug, its entire cost, or a significant portion thereof,would fall to that individual. Following widespread expressions of beneficiary dissatisfaction,and as part of the movement away from managed care to PPOs, closed or highly restrictiveformularies have become less common than they were a few years ago.
Today, the average four-person family covered by a standard employer-sponsored preferredprovider organization (PPO) generates $2,081 in pharmaceutical costs a year, includingapproximately $510 in cost sharing (i.e., personal, out-of-pocket costs). In other words,enrollee out-of-pocket costs represent about 25 percent of total drug expenditures.27
The most common benefit design integrates copayments or coinsurance (i.e., cost sharing)with designated minimums and maximums. This design may incorporate “tiering” to providefurther incentives for prudent drug usage. In 2007, 91 percent of covered workers had somesort of tiered cost-sharing formula for prescription drugs.20 Under such arrangements,enrollees are responsible for a copayment or coinsurance, the magnitude of which dependson the tier to which a particular drug is assigned. Cost-sharing provisions are intended toencourage participants to choose more cost-effective therapies.
A tiered benefit design may have two, three, four or more levels of cost sharing; the three-tiered design is most common. In 2007, 75 percent of all covered workers were enrolled ina three- or four-tiered pharmaceutical benefit plan in which:20
• Generic drugs required the lowest level of cost sharing. These are drugs whose patent lifehas run out and are manufactured and distributed by multiple drug companies.
• Formulary or preferred drugs, typically brand-name drugs whose prices have beenlowered as the result of manufacturers’ rebates or PBM negotiation, required mid-levelcost sharing.
21businessgrouphealth.org Pharmaceutical Benefit Design: Helping Employers Understand, Assess, Select and Manage Pharmacy Benefits
• Non-formulary, brand-name medications required the second-highest level of cost sharing.
• The highest level of cost sharing was associated with fourth-tier drugs, which includelifestyle drugs and biologics. As noted, not all employers offer a fourth tier, althoughvirtually all large employers do cover biologics.
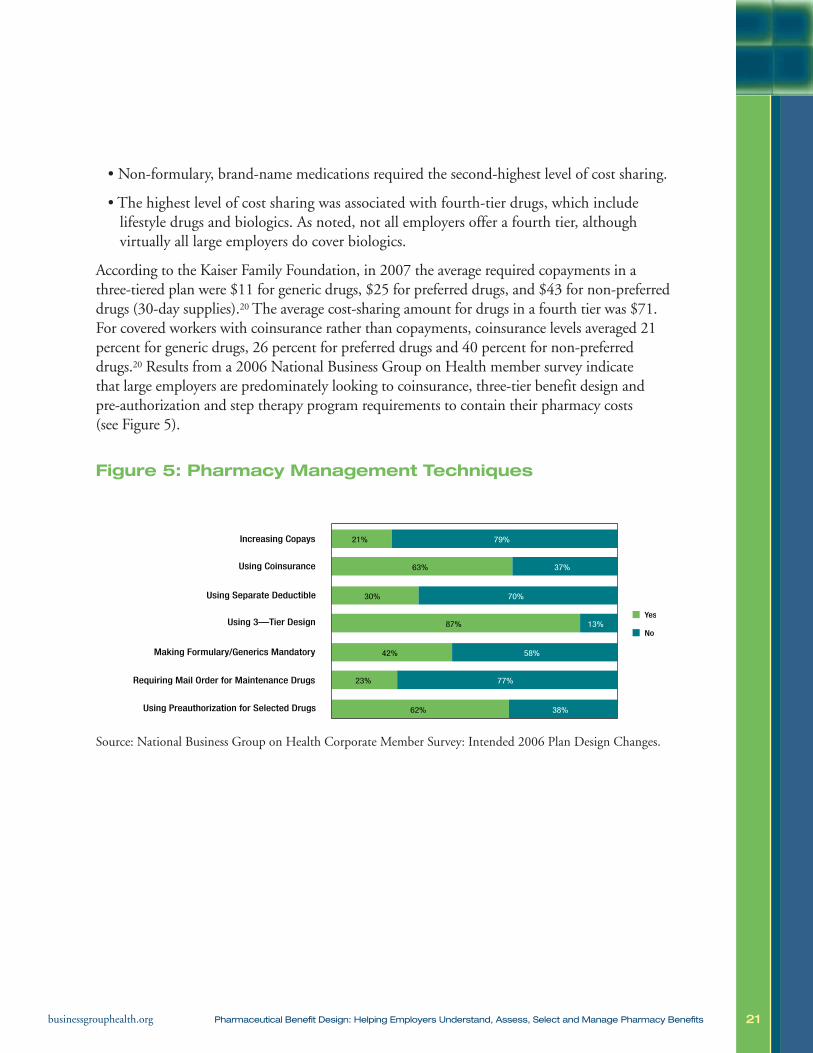
According to the Kaiser Family Foundation, in 2007 the average required copayments in athree-tiered plan were $11 for generic drugs, $25 for preferred drugs, and $43 for non-preferreddrugs (30-day supplies).20 The average cost-sharing amount for drugs in a fourth tier was $71.For covered workers with coinsurance rather than copayments, coinsurance levels averaged 21percent for generic drugs, 26 percent for preferred drugs and 40 percent for non-preferreddrugs.20 Results from a 2006 National Business Group on Health member survey indicatethat large employers are predominately looking to coinsurance, three-tier benefit design andpre-authorization and step therapy program requirements to contain their pharmacy costs(see Figure 5).
Figure 5: Pharmacy Management Techniques
Source: National Business Group on Health Corporate Member Survey: Intended 2006 Plan Design Changes.
21%
63%
30%
87%
42%
23%
62%
79%
37%
70%
13%
58%
77%
38%
Increasing Copays
Using Coinsurance
Using Separate Deductible
Using 3—Tier Design
Making Formulary/Generics Mandatory
Requiring Mail Order for Maintenance Drugs
Using Preauthorization for Selected Drugs
Yes
No

22businessgrouphealth.org Pharmaceutical Benefit Design: Helping Employers Understand, Assess, Select and Manage Pharmacy Benefits
Chart 2: Average Copayment Amounts Among CoveredWorkers Facing Prescription Drug Copayments
Source: Kaiser/HRET Survey of Employer-Sponsored Health Benefits, 2000-2007.
Employer Pharmacy Benefit Design
Employers pay significantly more for their prescription drug plans today than they did 10 yearsago. Not surprisingly, they approach designing their pharmacy benefit with increasing awarenessabout the types of drugs on the market, Food and Drug Administration-approved uses, possiblegeneric substitutions or equivalents, manufacturers and potentialrebates. To maximize the value of pharmacy benefits programs,employees must purchase their medications at the lowest possible pricewithout compromising clinical outcomes. This is the balancing actthat benefit design must manage.
There are significant gaps in what is known about the comparativeeffectiveness of various drug classes and other treatment types,making it difficult to use effectiveness as the sole criterion to guidepharmaceutical benefit decision making.
Despite having taken well-reasoned approaches to pharmaceuticalcoverage, employers are finding that strong benefit design is notsufficient to prevent cost increases. They must utilize the fullspectrum of pharmacy benefit management strategies to managespending (see Chart 3).
Among Covered Workers with Three or Four-Tier Prescription Drug Cost Sharing, Average Copayments, 2000-2007
$0
2001
2000 2002
2003 2005
2004 2006
2007
$8 $8 $9
* Estimate is statistically different from estimate for the previous year shown (p<05).— Fourth-tier drug copayment information was not obtained prior to 2004.
$9 $10 $10 $11 $11$16$15
$18$20 $22 $23
$25 $25$29 $28
$32$35
$38$40
$43 $43
$59
$74
$59
$71*
$10
$20
$30
$40
$50
$60
$70
$80
GENERIC PREFERRED NONPREFERRED FOURTH-TIER
Policy Issue: TheBusiness Groupstrongly supportscomparativeeffectivenessresearch.In order to reachits full potential,comparativeeffectivenessresearch requiressubstantialinvestment,scientific integrity,transparency andaccountability.
23businessgrouphealth.org Pharmaceutical Benefit Design: Helping Employers Understand, Assess, Select and Manage Pharmacy Benefits
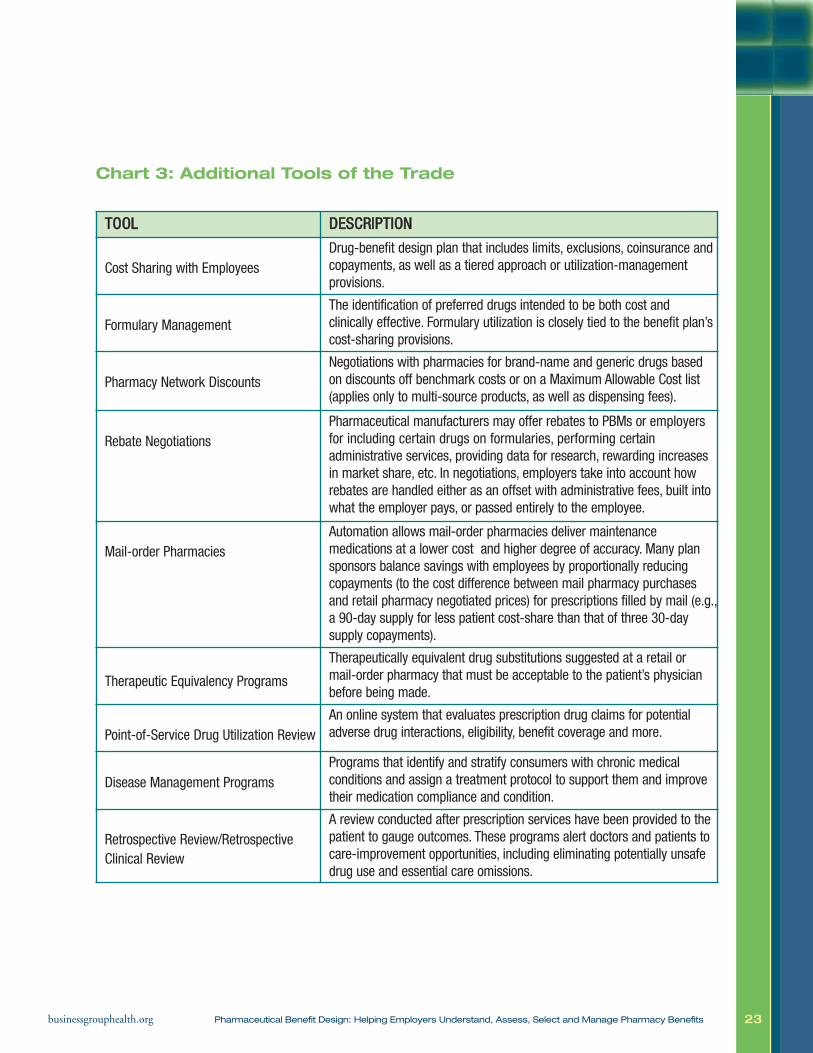
Chart 3: Additional Tools of the Trade
TTOOOOLL DDEESSCCRRIIPPTTIIOONN
Cost Sharing with EmployeesDrug-benefit design plan that includes limits, exclusions, coinsurance andcopayments, as well as a tiered approach or utilization-managementprovisions.
Formulary ManagementThe identification of preferred drugs intended to be both cost andclinically effective. Formulary utilization is closely tied to the benefit plan’scost-sharing provisions.
Pharmacy Network DiscountsNegotiations with pharmacies for brand-name and generic drugs basedon discounts off benchmark costs or on a Maximum Allowable Cost list(applies only to multi-source products, as well as dispensing fees).
Rebate NegotiationsPharmaceutical manufacturers may offer rebates to PBMs or employersfor including certain drugs on formularies, performing certainadministrative services, providing data for research, rewarding increasesin market share, etc. In negotiations, employers take into account howrebates are handled either as an offset with administrative fees, built intowhat the employer pays, or passed entirely to the employee.
Mail-order PharmaciesAutomation allows mail-order pharmacies deliver maintenancemedications at a lower cost and higher degree of accuracy. Many plansponsors balance savings with employees by proportionally reducingcopayments (to the cost difference between mail pharmacy purchasesand retail pharmacy negotiated prices) for prescriptions filled by mail (e.g.,a 90-day supply for less patient cost-share than that of three 30-daysupply copayments).
Therapeutic Equivalency Programs
Therapeutically equivalent drug substitutions suggested at a retail or mail-order pharmacy that must be acceptable to the patient’s physicianbefore being made.
Point-of-Service Drug Utilization ReviewAn online system that evaluates prescription drug claims for potentialadverse drug interactions, eligibility, benefit coverage and more.
Disease Management ProgramsPrograms that identify and stratify consumers with chronic medicalconditions and assign a treatment protocol to support them and improvetheir medication compliance and condition.
Retrospective Review/RetrospectiveClinical Review
A review conducted after prescription services have been provided to thepatient to gauge outcomes. These programs alert doctors and patients tocare-improvement opportunities, including eliminating potentially unsafedrug use and essential care omissions.
24businessgrouphealth.org Pharmaceutical Benefit Design: Helping Employers Understand, Assess, Select and Manage Pharmacy Benefits
VI. THE ROLE OF THE EMPLOYER ASPHARMACEUTICAL BENEFIT PURCHASER
Creating effective pharmaceutical benefits requires establishing the pharmaceutical benefit inthe context of the employer’s overall corporate health care strategy. To do so, employers needto define intentions and constraints, scrutinize how the benefit is ultimately used and be will-ing to change the benefit as necessary to meet identified objectives. An employer who wantsto design a strong pharmacy benefit program should take the following three steps:
Step One:Identify corporate pharmaceutical objectives.
• What do we hope to accomplish with our pharmaceutical benefit?
• How will we measure success?
– By trends in pharmaceutical costs?
– By the overall costs of medical claims?
– By employee productivity?
– By employee satisfaction?
• What are our employees’ health care needs?
• What are we trying to accomplish in terms of employee healthin the long and short terms?
• What are our constraints in terms of budget? Employee demo-graphics? Senior management support?
• Have we set measurable and reasonable goals for the following:
– Outcomes;
– Process;
– Quality;
– Accessibility;
– Efficiency;
– Member satisfaction; and
– Convenience?
• Do we understand how altering our benefit design will alter usage patterns?
This report is for National Business Group on Health members. It should not be reproduced or quoted with permission from the National Business Group on Health.
Ask the following:Has the companyplaced enough emphasis on lifestylechanges so thatpharmaceuticals do not become necessary? Doesthe company have a comprehensivehealth improvementstrategy that wouldreduce the need forprescription drugsor other medical interventions?
25businessgrouphealth.org Pharmaceutical Benefit Design: Helping Employers Understand, Assess, Select and Manage Pharmacy Benefits
Step Two:Make sure your employees can are usingthe benefit appropriately and effectively.Paying attention to the following issues can help achieve this goal:
• Minimize risk and unsafe medication usage. Look to your PBM for strategies.
• Determine what medications are over-utilized, under-utilized or inappropriately utilized:
– Determine whether the incentives inherent in your benefit structure are having theirintended consequence, namely, encouraging the necessary use of pharmaceuticals,discouraging their wasteful use, and analyzing the impact of the medical plan;
– Consider providing incentives for adherence through benefit design; and
– Consider integrating laboratory data with pharmacy data to measure results.
• Manage employee expectations. What can the employee reasonably expect from the pharmaceutical benefit?
• Align the pharmaceutical benefit to your disease management, case management programs, and medical benefit.
• Match your benefit to accepted practice guidelines.
Step Three:Remain informed. Continually re-evaluate. • Sort through the available information. Look to your resources (e.g., your PBM, drugmanufacturers and the Business Group) for information. Leverage all resources to theirmaximum.
• Use your data to make informed decisions. For example:
– Integrate all your data (e.g., direct medical, prescription drugs, short-term disability,long-term disability); and
– Look for indicators of systemic errors in utilization.
26businessgrouphealth.org Pharmaceutical Benefit Design: Helping Employers Understand, Assess, Select and Manage Pharmacy Benefits
Role of the Pharmacy Benefit Manager (PBM)
Most employers do not administer their own pharmacy benefit. Because these programs arecomplex, they hire a health plan or PBM to provide this service. Today, over 95 percent of consumers with pharmaceutical drug benefits receive them through various types of PBMs,including health plan PBMs.28 Most large employers contract with PBMs to do the following:
1. Help the payer design an optimal benefit structure;
2. Adjudicate employee and dependent pharmacy claims in accordance with the cost-sharing provisions of the benefit plan;
3. Assist employees in making prudent drug selections by encouraging the use of generic orless-expensive brand-name products that are therapeutically equivalent;
4. Negotiate discounts or rebates for brand-name and generic drugs with manufacturers,wholesalers and dispensing pharmacies;
5. Provide mail-order dispensing alternatives for maintenance medications;
6. Negotiate dispensing fee discounts with pharmacies;
7. Promote patient safety by encouraging the use of comprehensive medication profiles acrossphysicians and dispensing pharmacies, influencing potentially inappropriate drug use; and
8. Assist in overall strategic planning.
Each PBM has its own relationship with distributors, manufacturers and retailers. This relationship influences which drugs are covered, at what price and by which dispensing channel. Employers must select a PBM that can best meet their objectives for cost management,access and quality of care. PBMs are the primary tool that third-party payers can use to contain costs.29
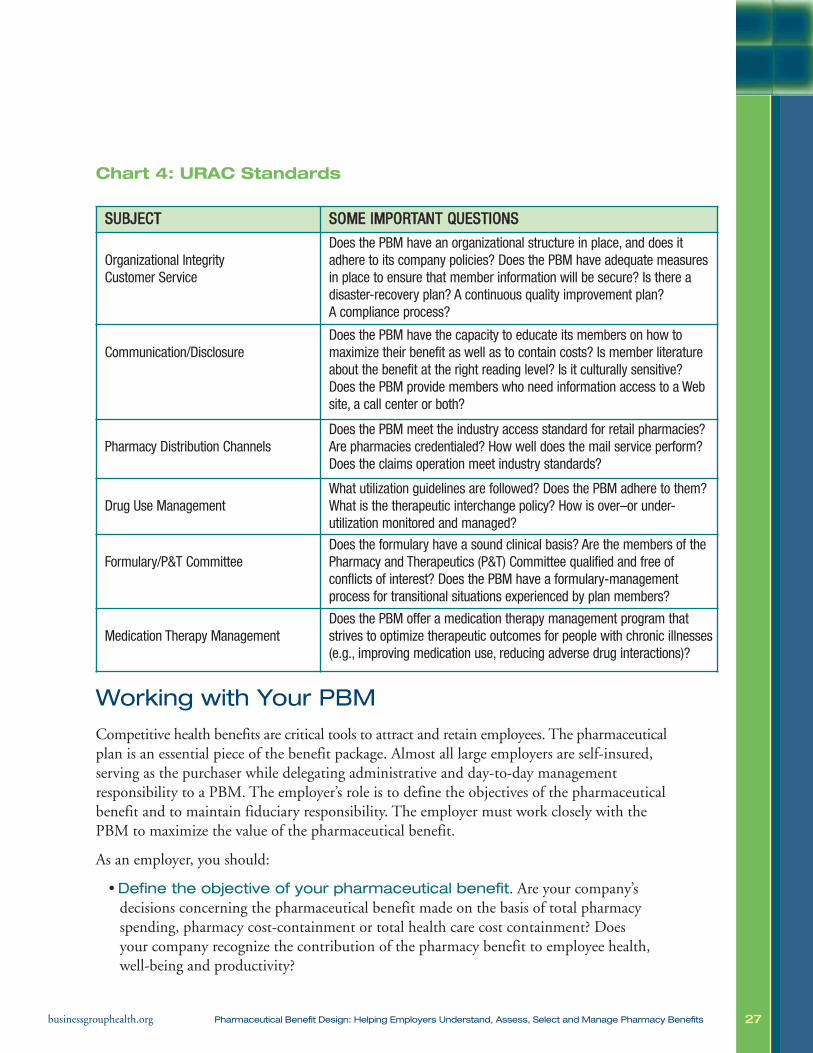
To support continuous quality improvement in the pharmaceutical system, nationwide standards are emerging for pharmacy benefit quality management. URAC, a not-for-profitorganization that promotes continuous improvement in the quality and efficiency of healthcare management through processes of accreditation, education and measurement, offers anaccreditation program for monitoring the safety, effectiveness and service quality of PBMs.Industry standards provide operational and quality standards for pharmacy benefit managementprograms, helping purchasers make more-informed decisions about their programs. For specific information on URAC standards, see Chart 4. URAC’s PBM accreditation launchedin 2007. Most large PBMs are already URAC accredited.
27businessgrouphealth.org Pharmaceutical Benefit Design: Helping Employers Understand, Assess, Select and Manage Pharmacy Benefits
Chart 4: URAC Standards
Working with Your PBM
Competitive health benefits are critical tools to attract and retain employees. The pharmaceuticalplan is an essential piece of the benefit package. Almost all large employers are self-insured,serving as the purchaser while delegating administrative and day-to-day management responsibility to a PBM. The employer’s role is to define the objectives of the pharmaceuticalbenefit and to maintain fiduciary responsibility. The employer must work closely with thePBM to maximize the value of the pharmaceutical benefit.
As an employer, you should:
• Define the objective of your pharmaceutical benefit. Are your company’sdecisions concerning the pharmaceutical benefit made on the basis of total pharmacyspending, pharmacy cost-containment or total health care cost containment? Does your company recognize the contribution of the pharmacy benefit to employee health,well-being and productivity?
SSUUBBJJEECCTT SSOOMMEE IIMMPPOORRTTAANNTT QQUUEESSTTIIOONNSS
Organizational Integrity Customer Service
Does the PBM have an organizational structure in place, and does itadhere to its company policies? Does the PBM have adequate measuresin place to ensure that member information will be secure? Is there adisaster-recovery plan? A continuous quality improvement plan? A compliance process?
Communication/Disclosure Does the PBM have the capacity to educate its members on how tomaximize their benefit as well as to contain costs? Is member literatureabout the benefit at the right reading level? Is it culturally sensitive? Does the PBM provide members who need information access to a Website, a call center or both?
Pharmacy Distribution ChannelsDoes the PBM meet the industry access standard for retail pharmacies?Are pharmacies credentialed? How well does the mail service perform?Does the claims operation meet industry standards?
Drug Use ManagementWhat utilization guidelines are followed? Does the PBM adhere to them?What is the therapeutic interchange policy? How is over–or under-utilization monitored and managed?
Formulary/P&T CommitteeDoes the formulary have a sound clinical basis? Are the members of the Pharmacy and Therapeutics (P&T) Committee qualified and free ofconflicts of interest? Does the PBM have a formulary-managementprocess for transitional situations experienced by plan members?
Medication Therapy ManagementDoes the PBM offer a medication therapy management program thatstrives to optimize therapeutic outcomes for people with chronic illnesses(e.g., improving medication use, reducing adverse drug interactions)?
28businessgrouphealth.org Pharmaceutical Benefit Design: Helping Employers Understand, Assess, Select and Manage Pharmacy Benefits
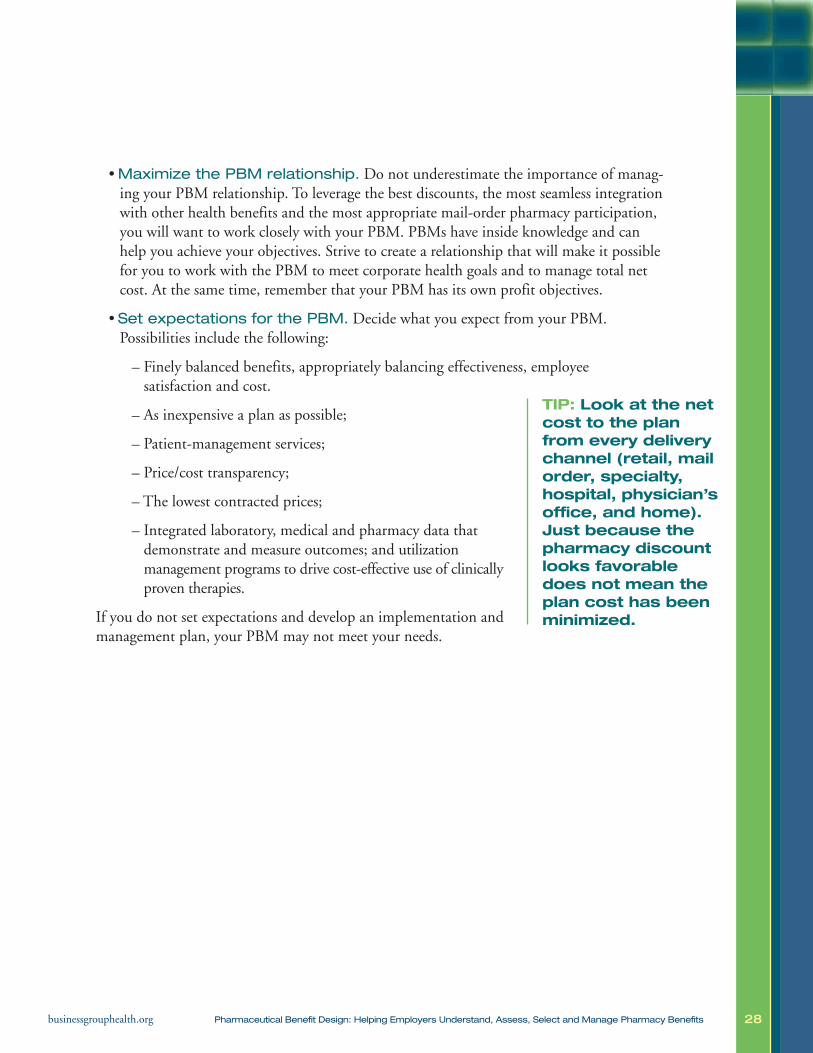
• Maximize the PBM relationship. Do not underestimate the importance of manag-ing your PBM relationship. To leverage the best discounts, the most seamless integrationwith other health benefits and the most appropriate mail-order pharmacy participation,you will want to work closely with your PBM. PBMs have inside knowledge and canhelp you achieve your objectives. Strive to create a relationship that will make it possiblefor you to work with the PBM to meet corporate health goals and to manage total netcost. At the same time, remember that your PBM has its own profit objectives.
• Set expectations for the PBM. Decide what you expect from your PBM. Possibilities include the following:
– Finely balanced benefits, appropriately balancing effectiveness, employee satisfaction and cost.
– As inexpensive a plan as possible;
– Patient-management services;
– Price/cost transparency;
– The lowest contracted prices;
– Integrated laboratory, medical and pharmacy data thatdemonstrate and measure outcomes; and utilization management programs to drive cost-effective use of clinicallyproven therapies.
If you do not set expectations and develop an implementation andmanagement plan, your PBM may not meet your needs.
TIP: Look at the netcost to the planfrom every deliverychannel (retail, mailorder, specialty,hospital, physician’soffice, and home).Just because the pharmacy discountlooks favorabledoes not mean theplan cost has beenminimized.

29businessgrouphealth.org Pharmaceutical Benefit Design: Helping Employers Understand, Assess, Select and Manage Pharmacy Benefits
Questions to Ask a PBM
1. How are generic and multi-source drugs priced? What are the differences in pricing forretail and mail-order products? How effective is the PBM at driving to the lowest-costdrugs and delivery channel?
2. What is included in the basic prior-authorization process? How much more will it cost ifan intervention is required?
• What does the prior-authorization process look like from the perspectives of thepatient and the physician?
• Does the PBM offer “grandfather” clauses that may determine a beneficiary’s access tomedications? Does the PBM have any recommendations for managing these clauses?
3. What is the size of the PBM’s retail network? Will employers have access to pharmacieswithin two miles? Five miles? Ten miles or more? Conduct a disruption analysis.
4. How are your pharmaceutical claims adjudicated at all pointsof sale? To fully understand the adjudication process, ask thefollowing:
• How is the cost to the patient determined at point of sale?
• How are claim costs charged back to the employer for retailand mail products?
• What happens when the cost of a claim is less than that ofthe copayment? Is there a minimum copayment, or is theminimum charge the cost of the claim? Does this vary for mail-order versus retailproducts?
• Based on which of the following does the PBM adjudicate claims:
– At the lower of some guarantee discount off of brand or generic;
– Usual and Customary (average retail price); or
– Maximum Allowable Cost (MAC) list (“MAC” refers to the highest unit price that will be paid for a drug. For a more detailed definition of MAC, see Appendix A.)
• At the lower price point of two, of the above three, or lowest of all three.
– What MAC list(s) does the PBM use, and under what circumstances? Is thesame MAC list used for all price guarantees? Is the same MAC list used for bothretail and mail-order pharmacies as well as for charging the plan sponsor?
TIP: There may ormay not be value toshrinking the retailnetwork. Considerthe impact of reducing the retailnetwork on accessas well as on cost.
30businessgrouphealth.org Pharmaceutical Benefit Design: Helping Employers Understand, Assess, Select and Manage Pharmacy Benefits
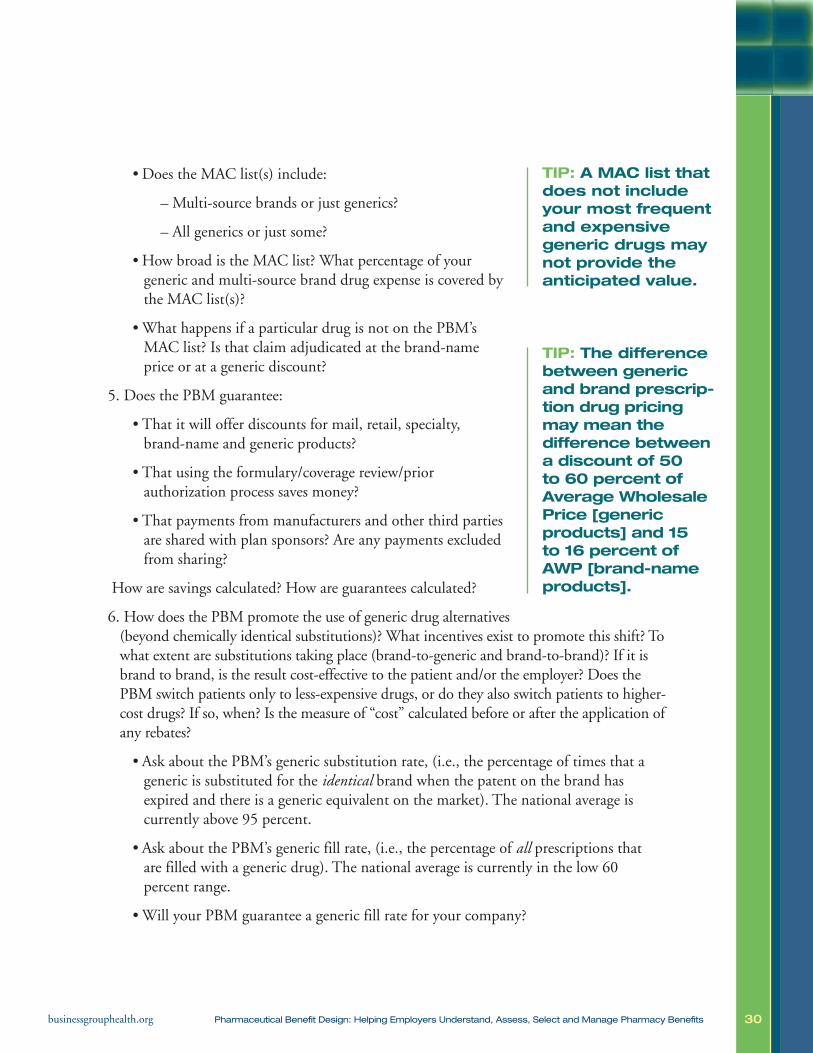
• Does the MAC list(s) include:
– Multi-source brands or just generics?
– All generics or just some?
• How broad is the MAC list? What percentage of your generic and multi-source brand drug expense is covered bythe MAC list(s)?
• What happens if a particular drug is not on the PBM’sMAC list? Is that claim adjudicated at the brand-nameprice or at a generic discount?
5. Does the PBM guarantee:
• That it will offer discounts for mail, retail, specialty, brand-name and generic products?
• That using the formulary/coverage review/prior authorization process saves money?
• That payments from manufacturers and other third partiesare shared with plan sponsors? Are any payments excludedfrom sharing?
How are savings calculated? How are guarantees calculated?
6. How does the PBM promote the use of generic drug alternatives(beyond chemically identical substitutions)? What incentives exist to promote this shift? Towhat extent are substitutions taking place (brand-to-generic and brand-to-brand)? If it isbrand to brand, is the result cost-effective to the patient and/or the employer? Does thePBM switch patients only to less-expensive drugs, or do they also switch patients to higher-cost drugs? If so, when? Is the measure of “cost” calculated before or after the application ofany rebates?
• Ask about the PBM’s generic substitution rate, (i.e., the percentage of times that ageneric is substituted for the identical brand when the patent on the brand hasexpired and there is a generic equivalent on the market). The national average is currently above 95 percent.
• Ask about the PBM’s generic fill rate, (i.e., the percentage of all prescriptions that are filled with a generic drug). The national average is currently in the low 60 percent range.
• Will your PBM guarantee a generic fill rate for your company?
TIP: A MAC list thatdoes not includeyour most frequentand expensivegeneric drugs maynot provide the anticipated value.
TIP: The differencebetween genericand brand prescrip-tion drug pricingmay mean the difference betweena discount of 50 to 60 percent of Average WholesalePrice [generic products] and 15 to 16 percent ofAWP [brand-nameproducts].
31businessgrouphealth.org Pharmaceutical Benefit Design: Helping Employers Understand, Assess, Select and Manage Pharmacy Benefits
7. Does the PBM’s P&T committee address issues related to racial and ethnic disparities inresponse to drugs?
8. How flexible are formularies and coverage-review processes? Can exceptions be made forpeople who do not respond to prescribed therapy?
9. What member-satisfaction measures (e.g., number of minutes on time on hold) areincluded in the PBM contract?
10. Is the PBM URAC-accredited or attempting to become so?
Hints for Optimizing Cost-Containment and Cost-Effectiveness Goals
1. Run last year’s claims under the terms of the new PBM contract to see how it would affect company drug spending.
2. Ask your PBM to report all third-party payments associated with plan utilization.
3. Consider engaging a pharmacy benefit consultant to audit your contracts if you haveconcerns about PBM reporting.
4. Make sure the PBM’s MAC lists are broad and deep. The MAC is the upper-limit pricethat will be reimbursed for a generic or multi-source drug product. A MAC list outlinesgeneric sequence numbers (GSN) that identify products specific to chemical formula,dosage form, strength and route of administration. GSNs group chemically identicalpharmaceutical products. The MAC list should cover most GSNs, because this wouldmean that most drugs are covered at a discounted price.
5. Ask your PBM what type of compliance reports they will run to measure medicationprescription and adherence rates. If possible, check for the integration of laboratorvalue, diagnosis and medical history to measure patient outcomes and safety.
As reported in various studies by the Pharmaceutical Care Management Association, theGovernment Accountability Office, the Congressional Budget Office and the Federal TradeCommission, as well as private-sector experts such as PricewaterhouseCoopers, the tools andtechniques pioneered by the PBMs typically reduce costs about 25 percent they also helpexpand access, promote quality and improve outcomes.
32businessgrouphealth.org Pharmaceutical Benefit Design: Helping Employers Understand, Assess, Select and Manage Pharmacy Benefits
VII. THE CHALLENGE OF SPECIALTYPHARMACY
Specialty drugs are the fastest-growing segment of the pharmaceutical market (see Figure 6).These sophisticated medications are used to treat complex chronic conditions such asrheumatoid arthritis, hemophilia, cancer, hepatitis C, anemia, cystic fibrosis, human growthdeficiency and other diseases that do not respond well to conventional therapeutic interventions.
There is no industry standard for what constitutes a specialty drug. Therefore, each PBM canestablish its own list of specialty medications. Such products generally include injectable,infused, oral or inhaled agents of biological origin. They require close medical oversight andmore patient support and education than do traditional small-molecule drugs. They can beself- or provider-administered in an outpatient or home setting.24
From a financial perspective, the distinctive feature of a specialty drug is cost. Specialty drugs areexpensive. The Medicare Modernization Act of 2007’s Final Guidance on Formularies reserves thespecialty drug tier for “Part D drugs with plan-negotiated prices that exceed $500 per month.”21
Specialty drugs generally range in cost from $6,000 to $350,000 per year, per patient.24
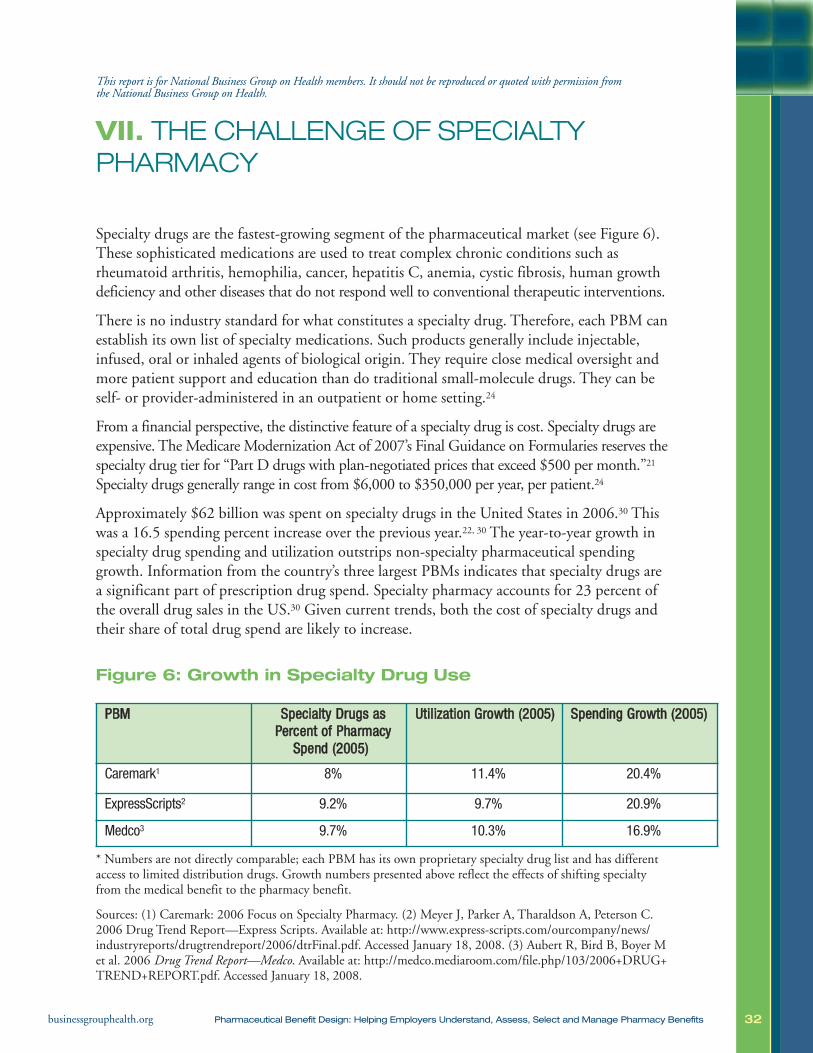
Approximately $62 billion was spent on specialty drugs in the United States in 2006.30 Thiswas a 16.5 spending percent increase over the previous year.22, 30 The year-to-year growth inspecialty drug spending and utilization outstrips non-specialty pharmaceutical spendinggrowth. Information from the country’s three largest PBMs indicates that specialty drugs area significant part of prescription drug spend. Specialty pharmacy accounts for 23 percent ofthe overall drug sales in the US.30 Given current trends, both the cost of specialty drugs andtheir share of total drug spend are likely to increase.
Figure 6: Growth in Specialty Drug Use
* Numbers are not directly comparable; each PBM has its own proprietary specialty drug list and has differentaccess to limited distribution drugs. Growth numbers presented above reflect the effects of shifting specialtyfrom the medical benefit to the pharmacy benefit.
Sources: (1) Caremark: 2006 Focus on Specialty Pharmacy. (2) Meyer J, Parker A, Tharaldson A, Peterson C.2006 Drug Trend Report—Express Scripts. Available at: http://www.express-scripts.com/ourcompany/news/industryreports/drugtrendreport/2006/dtrFinal.pdf. Accessed January 18, 2008. (3) Aubert R, Bird B, Boyer Met al. 2006 Drug Trend Report—Medco. Available at: http://medco.mediaroom.com/file.php/103/2006+DRUG+TREND+REPORT.pdf. Accessed January 18, 2008.
This report is for National Business Group on Health members. It should not be reproduced or quoted with permission from the National Business Group on Health.
PPBBMM SSppeecciiaallttyy DDrruuggss aassPPeerrcceenntt ooff PPhhaarrmmaaccyy
SSppeenndd ((22000055))
UUttiilliizzaattiioonn GGrroowwtthh ((22000055)) SSppeennddiinngg GGrroowwtthh ((22000055))
Caremark1 8% 11.4% 20.4%
ExpressScripts2 9.2% 9.7% 20.9%
Medco3 9.7% 10.3% 16.9%
33businessgrouphealth.org Pharmaceutical Benefit Design: Helping Employers Understand, Assess, Select and Manage Pharmacy Benefits
Two factors drive the continuing increases in specialty drug spending: increased utilization and rising unit costs. Why is specialty drug utilization increasing? There are many reasons. Existing drugs are being approved for new disease indications,treatment patterns have changed (e.g., increased dosing andincreased use of medication for non-FDA approved purposes), new and reformulated products are becoming available, and specialty drugs are being used as first-line therapies. Specialty pharmacy spending is growing at least twice as fast as traditional pharmaceutical spending. This may be the result of AWP price increases; newer, more expensive drugs introduced to the market; and changing market forces involving drug exclusivity.29, 30
Specialty drugs challenge how the United States provides and pays for pharmaceuticals.
1. Specialty drugs do not fit well into traditional benefit designstructures. Because specialty drugs are administered in a variety of settings, adminis-tration of the benefit does not sit comfortably in either the medical or pharmaceuticalplan. These medications are covered under both medical and pharmacy benefit plans, presenting challenges to cost and utilization management for plan sponsors. Historically,injectable medications were administered by a doctor in a hospital or clinic and covered bythe medical benefit. Under this arrangement, a patient was responsible for copayments.Today, some specialty drugs need not be administered in a hospital or clinic. The patientcan access the drug from a physician, a community pharmacy or mail-order company andcan often self-administer it at home.31 This increased flexibility in the delivery mechanismmeans that specialty pharmacy coverage can be moved into the pharmacy benefit.24
Managing specialty drugs within the pharmaceutical benefit allows plan sponsors to costshare with the patient, although given the desperate health needs of the treatment population, some believe that cost sharing will not impact utilization except in the negative (e.g., seriously ill people will not have enough money to pay required cost sharing).24 Cost sharing can be designed to drive beneficiaries toward preferred productsand preferred pharmacies. Given the extremely high cost of these drugs, the very smallproportion of the population that needs them and the lack of alternative therapies,employers need to consider what level of cost sharing is appropriate and how it will fit into existing out-of-pocket limits.
TIP: Determinewhat percentage of your pharmacyclaims are goingthrough the medical plan versus the pharmaceuticalbenefit plan.
34businessgrouphealth.org Pharmaceutical Benefit Design: Helping Employers Understand, Assess, Select and Manage Pharmacy Benefits
2. Specialty drugs are typically tailored to meet the needs ofsmall, defined segments of the population. By offering a variety ofhealth care benefits, employers contribute to improving health of the greatest possiblenumber of employees. Specialty drugs are usually required by only a small percentage ofbeneficiaries (about 1 to 5 percent of all plan users.)24 These specialty drug users consumea significant proportion of total health care resources. Employers can expect specialtydrugs to comprise an even greater share of drug expense in thefuture. Approximately 43 percent (104 products total) of allpharmaceuticals now in late-stage development are specialtydrugs.32 At a time when employers are trying to better definetheir benefit contributions, they will need to manage the veryexpensive specialty pharmacy needs of a few against the generalhealth care needs of many. In this instance, what should beconsidered fair? There is no easy answer to this question.
3. The Food and Drug Administration (FDA)has not established drug review processesfor generic biologic drugs.While new drugs forconditions that affect larger populations (e.g., diabetes, osteoporosis and rheumatoid arthritis) will be introduced incoming years, patents on existing products are expiring. Atpresent, no process exists for authorizing generic alternatives(follow-on biologics) to patented specialty drugs. This presentsa great opportunity to manage long-term financial trends inthe health care industry. Introduction of biogenerics couldresult in a price reduction close to 25 percent.33 According toExpress Scripts’ calculations, the savings opportunity over a 10-year period if generic biologic medications were available in four therapeutic categories of medications (interferons formultiple sclerosis, erythropoietin for anemia, growth hormonefor growth failure and insulin for diabetes) would be approxi-mately $71 billion.33
POLICY ISSUE: TheBusiness Groupsupports legislationgiving the Food andDrug Administration(FDA) the authorityto approve safe, effective, more affordable follow-onbiologics. Congressneeds to empowerthe FDA to issueguidance abouthow it will authorizefollow-on biologics.The two most contentious issuesfor legislation areprotections for innovator manufac-turers (the durationof patent exclusivity)and legislative constraints around the FDA’s authorityto determine an analytic approachto bioequivalence.
35businessgrouphealth.org Pharmaceutical Benefit Design: Helping Employers Understand, Assess, Select and Manage Pharmacy Benefits
How can specialty pharmacy products and services be better managed? The following suggestions merit consideration:
• Decide how to manage specialty pharmacy for your organization in a way that engagesthe health plan, the PBM and/or a specialty pharmacy network.
• Implement all traditional pharmacy management strategies: benefit design, biologic caremanagers, specialized clinical support, prior authorization, formulary management, utilization review and claims review.
• In discussions with your vendors, consider how system incentives for employees andproviders might be changed to encourage more-appropriate use of specialty pharmacy products. Will identifying preferred providers direct patients to physicians of high qualitywho are under contract? Can specialty drugs be obtained more cheaply and more safely byusing mail-order pharmacies? Ultimately, employers need to identify the most cost-effectiveand clinically appropriate distribution and administration channels for specialty drugs.
• Specialty drugs necessitate a sophisticated approach in order to avoid drug toxicities,adverse reactions, treatment failures and drug waste. Because specialty drugs are complexto administer, outcomes should be measured with a focus on individuals, health out-comes, and evidence.
• Support a delivery system that eliminates waste. For example, make every effort to prevent prescriptions from getting lost in the mail. In the case of specialty medicines,where per unit costs are extremely high, secured delivery is essential. Establish processesthat assure that only those who need the medication are provided with it can likewise bevery effective in managing drug spending.
As they pursue the most clinically effective pharmaceutical benefit, employers should be well-informed about a variety of factors that impact how their employees may interact withthe pharmaceutical benefit.
36businessgrouphealth.org Pharmaceutical Benefit Design: Helping Employers Understand, Assess, Select and Manage Pharmacy Benefits
VIII. ADDITIONAL ISSUES IN PHARMACYBENEFIT DESIGN
Appropriate Medication Usage
Research indicates that while a wide variety of medications are available to treat a wide vari-ety of chronic ailments, they are often underused. In other words, many people:
• Have undiagnosed conditions that could be effectively treated with medication;
• Have not been prescribed needed medication; and/or
• Do not take prescribed medications as directed.
The following sections address a variety of issues related to appropriate medication usage.
Adherence
Adherence to a medication regimen may be defined as “the extent to which patients takemedications as prescribed by their health care providers,” which are presumably the correctmedications.34 The term “adherence” is preferable to “compliance” because the latter termsuggests that the patient passively follows doctor’s orders rather than a treatment plan thathas been jointly established by the patient and the physician.
There is no generally accepted standard for what constitutes good medication adherence.34
Researchers have, however, identified six patterns of medication-taking behaviors amongpatients treated for chronic diseases. Among these patients:
• One-sixth achieve near-perfect adherence to a regimen;
• One-sixth take nearly all doses, but with some timing irregularity;
• One-sixth miss an occasional single day’s doses and have some timing inconsistency;
• One-sixth take drug holidays three to four times a year, with occasional omissions of doses;
• One-sixth have a drug holiday at least monthly and omit doses frequently; and
• One-sixth take few or no doses while giving the impression of good adherence.35 36
Adherence to medication regiments does matter. Poor adherence leads to substantial healthdeclines, increased health care costs and even death.37-41 Of all medication-related hospitaladmissions, 33 to 69 percent are due to poor medication adherence. This translates intohealth care costs of approximately $100 billion a year.37, 42-44 A recent study found thatamong patients under age 65 with one of four common chronic conditions, high medicationadherence levels resulted in cost offsets for three conditions (diabetes, hypercholesterolemiaand hypertension) and lower utilization of medical services for all four conditions (diabetes,hypercholesterolemia, hypertension. congestive heart failure) (see Figure 7).
This report is for National Business Group on Health members. It should not be reproduced or quoted with permission from the National Business Group on Health.
37businessgrouphealth.org Pharmaceutical Benefit Design: Helping Employers Understand, Assess, Select and Manage Pharmacy Benefits
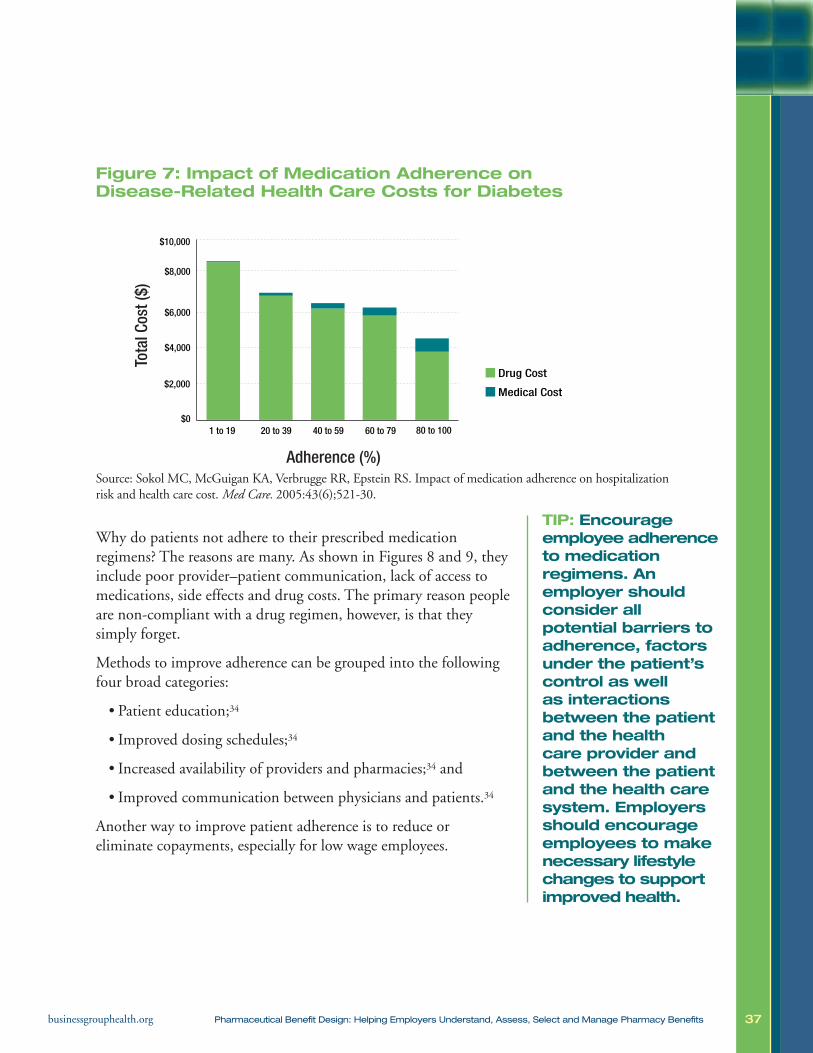
Figure 7: Impact of Medication Adherence on Disease-Related Health Care Costs for Diabetes
Source: Sokol MC, McGuigan KA, Verbrugge RR, Epstein RS. Impact of medication adherence on hospitalizationrisk and health care cost. Med Care. 2005:43(6);521-30.
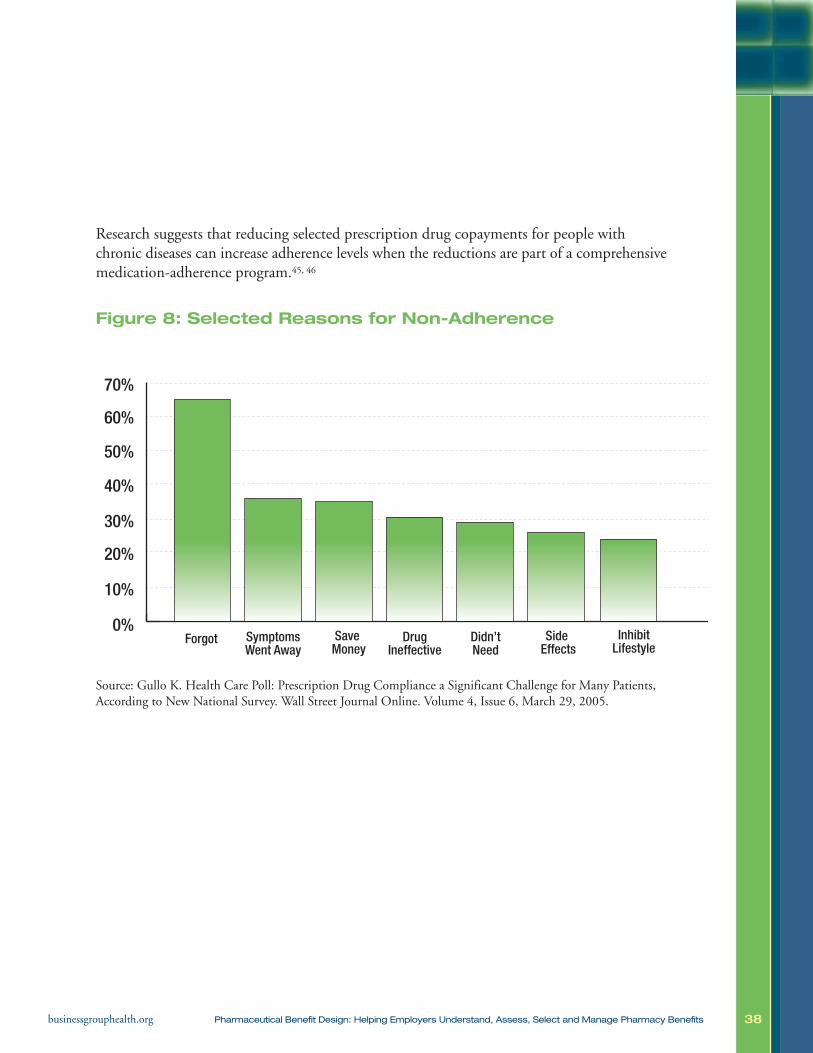
Why do patients not adhere to their prescribed medication regimens? The reasons are many. As shown in Figures 8 and 9, theyinclude poor provider–patient communication, lack of access tomedications, side effects and drug costs. The primary reason peopleare non-compliant with a drug regimen, however, is that they simply forget.
Methods to improve adherence can be grouped into the followingfour broad categories:
• Patient education;34
• Improved dosing schedules;34
• Increased availability of providers and pharmacies;34 and
• Improved communication between physicians and patients.34
Another way to improve patient adherence is to reduce or eliminate copayments, especially for low wage employees.
$0
$2,000
$4,000
$6,000
$8,000
$10,000
1 to 19 20 to 39 40 to 59 60 to 79 80 to 100
Adherence (%)
Drug Cost
Medical Cost
Tota
l Cos
t ($)
TIP: Encourage employee adherenceto medication regimens. An employer should consider all potential barriers toadherence, factorsunder the patient’scontrol as well as interactions between the patientand the health care provider and between the patientand the health caresystem. Employersshould encourageemployees to makenecessary lifestylechanges to supportimproved health.
38businessgrouphealth.org Pharmaceutical Benefit Design: Helping Employers Understand, Assess, Select and Manage Pharmacy Benefits
Research suggests that reducing selected prescription drug copayments for people withchronic diseases can increase adherence levels when the reductions are part of a comprehensivemedication-adherence program.45, 46
Figure 8: Selected Reasons for Non-Adherence
Source: Gullo K. Health Care Poll: Prescription Drug Compliance a Significant Challenge for Many Patients,According to New National Survey. Wall Street Journal Online. Volume 4, Issue 6, March 29, 2005.
0%Forgot Symptoms
Went AwaySave Money
DrugIneffective
Didn’tNeed
Side Effects
InhibitLifestyle
10%
20%
30%
40%
50%
60%
70%
39businessgrouphealth.org Pharmaceutical Benefit Design: Helping Employers Understand, Assess, Select and Manage Pharmacy Benefits
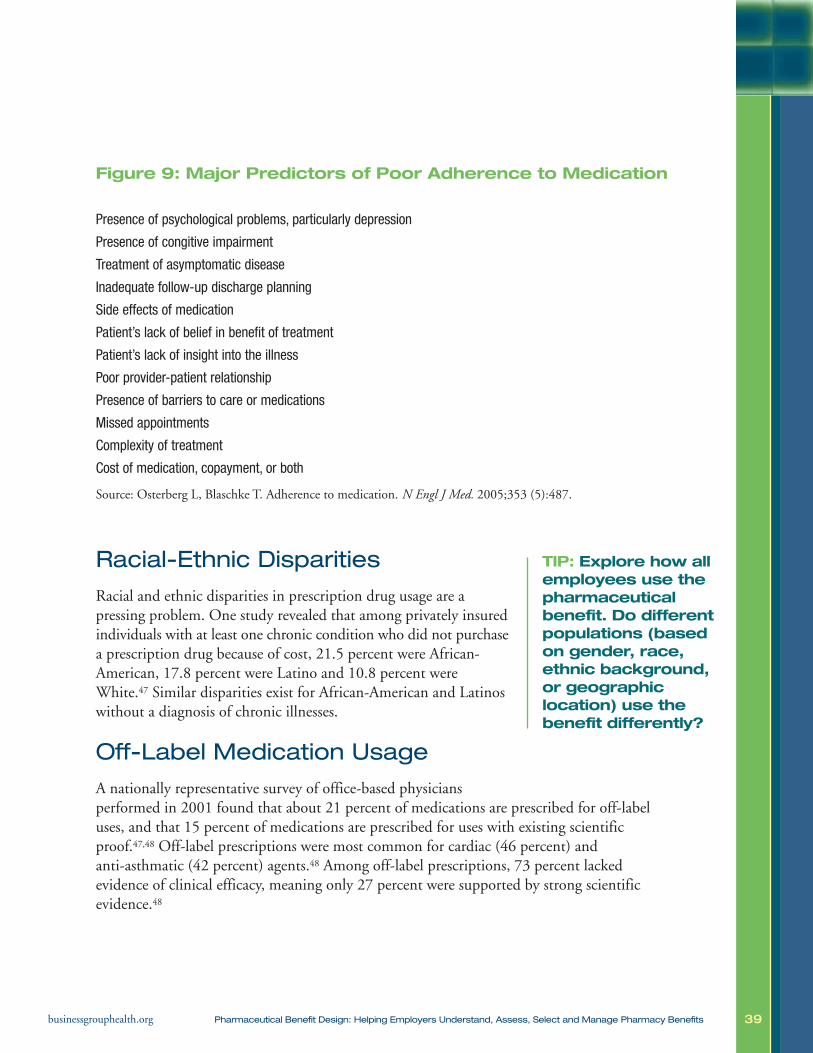
Figure 9: Major Predictors of Poor Adherence to Medication
Presence of psychological problems, particularly depression
Presence of congitive impairment
Treatment of asymptomatic disease
Inadequate follow-up discharge planning
Side effects of medication
Patient’s lack of belief in benefit of treatment
Patient’s lack of insight into the illness
Poor provider-patient relationship
Presence of barriers to care or medications
Missed appointments
Complexity of treatment
Cost of medication, copayment, or both
Source: Osterberg L, Blaschke T. Adherence to medication. N Engl J Med. 2005;353 (5):487.
Racial-Ethnic Disparities
Racial and ethnic disparities in prescription drug usage are a pressing problem. One study revealed that among privately insuredindividuals with at least one chronic condition who did not purchasea prescription drug because of cost, 21.5 percent were African-American, 17.8 percent were Latino and 10.8 percent wereWhite.47 Similar disparities exist for African-American and Latinoswithout a diagnosis of chronic illnesses.
Off-Label Medication Usage
A nationally representative survey of office-based physicians performed in 2001 found that about 21 percent of medications are prescribed for off-labeluses, and that 15 percent of medications are prescribed for uses with existing scientificproof.47,48 Off-label prescriptions were most common for cardiac (46 percent) and anti-asthmatic (42 percent) agents.48 Among off-label prescriptions, 73 percent lacked evidence of clinical efficacy, meaning only 27 percent were supported by strong scientific evidence.48
TIP: Explore how allemployees use thepharmaceuticalbenefit. Do differentpopulations (basedon gender, race,ethnic background,or geographic location) use thebenefit differently?
40businessgrouphealth.org Pharmaceutical Benefit Design: Helping Employers Understand, Assess, Select and Manage Pharmacy Benefits
• The greatest disparity between supported and unsupported off-label prescription occurredamong psychiatric therapies (4 percent strong support vs. 96 percent limited or no support) and allergy therapies (11 percent strong support vs. 89 percent limited or no support).48
• According to an estimate by the National Comprehensive Cancer Network, 50 to 75 percent of all uses of drugs in cancer care are off-label.48
• Depending on the source, off-label usage may or may not be a significant problem. Physicians may legally prescribe an FDA-approved medication for any diagnosis, evenone that is not cited on the drug’s label or in the manufacturer’s application for FDAapproval.
• On the one hand, off-label prescribing can be innovative — it can turn scientific knowledge into innovative clinical practice. It can be considered evidence-based or can reflect basic standards of care. Off-label prescribing is often considered appropriateand medically necessary.49
• On the other hand, under-evaluated, off-label practices can jeopardize patient safety or waste resources.49
Misuse, Abuse, Dependenceand Addiction
According to the 2005 National Survey on Drug Use and Health,the number of Americans reporting abuse of prescription medica-tions was higher than the combined total of those reporting abuse ofcocaine, hallucinogens, inhalants and heroin.50 Approximately 48.7 million Americans age 12 or older, or 20 percent of that population,reported non-medical use of a psychotherapeutic agent at some pointduring their lifetime.50 Of those, approximately 6.4 million Americansage 12 or older (2.6 percent of the population) reported current (pastmonth) use of psychotherapeutic drugs for non-medical purposes.50
According to National Institute on Drug Abuse (NIDA) research,three classes of prescription drugs are most commonly abused: opioids, central nervous system (CNS) depressants and stimulants.51
According to the 2005 National Survey on Drug Use and Health,4.7 million Americans used pain relievers, 1.8 million used tranquilizers and 1.1 million used stimulants (including 512,000using methamphetamines).50
TIP: Leverage yourvendor relationshipsto minimize medica-tion misuse and tosupport treatmentopportunities foraddicted employees.PBMs have extensivesystems in place toidentify medicationmisuse. An employercan use this infor-mation to maximizethe effectiveness of their employeeassistance programand health plan–sponsored addictiontreatment services.
41businessgrouphealth.org Pharmaceutical Benefit Design: Helping Employers Understand, Assess, Select and Manage Pharmacy Benefits
The Drug Abuse Warning Network (DAWN) receives reports of emergency department(ED) episodes involving the non-medical use of legal drugs. During 2005, 598,542 ED visitsinvolved non-medical use of prescription or over-the-counter pharmaceuticals or dietary supplements.52 CNS agents were involved in 305,973 ED visits and psychotherapeutic agentswere involved in 275,430 visits.52
Aging Workforce, Retiree Coverage andMedicare Part D
Employers are facing the medical and pharmaceutical costs of an aging workforce. Theirskilled labor force is aging without a replacement generation to follow. For this reason,employers will be increasingly dependent on the current workforce. This necessitates keepingaging workers healthy and productive. To maximize the health status of employees and retainolder workers, employers may increasingly rely on health care benefits.
Employers also struggle with the financial burden of retiree benefits. Medicare Part D, implemented in January 2006, alters an employer’s responsibility to provide pharmaceuticalbenefits for retirees and employees over age 65. Relevant provisions of the legislation are as follows:
• Employers receive a tax-free subsidy if they offer a pharmaceutical benefit plan that isactuarially equivalent to that provided under Medicare Part D. Companies that do so receive a 28 percent subsidy from the federal government for each Medicare-eligibleretiree enrolled in that plan.
• Employers can purchase wrap-around pharmaceutical coverage to enhance Medicare Part D. Employers whose plans are not actuarially equivalent to Medicare Part D can maintain their current plan and offer wrap-around coverage, as they traditionallyhave done for Medicare Parts A and B beneficiaries.
• An existing pharmaceutical plan sponsor can contract with theCMS to become an approved Medicare Part D plan sponsor. In this instance, employers can continue to operate their ownERISA plans. In turn, CMS pays a capitated rate covering boththe basic and the catastrophic components of Medicare Part D.
• Employers can move Medicare-eligible beneficiaries into managed care plans that offer more enhanced benefits than the standard Medicare Part D benefit does.
TIP: Educate employees aboutthe ramifications oftheir retirement drugbenefit choices.How does your benefit comparewith those availablethrough other available drugplans?

42businessgrouphealth.org Pharmaceutical Benefit Design: Helping Employers Understand, Assess, Select and Manage Pharmacy Benefits
High-Deductible Health Plans
The purpose of high-deductible health plans is to:
• Better control employer costs;
• Obligate greater consumer responsibility in health care decision making, and
• Focus on the value of preventive care.
Employers are increasingly offering consumer-driven health plans(CDHPs) that incorporate high-deductible health plans (HDHPs),flexible savings accounts (FSAs), health savings accounts (HSAs) orhealth reimbursement accounts (HRAs). According to a NationalBusiness Group on Health member survey, 48 percent of membercompanies offered HDHPs in 2006. As employers move toHDHPs, they struggle with incorporating high-deductible planfinancing mechanisms into their current pharmaceutical systemwithout jeopardizing PBM negotiating power, employer cost savings and individual health. Such employers are often in aquandary as to what constitutes appropriate spending on preventivecare. A related concern is whether the greater financial impact onpatients will result in reduced utilization of important medicalservices, such as drugs to treat chronic diseases. The impact of such policies on drug adherence is an area of ongoing research and debate.
Marketing: Direct-to-Consumer and Direct-to-Physician
The role of direct-to-consumer and direct-to-physician advertising in the growing cost of prescription drugs in the United States is a matter of intense debate. Evidence suggests thatdirect-to-consumer advertising of prescription drugs increases pharmaceutical sales.53 Studiesshow a direct correlation between the increase in pharmaceutical marketing and an increasein the number of prescriptions written. Total spending on pharmaceutical promotion grewfrom $11.4 billion in 1996 to $29.9 billion in 2005.53 Paradoxically, direct-to-consumeradvertising helps avert underuse of medications (as undiagnosed conditions are discoveredand treated) yet can also lead to overuse (when patients seek medications they do not need).53
TIP: Strongly consider coveringpreventive medica-tions at 100 percentfor high-deductiblehealth plans. The Internal RevenueService allows employers to coverprescription drugsthat prevent disease or diseaserecurrence, or not-yet existingconditions, outsideof deductibles orcost sharing.
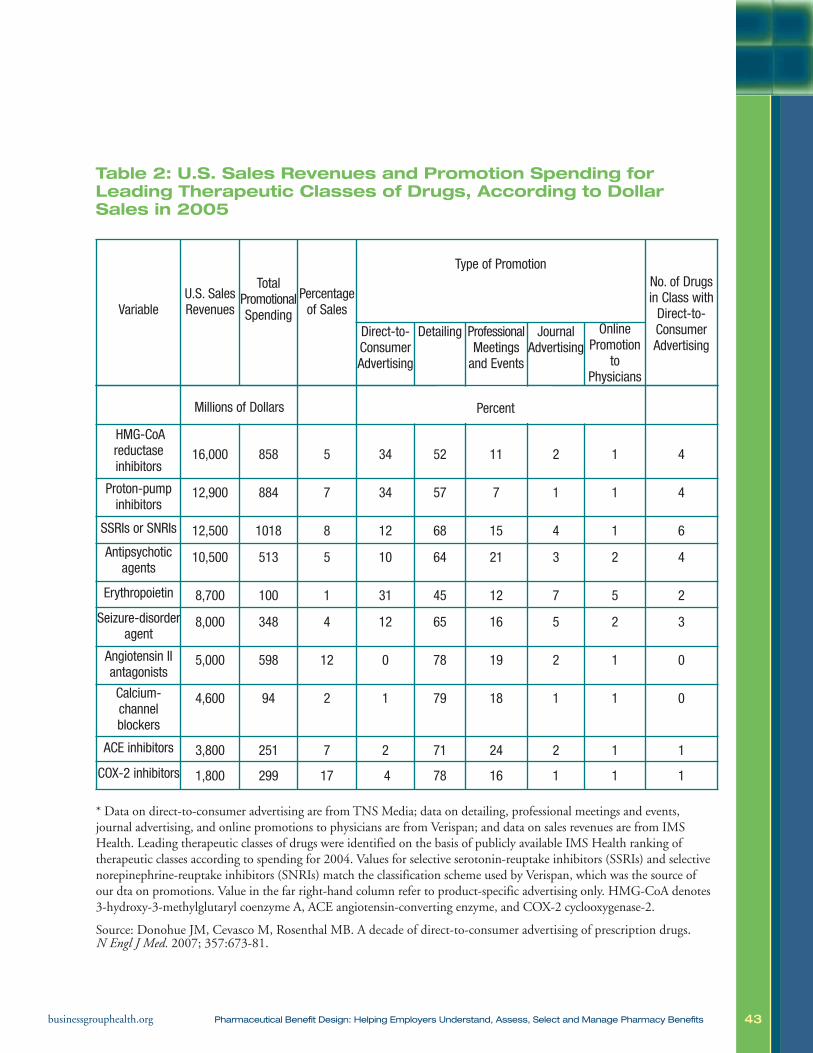
43businessgrouphealth.org Pharmaceutical Benefit Design: Helping Employers Understand, Assess, Select and Manage Pharmacy Benefits
Table 2: U.S. Sales Revenues and Promotion Spending forLeading Therapeutic Classes of Drugs, According to DollarSales in 2005
Variable U.S. SalesRevenues
TotalPromotionalSpending
Percentageof Sales
Type of PromotionNo. of Drugsin Class withDirect-to-ConsumerAdvertising
Direct-to-ConsumerAdvertising
Detailing ProfessionalMeetingsand Events
JournalAdvertising
OnlinePromotion
toPhysicians
Millions of Dollars
HMG-CoAreductaseinhibitors
16,000 858 5 34 52 11 2 1 4
Proton-pumpinhibitors
12,900 884 7 34 57 7 1 1 4
SSRIs or SNRIs 12,500 1018 8 12 68 15 4 1 6
Antipsychoticagents
10,500 513 5 10 64 21 3 2 4
Erythropoietin 8,700 100 1 31 45 12 7 5 2
Seizure-disorderagent
8,000 348 4 12 65 16 5 2 3
Angiotensin IIantagonists
5,000 598 12 0 78 19 2 1 0
Calcium-channelblockers
4,600 94 2 1 79 18 1 1 0
ACE inhibitors 3,800 251 7 2 71 24 2 1 1
COX-2 inhibitors 1,800 299 17 4 78 16 1 1 1
* Data on direct-to-consumer advertising are from TNS Media; data on detailing, professional meetings and events, journal advertising, and online promotions to physicians are from Verispan; and data on sales revenues are from IMSHealth. Leading therapeutic classes of drugs were identified on the basis of publicly available IMS Health ranking of therapeutic classes according to spending for 2004. Values for selective serotonin-reuptake inhibitors (SSRIs) and selectivenorepinephrine-reuptake inhibitors (SNRIs) match the classification scheme used by Verispan, which was the source of our dta on promotions. Value in the far right-hand column refer to product-specific advertising only. HMG-CoA denotes3-hydroxy-3-methylglutaryl coenzyme A, ACE angiotensin-converting enzyme, and COX-2 cyclooxygenase-2.
Source: Donohue JM, Cevasco M, Rosenthal MB. A decade of direct-to-consumer advertising of prescription drugs. N Engl J Med. 2007; 357:673-81.
Percent
44businessgrouphealth.org Pharmaceutical Benefit Design: Helping Employers Understand, Assess, Select and Manage Pharmacy Benefits
IX. THE VALUE OF PHARMACEUTICALCOVERAGE
In an ideal world, an employer could provide the right drug, to the right person, at the right dosage, at the right time with no risks. There is, however, no such thing as the perfectpharmaceutical benefit. Benefits cannot provide everything to everyone. At the same time, all health interventions, including prescription drugs, offer benefits as well as harms andrisks. In the real world, it is the employer’s responsibility to design a benefit that meets theneeds of most people in a safe, efficient, effective and economical way that also provides amethod for managing exceptions. The purpose of this document is to advise employers onhow to fulfill this important responsibility.
Theoretically, pharmaceutical benefits exist along a spectrum: from the complete absence of a benefit to unrestricted access to all medications. Both extremes are impractical and inappropriate. Open-access pharmaceutical benefits are rare, yet virtually every large employeroffers extensive pharmaceutical coverage. The pharmacy benefit should be designed to support overall organizational health care goals and objectives, as well as balance benefits,risks, and need for an affordable health care package.
This report is for National Business Group on Health members. It should not be reproduced or quoted with permission from the National Business Group on Health.
What influences corporate health care goals? Every company must think about the following five factors when determining the structure and breadth of its health benefit plan:
Employee health care access: Are a wide variety of medical servicesavailable with reasonable employee contributions?
Financial cost: How much can a company reasonably expend on employeehealth care? What cost sharing levels balance the need for consumer engagementwith affordability for patients?
Employee satisfaction:What type of health care benefits will attract andretain talented employees?
Workplace productivity: Considering that health care benefits are an investment in the long-term health of employees, how important is it to maintainthe health of the current workforce to improve productivity?
Corporate culture: How responsible does a company feel for the healthand well-being of its employees?
45businessgrouphealth.org Pharmaceutical Benefit Design: Helping Employers Understand, Assess, Select and Manage Pharmacy Benefits
The pharmaceutical benefit is one component of a larger health care benefit and should bemanaged as such. Administering the pharmaceutical benefit independently or in an ad hocmanner will:
• Limit the potential effectiveness of the overall health care benefit; and
• Minimize the perceived effectiveness of the pharmaceutical benefit.
For these reasons, the employer should manage the pharmaceutical benefit as a part of thewhole. Doing so requires understanding how pharmaceutical spending affects other direct andindirect health care costs (e.g., the health plan, worker disability and productivity). Gaps inpharmaceutical coverage can result in other costs, such as emergency room use, hospitalizations,and provider visits. Those gaps are expensive to an employer in terms of lost productivity.
Integration
Many companies manage pharmaceuticals as an independent health benefit. In other words,pharmaceuticals are a line item in their budget. They are not integrated into total health carespending. As the costs of pharmaceuticals rise, senior management takes note and requiresthat payouts be better controlled or cut back. In this type of environment, managing the benefit becomes a continued effort at cost containment. The constant question is how can thepharmaceutical benefit be redesigned to control medical spend? This approach is equivalent tofixing a leaky water pipe by plugging the holes. If too many people are using more-expensivemedications, the solution is to change that behavior by creating disincentives to using thatmedication (i.e., increase the cost sharing or eliminate the coverage entirely).
Cost Containment
Managing to contain costs only may undermine the value of the pharmaceutical benefit. Thisstrategy assumes that value is determined wholly by how much the pharmaceutical benefitcosts: spending less, it reasons, is always better than spending more. The problem with thisapproach is that minimized usage may receive greater priority than appropriate usage. Ifmanagement’s goal is to limit financial liability, continuously integrating cost-containmentstrategies can work. The problem is that the desired effects may be of short duration. Plugging a hole is at best a temporary fix. If a permanent solution is not found, the hole willgrow and others will eventually appear. Similarly, there are only so many ways to containcosts in a pharmaceutical benefit. The long-term trend in pharmaceutical usage indicates that utilization will continue to increase. As a result, pharmaceutical benefit costs will alsocontinue to rise. A comprehensive strategic approach is needed.
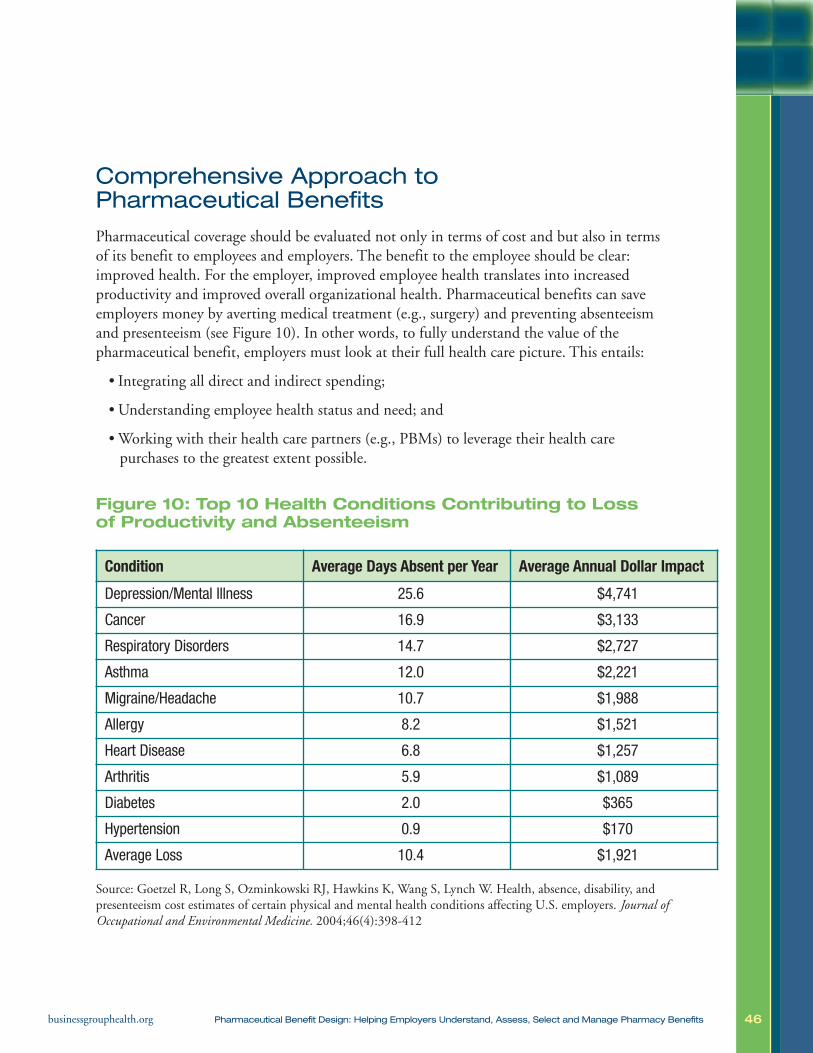
46businessgrouphealth.org Pharmaceutical Benefit Design: Helping Employers Understand, Assess, Select and Manage Pharmacy Benefits
Comprehensive Approach to Pharmaceutical Benefits
Pharmaceutical coverage should be evaluated not only in terms of cost and but also in termsof its benefit to employees and employers. The benefit to the employee should be clear:improved health. For the employer, improved employee health translates into increased productivity and improved overall organizational health. Pharmaceutical benefits can saveemployers money by averting medical treatment (e.g., surgery) and preventing absenteeismand presenteeism (see Figure 10). In other words, to fully understand the value of the pharmaceutical benefit, employers must look at their full health care picture. This entails:
• Integrating all direct and indirect spending;
• Understanding employee health status and need; and
• Working with their health care partners (e.g., PBMs) to leverage their health care purchases to the greatest extent possible.
Figure 10: Top 10 Health Conditions Contributing to Loss of Productivity and Absenteeism
Source: Goetzel R, Long S, Ozminkowski RJ, Hawkins K, Wang S, Lynch W. Health, absence, disability, andpresenteeism cost estimates of certain physical and mental health conditions affecting U.S. employers. Journal ofOccupational and Environmental Medicine. 2004;46(4):398-412
Condition Average Days Absent per Year Average Annual Dollar Impact
Depression/Mental Illness 25.6 $4,741
Cancer 16.9 $3,133
Respiratory Disorders 14.7 $2,727
Asthma 12.0 $2,221
Migraine/Headache 10.7 $1,988
Allergy 8.2 $1,521
Heart Disease 6.8 $1,257
Arthritis 5.9 $1,089
Diabetes 2.0 $365
Hypertension 0.9 $170
Average Loss 10.4 $1,921
47businessgrouphealth.org Pharmaceutical Benefit Design: Helping Employers Understand, Assess, Select and Manage Pharmacy Benefits
X. PHARMACEUTICAL BENEFIT CASE STUDIES
Several large companies, institutions and localities have implemented innovative solutions to their own pharmaceutical challenges. Employers can learn strategies formanaging their own pharmacy benefit plans by looking at what their peers have done in this area as they can in all health care activities. Few companies are willing to adoptchange without knowing how other organizations fared following adoption of a similarstrategy. The Business Group’s Pharmaceutical Council presents the following casestudies in the hope that they will provide information that other employers may find useful. Please look for updates to this information, as well as new case studies, as information and new practices become available.
This report is for National Business Group on Health members. It should not be reproduced or quoted with permission from the National Business Group on Health.
IT IS IMPORTANT TO BE CRITICAL ABOUT RESEARCH. IS THERE
ANYTHING ELSE, BESIDES THE INTERVENTION, THAT EXPLAINS
THE FINDINGS?
• Consider the Hawthorne effect. The Hawthorne effect describes a temporary change in behavior or performance in response to a change in environmental conditions. In the case of medical intervention, many argueimprovements in clinical and financial outcomes may be driven by new orincreased attention on the topic rather than by the intervention being studied.
• Validated scientific research should include a control group to correct for “regression to the mean” and other potential flaws instatistical methodology. Employers may create programs to manage theirmost expensive health and/or benefit challenges. When there appears to beimprovement following the intervention, employers should be reticent aboutattributing that success to the intervention. Without a control group, it is difficultto measure true change. Randomized or matched control groups provide a reference point that enable the researcher to see what would have happenedwithout the intervention. Additionally, outliers tend to return to normal.
• While many early studies of the impact of pharmaceutical designchange on human behavior are intriguing and encouraging, they do not provide definitive evidence of success from any one individual factor, such ascopayment adjustment or education regimens. These interventions introducedmany changes at once, making it difficult to determine the impact of any one par-ticular change.
48businessgrouphealth.org Pharmaceutical Benefit Design: Helping Employers Understand, Assess, Select and Manage Pharmacy Benefits
Pitney BowesIn 2001, having implemented full managed care in the early 1990s, Pitney Bowes conducteda full review of its health care strategy. The company, specializing in global, integrated mailand documents, also re-evaluated its approach to benefit design. Company executives recognized that health care was the only corporate expense that was assumed to grow eachyear. They also were aware that the benefit seemed to offer less value year after year. In otherwords, additional investment in health care did not necessarily translate into improvedemployee or organizational health.
As a first step, Pitney Bowes scrutinized its workforce and health care spending. Analysis of itsintegrated database of pharmacy, medical, clinical, disability and workers’ compensation datashowed that 50 percent of employees had a chronic illness. These chronic illnesses (e.g., asthma,diabetes, cardiovascular disease, cancer and depression) were primary cost drivers. At the sametime, the company’s pharmacy program was extremely fragmented (multiple PBMs, carve-insand carve-outs). This complexity resulted in adverse selection within its own population.
After completing this review, Pitney Bowes undertook a staged revision of its pharmaceuticalbenefit plan. In the initial stage, they took the following steps:
• Selected a new PBM vendor to manage both retail and mail-order pharmacy operations.The PBM was also expected to supply data to the company’s integrated database so as toinform the development and delivery of other employer-sponsored health care services(e.g., disease management).
• Moved to a triple-tier pharmacy plan with a “buy-up” provision. Employees who reliedon pharmaceutical products extensively could choose to pay higher premiums and payless at the point of sale. The formulary was a three-tier retail coinsurance plan with nodeductible. Drugs on tier one required 10 percent coinsurance, those on tier two required30 percent coinsurance and those on tier three required 50 percent coinsurance. No per-prescription maximums were applied.
• Eliminated required mail-order, mandatory generics and step therapy.
• Limited prior authorization.
In light of the large proportion of workers with chronic medical conditions, the company:
• Changed the pharmacy plan design, moving all medications commonly used to treatasthma, diabetes and cardiovascular disease to tier one, regardless of whether the drugswere generic, brand, preferred or non-preferred.
• Linked disease management, case management and on-site clinics to the pharmacy program.
49businessgrouphealth.org Pharmaceutical Benefit Design: Helping Employers Understand, Assess, Select and Manage Pharmacy Benefits
• Automatically added new drug treatments for the above-described chronic diseases to thefirst-tier category without:
– A waiting period, or
– Review by its Pharmacy and Therapeutics (P&T) Committee.
In 2007, benefit design was expanded to include pharmaceuticals for treatment of osteopenia/osteoporosis, seizure disorders and anticoagulants on tier one. Statins were made availablefree of charge to all persons with either diabetes or a history of a cardiac event (myocardialinfarction, bypass surgery, stent implantation).
The average cost of a 30-day prescription fill dropped by 50 percent to 80 percent comparedwith previous costs.54 The annual costs of care for diabetes decreased 6 percent between 2001and 2003.54 Although Pitney Bowes’ total annual pharmacy costs per covered person showeda mild increase, pharmacy costs for those with diabetes actually decreased by 7 percent.54
The number of employees with suboptimal adherence to insulin decreased by two-thirds.54
The proportion of employees using fixed-combination oral hypoglycemics increased from 9 percent to 22 percent. Increases in adherence rates were particularly high for individuals taking combination therapy. The rate of emergency department visits for diabetes dropped by26 percent.54 Pitney Bowes also saved in short-term disability. The annual hospitalization ratefor those with diabetes decreased from 0.06 days per 100 employees in 2002 to 0.03 days in2004, whereas the average length of stay decreased 29.3 percent from 58 days in 2002 to 41days in 2004. This translated into short-term disability cost savings of 75 percent.55
Pitney Bowes’ efforts proved successful. The company’s many actions effectively communicatedthe organization’s commitment to better preventive care and personal health. Followingimplementation of the new plan, Pitney Bowes’ health care spending did not grow as fast asthe national average. Between 2001 and 2002, Pitney Bowes experienced an 8.3 percentgrowth in health care spending as compared to 15 percent for its benchmarked competitors.56
Per member per month pharmacy cost increases from 2001 to 2002 were 1 percent at a timewhen the external average was 12 percent.56
Recent data show that its 2007 plan design changes increased the number of diabetics on a statinby more than 10 percent. Ultimately, the variance from the benchmark for what 2007 healthcare costs should have been was $40 million. Of this, $12 million was attributed to improvedhealth plan efficiency. The remaining savings were due to better health care management.
White it is difficult to identify the impact of each individual strategy the Pitney Bowes used(consolidating vendors, optimized benefit design, disease management, on-site clinics, etc.)this experience demonstrates the enormous value of an integrated approach to benefits.
50businessgrouphealth.org Pharmaceutical Benefit Design: Helping Employers Understand, Assess, Select and Manage Pharmacy Benefits
The Asheville ProjectPROJECT BEGINNINGS
Asheville, North Carolina, is a recognized leader in disease management. Over the pastdecade, Asheville, like many other employers, watched its health care expenses rise and struggled with how to contain costs. In March 1997, Asheville introduced a one-year pilotproject with objectives to:
• Improve the health of employees with Type 1 and Type 2 diabetes, and
• Lower total health care costs.
The goal of the Asheville Project, formally known as the Asheville Pharmaceutical Care Services (PCS) program, was to lower the amount spent on diabetes, a common and costlydisease among city employees. Many employees with diabetes did not adhere to treatmentbecause of the high costs of prescription medications and supplies. The program’s underlyingphilosophy was that poor medication adherence leads to expensive health care utilization,such as emergency room visits and longer, more frequent hospital stays. In effect, the City ofAsheville believed that it could save money by improving medication adherence.
The Asheville Project tapped into an existing, although underutilized, resource: local pharmacists. The PCS program recruited pharmacists from 12 local pharmacies. Pharmacistswere reimbursed for their participation. Each went through a rigorous training process developed by two North Carolina pharmacy schools and the Mission St. Joseph’s (MSJ) Diabetes Education Center.57 The training included knowledge and skill training in how toattend to the needs of patients with diabetes (i.e., disease monitoring, treatment review andspecific techniques for educating and supporting patients with diabetes).
Employees insured by the City of Asheville and the MSJ Health System were invited to participate in the program. To encourage people to participate, copayments on diabetic medications and supplies were waived. Following enrollment and selection of a PCS-identified provider from the list of the 12 participating local pharmacies, patients were provided with the following opportunities:58
• Monthly meetings with pharmacists at no personal cost;
• A free home blood glucose meter to measure daily glucose levels;
• Pharmacist-provided training in monitoring blood glucose levels through the meter;
• Pharmacist monitoring of patient treatment goals;
• Pharmacist-provided diabetes management education;
• Pharmacist-provided physical assessments; and
• Pharmacist-provided information about medication adherence.
51businessgrouphealth.org Pharmaceutical Benefit Design: Helping Employers Understand, Assess, Select and Manage Pharmacy Benefits
Program participants used the services offered to achieve better diabetes management.Patients with diabetes visited the pharmacist up to eight times as often as other patients. Thepharmacist became an active part of the health care team.58 As a result of the new relationshipbetween pharmacists and patients, patients visited their physicians more regularly than theyhad previously. Program staff concluded that patients with diabetes adopted better healthbehaviors because they had received repeated messages about health maintenance.58
Although the total cost of medications rose (because of better adherence and more aggressivetreatment), employers saw a decrease in mean projected medical costs.
• One employer estimated that every dollar invested in the PCS program resulted in fourdollars saved.42
• In the long term, the average direct medical care cost per patient per year decreasedbetween $1,622 and $3,356.57
• The number of sick days taken by employees with diabetes decreased, resulting inincreased productivity valued at $18,000 per year.57
• The City of Asheville is paying half of the national average health care cost for employeeswith diabetes.42
The Asheville Project has been successful in improving the health of patients with diabetes.Over the past decade, the project has brought about reductions in the number of sick daysused as well as in overall health care costs.
The City of Asheville has expanded the program to include patients with asthma, high bloodpressure, high cholesterol and depression. The program has been emulated by more than 30employers nationwide.44 The Asheville Project demonstrates that if employees take care oftheir health in the present, employer health care costs can be minimized in the long run.
52businessgrouphealth.org Pharmaceutical Benefit Design: Helping Employers Understand, Assess, Select and Manage Pharmacy Benefits
Mohawk Industries, Inc.The American Pharmacists Association (APhA) Foundation offers a service to help employersorganize and implement diabetes management programs under its Patient Self-ManagementProgram for Diabetes, based on the Asheville Project Model. The program began in 2003 as apilot program.59 Representative companies and organizations from five sites were chosen toimplement this project. Among them was Mohawk Industries, Inc., a carpet factory locatedin Dublin, Georgia. Mohawk has 750 employees.
Alan Christianson, Mohawk’s benefits administrator, said that the company realized that itcould eventually face health costs so high that employees could not afford insurance. “We feltthat we had to do something about it,” he said.
Mohawk employees received a flyer describing the program’s benefits. Incentives for employeesto enroll, including waived copayments on diabetes-related medicines, were created. There wasno out-of-pocket charge for diabetes education, and patients received a new blood glucosemeter at no charge. Patients were able to select their top three pharmacists of choice during the enrollment process. Each pharmacist managed five patients. Twelve pharmacy providersparticipated and 60 patients were enrolled. The patients were assessed during three monthlyvisits. The first visit focused on nutrition, diet, exercise and diabetes education. The secondvisit addressed controlling blood sugar, foot care, proper insulin use and reading food labels.The third visit focused on managing diabetes over the long term.
Visits were documented and faxed to the patient’s physician at the end of each visit. Pharmacists also recorded hemoglobin A1C, blood pressure, cholesterol, current influenzavaccination, current foot examination, current eye examination, and medication adherence.
In addition to the pharmacist visits, 20 to 25 patients participated in a monthly support groupat Mohawk’s on-site education room. During these sessions, they discussed topics related tomanaging their diabetes. At the end of the first year, 92 percent of the patients had bloodsugar (A1C) levels less than the Health Plan Employer Data Information Set goal of 9.0, and59 percent had A1Cs less than the American Diabetes Association goal of 7.0. By the end ofthe second year, the proportion of patients with A1Cs below 7.0 rose to 61 percent.60
By the end of year two, medical costs for these diabetics decreased by 53 percent as comparedwith costs at the end of year one. The average annual medical claims costs per patient droppedfrom $8,202 at baseline to $6,870 at the end of year one, and to $3,677 at the end of yeartwo. Total per-patient drug expenditures rose from $2,194 at baseline to $3,870 at the end ofyear one to $4,025 at the end of year two. The increase in drug spending is the result ofpatients becoming more adherent to their medication regimens and is expected to level offover time.60
53businessgrouphealth.org Pharmaceutical Benefit Design: Helping Employers Understand, Assess, Select and Manage Pharmacy Benefits
Wake Forest University Baptist Medical CenterWake Forest University Baptist Medical Center in Winston-Salem, N.C., manages its ownhealth plan. Prior to intervention, the 22,000 plan members had a three-tiered pharmacyplan. A 30-day medication supply cost $10 for generic products, $25 for preferred name-brand products and $50 for non-preferred name-brand products. Because the institution had on-site pharmacies, it did not offer a mail-order option. The plan did not cover over-the-counter medications.
In an effort to reduce its prescription drug spend, Wake Forest University Baptist MedicalCenter implemented the following changes:61
• Shifted all brand-name drugs from preferred to non-preferred status for classes of medicationswith similarly effective or potentially safer generic substitutions. This eliminated the preferredbrand-name tier.
• Removed from the formulary prescription drug classes for which similarly effective over-the-counter medications were available.
• Introduced quantity limits for medications not indicated for daily use.
• Established a program of mandatory pill splitting (based on a similar effort undertaken by Department of Veteran Affairs Mid-Atlantic Health Network) and applied it to sixbrand-name antidepressants and three brand-name statins.
A local advisory committee of clinical leaders, pharmacists and administrators examined published literature to determine which interventions members would support. Ultimately,following committee support, the above interventions were launched in three phases over thecourse of two years (fourth quarter 2003–third quarter 2005).61
At baseline, 36 percent of plan members used the prescription drug benefit, averaging about2.8 drug claims per member, per quarter. Sixty percent of claims were for brand-name-onlydrugs. This translated into $10.1 million prescription drug dollars spent in 2003 ($35.37 permember per month).61
Following implementation, total prescription drug spending remained constant over the nextthree years. National pharmaceutical spending increased 8 percent each year during that sameperiod. This resulted in cost avoidance of $6.6 million. A detailed breakdown of the financialimpact of each proposed intervention is shown in Table 5. Research shows that:
• Using cost-effective alternatives to brand-name drugs through formulary changes mayyield cost savings; and.
• Pill splitting can yield cost savings, but it can also be risky.
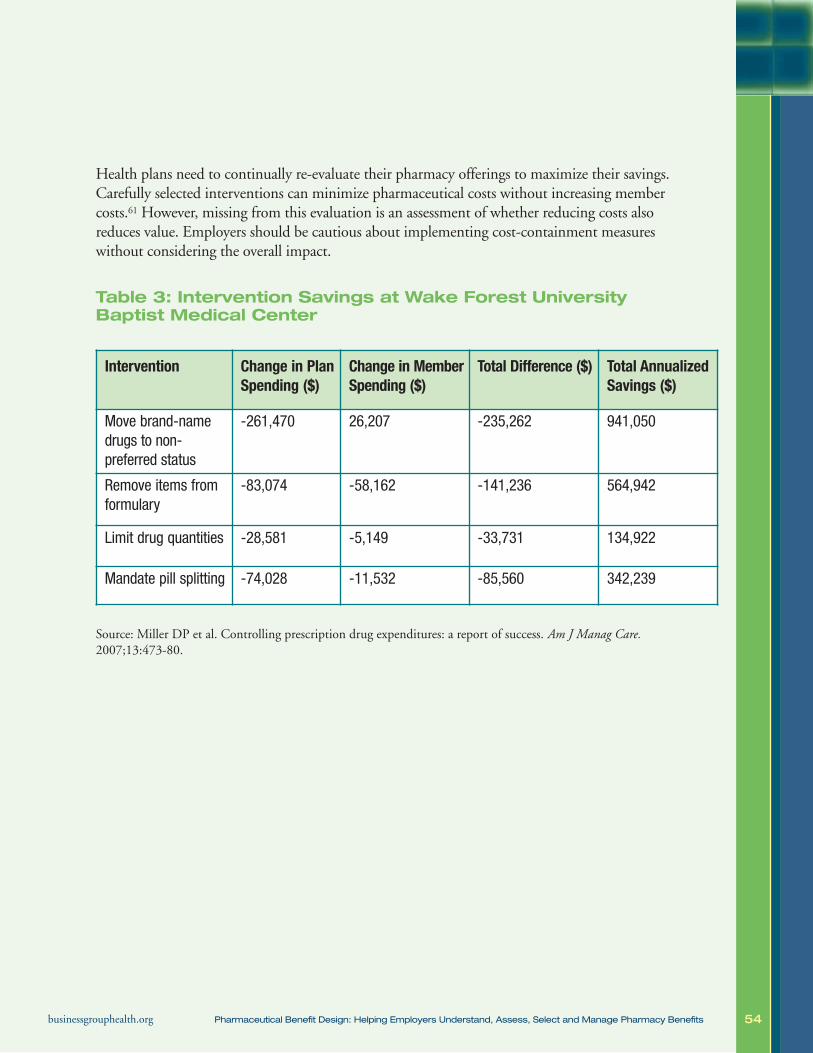
54businessgrouphealth.org Pharmaceutical Benefit Design: Helping Employers Understand, Assess, Select and Manage Pharmacy Benefits
Health plans need to continually re-evaluate their pharmacy offerings to maximize their savings.Carefully selected interventions can minimize pharmaceutical costs without increasing membercosts.61 However, missing from this evaluation is an assessment of whether reducing costs alsoreduces value. Employers should be cautious about implementing cost-containment measureswithout considering the overall impact.
Table 3: Intervention Savings at Wake Forest UniversityBaptist Medical Center
Source: Miller DP et al. Controlling prescription drug expenditures: a report of success. Am J Manag Care.2007;13:473-80.
Intervention Change in PlanSpending ($)
Change in MemberSpending ($)
Total Difference ($) Total AnnualizedSavings ($)
Move brand-namedrugs to non-preferred status
-261,470 26,207 -235,262 941,050
Remove items fromformulary
-83,074 -58,162 -141,236 564,942
Limit drug quantities -28,581 -5,149 -33,731 134,922
Mandate pill splitting -74,028 -11,532 -85,560 342,239
55businessgrouphealth.org Pharmaceutical Benefit Design: Helping Employers Understand, Assess, Select and Manage Pharmacy Benefits
University of MichiganIn 2004, University of Michigan (UM) leadership called for the identification, implementationand evaluation of potentially cost-effective investments in the health of the UM workforce.Using pharmacy claims, utilization rates of high-value therapies were assessed. In view of itsprevalence, extent of underutilization of essential therapies and health service utilizationcosts, diabetes was identified for a value-based insurance design intervention.
In July 2006, UM implemented a two-year pilot program “M-Healthy: Focus on Diabetes”for its 2,200 employees and dependents with a diagnosis of diabetes mellitus. The programprovides copayment reductions to diabetes patients for interventions with a strong evidencebase. These include several drugs that affect blood sugar, blood pressure, cholesterol anddepression, and that help prevent or reduce the long-term complications of diabetes. Many of these medications are used for a wide range of other diseases, but only individuals withdiabetes were eligible for copayment reductions. The UM pharmacy benefit plan classifiesdrugs into three tiers for payment. For medications in tier one, copayments decreased by 100percent (from $7 to $0). Tier two copayments decreased by 50 percent (from $14 to $7); tierthree copayments, by 25 percent (from $24 to $18). Copayments for annual eye exams werealso reduced.62
All employees and clinicians were notified by letter and e-mail of the pilot program. All UMemployees and their dependents were enrolled in the program automatically if they had previously filled a prescription through the UM Prescription Drug Plan for a blood sugar–controlling medication or insulin.
According to Allison Rosen, M.D., Sc.D., an assistant professor of internal medicine andhealth management and policy at UM, “We implemented this program to improve both the quality and value of care for our workforce with diabetes. In turn, it is our hope that arigorous evaluation of the impact of these targeted value-based copayment reductions mayhelp inform the efforts of other employers and insurers trying to improve the value of theirhealth care spending.”63
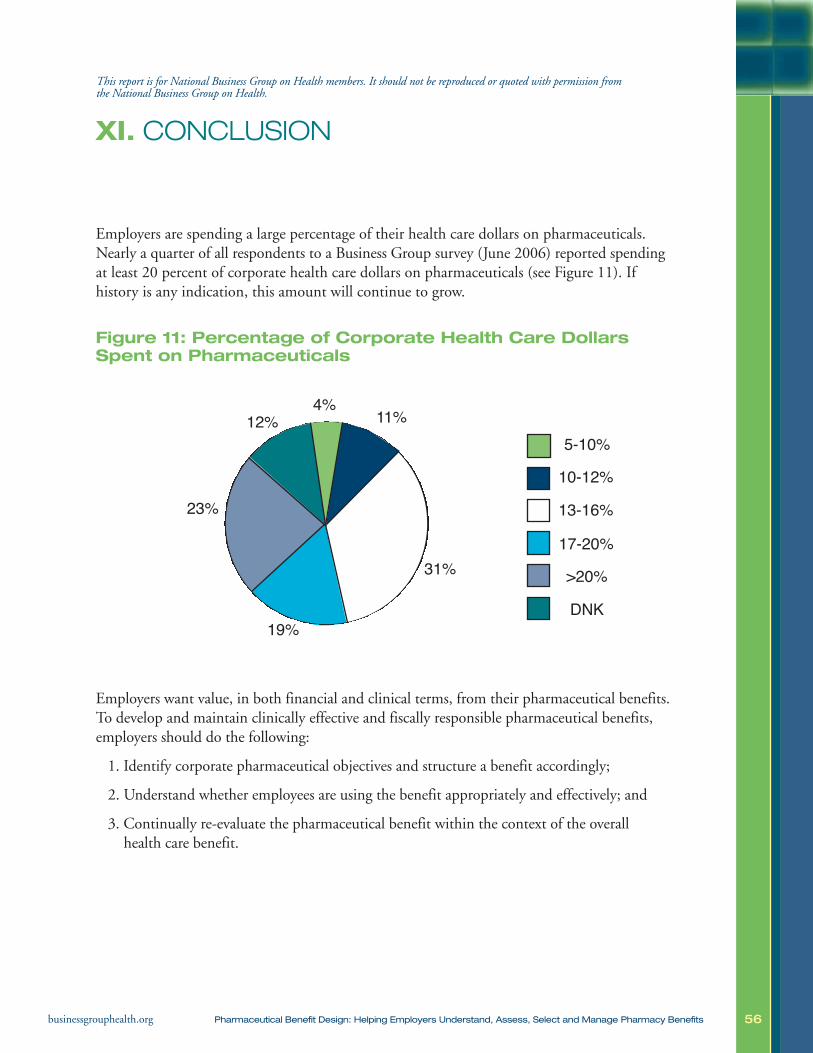
56businessgrouphealth.org Pharmaceutical Benefit Design: Helping Employers Understand, Assess, Select and Manage Pharmacy Benefits
XI. CONCLUSION
Employers are spending a large percentage of their health care dollars on pharmaceuticals.Nearly a quarter of all respondents to a Business Group survey (June 2006) reported spendingat least 20 percent of corporate health care dollars on pharmaceuticals (see Figure 11). If history is any indication, this amount will continue to grow.
Figure 11: Percentage of Corporate Health Care DollarsSpent on Pharmaceuticals
Employers want value, in both financial and clinical terms, from their pharmaceutical benefits.To develop and maintain clinically effective and fiscally responsible pharmaceutical benefits,employers should do the following:
1. Identify corporate pharmaceutical objectives and structure a benefit accordingly;
2. Understand whether employees are using the benefit appropriately and effectively; and
3. Continually re-evaluate the pharmaceutical benefit within the context of the overallhealth care benefit.
This report is for National Business Group on Health members. It should not be reproduced or quoted with permission from the National Business Group on Health.
12%
19%
23%
5-10%10-12%
13-16%
17-20%>20%
DNK
31%
4% 11%
57businessgrouphealth.org Pharmaceutical Benefit Design: Helping Employers Understand, Assess, Select and Manage Pharmacy Benefits
To accomplish this, employers need to leverage their data and partnerships. A pharmaceutical benefit ill-tailored to the needs of a given workforce cannot be utilized to its full potential. Similarly, it is important that all players involved in pharmaceutical benefit management(employer, PBM, health plan, etc.) work together toward shared goals and objectives.
The value of the pharmaceutical benefit value should be determined in both financial and clinical terms. This can be difficult to do. Employers need to re-examine how they manage thepharmaceutical benefit, with an eye both to cost and to benefit, weighing carefully plan designsthat balance net health outcomes, risks and harms. Appropriately prescribed, pharmaceuticals arenot only a cost: employers benefit from the pharmaceutical coverage they provide. Prescriptionmedications can help people avoid, minimize or mitigate disease, disability and even death. Effective prevention and treatment can also improve worker productivity. Ultimately, pharmaceuticalvalue – like all investments in health care – should include measurements of both direct and indirect health care costs, other risks and harms and benefits, including health outcomes.
58businessgrouphealth.org Pharmaceutical Benefit Design: Helping Employers Understand, Assess, Select and Manage Pharmacy Benefits
XII. REFERENCES
1. Large employers now use DM to cut their costs. Managed Care. January 2004.2. Burton W, Morrison A, Weirtheimer AI. Pharmaceuticals and worker productivity loss: a critical review
of the literature. J Occup Environ Med. 2003;45(6):610-21.3. Sokol M, McGuigan K, Verbrugge R, Epstein R. Impact of medication adherence on hospitalization
risk and healthcare cost. Medical Care. 2005:6;521-530. 4. World Health Organization. Immunization against Diseases of Public Health Importance. Available at:
http://www.who.int/mediacentre/factsheets/fs288/en/index.html. Accessed January 18, 2008.5. Poisal J, Truffer C, Smith S, et al. Health spending projections through 2016. Health Affairs.
2007;26(2):w242-w253.6. U.S. Department for Health and Human Services. National health expenditure accounts, 2006
highlights. Centers for Medicare and Medicaid Services. Available at: http://www.cms.hhs.gov/NationalHealthExpendData/downloads/highlights.pdf. Accessed January 18, 2008.
7. Catlin A, Cowan C, Hartman M, Heffler S. National health spending in 2006: a year of change forprescription drugs. Health Affairs. 2008;27(1): 14-29.
8. Catlin A, et al. National health spending in 2005: the slowdown continues. Health Affairs.2007;26(1):142-153.
9. US Department of Health and Human Services. National Health Expenditure Projections 2006-2016.Centers for Medicare and Medicaid Services. Available at: http://www.cms.hhs.gov/NationalHealthExpendData/downloads/proj2006.pdf. Accessed January 22, 2008.
10. Agency for Healthcare Research and Quality. Total Health Services-Mean and Median Expenses perPerson With Expense and Distribution of Expenses by Source of Payment: United States, 2004.Medical Expenditure Panel Survey Component Data. Generated interactively. (April 16, 2008)
11. US Department of Health and Human Services. A Profile of Older Americans: 2005. Administration onAging. Available at: http://www.aoa.gov/PROF/Statistics/profile/2005/profiles2005.asp. AccessedJanuary 24, 2008.
12. Dubois R, Chawla A, Neslusan C, Smith M, Wade S. Explaining drug spending trends: doesperception match reality. Health Affairs. March/April 2000;19(2):231-239.
13. Neuman P, Kitchman Strollo M, Guterman S, et al. Medicare prescription drug benefit progress report:findings from a 2006 national survey of seniors. Health Affairs. 2007;26(5):14-29.
14. IMS Health. IMS reports US prescription sales jump 8.3 percent in 2006, to $274.9 billion. Availableat: http://www.imshealth.com/ims/portal/front/articleC/0,2777,6599_3665_80415465,00.html.Accessed January 18, 2007.
15. Zhang J. Drug benefit fueled medicare spending pace was fastest in 25 years as prescriptions rose 8.5%after years of slow growth. The Wall Street Journal. 2008 Jan 8. Sec. A2. Available at: http://online.wsj.com/public/article/SB119976460147574133.html?mod=blog. Accessed January 24, 2008.
16. Meyer J, Parker A, Tharaldson A, Peterson C. 2006 Drug Trend Report. Report from Express Scripts.Available at: http://www.express-scripts.com/ourcompany/news/industryreports/drugtrendreport/2006/dtrFinal.pdf. Accessed January 18, 2008.
17. Aubert R, Bird B, Boyer M, et al. 2007 Drug Trend Report. Report from Medco. Available at:http://www.drugtrendreport.com/medco/consumer/drugtrend/trends.jsp?articleId=DT_Report_2007&BV_SessionID=@@@@1240069573.1200670615mm536720773322@@@@&BV_EngineID=ccfkadeddjilkgjcfklcgffdghfdfjh.0. Accessed January 18, 2008.
This report is for National Business Group on Health members. It should not be reproduced or quoted with permission from the National Business Group on Health.

59businessgrouphealth.org Pharmaceutical Benefit Design: Helping Employers Understand, Assess, Select and Manage Pharmacy Benefits
18. Generic Pharmaceutical Association. Statistics. Available at: http://www.gphaonline.org/Content/NavigationMenu/AboutGenerics/Statistics/default.htm. Accessed January 18, 2008.
19. Cohen R, Martinez M. Health insurance coverage: estimates from the national health interview survey,January–March 2005. Available at: http://www.cdc.gov/nchs/data/nhis/earlyrelease/insur200509.pdf.Accessed January 18, 2008.
20. Claxton G, DiJilio B, Finder B, Becker E. Employer health benefits, 2007 annual survey. A survey bythe Kaiser Family Foundation. Available at: http://kff.org/insurance/7672/upload/76723.pdf. AccessedJanuary 18, 2008.
21. US Department of Health and Human Services. Medicare Modernization Act 2007 Fiscal Guidelines—formularies. Centers for Medicare & Medicaid Services. Available at:http://www.cms.hhs.gov/PrescriptionDrugCovContra/Downloads/CY07FormularyGuidance.pdf.Accessed January 22, 2008.
22. Edlin M. Engineering new strategies in specialty pharmacy management. AHIP Coverage.2004;45(5):34-9.
23. Kaiser Family Foundation. Prescription Drug Trends. Available at:http://www.kff.org/rxdrugs/upload/3057_06.pdf. Accessed January 24, 2008.
24. Goldman D, et al. Benefit design and specialty drug use. Health Affairs. 2006;25(5):1319-1331.25. Mercer Human Resource Consulting. Navigating the pharmacy benefits marketplace. A report prepared
for the California HealthCare Foundation, January 2003. Available at:http://www.chcf.org/documents/hospitals/NavPharmBenefits.pdf. Accessed January 18, 2008.
26. Mercer/Foster Higgins National Survey of Employer-sponsored Health Plans, 2001.27. Milliman, Inc. Milliman Medical Index 2007. Available at http://www.milliman.com/expertise/
healthcare/products-tools/mmi/pdfs/milliman-medical-index-2007.pdf. Accessed January 18, 2008.28. The Health Strategies Consultancy LLC. Follow the Pill: Understanding the US Commercial
Pharmaceutical Supply Chain. Report written for the Kaiser Family Foundation; March 2005. 29. Aubert R, Bird B, Boyer M, et al. Drug Trend Report. Report from Medco. Available at:
http://medco.mediaroom.com/file.php/103/2006+DRUG+TREND+REPORT.pdf. Accessed January18, 2008. 2006.
30. Freudenheim M. Benefit Managers Profit by Specialty Drug Rights. The New York Times. April 19th,2008, 2008.
31. Mulins C, et al. Health plans' strategies for managing outpatient specialty pharmaceuticals. HealthAffairs. 2006;25(5):1332-1339.
32. Caremark. 2006 Focus on Specialty Pharmacy. Available at:https://www.caremark.com/portal/asset/2006_SpecialtyPharmacy.pdf. Accessed January 24, 2008.
33. Miller S, Houts, J Potential Savings of Biogenerics in the United States. Report for Express Scripts.Available at: http://www.expressscripts.com/ourcompany/news/outcomesresearch/onlinepublications/study/potentialSavingsBiogenericsUS.pdf. Accessed January 18, 2008. February 2007.
34. Osterberg L, Blaschke T. Adherence to medication. N Engl J Med. 2005;353(5)487-97.35. Urquhart J. The electronic medication event monitor: lessons for pharmacotherapy. Clin
Pharmacokinet. 1997;32:345-56.36. Urquhart J. The odds of the three nons when an aptly prescribed medicine isn’t working: non-
compliance, non-absorption, non-response. Br J Clin Pharmacol. 2002;54:212-20.37. McDonnell P, Jacobs M. Hospital admissions resulting from preventable adverse drug reactions. Ann
Pharmacother. 2002;36:1331-1336.
60businessgrouphealth.org Pharmaceutical Benefit Design: Helping Employers Understand, Assess, Select and Manage Pharmacy Benefits
38. Schiff GD, Fung S, Speroff T, McNutt RA. Decompensated heart failure: symptoms, patterns of onset,and contributing factors. Am J Med. 2003;114:625-30.
39. Senst BL, Achusim LE, Genest RP, et al. Practical approach to determining costs and frequency ofadverse drug events in a health care network. Am J Health Syst Phar. 2001; 58:1126-32.
40. Misdrahi D, Llorca PM, Lancon C, Bayle FJ. Compliance in schizophrenia: predictive factors,therapeutical considerations and research implications. Encephal. 2002;28:266-72.
41. Rodgers PT, Ruffin DM. Medication nonadherence: Part II — a pilot study in patients with congestiveheart failure. Manag Care Interface 1998;11(9):67-9, 75.
42. Senst B, Achusim L, Genest R, et al. Practical approach to determining costs and frequency of adversedrug events in a health care network. Am J Health Syst Pharm. 2001;58:1126-1132.
43. Levy G, Zamacona MK, Jusko WJ. Developing compliance instructions for drug labeling. ClinPharmacol Ther. 2000;68:586-91.
44. Berg JS, Dischler J, Wagner DJ, Raia JJ, Palmer-Shevlin N. Medication compliance: a healthcareproblem. Ann Pharmacother. 1993;27:Suppl 9:S1-S24.
45. Chernew M, Shah M, Wegh A, et al. Impact of decreasing copayments on medication adherencewithin a disease management environment. Health Affairs Jan-Feb 2008;27(1):103-112.
46. Bridgeford LC. Reducing Rx copays improves medication adherence. Employee Benefit News. 2008 Jan17. Available at: http://ebn.benefitnews.com/asset/article/525011/reducing-rx-copays-improves-medication-adherence.html?pg=. Accessed January 24, 2008.
47. Reed M, Hargraves J. Prescription drug access disparities among working-age Americans. HealthSystem Change. 2003;73. Available at: http://www.hschange.com/CONTENT/637/. Accessed January 24, 2008.
48. US General Accounting Office. Prescription drugs: implications of drug labeling and off-label use.Testimony presented before the Subcommitee on Human Resources and Intergovernmental Relations,Committee on Government Reform and Oversight, US House of Representatives. September 12, 1996.
49. Radley DC, Finkelstein SN, Stafford RS. Off-label prescribing among office-based physicians. ArchIntern Med. 2006;166:1021-1026.
50. US Department of Health and Human Services. Results from the 2005 National Survey on Drug Useand Health: National Findings. Substance Abuse and Mental Health Services Administration, Office ofApplied Studies. Available at: http://www.oas.samhsa.gov/NSDUH/2k5NSDUH/2k5results.htm#High.Accessed January 22, 2008.
51. US Department of Health and Human Services. National Institute on Drug Abuse Research ReportSeries: Prescription Drugs, Abuse and Addiction. Available at:http://www.nida.nih.gov/PDF/RRPrescription.pdf. Accessed January 22, 2008.
52. Office of National Drug Control Policy. Prescription Drugs Overview. Available at:http://www.whitehousedrugpolicy.gov/drugfact/prescrptn_drgs/index.html. Accessed January 22, 2008.
53. Donohue JM. Cevasco M, Rosenthal MB. A decade of direct-to-consumer advertising of prescriptiondrugs. N Engl J Med. 2007;357:673-81.
54. Mahoney JJ. Reducing patient drug acquisition costs can lower diabetes health claims. Am J ManagCare. 2005;11:S170-S176.
55. Mahoney JJ. The clinical and economic impact of copays. Presented at: Roundtable meeting: Impacton Prescription Drug Copayments on Vulnerable Populations; June 13, 2006; Philadelphia PA.
56. National Business Coalition on Health. Future Trends in Pharmaceutical Benefits. Available at:http://www.nbch.org/resources/nbchbto604final.pdf. Accessed January 24, 2008.
57. Cranor CW, Bunting BA, Christensen DB. The Asheville Project: long-term clinical and economic
61businessgrouphealth.org Pharmaceutical Benefit Design: Helping Employers Understand, Assess, Select and Manage Pharmacy Benefits
outcomes of a community pharmacy diabetes care program. J Am Pharm Assoc (Wash). Mar-Apr2003;43(2):173-184.
58. Cranor CW, Christensen DB. The Asheville Project: short-term outcomes of a community pharmacydiabetes care program. J Am Pharm Assoc (Wash). Mar-Apr 2003;43(2):149-159.
59. Garrett D, Blum B. Patient self-management program for diabetes: first-year clinical, humanistic, andeconomic outcomes. J Am Pharm Assoc. 2005;45(130-7).
60. American Pharmacists Association Foundation. National Clinical Issues Forum: Metabolic Syndrome.Available at: http://www.aphafoundation.org/searchable_files/filemanager/FoundationFinal032006.pdf.Accessed January 22, 2008.
61. Miller D, et al. Controlling prescription drug expenditures: a report of success. Am J Manag Care.2007;13(473-480).
62. Chernew ME, Rosen AB, Fendrick MA. Value-based insurance design. Health Affairs. 2007;26(2):w195-w203.
63. Bailey L. MHealthy Program Wins National Award. Available at:http://www.ur.umich.edu/0607/May21_07/18.shtml. Accessed January 22, 2008.

62businessgrouphealth.org Pharmaceutical Benefit Design: Helping Employers Understand, Assess, Select and Manage Pharmacy Benefits
XIII. APPENDIX A
Terms and Definitions
This report is for National Business Group on Health members. It should not be reproduced or quoted with permission from the National Business Group on Health.
Actual AcquisitionCost (AAC)
Cost of a pharmaceutical to the pharmacy or other health care provider after all discounts, rebates and other prices concessions have been taken into account.
Source: Academy of Managed Care Pharmacy Task Force on Pharmaceutical PaymentMethods. AMCP guide to pharmaceutical payment methods, executive edition. JMCP.2007;13(8).
Average Manufacturer Price (AMP)
The average price paid to a pharmaceutical manufacturer by wholesalers fordrugs distributed to retail pharmacies, net of prompt-pay (“cash”) discounts.
Source: Academy of Managed Care Pharmacy Task Force on Pharmaceutical PaymentMethods. AMCP guide to pharmaceutical payment methods, executive edition. JMCP.2007;13(8).
Average Sale Price(ASP)
The weighted average of all non-federal sales to wholesalers, net of charge-backs, discounts, rebates and other benefits tied to the purchase of the drugproduct, whether paid to the wholesaler or the retailer.
Source: Academy of Managed Care Pharmacy Task Force on Pharmaceutical PaymentMethods. AMCP guide to pharmaceutical payment methods, executive edition. JMCP.2007;13(8).
Average WholesalePrice (AWP)
A national average of list prices charged by wholesalers to pharmacies.
Source: United States Department of Health and Human Services. Glossary of Pharmacy-Related Terms. Available at: http://www.hrsa.gov/opa/glossary.htm. Accessed January 23, 2008.
Best Price (BP) The lowest price available to any wholesaler, retailer, provider, health maintenance organization (HMO), nonprofit entity or the government. BP includes cash discounts, free goods that are contingent upon purchase,volume discounts and rebates.
Source: Academy of Managed Care Pharmacy Task Force on Pharmaceutical PaymentMethods. AMCP guide to pharmaceutical payment methods, executive edition. JMCP.2007;13(8).
Brand-Name Drug A drug sold under a proprietary name that is protected by a patent when itenters the market.
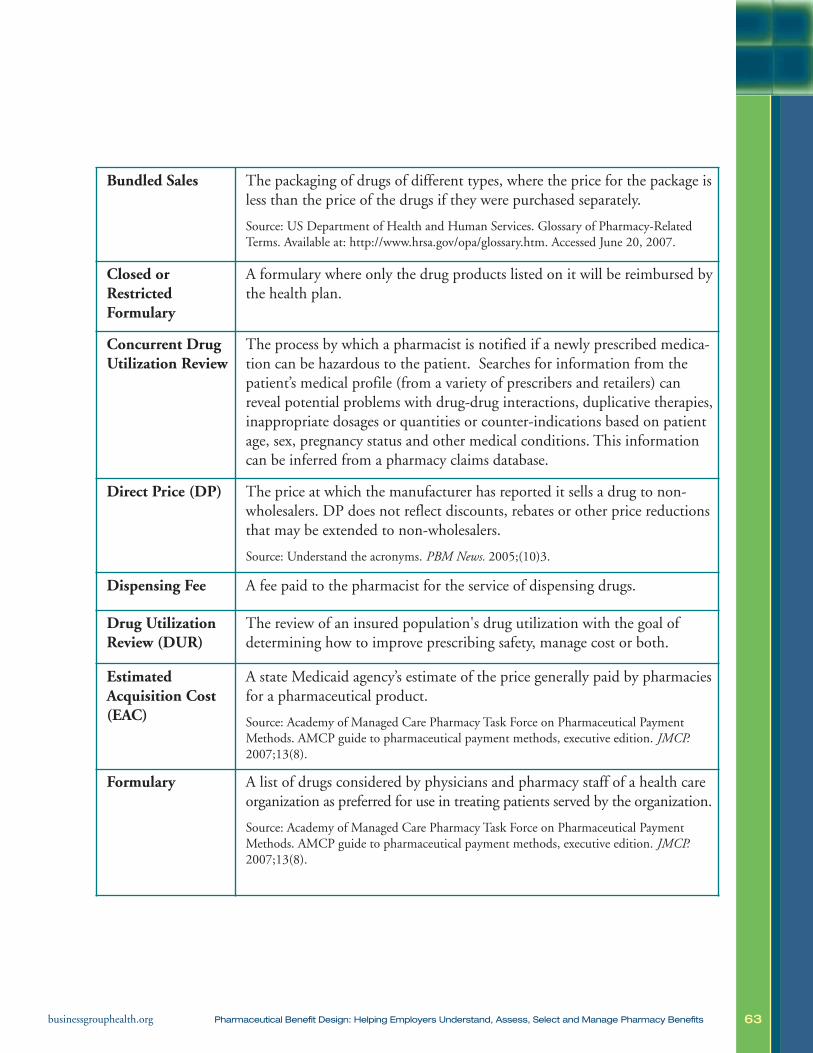
63businessgrouphealth.org Pharmaceutical Benefit Design: Helping Employers Understand, Assess, Select and Manage Pharmacy Benefits
Bundled Sales The packaging of drugs of different types, where the price for the package isless than the price of the drugs if they were purchased separately.
Source: US Department of Health and Human Services. Glossary of Pharmacy-RelatedTerms. Available at: http://www.hrsa.gov/opa/glossary.htm. Accessed June 20, 2007.
Closed orRestricted Formulary
A formulary where only the drug products listed on it will be reimbursed bythe health plan.
Concurrent DrugUtilization Review
The process by which a pharmacist is notified if a newly prescribed medica-tion can be hazardous to the patient. Searches for information from thepatient’s medical profile (from a variety of prescribers and retailers) canreveal potential problems with drug-drug interactions, duplicative therapies,inappropriate dosages or quantities or counter-indications based on patientage, sex, pregnancy status and other medical conditions. This informationcan be inferred from a pharmacy claims database.
Direct Price (DP) The price at which the manufacturer has reported it sells a drug to non-wholesalers. DP does not reflect discounts, rebates or other price reductionsthat may be extended to non-wholesalers.
Source: Understand the acronyms. PBM News. 2005;(10)3.
Dispensing Fee A fee paid to the pharmacist for the service of dispensing drugs.
Drug UtilizationReview (DUR)
The review of an insured population's drug utilization with the goal ofdetermining how to improve prescribing safety, manage cost or both.
Estimated Acquisition Cost(EAC)
A state Medicaid agency’s estimate of the price generally paid by pharmaciesfor a pharmaceutical product.
Source: Academy of Managed Care Pharmacy Task Force on Pharmaceutical PaymentMethods. AMCP guide to pharmaceutical payment methods, executive edition. JMCP.2007;13(8).
Formulary A list of drugs considered by physicians and pharmacy staff of a health careorganization as preferred for use in treating patients served by the organization.
Source: Academy of Managed Care Pharmacy Task Force on Pharmaceutical PaymentMethods. AMCP guide to pharmaceutical payment methods, executive edition. JMCP.2007;13(8).
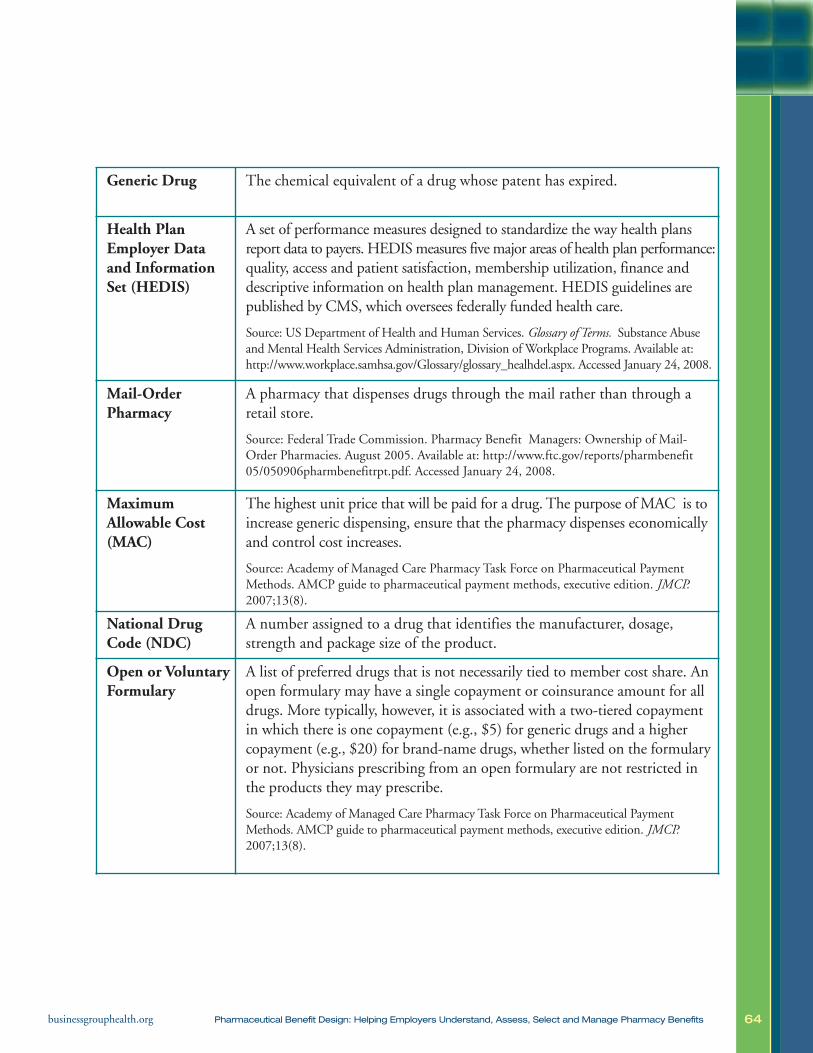
64businessgrouphealth.org Pharmaceutical Benefit Design: Helping Employers Understand, Assess, Select and Manage Pharmacy Benefits
Generic Drug The chemical equivalent of a drug whose patent has expired.
Health PlanEmployer Data and InformationSet (HEDIS)
A set of performance measures designed to standardize the way health plansreport data to payers. HEDIS measures five major areas of health plan performance:quality, access and patient satisfaction, membership utilization, finance anddescriptive information on health plan management. HEDIS guidelines arepublished by CMS, which oversees federally funded health care.
Source: US Department of Health and Human Services. Glossary of Terms. Substance Abuseand Mental Health Services Administration, Division of Workplace Programs. Available at:http://www.workplace.samhsa.gov/Glossary/glossary_healhdel.aspx. Accessed January 24, 2008.
Mail-Order Pharmacy
A pharmacy that dispenses drugs through the mail rather than through aretail store.
Source: Federal Trade Commission. Pharmacy Benefit Managers: Ownership of Mail-Order Pharmacies. August 2005. Available at: http://www.ftc.gov/reports/pharmbenefit05/050906pharmbenefitrpt.pdf. Accessed January 24, 2008.
Maximum Allowable Cost(MAC)
The highest unit price that will be paid for a drug. The purpose of MAC is toincrease generic dispensing, ensure that the pharmacy dispenses economicallyand control cost increases.
Source: Academy of Managed Care Pharmacy Task Force on Pharmaceutical PaymentMethods. AMCP guide to pharmaceutical payment methods, executive edition. JMCP.2007;13(8).
National DrugCode (NDC)
A number assigned to a drug that identifies the manufacturer, dosage,strength and package size of the product.
Open or VoluntaryFormulary
A list of preferred drugs that is not necessarily tied to member cost share. Anopen formulary may have a single copayment or coinsurance amount for alldrugs. More typically, however, it is associated with a two-tiered copaymentin which there is one copayment (e.g., $5) for generic drugs and a highercopayment (e.g., $20) for brand-name drugs, whether listed on the formularyor not. Physicians prescribing from an open formulary are not restricted inthe products they may prescribe.
Source: Academy of Managed Care Pharmacy Task Force on Pharmaceutical Payment Methods. AMCP guide to pharmaceutical payment methods, executive edition. JMCP.2007;13(8).

65businessgrouphealth.org Pharmaceutical Benefit Design: Helping Employers Understand, Assess, Select and Manage Pharmacy Benefits
Pharmacy andTherapeutics(P&T) Committee
Pharmacy benefit managers (PBM) create committees of pharmacists andphysicians from different specialties to design the PBM’s formulary. Most P&Tcommittees evaluate the drugs in particular therapeutic categories for clinicaleffectiveness and safety. In addition to evaluating all drugs currently on a PBM’snational formulary, most P&T committees evaluate therapeutic class reviewsand new drug monographs compiled from various public and private sources.
Source: Federal Trade Commission. Pharmacy Benefit M managers: Ownership of Mail-Order Pharmacies. August 2005. Available at: http://www.ftc.gov/reports/pharmbenefit05/050906pharmbenefitrpt.pdf. Accessed January 24, 2008.
Pharmacy BenefitsManager (PBM)
Organizations that manage pharmaceutical benefits for managed care organizations, other medical providers or employers.
Source: Academy of Managed Care Pharmacy Task Force on Pharmaceutical PaymentMethods. AMCP guide to pharmaceutical payment methods, executive edition. JMCP.2007;13(8).
Pharmacy Network
A group of pharmacies that have agreed to dispense prescription drugs andprovide pharmacy services to a health plan’s enrollees under specified termsand conditions. Pharmacy networks can be large or small. They allow PBMsto lower prescription drug prices by negotiating the reimbursement rate anddispensing fee with pharmacies.
Source: Henry J. Kaiser Family Foundation. Follow the Pill: Understanding the U.S. Commercial Pharmaceutical Supply Chain. March 2005.
Rebate Money returned to a payer from a prescription drug manufacturer based onuse by a covered person or purchases by a provider.
Source: Academy of Managed Care Pharmacy Task Force on Pharmaceutical PaymentMethods. AMCP guide to pharmaceutical payment methods, executive edition. JMCP.2007;13(8.).
Suggested Wholesale Price(SWP)
The manufacturer’s suggested price for drugs to be sold by wholesalers to theircustomers. Wholesalers determine the actual sales price to their customers.
Source: Understand the acronyms. PBM News. 2005;(10)3.
Therapeutic Substitution
Substitution of a prescribed drug that is not on a plan’s formulary by a formulary drug that is clinically similar to, but chemically different from,the product prescribed.
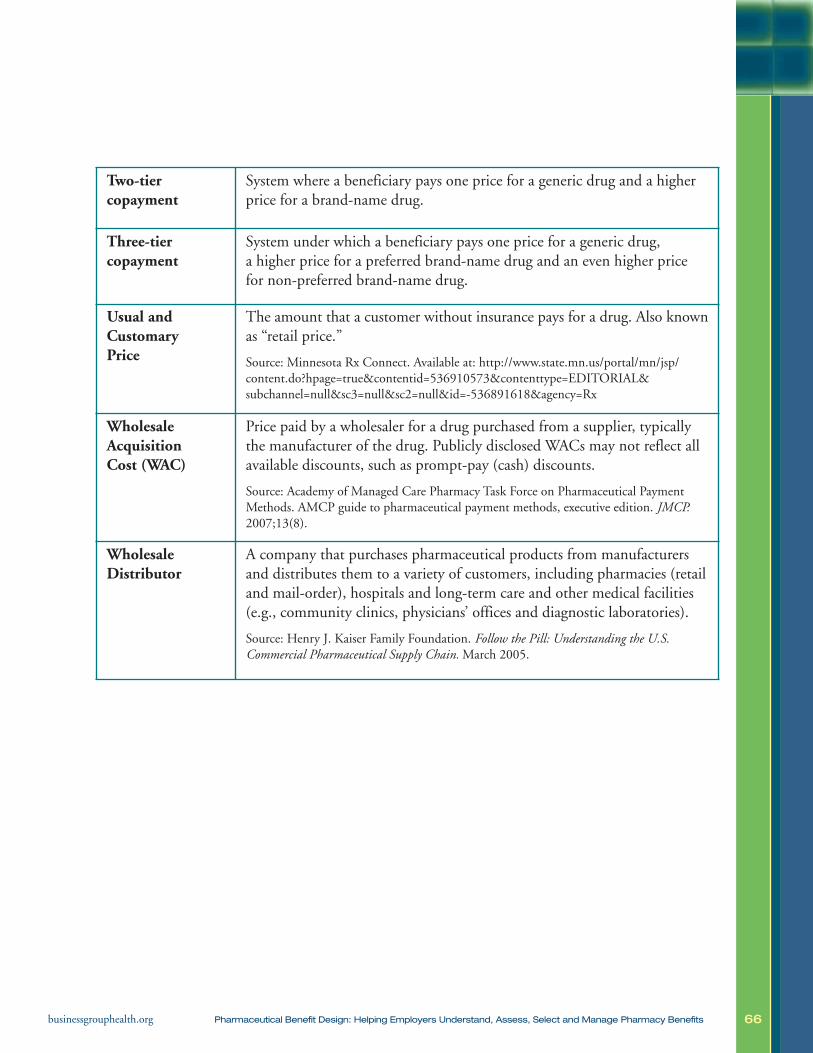
66businessgrouphealth.org Pharmaceutical Benefit Design: Helping Employers Understand, Assess, Select and Manage Pharmacy Benefits
Two-tier copayment
System where a beneficiary pays one price for a generic drug and a higherprice for a brand-name drug.
Three-tier copayment
System under which a beneficiary pays one price for a generic drug, a higher price for a preferred brand-name drug and an even higher price for non-preferred brand-name drug.
Usual and Customary Price
The amount that a customer without insurance pays for a drug. Also knownas “retail price.”
Source: Minnesota Rx Connect. Available at: http://www.state.mn.us/portal/mn/jsp/content.do?hpage=true&contentid=536910573&contenttype=EDITORIAL&subchannel=null&sc3=null&sc2=null&id=-536891618&agency=Rx
Wholesale Acquisition Cost (WAC)
Price paid by a wholesaler for a drug purchased from a supplier, typically the manufacturer of the drug. Publicly disclosed WACs may not reflect allavailable discounts, such as prompt-pay (cash) discounts.
Source: Academy of Managed Care Pharmacy Task Force on Pharmaceutical PaymentMethods. AMCP guide to pharmaceutical payment methods, executive edition. JMCP.2007;13(8).
Wholesale Distributor
A company that purchases pharmaceutical products from manufacturers and distributes them to a variety of customers, including pharmacies (retailand mail-order), hospitals and long-term care and other medical facilities(e.g., community clinics, physicians’ offices and diagnostic laboratories).
Source: Henry J. Kaiser Family Foundation. Follow the Pill: Understanding the U.S. Commercial Pharmaceutical Supply Chain. March 2005.
67businessgrouphealth.org Pharmaceutical Benefit Design: Helping Employers Understand, Assess, Select and Manage Pharmacy Benefits
Primary Author and Project Coordinator:
Elizabeth Greenbaum, MPH Center for Prevention and Health Services National Business Group on Health
Contributing Authors:
Jean Schauer Schauer Global Health, Inc.
Kristen Kraczkowsky Center for Prevention and Health Services National Business Group on Health
Contributing Staff from the National Business Group on Health
Kathryn Phillips, MPH Content Editor
Leah Trahan, MPH Content Editor
Pamela Williamson Content Development Content Editor Layout Editor Reference Editor Research Assistant
Ronald Finch, EdD Project Oversight
Wendy Slavit, MPH Content Development
This report was funded by members of the National Business Group on Health and is for their exclusive use. To protect proprietaryand confidential information, it can only be shared, in either print or electronic formats, within and among Business Group membercompanies. All other uses require permission from the National Business Group on Health.
68businessgrouphealth.org Pharmaceutical Benefit Design: Helping Employers Understand, Assess, Select and Manage Pharmacy Benefits
Pharmaceutical Council Members
We gratefully acknowledge the following Pharmaceutical Council members for conceptualiz-ing, directing and guiding this activity. The Business Group thanks the PharmaceuticalCouncil for its considerable contributions to the membership.
Angie Bricco, sanofi-pasteur
Audrietta Izlar, Verizon Communications
Cathy Moriarty, Merck/Schering-Plough Pharmaceuticals
Craig Prince, Johnson & Johnson
Don Weber, PricewaterhouseCoopers
Donna Altenpohl, GlaxoSmithKline
Duane Putnam, Pfizer Inc.
Ed Weisbart, MD, Express Scripts, Inc.
Folger Tuggle, AstraZeneca
Foong Khwan Siew, Merck & Co. Inc.
Franz Fanuka, sanofi-aventis
Gerianne Hap, Eli Lilly and Company
Gregg Gittis, formerly Eli Lilly and Company
Ilene Lichtman, Silgan Containers Corporation
Jack Mahoney, MD, Pitney Bowes, Inc.
Jan Berger, MD, Caremark RX, Inc.
Jill Berger, Marriott International, Inc., Council Chair
Jeff Warren, National Pharmaceutical Council
John Herrick, Novartis Pharmaceuticals Corporation
John Jasin, The Board of Pensions of the Presbyterian Church (USA)
Joseph Kucharski, GlaxoSmithKline
69businessgrouphealth.org Pharmaceutical Benefit Design: Helping Employers Understand, Assess, Select and Manage Pharmacy Benefits
Kimberly Westrich, National Pharmaceutical Council
Lola Chriss, Texas Instruments Incorporated
Melissa Messinger, AstraZeneca
Mike Pamukcoglu, sanofi-pasteur
Mike Rushnak, MD, formerly Caremark RX
Neal Masia, Pfizer Inc.
Noreen Thomas, Magellan Health Services
Rich Feifer, MD, Medco Health Solutions
Richard Heine, Johnson and Johnson Health Care Systems
Rita Poulin, General Electric Company
Rob Johnson, formerly Eastman Chemical Company
Scott Smith, GlaxoSmithKline
Sean Leddy, formerly Schering-Plough Pharmaceuticals
Terry Womack, formerly BellSouth Corporations
Tobe Mizels, IBM Corporation
Tom Parciak, Aon Consulting, Inc.
Pharmaceutical Council Editorial Board
70businessgrouphealth.org Pharmaceutical Benefit Design: Helping Employers Understand, Assess, Select and Manage Pharmacy Benefits
Ed Weisbart, MD, Express Scripts, Inc.
Kimberly Westrich, National Pharmaceutical Council
Pharmaceutical Council Contributing Editors
Angie Bricco, sanofi-pasteur
Cathy Moriarty, Merck/Schering-Plough Pharmaceuticals
Craig Prince, Johnson & Johnson
Donna Altenpohl, GlaxoSmithKline
Duane Putnam, Pfizer Inc.
Ed Weisbart, MD, Express Scripts, Inc.
Jack Mahoney, MD, Pitney Bowes, Inc.
Kimberly Westrich, National Pharmaceutical Council
Rich Feifer, MD, Medco Health Solutions
Tom Parciak, Aon Consulting, Inc.