Embed Size (px)
Citation preview
1
Pharmaceutical Industry
2
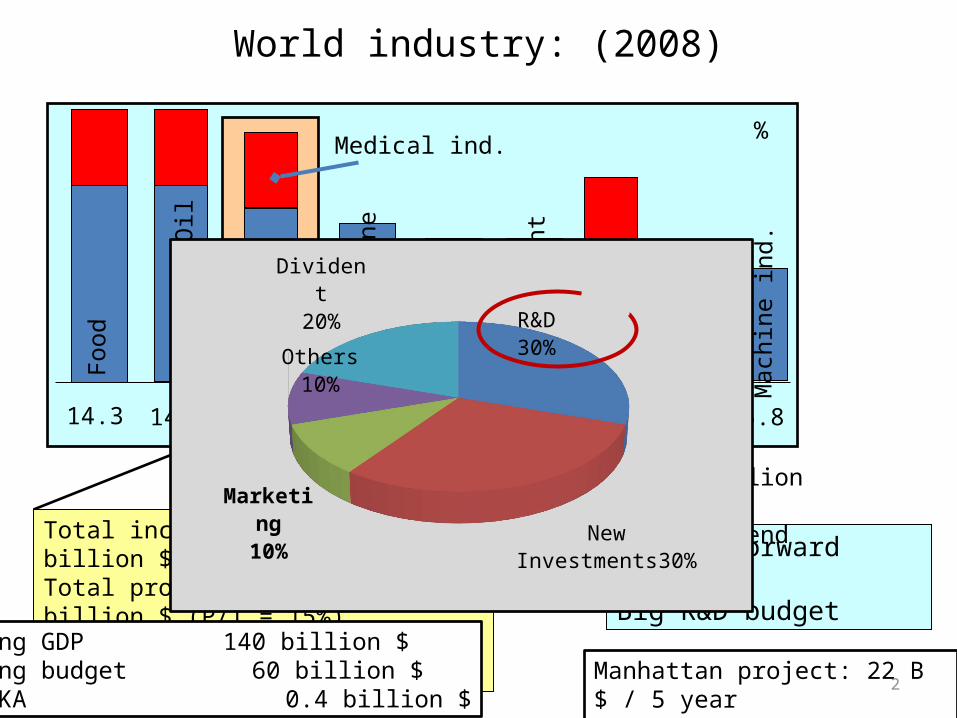
World industry: (2008)
Min
ing
and
Oi l
War
ind.
Ente
rtai
nmen
t
Phar
ma
Medical ind.
Straighforward researchBig R&D budget
Food
Sma l
l mac
hine
Toba
coo
14.3 14.1 11.1 8.7 7.3 7.1 6.8 6.1
Mac
hine
ind.
5.8
Total income: ~ 640 billion $ (+10 %)Total profit: ~ 90 billion $ (P/I = 15%)R&D: ~ 30 billion $ (30%)
Manhattan project: 22 B $ / 5 yearApollo program: 98 B $ / 14 year
Hung GDP 140 billion $ Hung budget 60 billion $OTKA 0.4 billion $
ca. 2 million employee200 thousend R&D(!!!)
%
Tele
com
. Com
p .
R&D30%
New Investments30%
Market-ing
10%
Others10%
Divident20%
3
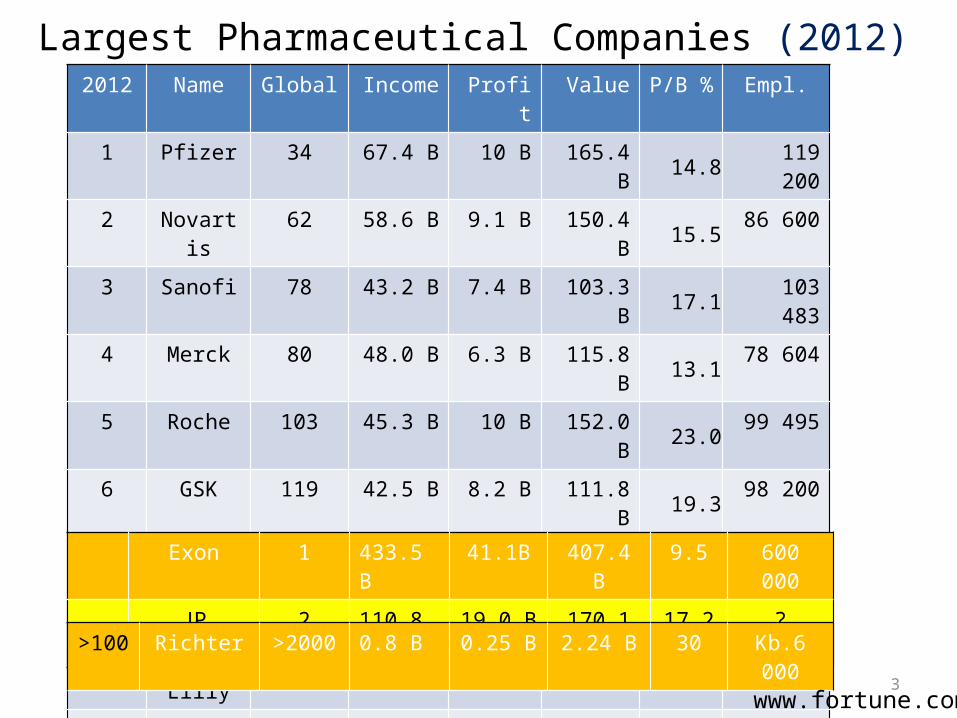
Largest Pharmaceutical Companies (2012)2012 Name Global Income Profit Value P/B % Empl.
1 Pfizer 34 67.4 B 10 B 165.4 B 14.8 119 200
2 Novartis 62 58.6 B 9.1 B 150.4 B 15.5 86 600
3 Sanofi 78 43.2 B 7.4 B 103.3 B 17.1 103 483
4 Merck 80 48.0 B 6.3 B 115.8 B 13.1 78 604
5 Roche 103 45.3 B 10 B 152.0 B 23.0 99 495
6 GSK 119 42.5 B 8.2 B 111.8 B 19.3 98 200
7 Abbott L 127 38.9 B 4.7 B 93.4 B 12.1 67 400
8 AstraZ 142 32.4 B 9.6 B 58.0 B 29.6 68 697
9 Eli Lilly 208 24.3 B 4.3 B 46.6 B 17.7 58 900
10 BMS 217 21.2 B 3.7 B 56.0 B 17.4 50 527
11 TEVA 223 17.2 B 2.6 B 41.0 B 15.1 42 000
20-25 Servier - 3.8 B 0.8 B - 21.0 25 000
Exon 1 433.5 B 41.1B 407.4 B 9.5 600 000
JP Morgan 2 110.8 B 19.0 B 170.1 B 17.2 ?
>100 Richter >2000 0.8 B 0.25 B 2.24 B 30 Kb.6 000
www.fortune.com
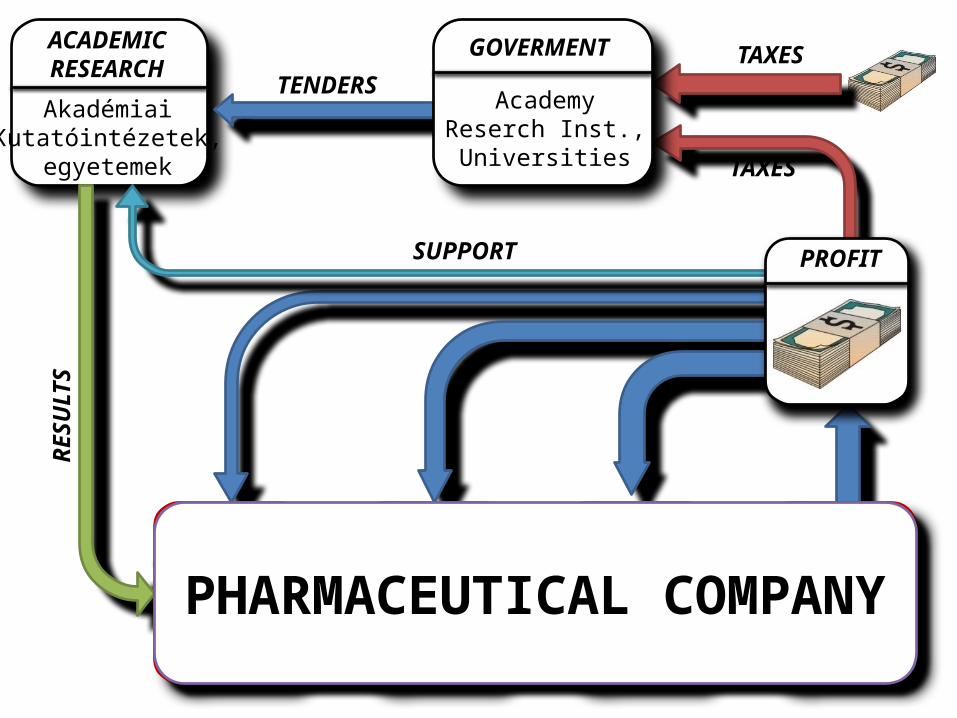
ACADEMICRESEARCH
AkadémiaiKutatóintézetek,
egyetemek
PROFIT
TAXES
TAXESTENDERS
SUPPORT
RESU
LTS
DRUGPRODUCTIONRESEARCH DEVELOPMENT
B
AD( )n
CLINICS
GOVERMENT
AcademyReserch Inst.,Universities
PHARMACEUTICAL COMPANY
5
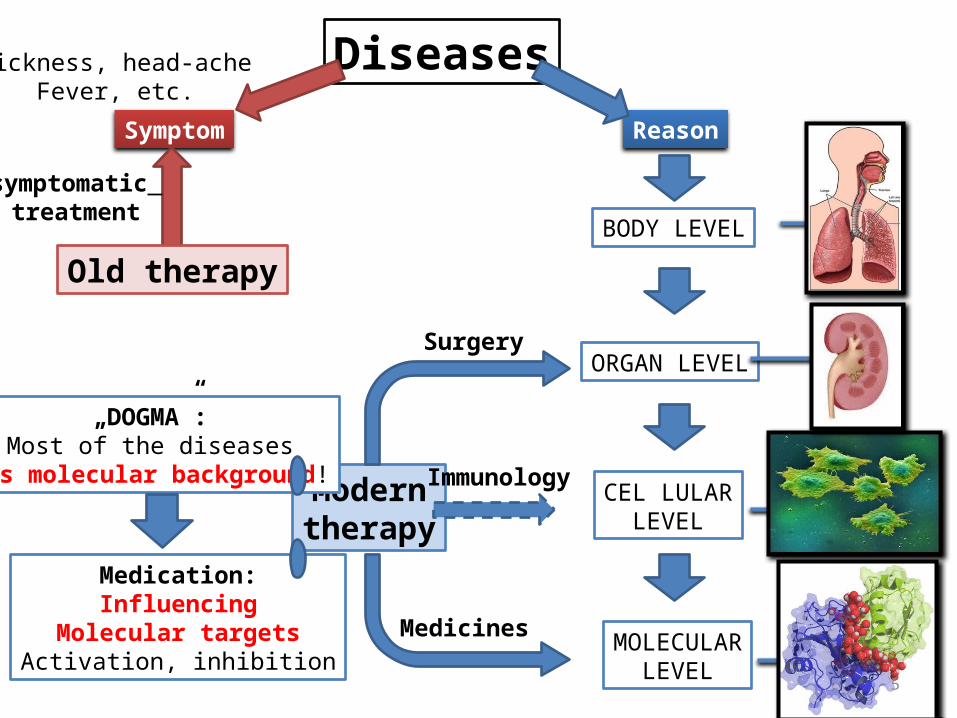
Diseases
Symptom Reason
BODY LEVEL
ORGAN LEVEL
CEL LULARLEVEL
MOLECULARLEVEL
Moderntherapy
Surgery
Immunology
Medicines
sickness, head-acheFever, etc.
symptomatic treatment
„DOGMA”:Most of the diseases
has molecular background!
Old therapy
Medication:Influencing
Molecular targetsActivation, inhibition
6
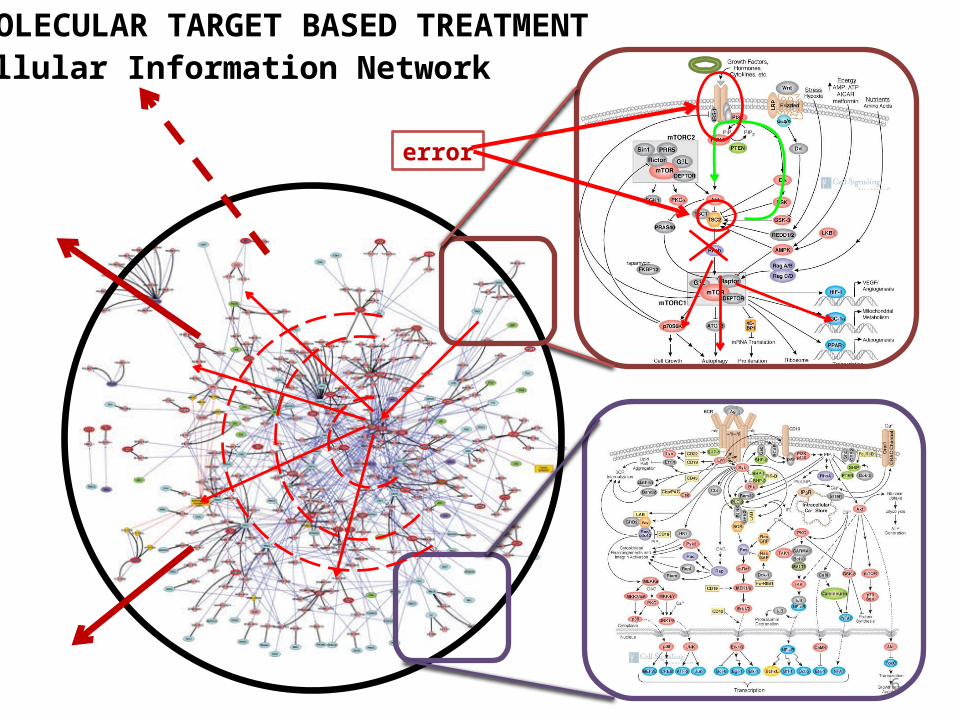
MOLECULAR TARGET BASED TREATMENT
error
Cellular Information Network
7
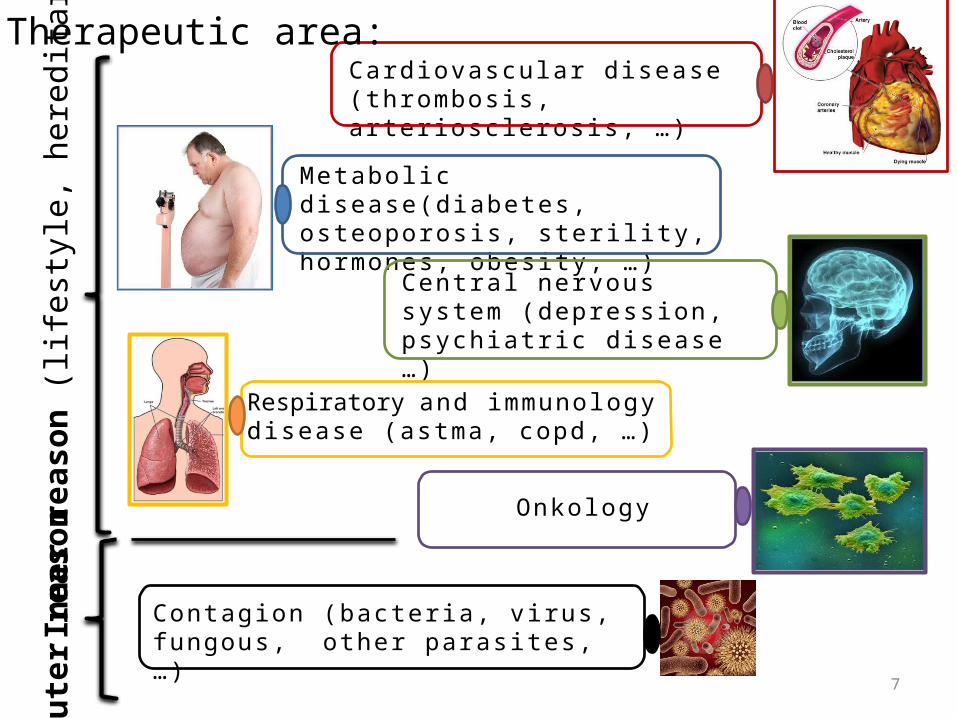
Card iovas cu lar d i s eas e ( thrombos is , a r ter ios c le ros i s , … )
Metabol i c d i s eas e(d iabete s , oste oporos i s , ster i l i ty, hormones , obes i ty, … )
Centra l ne r vous system (de pre ss ion , psych iat r i c d i s e as e … )
Contag ion (bacte r ia , v i rus , fungous , o ther paras i tes , … )
Onko log y
Respiratory and immunolog y d i s eas e (astma, copd, … )
Out
er re
ason
Inne
r rea
son
(life
styl
e, h
ered
itary
)Therapeutic area:
8
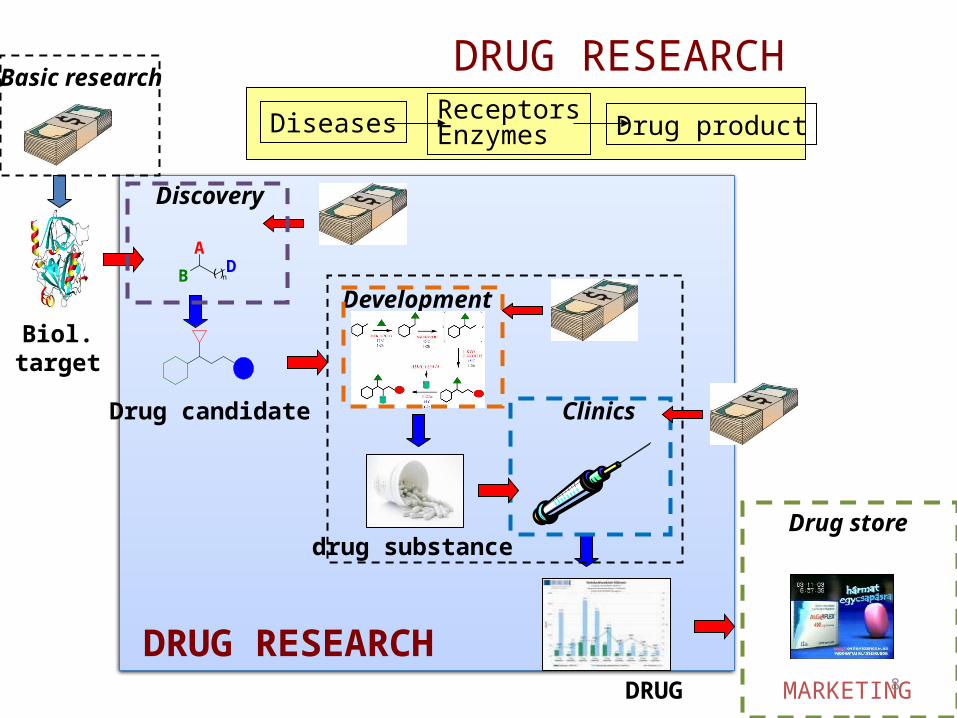
DRUG RESEARCH
Discovery
Development
Basic research
Drug store
B
AD( )n
Clinics
MARKETING
DRUG RESEARCH
Drug candidate
drug substance
DRUG
Diseases ReceptorsEnzymes Drug product
Biol.target
PRECLINICS PHASE I PHASE II PHASE IIIResearch LICENC
HTS
Lead opt.
Lead
cpd
Chemical dev.
Production of Clinical batches
Cand
idat
e
Industrial batches
marketing
Synt
hetic
rout
e
tech
nolo
gy
appr
oval
Dru
g pr
oduc
t
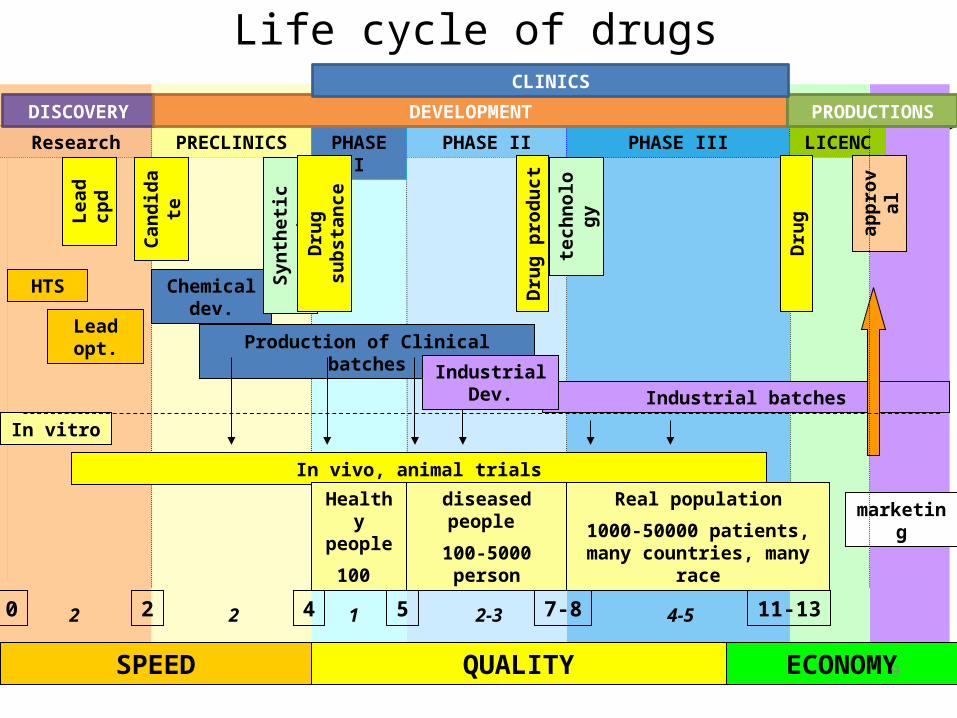
In vivo, animal trials
Healthy people
100
diseased people
100-5000 person
Real population
1000-50000 patients, many countries, many race
SPEED QUALITY ECONOMY
Life cycle of drugs
In vitro
Industrial Dev.
9
DISCOVERY DEVELOPMENT PRODUCTIONS
CLINICS
20 4 5 7-8 11-132 2 1 2-3 4-5
Dru
g
Dru
g su
bsta
nce
10
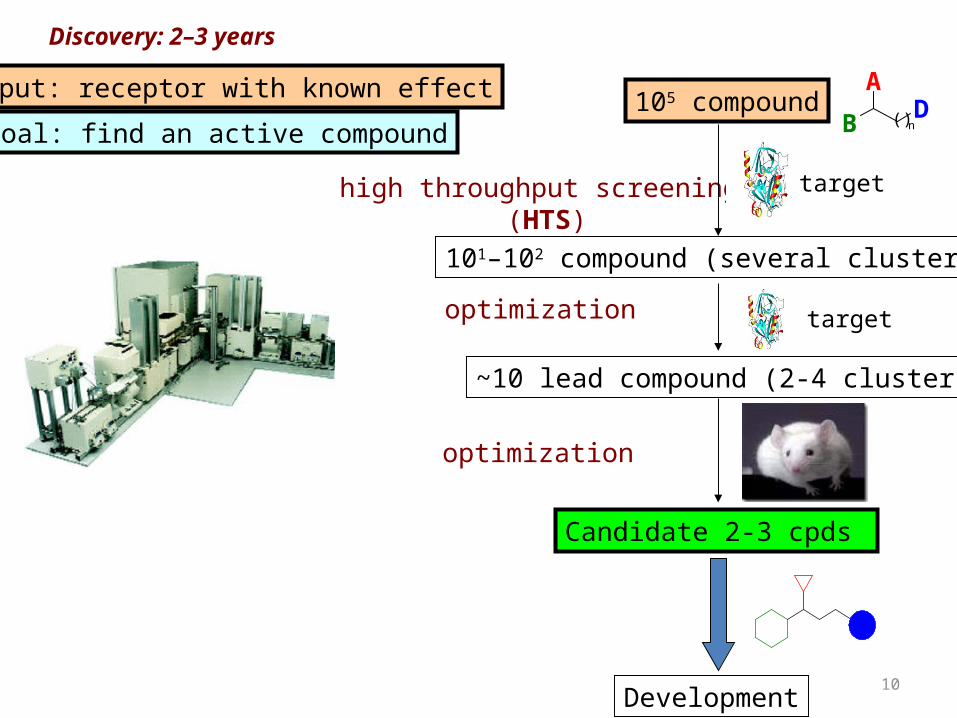
Discovery: 2–3 years
Goal: find an active compound
high throughput screening (HTS)
~10 lead compound (2-4 clusters)
105 compound
101–102 compound (several clusters)
Candidate 2-3 cpds
optimization
optimization
B
AD( )n
Development
Input: receptor with known effect
target
target
11
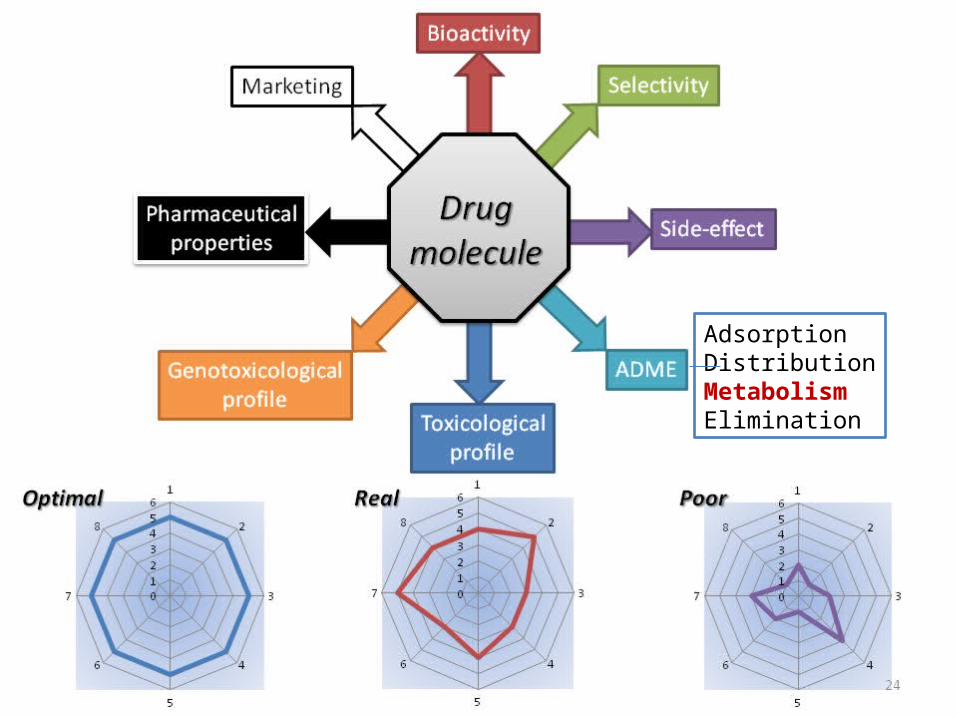
Bioactivity
Selectivity
Side-effect
ADME
Toxicologicalprofile
Genotoxicologicalprofile
Marketing
Pharmaceuticalproperties
Drugmolecule
Series1
0
5
Series1
0
5
Series1
0
5
RealOptimal Poor
AdsorptionDistributionMetabolismElimination
12
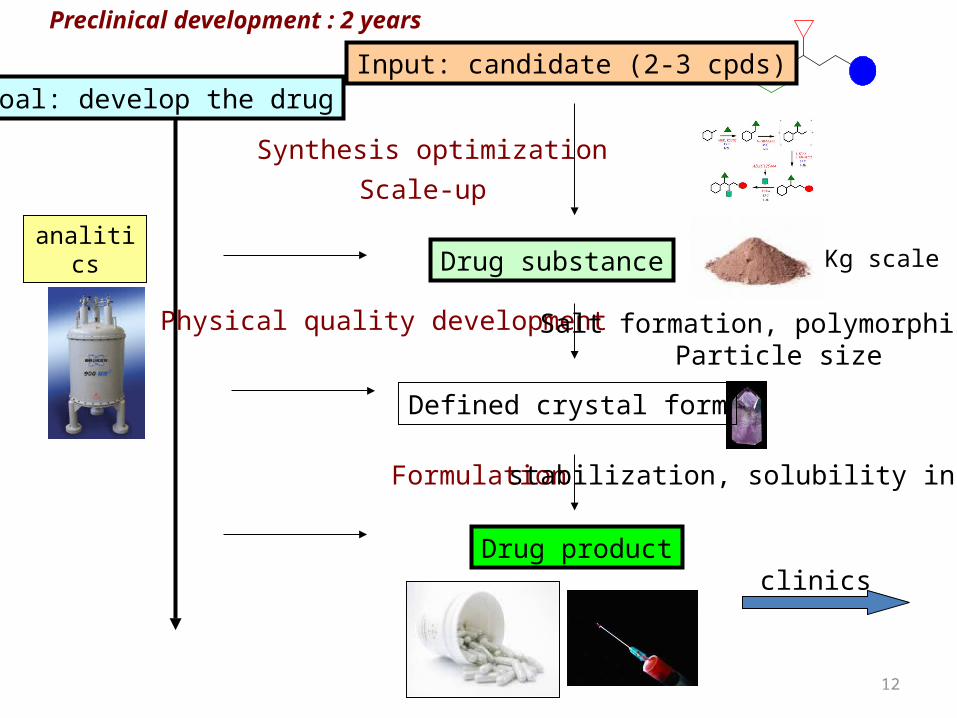
Preclinical development : 2 years
Synthesis optimizationScale-up
Formulation
Physical quality development
analitics
Salt formation, polymorphism, Particle size
stabilization, solubility increase
clinics
Defined crystal form
Drug product
Drug substance
Input: candidate (2-3 cpds)Goal: develop the drug
Kg scale
13
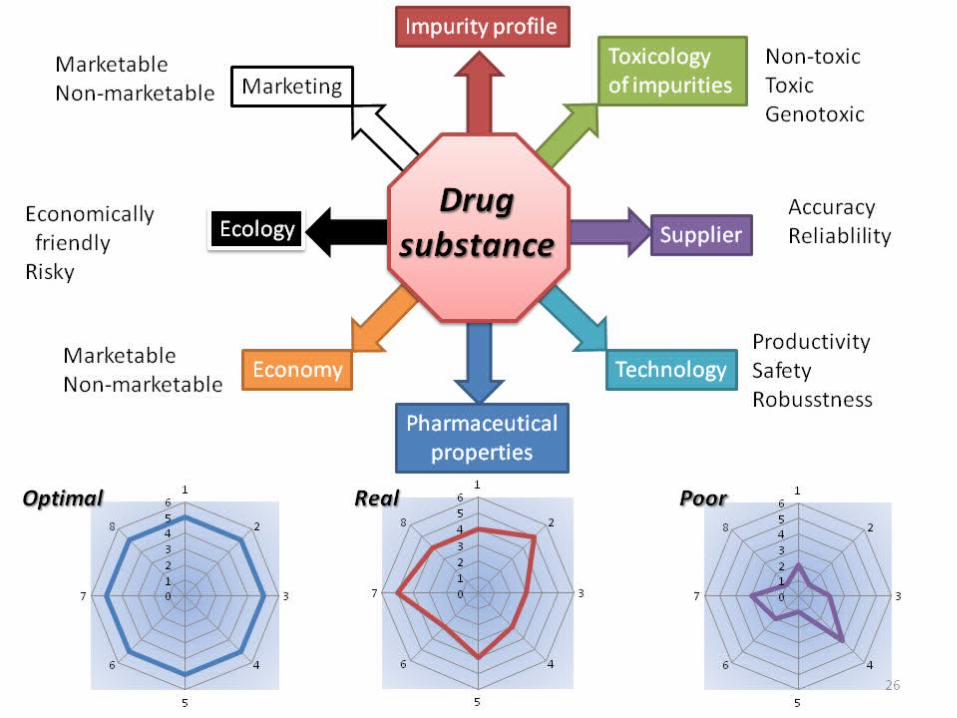
Impurity profileToxicologyof impurities
Supplier
TechnologyEconomy
Ecology
Marketing
Pharmaceuticalproperties
Drugsubstance
Series1
0
5
Series1
0
5
Series1
0
5
ProductivitySafetyRobusstness
RealOptimal Poor
AccuracyReliablility
Non-toxicToxicGenotoxic
MarketableNon-marketable
Economically friendlyRisky
MarketableNon-marketable
14
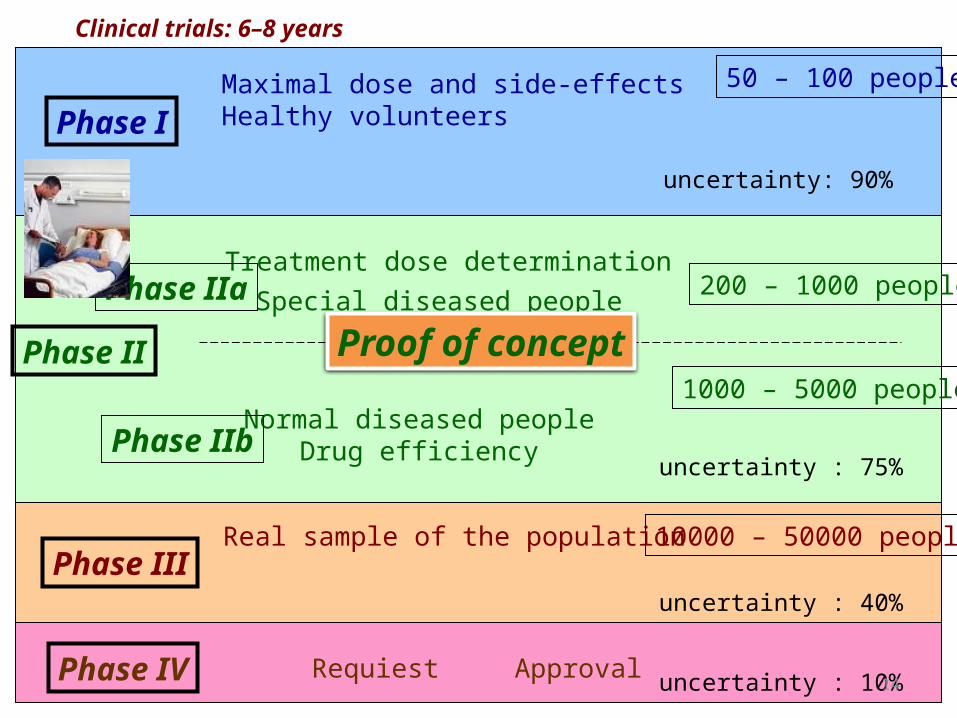
Clinical trials: 6–8 years
Phase I
Phase II
Phase III
Treatment dose determinationSpecial diseased people
Normal diseased peopleDrug efficiency
Real sample of the population
Maximal dose and side-effects Healthy volunteers
50 – 100 people
200 – 1000 people
1000 – 5000 people
Phase IIa
Phase IIb
10000 – 50000 people
Phase IV Requiest
uncertainty: 90%
uncertainty : 75%
uncertainty : 40%
uncertainty : 10%Approval
Proof of concept
15
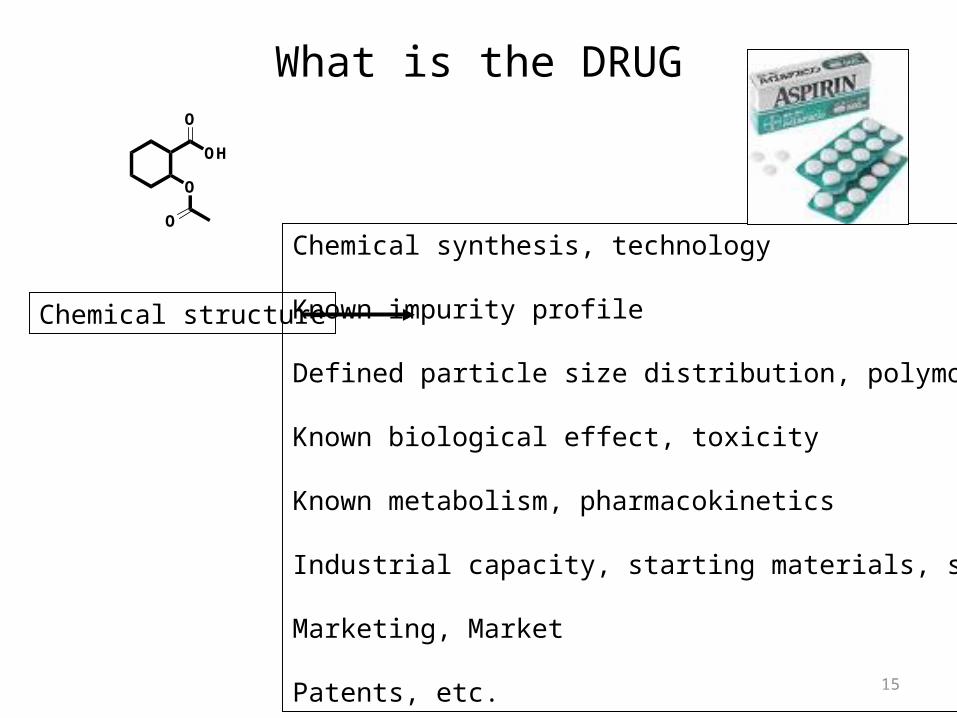
What is the DRUG
O
OH
O
O
Chemical structure
Chemical synthesis, technology
Known impurity profile
Defined particle size distribution, polymorphism
Known biological effect, toxicity
Known metabolism, pharmacokinetics
Industrial capacity, starting materials, suppliers
Marketing, Market
Patents, etc.
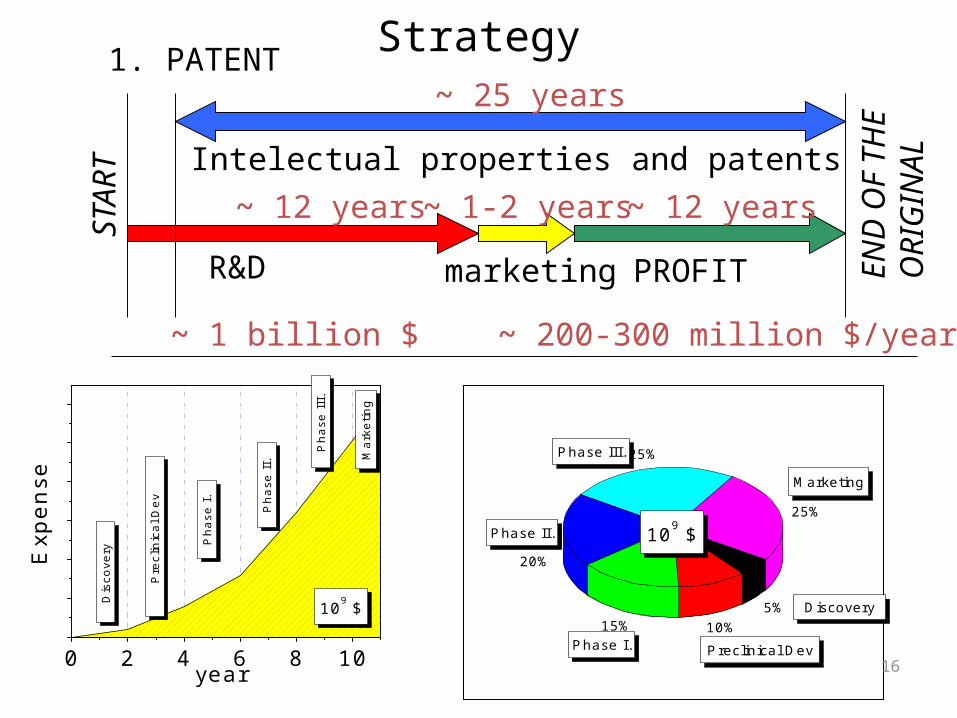
Strategy
R&D PROFIT
Intelectual properties and patents
marketing
~ 25 years
~ 12 years ~ 12 years~ 1-2 years
~ 1 billion $ ~ 200-300 million $/year
0 2 4 6 8 10
109 $
Mar
ketin
g
Pha
se I
II.
Pha
se I
.
Pha
se I
I.
Pre
clin
ical
Dev
Dis
cove
ryExp
en
se
year
109 $
Discovery
Marketing
Preclinical Dev
Phase III.
Phase II.
Phase I.
25%
25%
20%
15% 10%5%
STAR
T
END
OF
THE
ORI
GIN
AL
1. PATENT
16
17
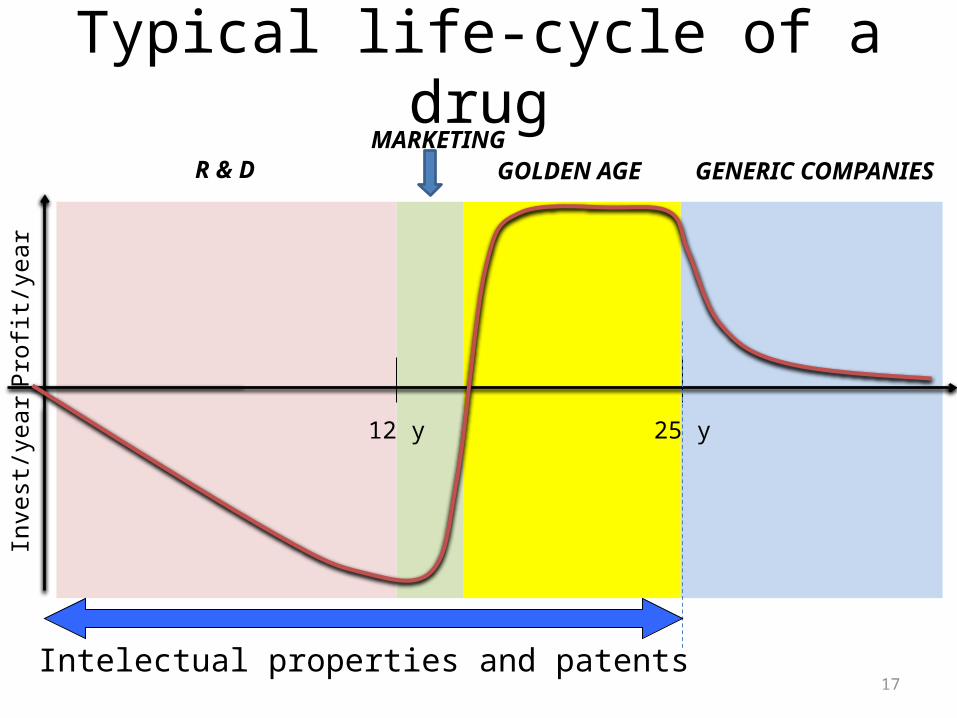
Typical life-cycle of a drug
12 y 25 y
R & D GENERIC COMPANIESGOLDEN AGEMARKETING
Intelectual properties and patents
Profi
t/ye
arIn
vest
/yea
r
18
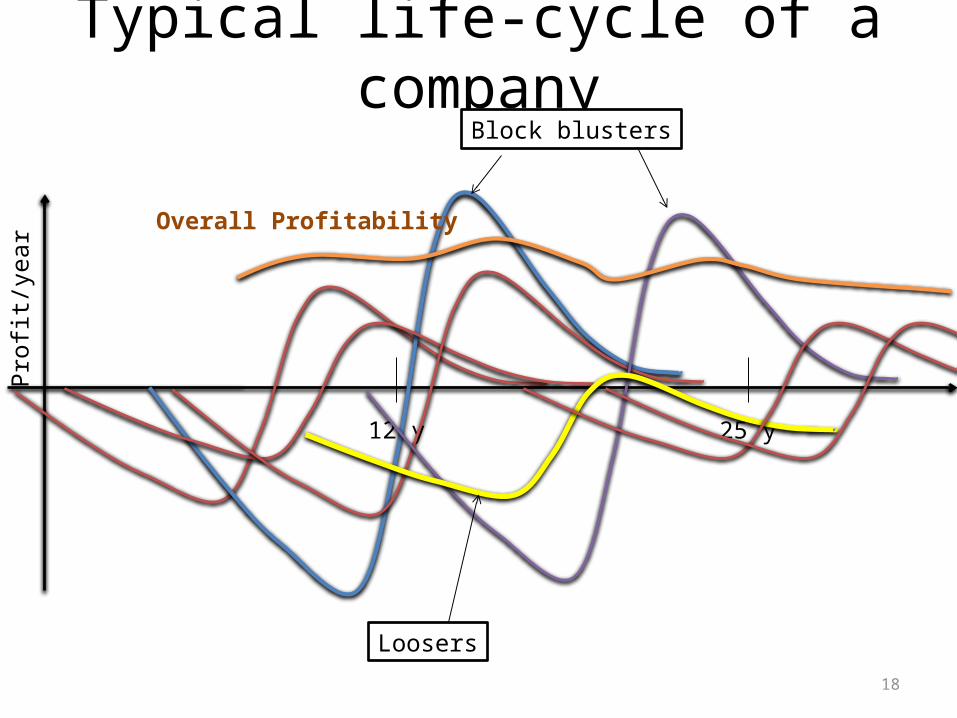
Typical life-cycle of a company
12 y 25 y
Block blusters
Overall Profitability
Profi
t/ye
ar
Loosers
19
0
15
30
45
60
1963
1966
1969
1972
1975
1978
1981
1984
1987
1990
1993
1996
1999
2002
Pat
ents
0
17
34
R=
D exp
ense
Billio
n $)
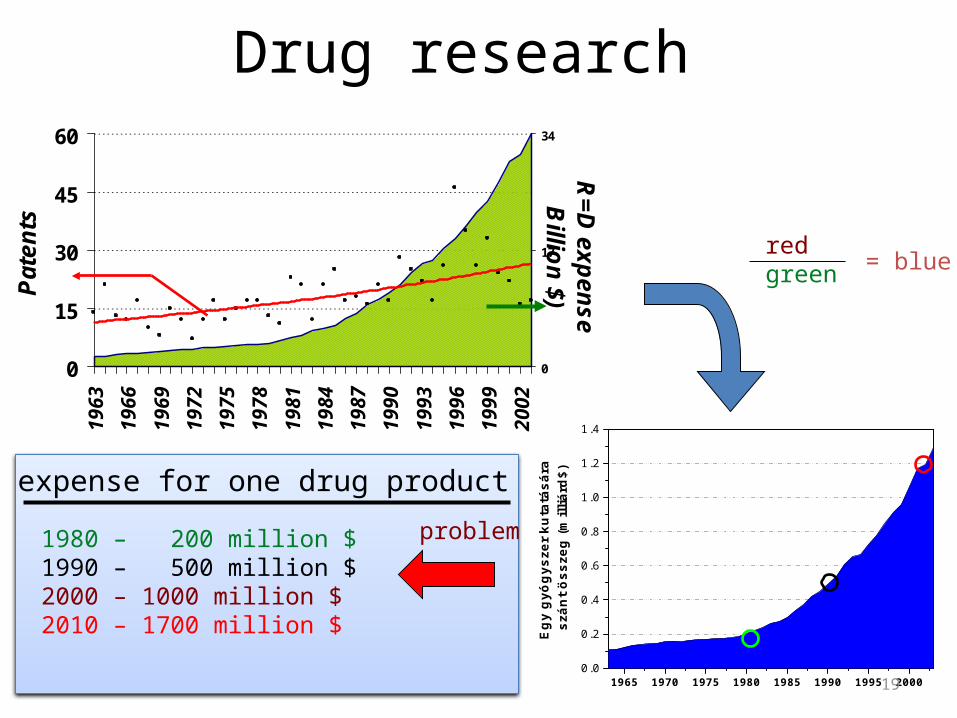
Drug research
1965 1970 1975 1980 1985 1990 1995 20000.0
0.2
0.4
0.6
0.8
1.0
1.2
1.4
Eg
y g
yóg
ysze
r ku
tatá
sára
szá
nt
öss
zeg
(m
illiá
rd$)
problem
redgreen = blue
1980 – 200 million $1990 – 500 million $2000 – 1000 million $2010 – 1700 million $
R$D expense for one drug product
20
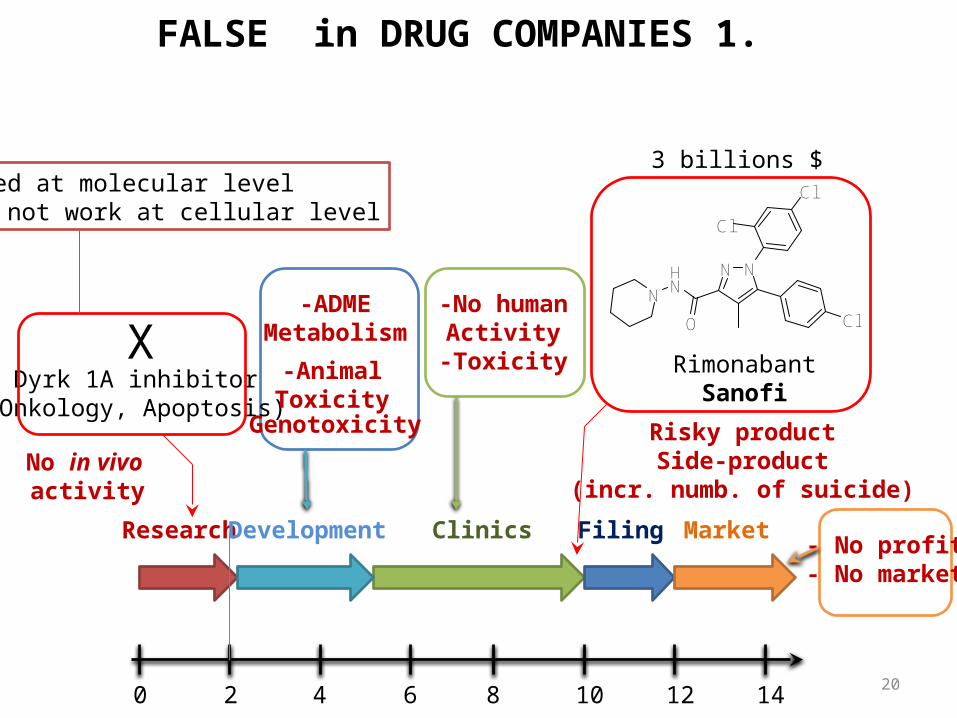
Dyrk 1A inhibitor(Onkology, Apoptosis)
0 2 4 6 8 10 12 14
Research Clinics Filing
NNHN
O
N
Cl
Cl
Cl
X
No in vivo activity
-AnimalToxicity
-ADMEMetabolism
Development Market
RimonabantSanofi
Genotoxicity Risky productSide-product
(incr. numb. of suicide)
FALSE in DRUG COMPANIES 1.
3 billions $
-No humanActivity-Toxicity
Worked at molecular levelDoes not work at cellular level
- No profit- No market
21
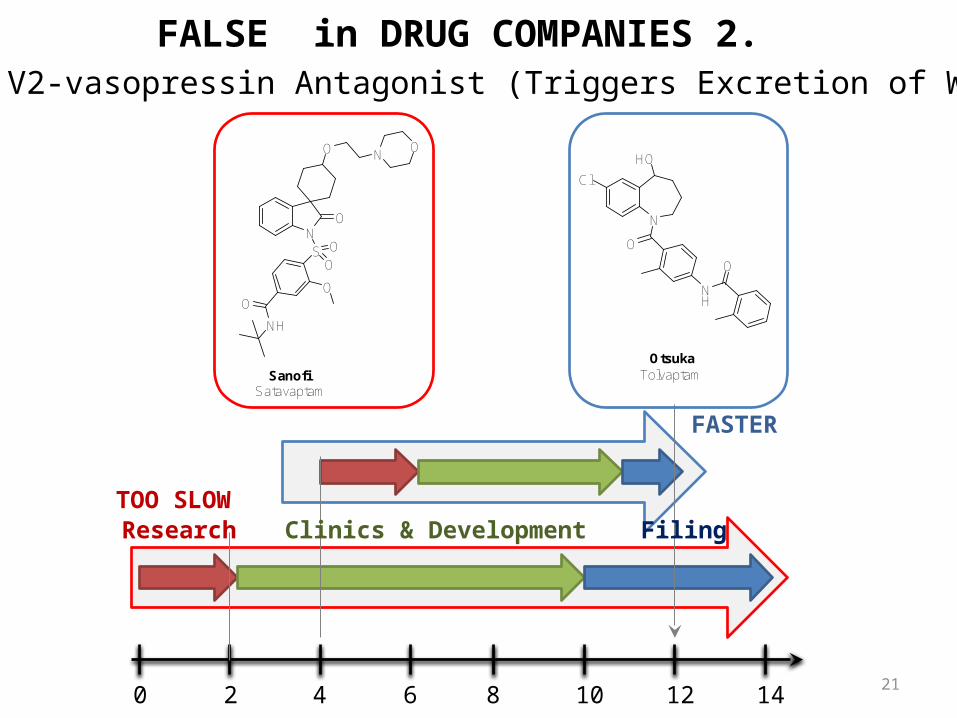
Selective V2-vasopressin Antagonist (Triggers Excretion of Water Only)
NS
O
O N
OO
O
NH
O
O
SatavaptamSanofi
0 2 4 6 8 10 12 14
N
HO
Cl
O
NH
O
TolvaptamOtsuka
Research Clinics & Development Filing
FALSE in DRUG COMPANIES 2.
FASTER
TOO SLOW
22
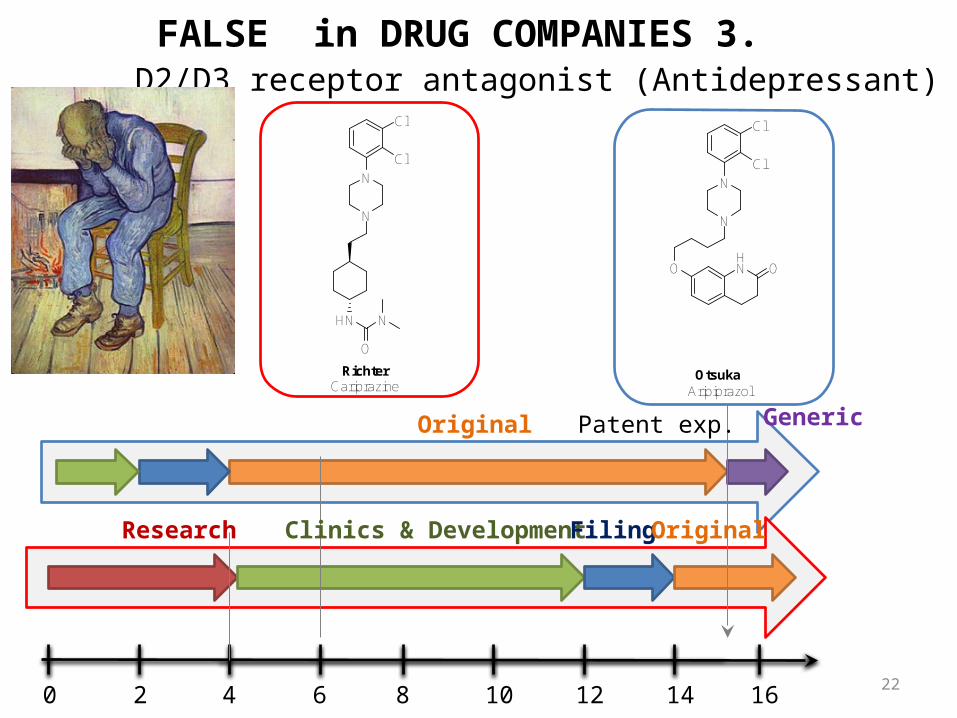
D2/D3 receptor antagonist (Antidepressant)
0 2 4 6 8 10 12 14
Research Clinics & Development Filing
N
N
HN
O
N
Cl
Cl
CariprazineRichter
N
N
Cl
Cl
OHN O
AripiprazolOtsuka
Original Generic
Original
16
FALSE in DRUG COMPANIES 3.
Patent exp.
23
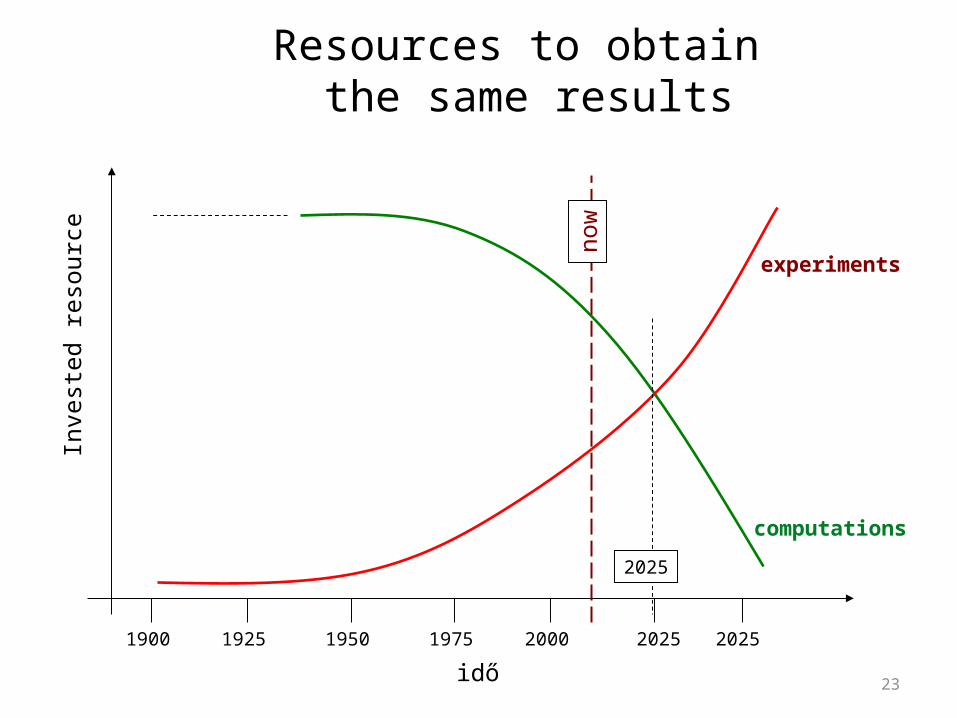
Resources to obtain the same results
idő
n ow
20251900 1925 1950 1975 2000 2025
2025
computations
experiments
Inve
sted
res
ourc
e
24
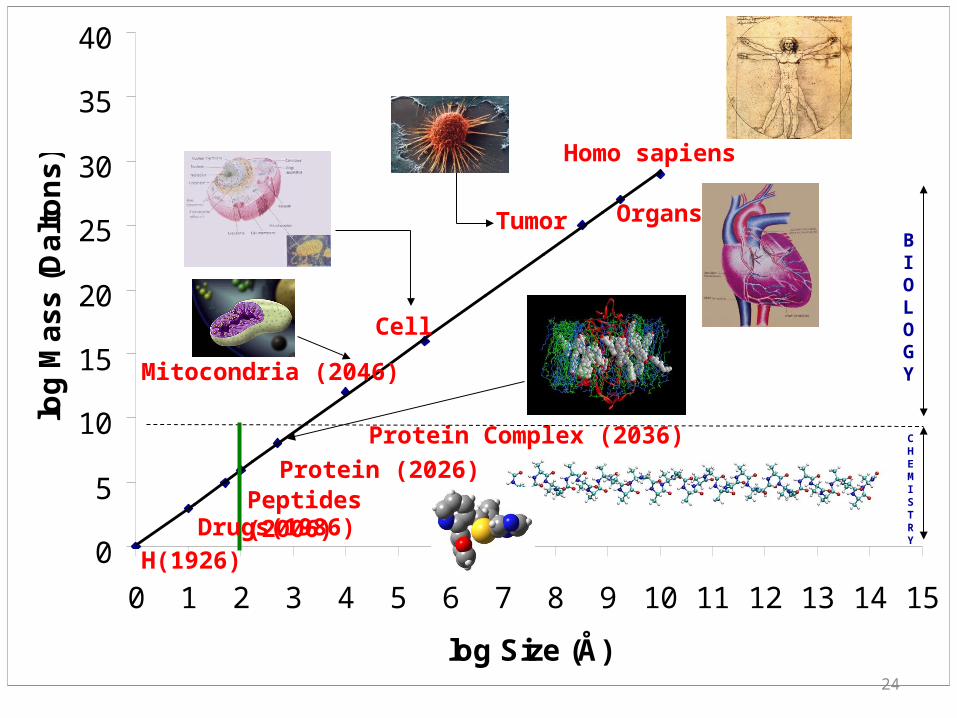
0
5
10
15
20
25
30
35
40
0 1 2 3 4 5 6 7 8 9 10 11 12 13 14 15
log Size (Å)
log
Ma
ss
(D
alt
on
s)
H(1926)
Peptides (2006)Protein (2026)
Protein Complex (2036)
Mitocondria (2046)
Cell
CHEMISTRY
BIOLOGY
Tumor Organs
Homo sapiens
Drugs(1986)
25
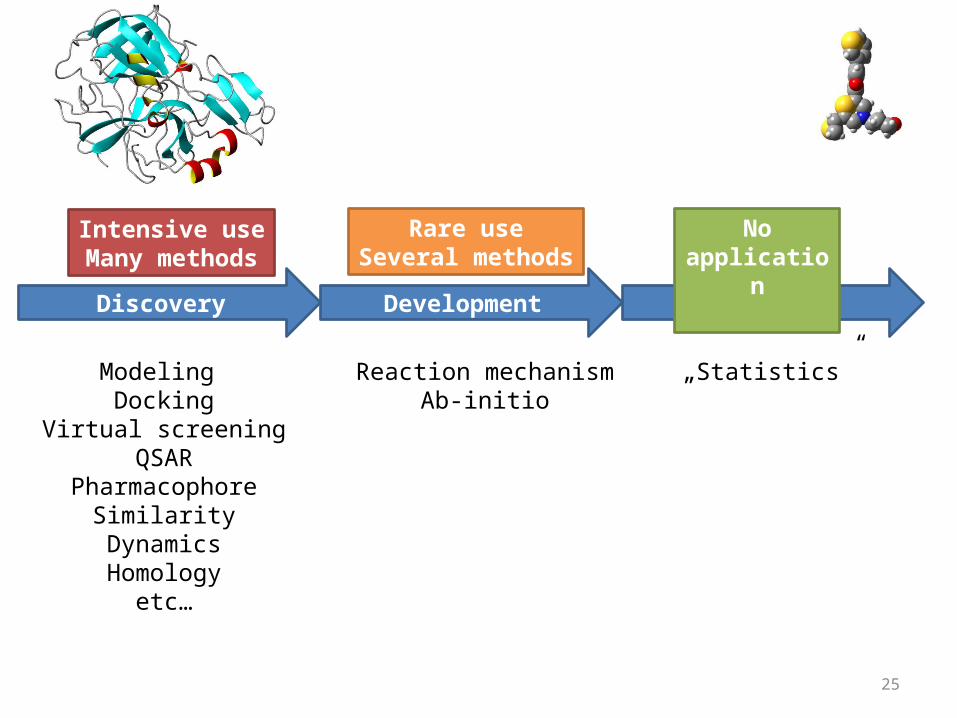
Discovery Development Clinics
Reaction mechanismAb-initio
„Statistics”
Intensive useMany methods
Rare useSeveral methods
No application
Modeling Docking
Virtual screeningQSAR
PharmacophoreSimilarityDynamicsHomology
etc…
26
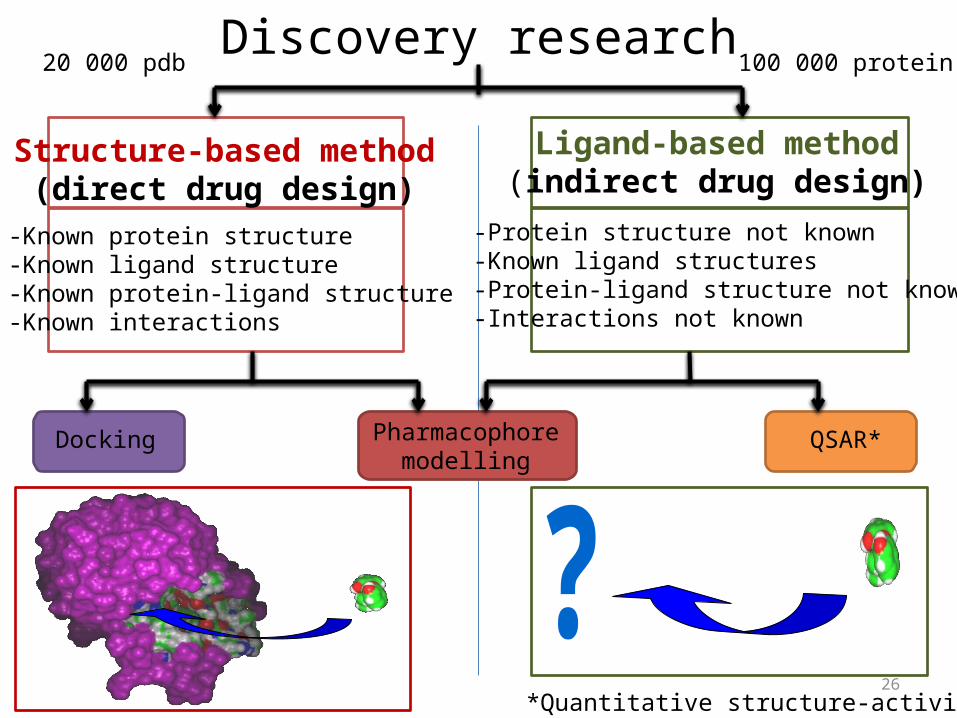
Discovery research
Structure-based method(direct drug design)
Ligand-based method(indirect drug design)
-Known protein structure-Known ligand structure-Known protein-ligand structure-Known interactions
-Protein structure not known-Known ligand structures-Protein-ligand structure not known-Interactions not known
Docking Pharmacophoremodelling
QSAR*
*Quantitative structure-activity relationship
20 000 pdb 100 000 protein
27
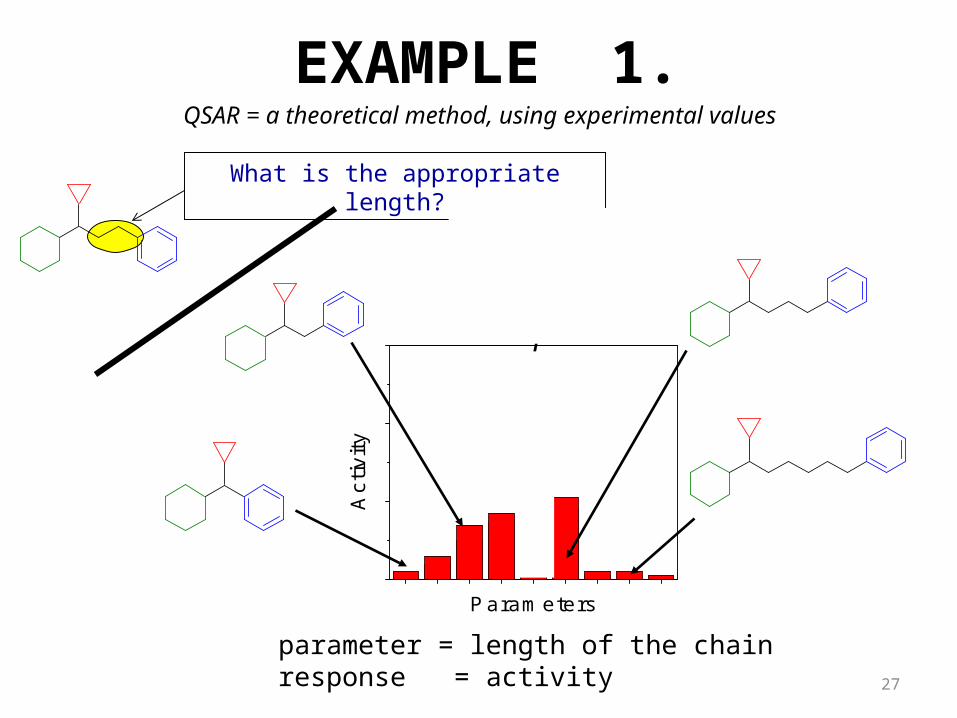
Act
ivity
Parameters
EXAMPLE 1.
parameter = length of the chainresponse = activity
What is the appropriate length?
QSAR = a theoretical method, using experimental values
28
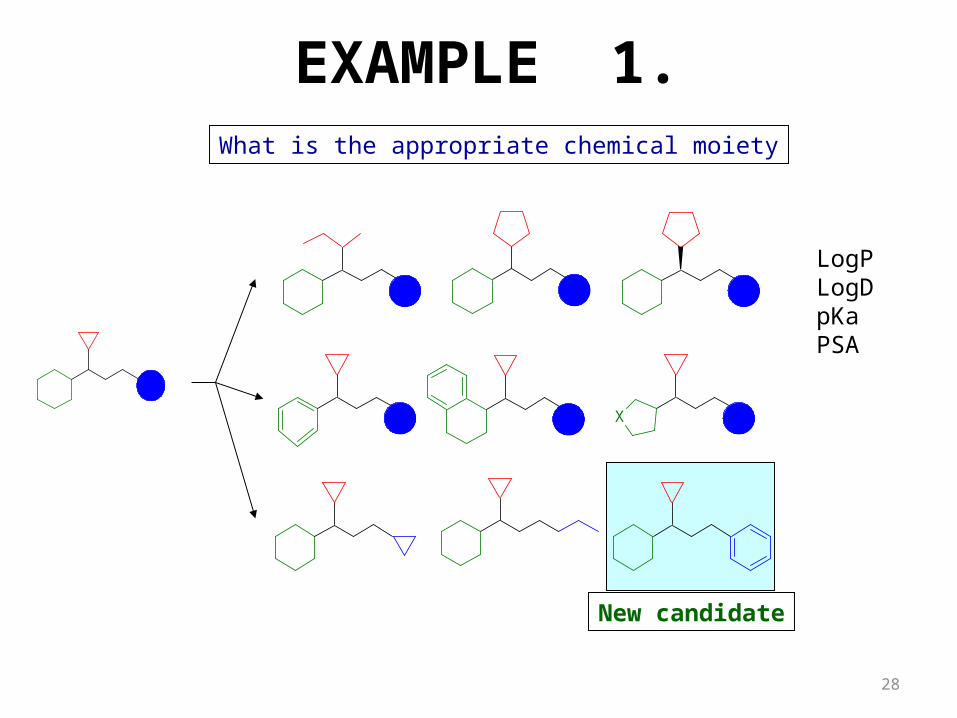
X
What is the appropriate chemical moiety
New candidate
EXAMPLE 1.
LogPLogDpKaPSA
29
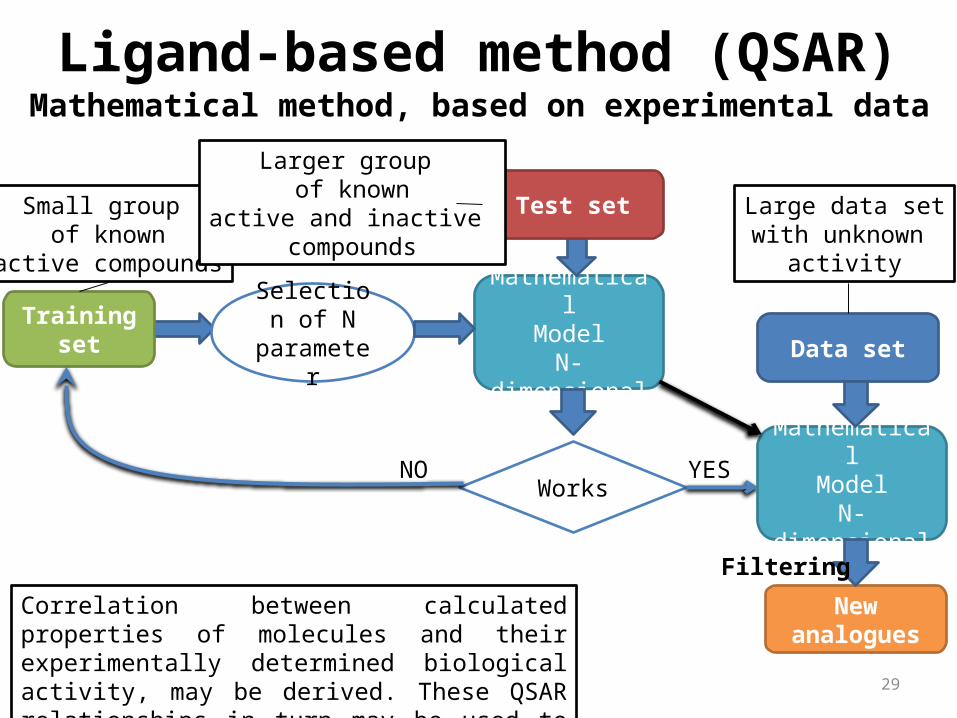
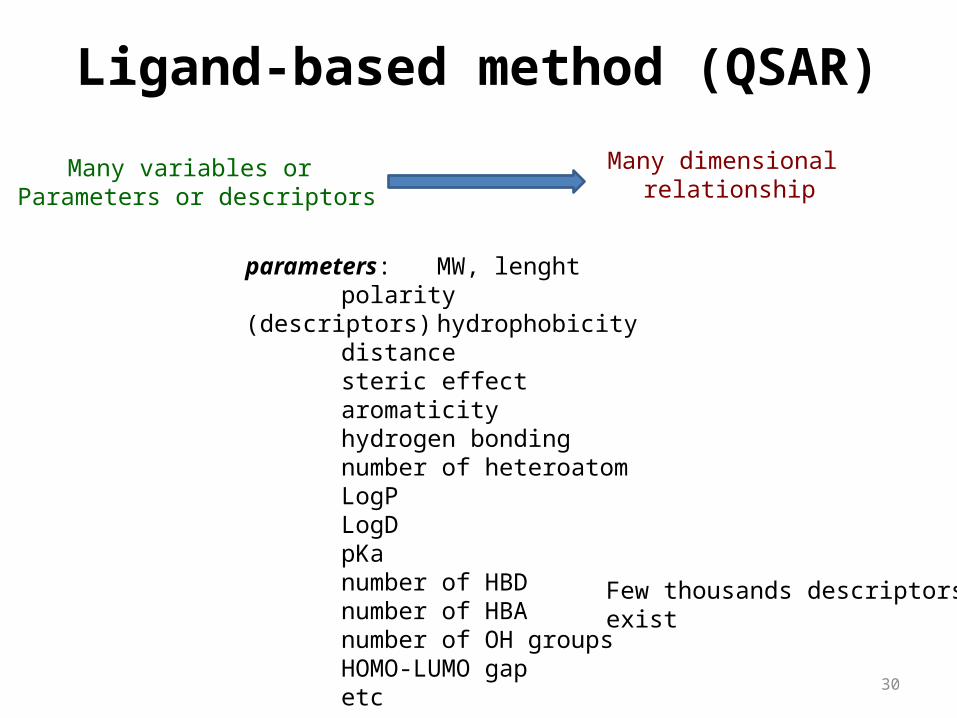
Ligand-based method (QSAR)
Correlation between calculated properties of molecules and their experimentally determined biological activity, may be derived. These QSAR relationships in turn may be used to predict the activity of new analogs.
Small group of known
active compounds
Selection of N parameter
MathematicalModel
N-dimensional Training set
Test set
WorksNO YES
Data set
MathematicalModel
N-dimensional
New analogues
Larger group of known
active and inactive compounds
Large data setwith unknown
activity
Mathematical method, based on experimental data
Filtering
30
Many variables or Parameters or descriptors
parameters: MW, lenghtpolarity
(descriptors) hydrophobicitydistancesteric effectaromaticityhydrogen bondingnumber of heteroatomLogPLogDpKanumber of HBDnumber of HBAnumber of OH groupsHOMO-LUMO gapetc
Ligand-based method (QSAR)Many dimensional
relationship
Few thousands descriptorsexist
31
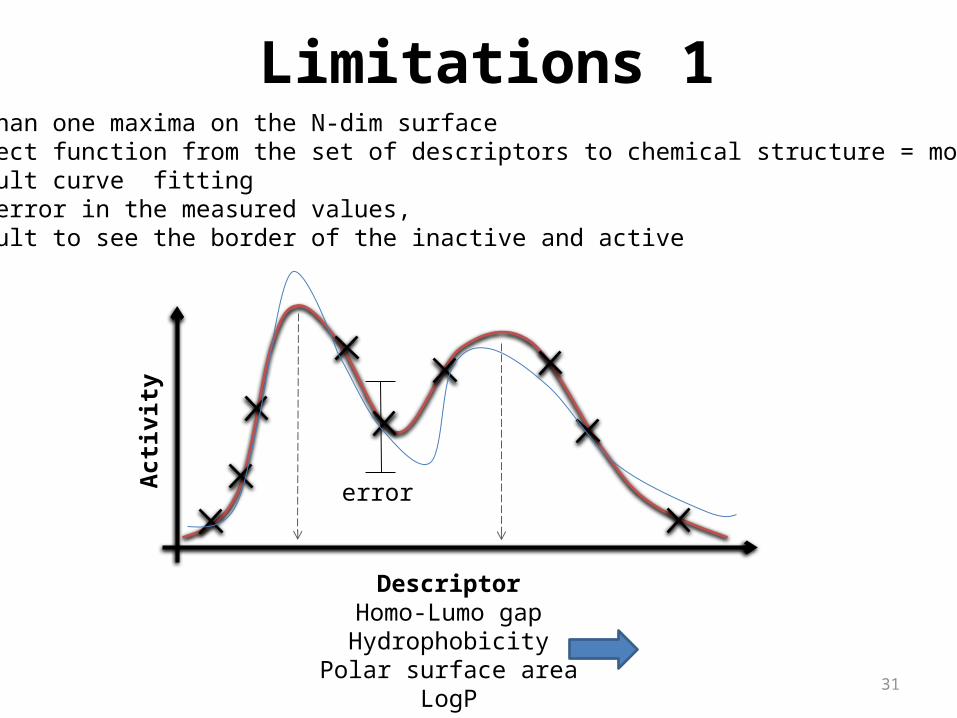
Limitations 11. More than one maxima on the N-dim surface2. No direct function from the set of descriptors to chemical structure = more solution3. Difficult curve fitting4. Large error in the measured values, 3. Difficult to see the border of the inactive and active
DescriptorHomo-Lumo gapHydrophobicity
Polar surface areaLogP
Activ
ity
error
32
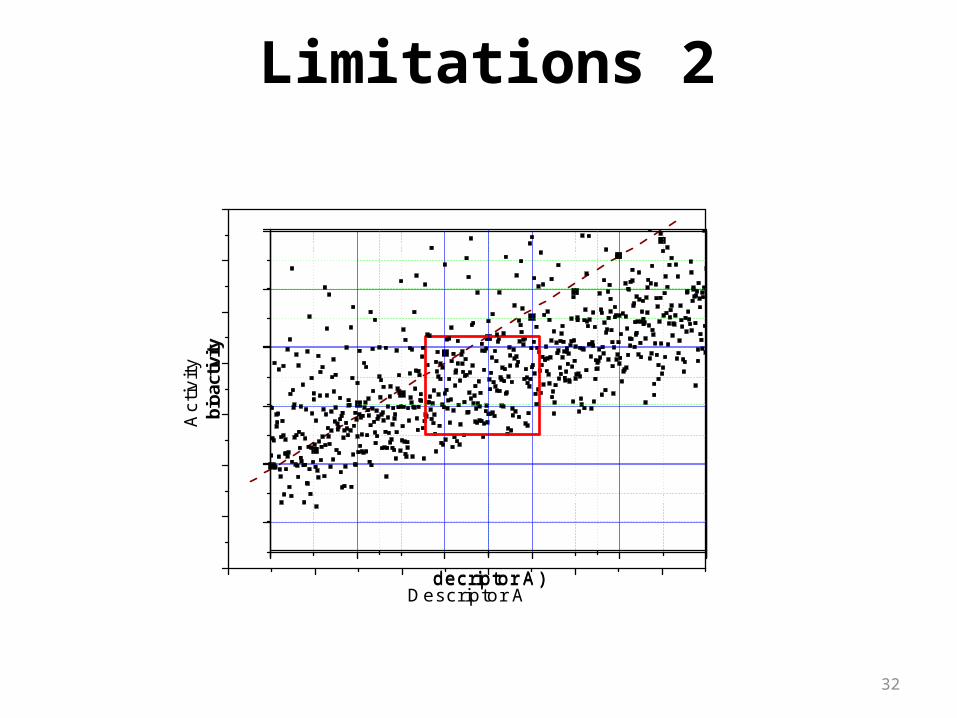
Act
ivity
Descriptor A
bioa
ctivity
decriptor A)
Limitations 2
bioa
ctivity
decriptor A)
33
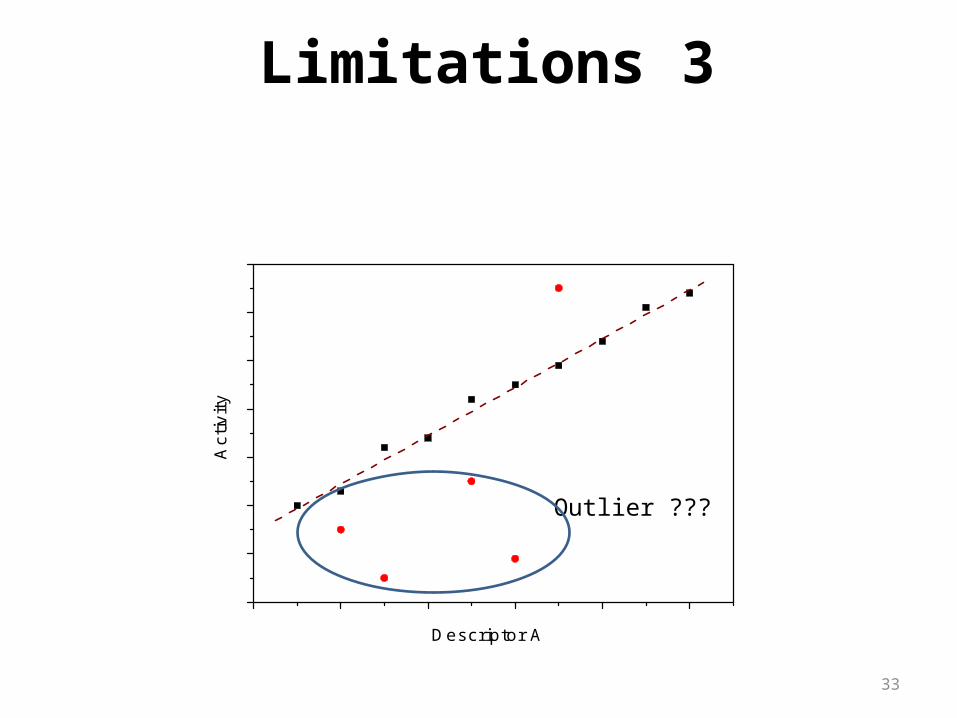
Descriptor A
Act
ivity
Outlier ???
Limitations 3
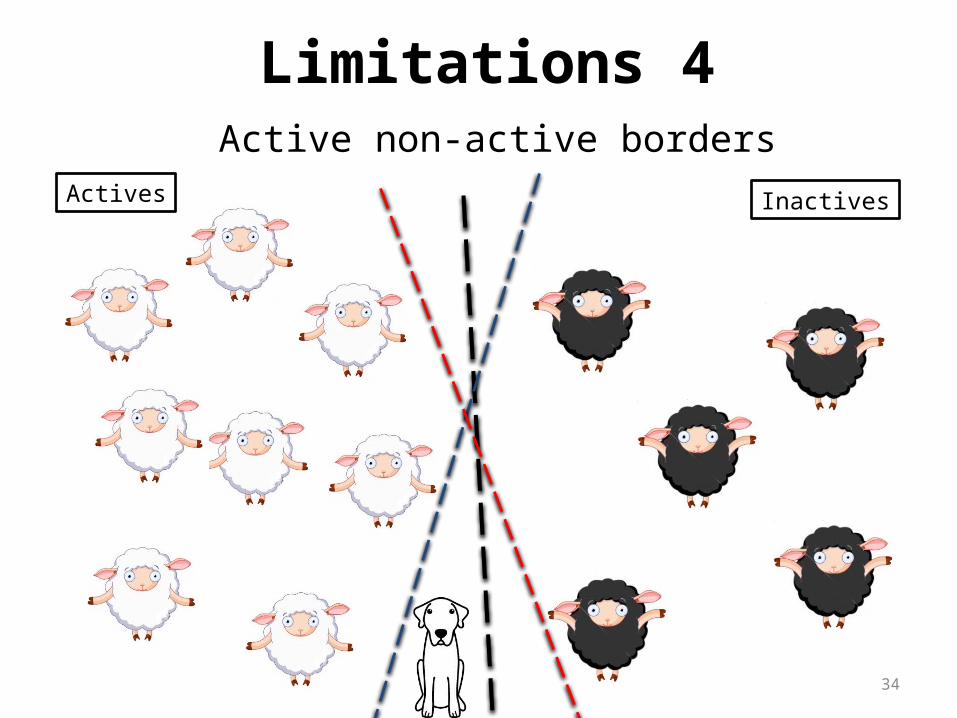
34
Active non-active bordersActives Inactives
Limitations 4
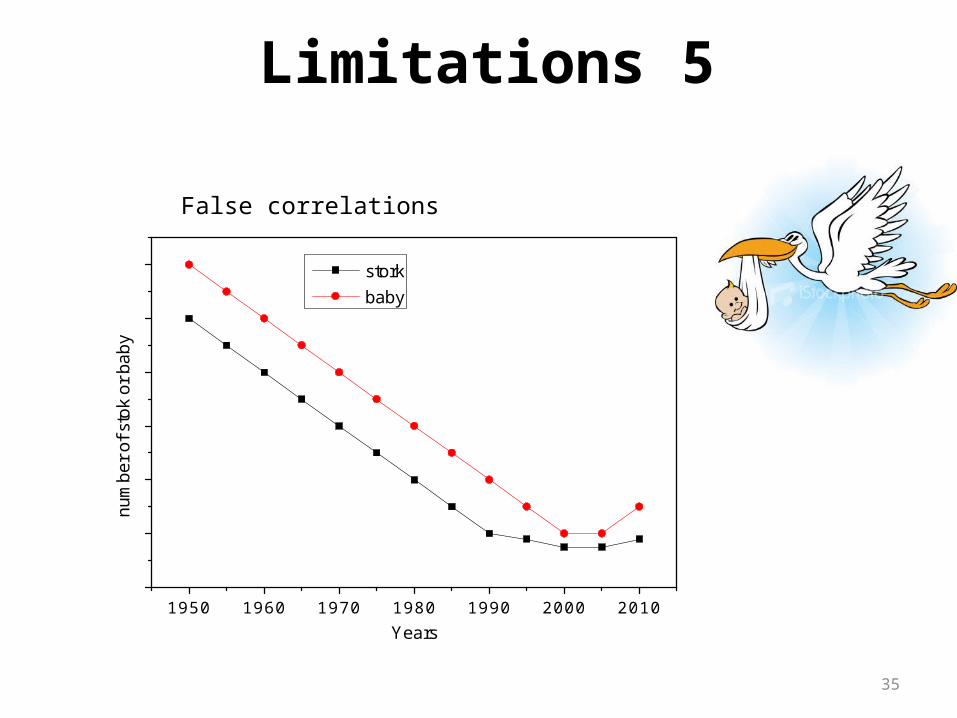
35
1950 1960 1970 1980 1990 2000 2010
num
ber o
f sto
k or
bab
y
Years
stork baby
Limitations 5
False correlations
36
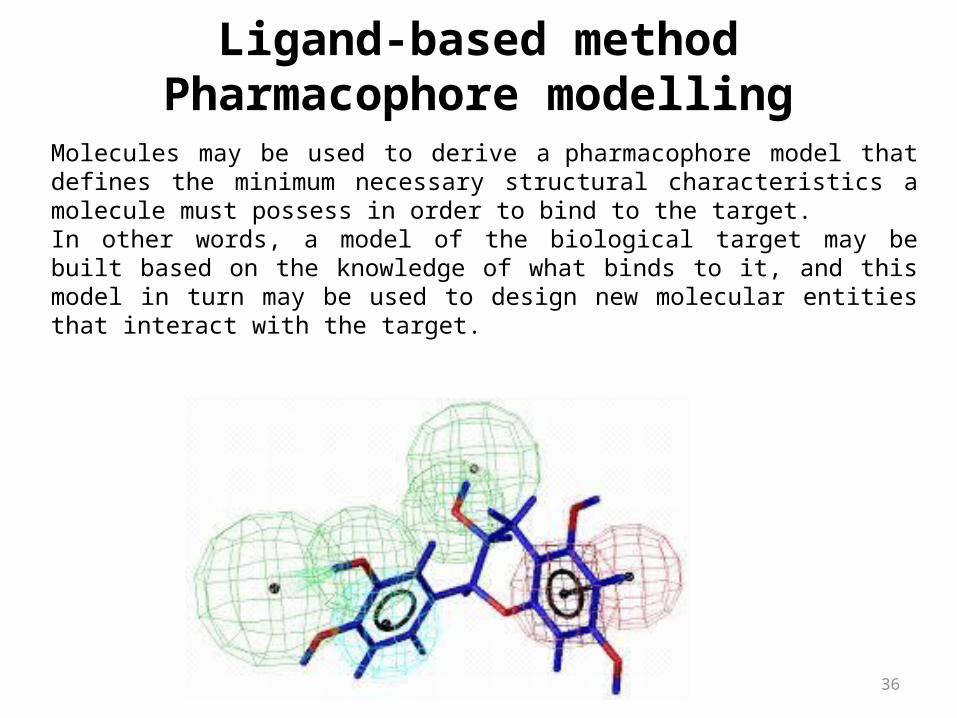
Molecules may be used to derive a pharmacophore model that defines the minimum necessary structural characteristics a molecule must possess in order to bind to the target.In other words, a model of the biological target may be built based on the knowledge of what binds to it, and this model in turn may be used to design new molecular entities that interact with the target.
Ligand-based methodPharmacophore modelling
37
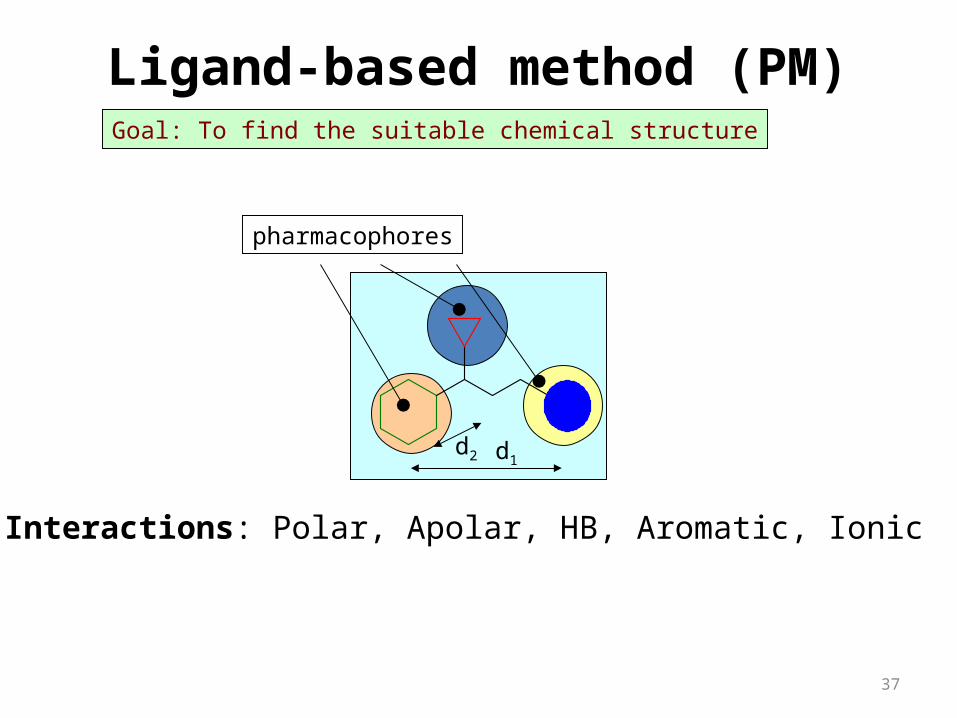
pharmacophores
Goal: To find the suitable chemical structure
d2 d1
Interactions: Polar, Apolar, HB, Aromatic, Ionic
Ligand-based method (PM)
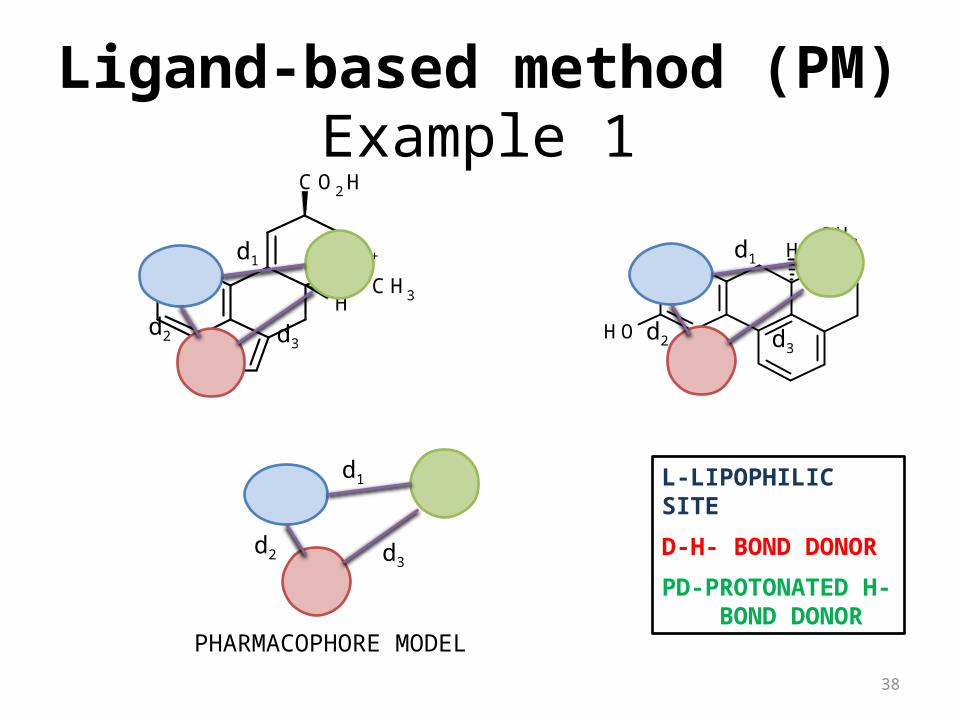
38
Example 1
NH+
CO2H
CH3H
NH
NH+H
CH3
OH
OH
PHARMACOPHORE MODEL
L-LIPOPHILIC SITE
D-H- BOND DONOR
PD-PROTONATED H- BOND DONOR
d1
d2 d3
d1
d2 d3
d1
d2 d3
Ligand-based method (PM)
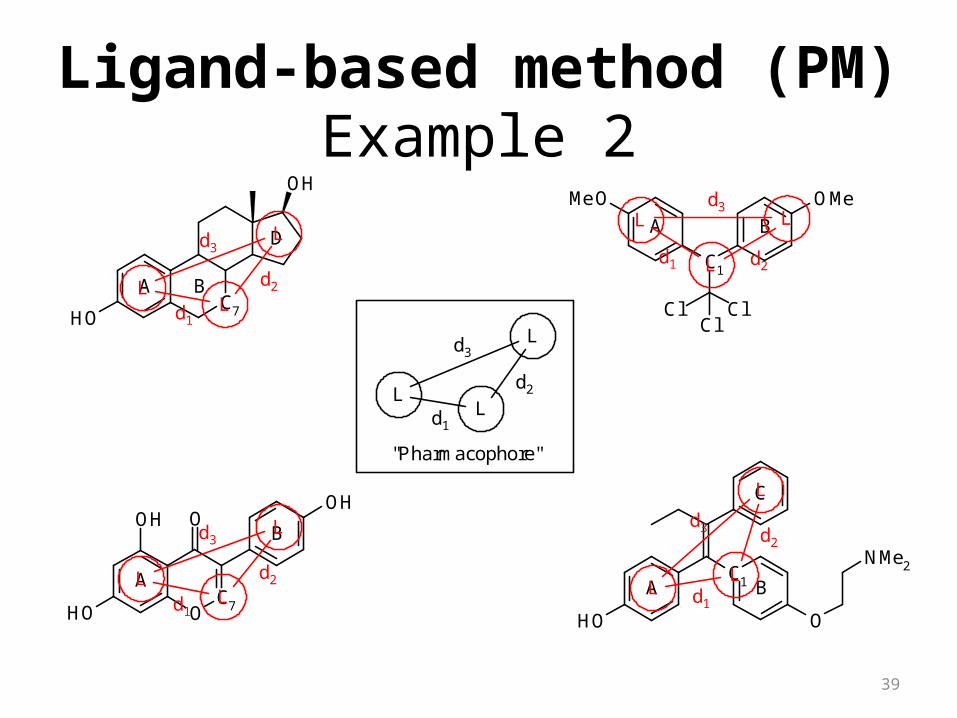
39
Example 2
C7OH
OH
A
D
BC1
MeO OMe
ClClCl
BA
O
OC7OH
OHOH
A
B
C1
O
NMe2
OH
A B
CL
LL d1
d2
d3L
LL
d1
d2
d3
L
LL
d1
d2
d3
L
L
L
d1 d2
d3
L
LL
d1
d2
d3
"Pharmacophore"
Ligand-based method (PM)
40
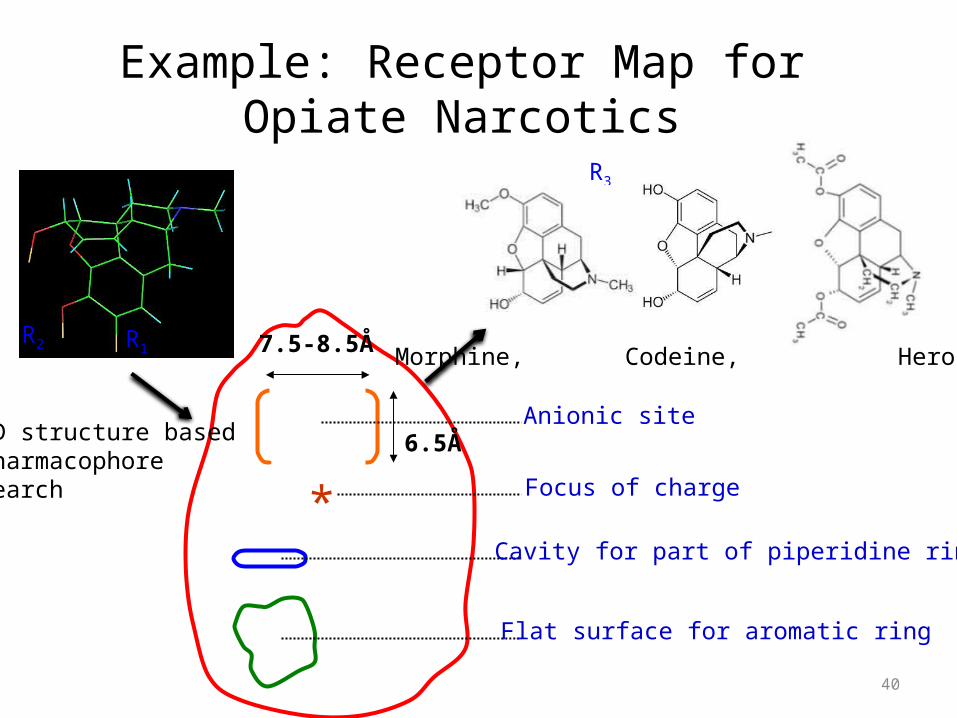
Example: Receptor Map for Opiate Narcotics
*6.5Å
7.5-8.5Å
Flat surface for aromatic ring
Cavity for part of piperidine ring
Focus of charge
Anionic site
R1R2
R3
3D structure basedPharmacophore search
Morphine, Codeine, Heroin
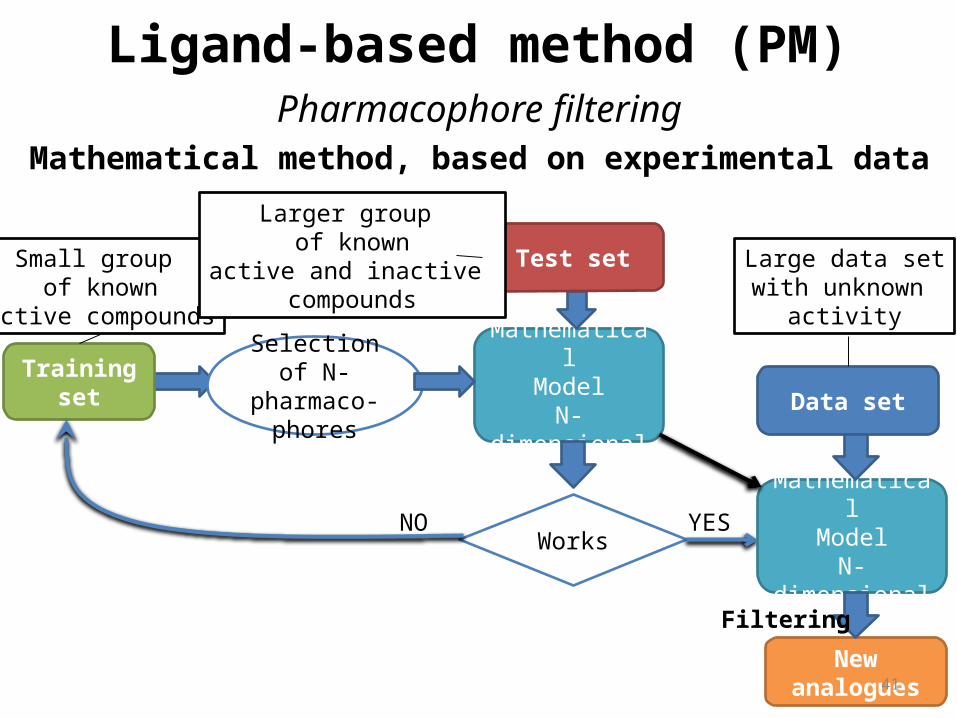
41
Small group of known
active compounds
Selection of N-pharmaco-
phores
MathematicalModel
N-dimensional Training set
Test set
WorksNO YES
Data set
MathematicalModel
N-dimensional
New analogues
Larger group of known
active and inactive compounds
Large data setwith unknown
activity
Mathematical method, based on experimental data
Filtering
Ligand-based method (PM)Pharmacophore filtering
42
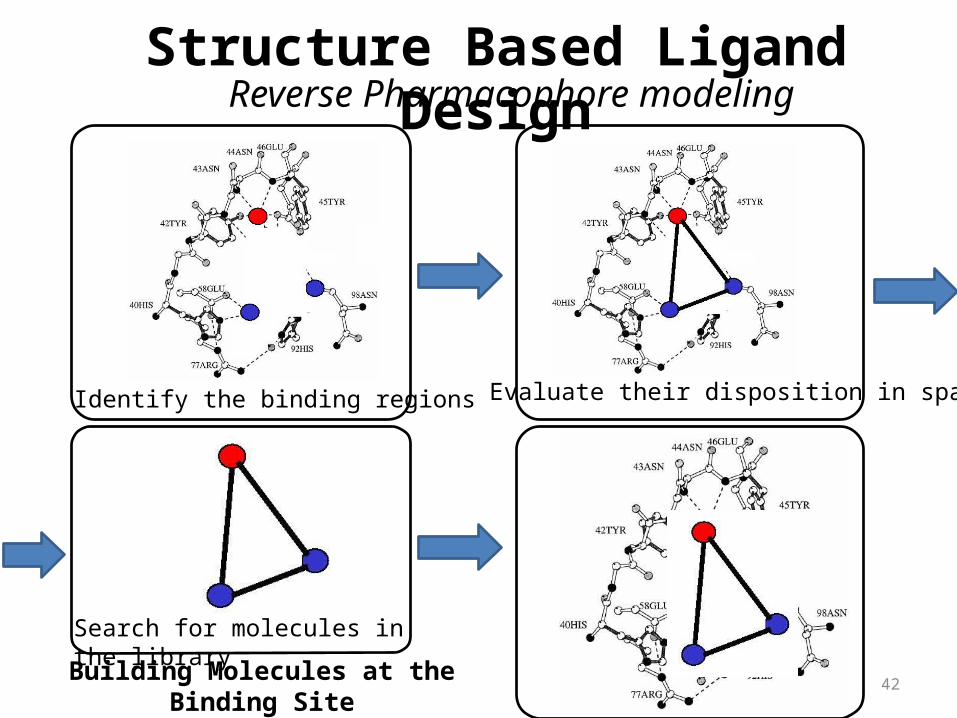
Identify the binding regions Evaluate their disposition in space
Search for molecules in the library
Reverse Pharmacophore modelingStructure Based Ligand Design
Building Molecules at the Binding Site
43
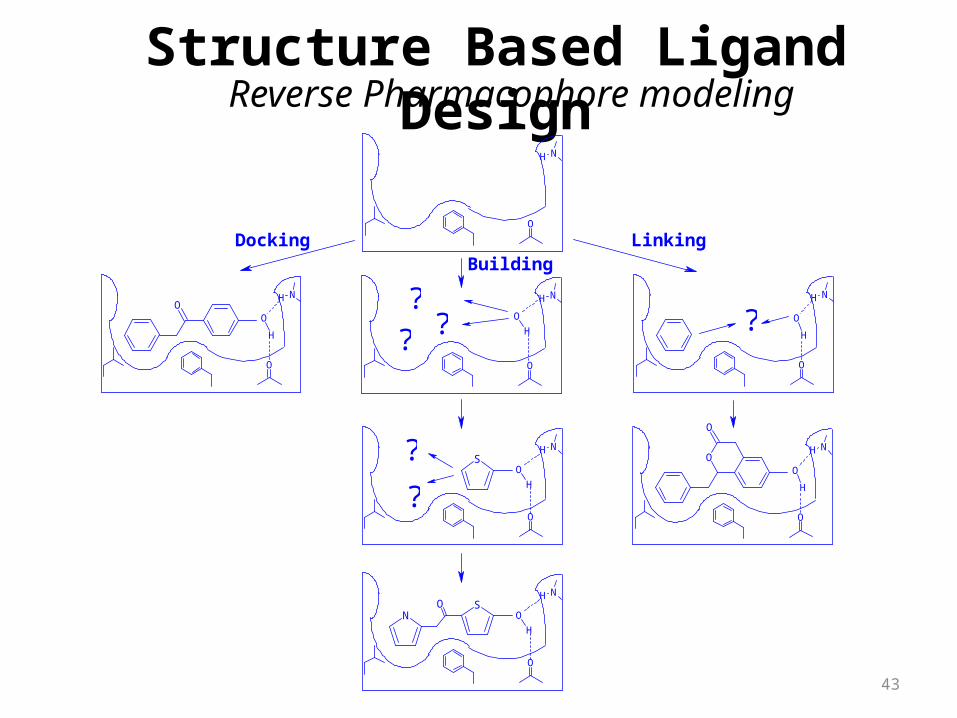
Structure Based Ligand Design
O
NH
O
H
O
NH
?
O
O
O
H
O
NH
NSO
O
H
O
NH
O
H
O
NHS?
?
O
H
O
NH
??
?
OO
H
O
NH
DockingBuilding
Linking
Reverse Pharmacophore modeling
44
O
O
O
H
HO
O
O
HH
OO
OH
OO
OH
O
O
OH
OH
O
DB Search
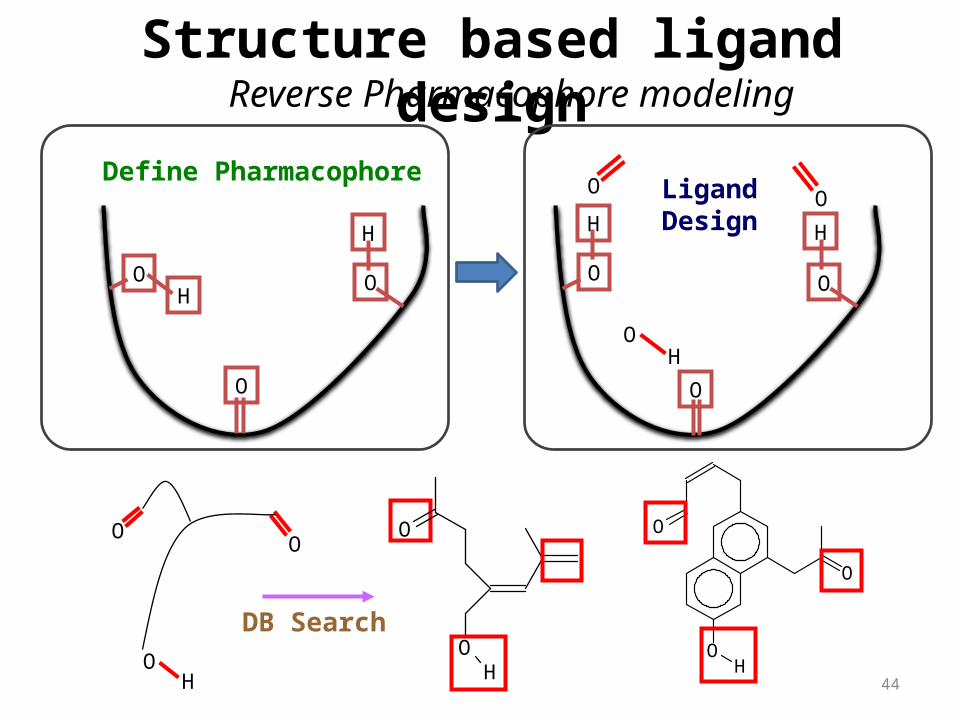
Define PharmacophoreLigandDesign
Structure based ligand designReverse Pharmacophore modeling
0
45
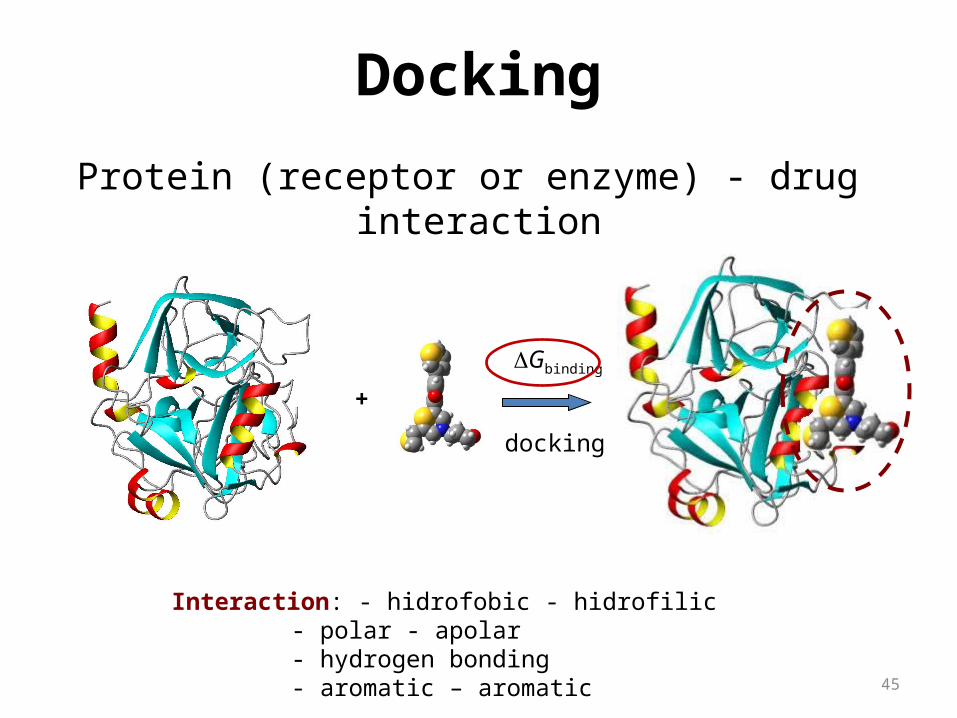
Protein (receptor or enzyme) - drug interaction
+
Interaction: - hidrofobic - hidrofilic - polar - apolar - hydrogen bonding - aromatic – aromatic
DGbinding
docking
Docking
46
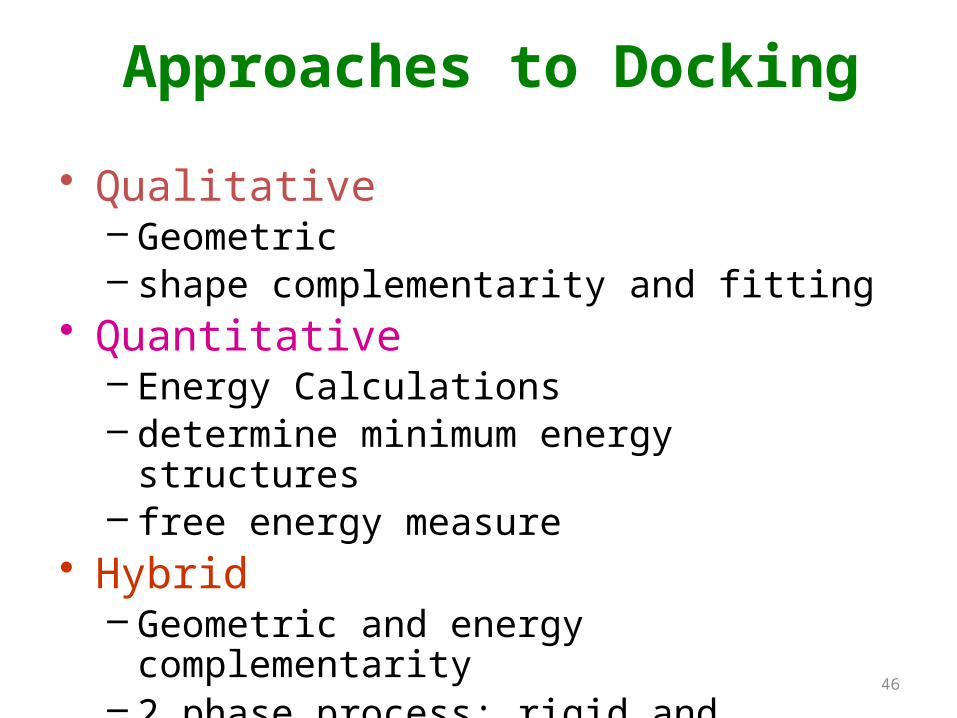
Approaches to Docking
• Qualitative– Geometric– shape complementarity and fitting
• Quantitative– Energy Calculations– determine minimum energy structures– free energy measure
• Hybrid– Geometric and energy complementarity– 2 phase process: rigid and flexible docking
47
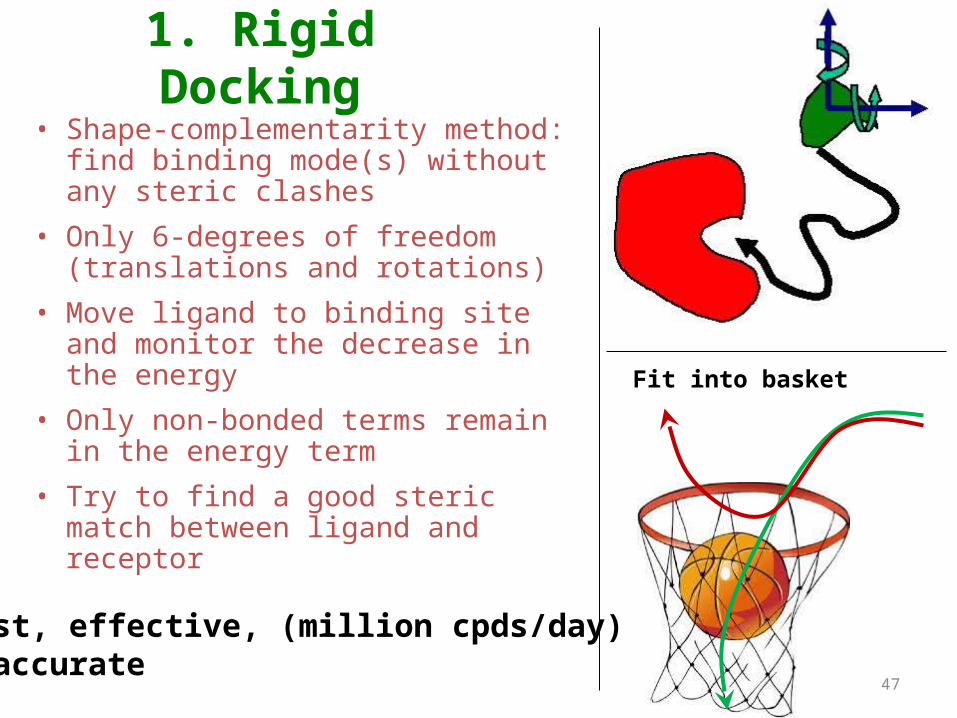
1. Rigid Docking• Shape-complementarity method: find
binding mode(s) without any steric clashes
• Only 6-degrees of freedom (translations and rotations)
• Move ligand to binding site and monitor the decrease in the energy
• Only non-bonded terms remain in the energy term
• Try to find a good steric match between ligand and receptor
Fit into basket
-Fast, effective, (million cpds/day) -Inaccurate
48
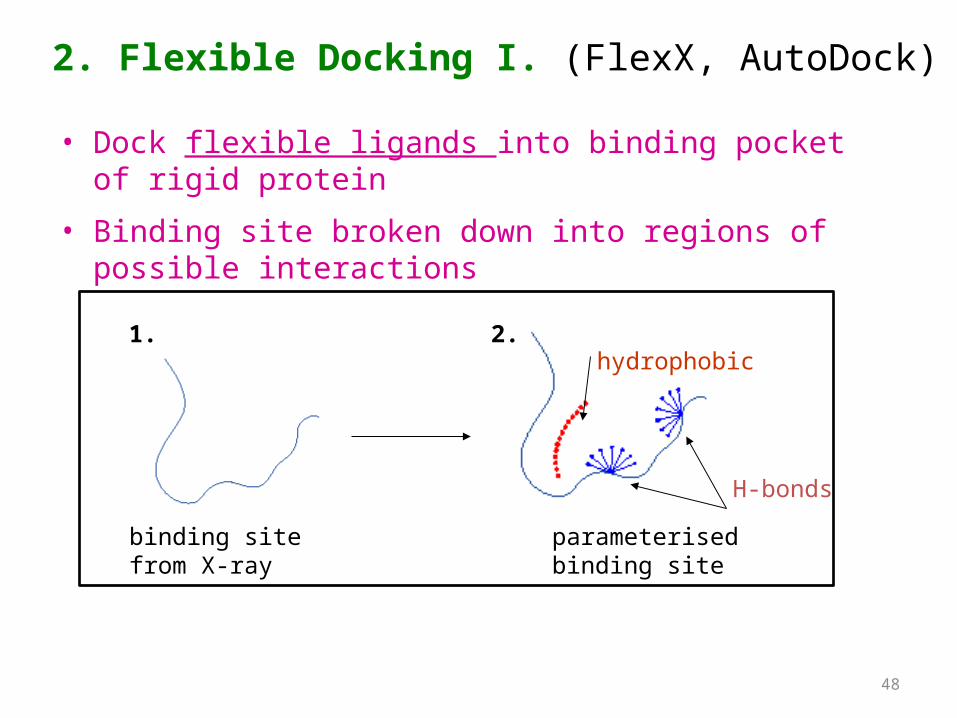
2. Flexible Docking I. (FlexX, AutoDock)
• Dock flexible ligands into binding pocket of rigid protein
• Binding site broken down into regions of possible interactions
binding site from X-ray
hydrophobic
H-bonds
parameterised binding site
1. 2.
49
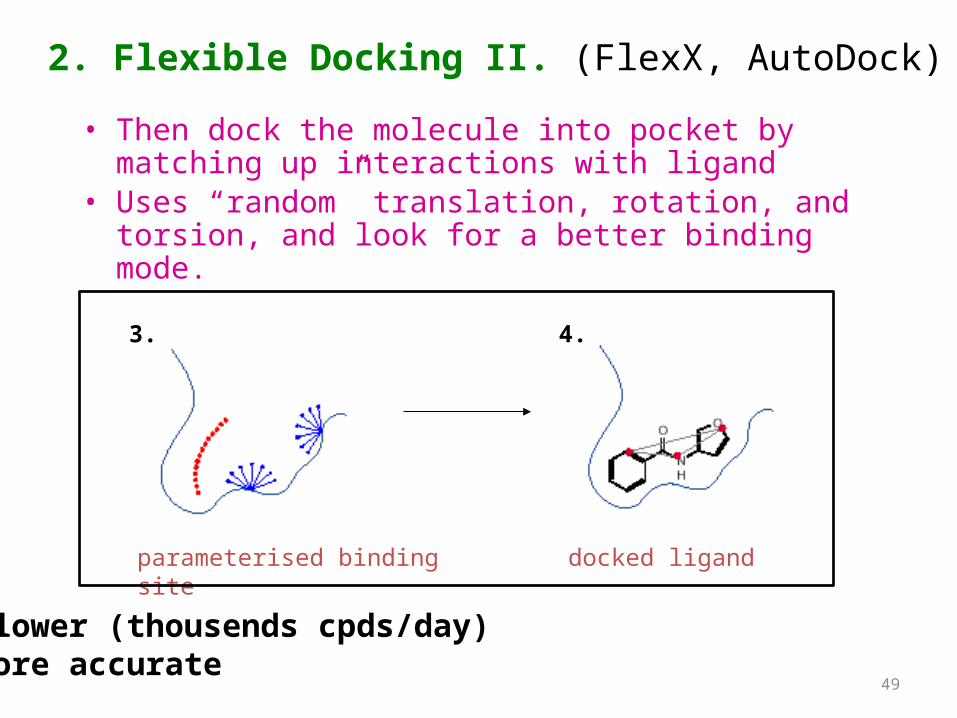
• Then dock the molecule into pocket by matching up interactions with ligand
• Uses “random” translation, rotation, and torsion, and look for a better binding mode.
parameterised binding site docked ligand
2. Flexible Docking II. (FlexX, AutoDock)
-Slower (thousends cpds/day) -More accurate
3. 4.
50
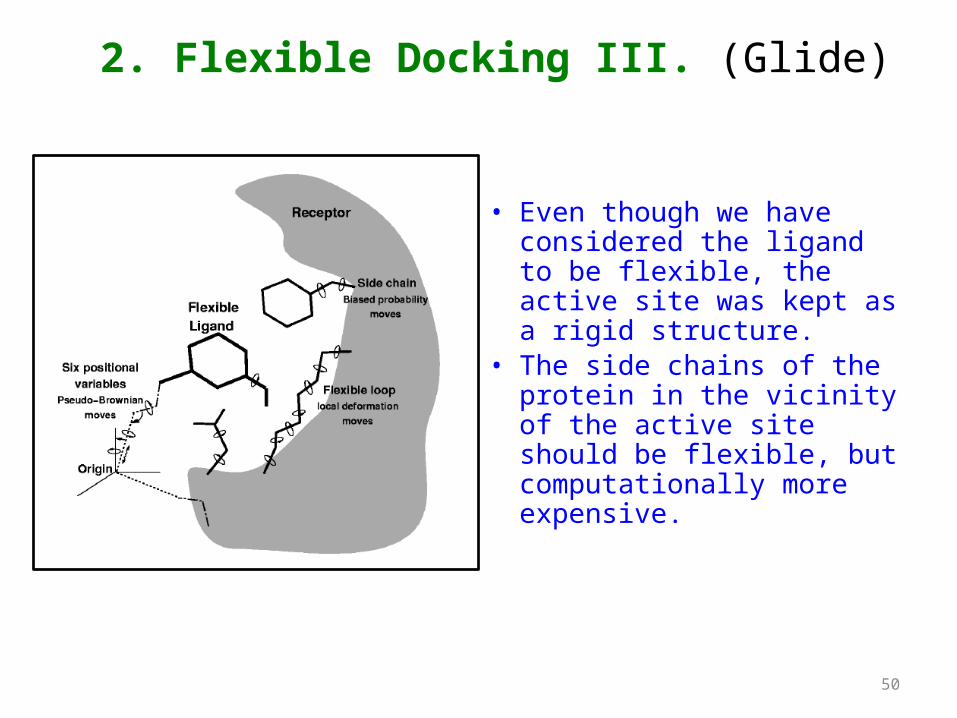
• Even though we have considered the ligand to be flexible, the active site was kept as a rigid structure.
• The side chains of the protein in the vicinity of the active site should be flexible, but computationally more expensive.
2. Flexible Docking III. (Glide)
51
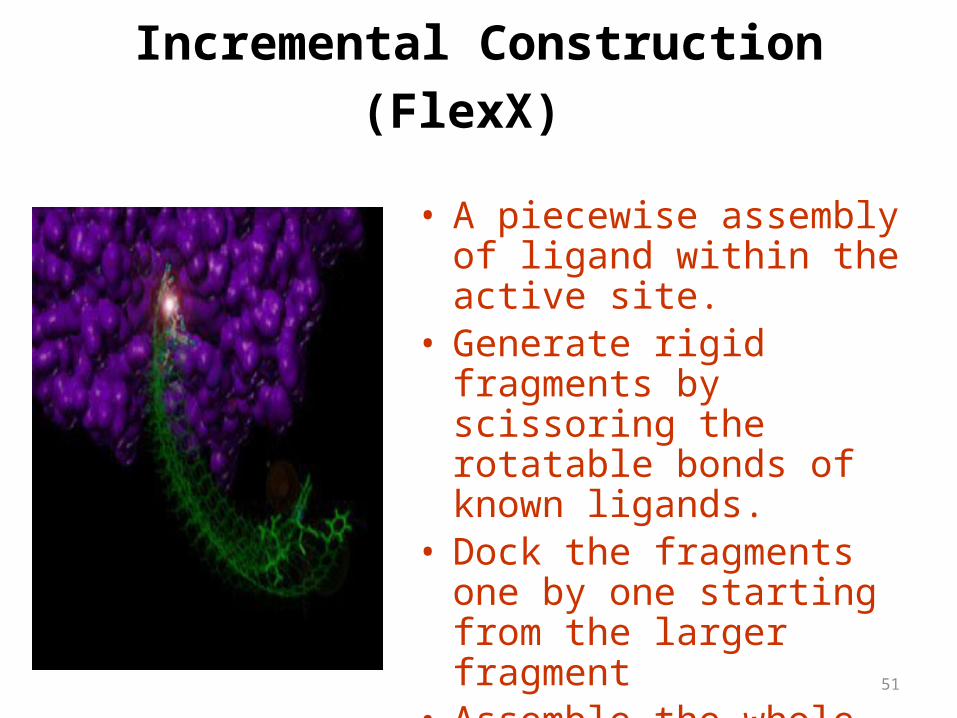
Incremental Construction (FlexX)
• A piecewise assembly of ligand within the active site.
• Generate rigid fragments by scissoring the rotatable bonds of known ligands.
• Dock the fragments one by one starting from the larger fragment
• Assemble the whole ligand by reconnecting them and repeat the docking process
52
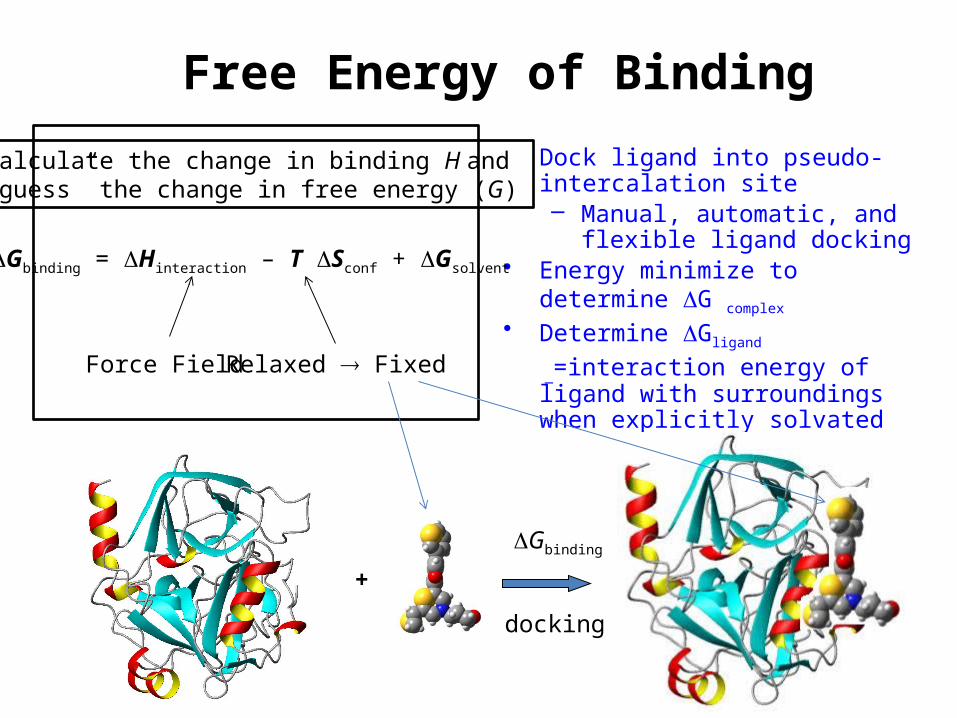
Free Energy of Binding• Dock ligand into pseudo-intercalation
site– Manual, automatic, and flexible
ligand docking• Energy minimize to determine DG complex • Determine DGligand
_=interaction energy of ligand with surroundings when explicitly solvated
Gbinding = Hinteraction – T Sconf + Gsolvent
Force Field Relaxed Fixed
Calculate the change in binding H and „guess” the change in free energy (G)
+
DGbinding
docking
53
Detailed calculations on all possibilities would be very expensive
The major challenge is to identify the best position and orientation of the ligand in the binding site of the target.
This is done by scoring or ranking of the various possibilities, which are based on empirical parameters, knowledge based on using rigorous calculations.
Need for Scoring of Fitness point
54
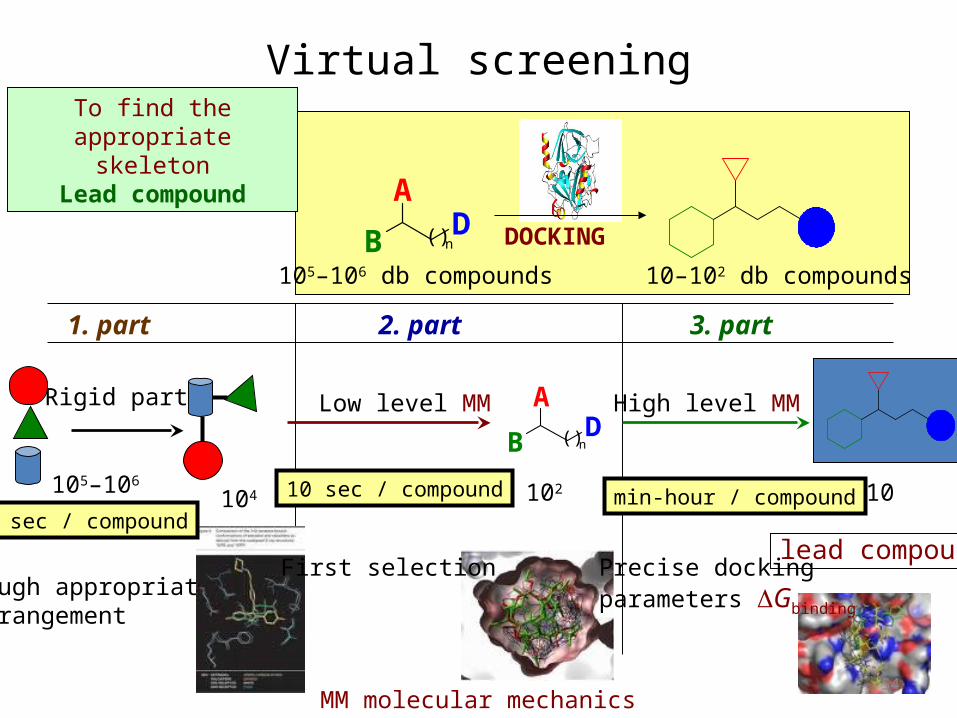
To find the appropriate skeleton
Lead compound
Virtual screening
B
AD( )n
105–106 db compounds
DOCKING
10–102 db compounds
1. part 2. part 3. part
Rigid parts
rough appropriate arrangement
B
AD( )n
105–106
Low level MM High level MM
First selection Precise docking parameters DGbinding
10104
lead compound
10 sec / compound1 sec / compound
min-hour / compound102
MM molecular mechanics