Embed Size (px)
Citation preview
NBER WORKING PAPER SERIES
PHARMACEUTICAL INDUSTRY, DRUG QUALITY AND REGULATION:EVIDENCE FROM US AND ITALY
Vincenzo AtellaJay Bhattacharya
Lorenzo Carbonari
Working Paper 14567http://www.nber.org/papers/w14567
NATIONAL BUREAU OF ECONOMIC RESEARCH1050 Massachusetts Avenue
Cambridge, MA 02138December 2008
Bhattacharya thanks the National Institute on Aging for partial funding of this work. The views expressedherein are those of the author(s) and do not necessarily reflect the views of the National Bureau ofEconomic Research.
NBER working papers are circulated for discussion and comment purposes. They have not been peer-reviewed or been subject to the review by the NBER Board of Directors that accompanies officialNBER publications.
© 2008 by Vincenzo Atella, Jay Bhattacharya, and Lorenzo Carbonari. All rights reserved. Short sectionsof text, not to exceed two paragraphs, may be quoted without explicit permission provided that fullcredit, including © notice, is given to the source.

Pharmaceutical Industry, Drug Quality and Regulation: Evidence from US and ItalyVincenzo Atella, Jay Bhattacharya, and Lorenzo CarbonariNBER Working Paper No. 14567December 2008, Revised September 2011JEL No. I1,L51,L65
ABSTRACT
This paper examines the relationship between drug price and drug quality and how it varies acrosstwo of the most common regulatory regimes in the pharmaceutical market: minimum efficacy standards(MES) and a mix of minimum efficacy standards and price control mechanisms (MES+PC). Througha simple model of adverse selection we model the interaction between firms, heterogeneous buyersand the regulator. The theoretical analysis provides two results. First, an MES regime provides greaterincentives to produce high quality drugs. Second, an MES+PC mix reduces the difference in pricebetween the highest and lowest quality drugs on the market. The empirical analysis based on US andItalian data corroborates these results.
Vincenzo AtellaUniversity of Rome Tor [email protected]
Jay Bhattacharya117 Encina CommonsCenter for Primary Careand Outcomes ResearchStanford UniversityStanford, CA 94305-6019and [email protected]
Lorenzo CarbonariCentre for Economic and International StudiesUniversity of Rome "Tor Vergata"Via Columbia, 2 - building B00133 Rome, Italyand [email protected]

1 Introduction
Regulation plays a crucial role in the pharmaceutical market. The rationale behind the regulator’s
intervention is dual: to guarantee and improve patient health and safety and to limit expenditures
(especially public) on drugs.1 As a consequence, pharmaceutical markets are characterized by strong
interactions between producers and the public sector. This interaction is strongest when governments
are both the unique provider of national health insurance and the regulator (for example, Italy, France,
Spain) or when they are heavily involved in regulating social insurance funds (for example, U.K.). In
such an environment, regulatory agencies generally articulate their strategies with respect to three
objectives: drug quality, access (partial or total inclusion in the benefit package), and expenditure
control. The definition of these aims varies considerably from country to country, and the authorities
rarely rank them or define acceptable trade-offs (Maynard and Bloor [10]). In other cases, such as
the United States, this interaction is reduced and it is limited to ensure patient health and safety.
The goal of this paper is to investigate the role that different regulatory schemes can have on
the relationship between drug price and drug quality in the pharmaceutical market. We develop a
simple model of the market for prescription drugs in which pharmaceutical companies can charge
different prices to heterogeneous consumers for innovative drugs. We assume the existence of two
different groups of buyers, differing in their willingness-to-pay for quality (efficacy). We then derive
the properties of the equilibria under two different regulatory regimes: i) a regime with minimum
efficacy standards (MES) and ii) a MES regime combined with a drug price controls (MES+PC).
The first regime models the regulatory structure of the pharmaceutical market in the US, while the
second models the structure in many other countries in the developed world, including specifically
Italy.
We run empirical tests of some of our theoretical predictions using drug market data from US and
Italy. Two main results emerge. First, the average drug quality delivered is higher under a regime
of MES regulation alone. Second, price ceiling regulation reduces price differences between highly
effective and less effective drugs. Finally, we explore the policy implications of our results. To our
knowledge, this paper contributes to the literature in two ways: (i) it represents the first unified
model of drug regulation, drug prices, and drug quality applicable to multiple countries, and (ii) we
develop a novel method for measuring drug quality starting from a database of randomized clinical
trials.
We organize the paper as follows. In section 2 we present a short review of the regulatory structure
imposed on the pharmaceutical industry in the US and in Europe, along with a short review of the
literature. In section 3 we introduce our theoretical framework starting from a simple model where
the firm observes only two types of buyers differing in their willingness-to-pay for quality (efficacy).
In an incomplete information setting, we derive the properties of the equilibria under the MES and
MES+PC regulatory regimes (section 3.1). In section 4 we discuss the data used to test the theoretical
prediction of our model and presents the empirical analysis on the relationship between price and
quality (efficacy) in Italy and in US. Finally, section 5 presents the main conclusions, discuss some
policy implications of our findings, and highlights some of the caveats that permeates the analysis
and that should be resolved in future research in this sector.
1Pharmaceutical expenditures represent a substantial component of total health expenditures in all OECD countries
(close to 17% in 2007 as OECD average).
2
2 Background
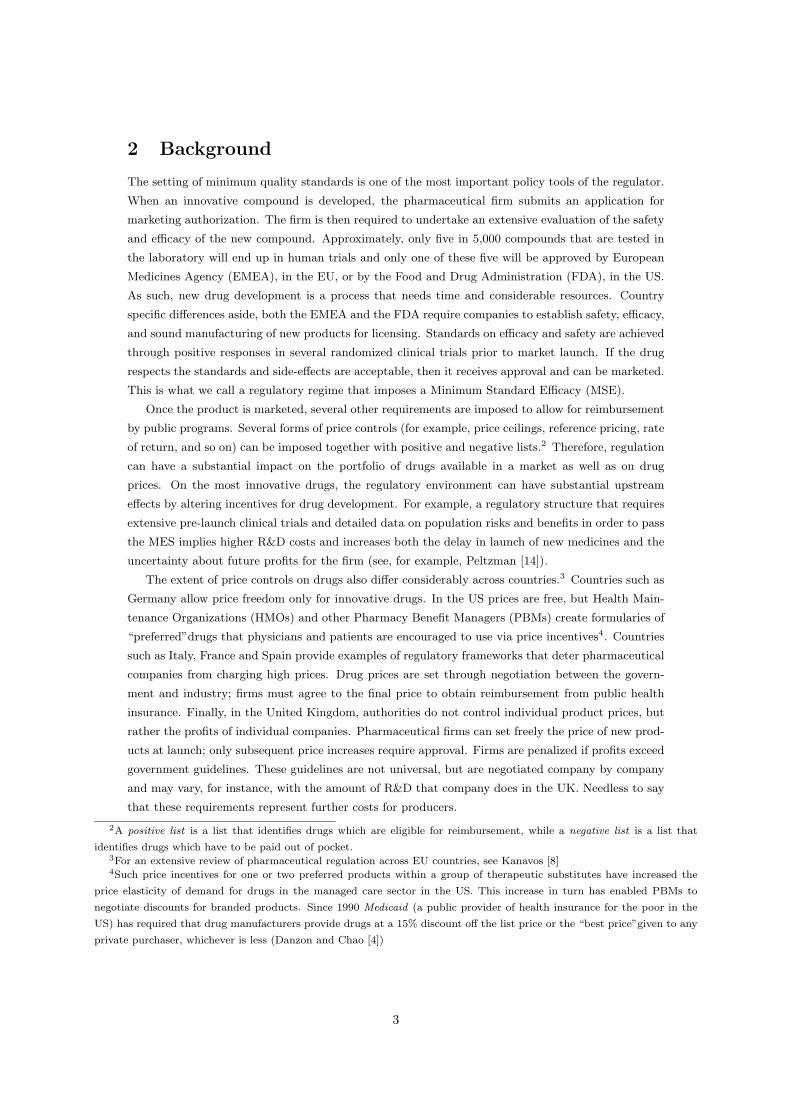
The setting of minimum quality standards is one of the most important policy tools of the regulator.
When an innovative compound is developed, the pharmaceutical firm submits an application for
marketing authorization. The firm is then required to undertake an extensive evaluation of the safety
and efficacy of the new compound. Approximately, only five in 5,000 compounds that are tested in
the laboratory will end up in human trials and only one of these five will be approved by European
Medicines Agency (EMEA), in the EU, or by the Food and Drug Administration (FDA), in the US.
As such, new drug development is a process that needs time and considerable resources. Country
specific differences aside, both the EMEA and the FDA require companies to establish safety, efficacy,
and sound manufacturing of new products for licensing. Standards on efficacy and safety are achieved
through positive responses in several randomized clinical trials prior to market launch. If the drug
respects the standards and side-effects are acceptable, then it receives approval and can be marketed.
This is what we call a regulatory regime that imposes a Minimum Standard Efficacy (MSE).
Once the product is marketed, several other requirements are imposed to allow for reimbursement
by public programs. Several forms of price controls (for example, price ceilings, reference pricing, rate
of return, and so on) can be imposed together with positive and negative lists.2 Therefore, regulation
can have a substantial impact on the portfolio of drugs available in a market as well as on drug
prices. On the most innovative drugs, the regulatory environment can have substantial upstream
effects by altering incentives for drug development. For example, a regulatory structure that requires
extensive pre-launch clinical trials and detailed data on population risks and benefits in order to pass
the MES implies higher R&D costs and increases both the delay in launch of new medicines and the
uncertainty about future profits for the firm (see, for example, Peltzman [14]).
The extent of price controls on drugs also differ considerably across countries.3 Countries such as
Germany allow price freedom only for innovative drugs. In the US prices are free, but Health Main-
tenance Organizations (HMOs) and other Pharmacy Benefit Managers (PBMs) create formularies of
“preferred”drugs that physicians and patients are encouraged to use via price incentives4. Countries
such as Italy, France and Spain provide examples of regulatory frameworks that deter pharmaceutical
companies from charging high prices. Drug prices are set through negotiation between the govern-
ment and industry; firms must agree to the final price to obtain reimbursement from public health
insurance. Finally, in the United Kingdom, authorities do not control individual product prices, but
rather the profits of individual companies. Pharmaceutical firms can set freely the price of new prod-
ucts at launch; only subsequent price increases require approval. Firms are penalized if profits exceed
government guidelines. These guidelines are not universal, but are negotiated company by company
and may vary, for instance, with the amount of R&D that company does in the UK. Needless to say
that these requirements represent further costs for producers.
2A positive list is a list that identifies drugs which are eligible for reimbursement, while a negative list is a list that
identifies drugs which have to be paid out of pocket.3For an extensive review of pharmaceutical regulation across EU countries, see Kanavos [8]4Such price incentives for one or two preferred products within a group of therapeutic substitutes have increased the
price elasticity of demand for drugs in the managed care sector in the US. This increase in turn has enabled PBMs to
negotiate discounts for branded products. Since 1990 Medicaid (a public provider of health insurance for the poor in the
US) has required that drug manufacturers provide drugs at a 15% discount off the list price or the “best price”given to any
private purchaser, whichever is less (Danzon and Chao [4])
3

3 The Model
In this section we develop a simple theoretical framework of the optimal pricing policy of pharma-
ceutical firms under assumptions of imperfect information about buyers’ preferences.
Consider a market where a monopolistic firm sells its drugs to a set of heterogeneous insurers and
providers. Providers behave as surplus maximizing agents whose preferences are private information
and defined only on by efficacy of the drug purchased. The source of heterogeneity stems from the
differing willingness-to-pay for efficacy.5
The main assumptions of the model are the following.
Assumption 1. Demand-side. There are N surplus maximizing buyers differing in their willingness-
to-pay for a prescription medication with a certain efficacy. NL buyers have a low willingness-to-pay
for efficacy while NH have a high willingness-to-pay. Buyers are price takers.
Assumption 2. Preferences. Each buyer chooses e to maximize her gross surplus function [vi(e)−p]. vi(e) is the i-type willingness-to-pay for efficacy and exhibits the following properties
vi(e) > 0dvi(e)
de> 0
d2vi(e)
de2< 0
where i = L,H. Moreover:
vH(e) > vL(e) v′H(e) > v′L(e)
The net surplus function for i-th type provider is given by:
vi(e)− p ≥ 0 for i = L,H
Assumption 3. Supply-side. Within a monopolistically competitive pharmaceutical market, profit-
maximizing firms produce and sell to N = NL+NH insurers/providers who differ in their willingness-
to-pay for efficacy.6
Assumption 4. Information. The seller does not know buyers’ characteristics and she can not
discriminate, while buyers perfectly know the efficacy of the drugs sold.
3.0.1 Producer’s behavior
Since pharmaceutical firm does not observe the type of the provider/insurer, it will offer a set of
choices independent of the type in order to maximize her expected profits. Given that there are only
two types of buyer (low and high), the pharmaceutical firm will produce only two types of drugs.
Hence, the seller has to solve the following expected profit maximization problem:
maxp,e
Π = NL ·ˆpL − c(eL)
˜+NH ·
ˆpH − c(eH)
˜(1)
s.t.
vi(e)− pi ≥ 0 for i = L,H (2)
where c(ei) with i = L,H is the unit cost of producing i-type drug and dc(·)/de > 0, d2c(·)/de2 > 0.
Equation (2) represents the participation constraints for types L and H.7
5In our analysis we are interested in describing the static interaction between the producer and the insurer/provider,
hence we do not consider the pharmaceutical product as an experience good.6A good example in the real world of this situation is the market for statins (lipid lowering drugs).7We also assume the following regularity conditions: lime→∞ c′(e) =∞; v′i(0) > c′(0) for i = L, H; v′i is bounded from
above.
4

If the seller could perfectly discriminate, she would extract the entire surplus from each group of
buyers, and the constraints (2) would hold as equalities. This solution entails socially optimal efficacy
levels that equate the marginal benefit with the marginal cost of efficacy:
v′L(eL) = c′(eL) (3)
v′H(eH) = c′(eH) (4)
However, when the provider/insurer’s type in not observable, perfect price discrimination is not
feasible. Hence the producer is not able any more to maintain all buyers at the zero surplus level
and the first best solution pFBi , eFBi is not achievable. Hence the pi, ei pairs offered by the
pharmaceutical firm must satisfy also the following incentive compatibility constraints:
vH(eH)− pH ≥ vH(eL)− pL (5)
vL(eL)− pL ≥ vL(eH)− pH (6)
Equations (1-6) represents a standard adverse selection problem (see Bolton and Dewatripont [2],
Laffont and Tirole [9]). It is easy to show that only L-type participation constraint and H-type
incentive compatibility are binding (see appendix A.2). Hence the seller solves her expected profit
maximization problem simply by substituting the two remaining constraints in her objective function:
maxp,e
Π = NL ·ˆpL − c(eL)
˜+NH ·
ˆpH − c(eH)
˜s.t.
vL(eL)− pL = 0
and
vH(eH)− pH = vH(eL)− pL (7)
Both the constraints must be binding or else the producer could increase her expected profit simply
by raising prices.
Proposition 1. Solutions for problem (7) entails a separating equilibrium where:
- pSBH = vH(eH)−ˆvH(eL)− vL(eL)
˜;
- pSBL = vL(eL) ⇒ zero surplus for L-type buyers;
- the group of buyers with the lower willingness-to-pay for efficacy receives a pair eSBL , pSBL and
the drug delivered exhibits an efficacy level that is lower then at the social optimum (perfect price
discrimination scenario)
v′L(eL) = c′(eL) +NHNL·ˆv′H(eL)− v′L(eL)
˜- the buyers with the higher willingness-to-pay for efficacy receives a pair eSBH , pSBH . Their drugs
exhibits the same efficacy level they received at the social optimum
v′H(eH) = c′(eH)
Proof: see appendix A.3.
It is worth noticing that the size of this distortion is increasing in the so-called informational rent
of H-type buyer -ˆv′H(eL)− v′L(eL)
˜- and in the ratio NH/NL.
5
3.1 Does Regulation Eliminate Distortions?
The following subsections will illustrate the effect that different regulatory mandates can have on the
pharmaceutical market described above and how R&D subsidies can contribute to the achievement
of higher levels of drug efficacy and welfare.
Following Besanko, Donnenfeld, and White [1], who consider the monopolist’s quality choice
problem in the presence of regulation, we will analyze two main regulatory approaches: minimum
drug efficacy standards and price control regulation.
3.1.1 The Minimum Efficacy Standard (MES) scheme
Consider a pharmaceutical market where regulation requires minimum drug efficacy, but no pure
price controls, such as in the US. In such a context, when the minimum efficacy level is increased,
so are expenditures by firms for research and testing. Once the drug is approved (and presumably
patented), the absence of price control allows the firm to enjoy large profits. We define this regulatory
mandate as a Minimum Efficacy Standard scheme (hereafter MES). Under assumptions (1)-(3) and
(4) we will show that a higher efficacy threshold imposed by the government increases the efficacy of
the drug marketed to L-type buyers.
Suppose that the government fixes the efficacy requirement e such that: eSBL < e < eSBH . Hence
the profit maximizer seller has to take into account a further constraint:
ei ≥ e for i = L,H (8)
In the regulated problem, the seller maximizes her objective function (eq.1) under the two partic-
ipation constraints (eq.2), the two incentive compatibility constraints (eq.6-5) and the two efficiency
constraint (eq.8).
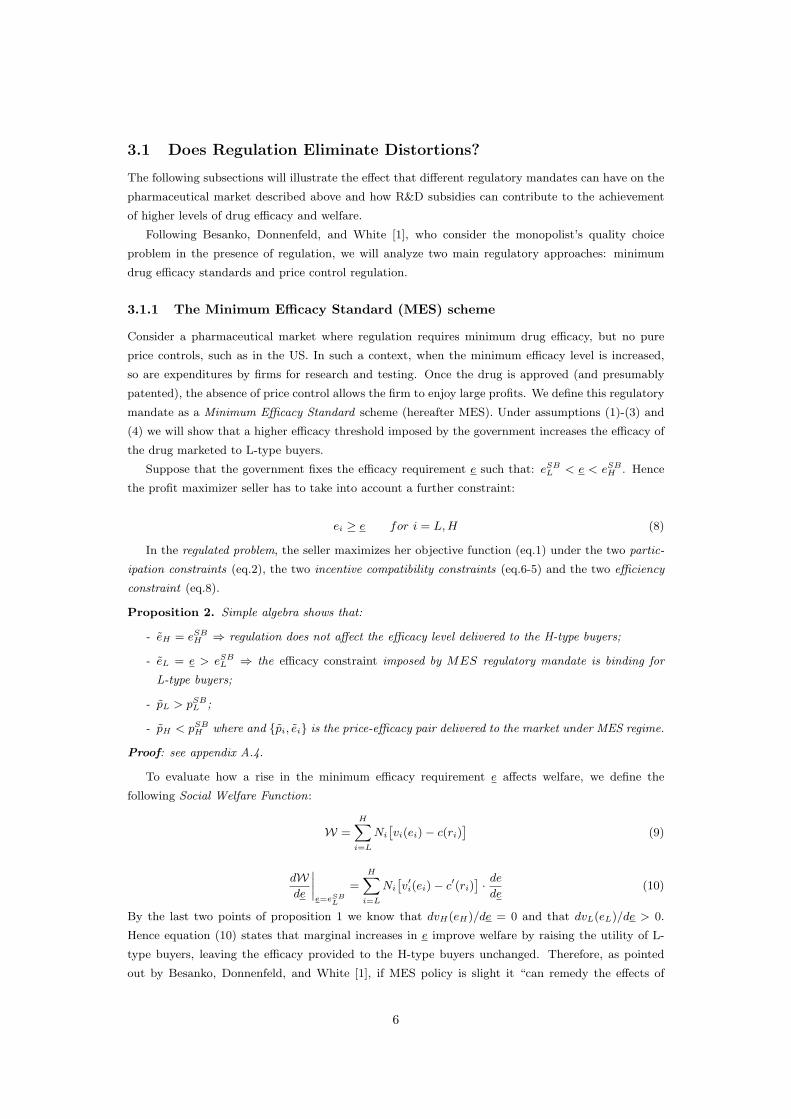
Proposition 2. Simple algebra shows that:
- eH = eSBH ⇒ regulation does not affect the efficacy level delivered to the H-type buyers;
- eL = e > eSBL ⇒ the efficacy constraint imposed by MES regulatory mandate is binding for
L-type buyers;
- pL > pSBL ;
- pH < pSBH where and pi, ei is the price-efficacy pair delivered to the market under MES regime.
Proof: see appendix A.4.
To evaluate how a rise in the minimum efficacy requirement e affects welfare, we define the
following Social Welfare Function:
W =
HXi=L
Niˆvi(ei)− c(ri)
˜(9)
dWde
˛e=eSB
L
=
HXi=L
Niˆv′i(ei)− c′(ri)
˜· dede
(10)
By the last two points of proposition 1 we know that dvH(eH)/de = 0 and that dvL(eL)/de > 0.
Hence equation (10) states that marginal increases in e improve welfare by raising the utility of L-
type buyers, leaving the efficacy provided to the H-type buyers unchanged. Therefore, as pointed
out by Besanko, Donnenfeld, and White [1], if MES policy is slight it “can remedy the effects of
6

market failure”. However, higher minimum efficacy imposes higher costs on R&D. At an extreme, if
regulation imposes too high standards, prices could rise to a point where L-type buyers are excluded
from the market.
Given our assumptions, it can be shown that there exists a minimum efficacy threshold that
optimally balances the higher R&D costs with the higher efficacy drugs delivered to L-type buyers.
This optimal level is just below the level that excludes L-type buyer from the market. To evaluate
the welfare effects due to an increasing in R&D activities by the firm we take the derivative of Wwith respect to r:
dWdr≡
HXi=L
Ni˘v′i[ei(r)]− c′[ri(r)]
¯· dedr
Hence, dW/dr ≥ 0 ifPHi=LNi
˘v′i[ei(r)]− c′[ri(r)]
¯≥ 0 where the term in brackets is positive for
i = L and zero for i = H.
3.1.2 Regulatory mix: MES plus PC
The combination of price-control schemes and quality requirements are very common in pharmaceu-
tical markets. With respect to the former, different mechanisms are in use. For example, in Italy
and France prices of new drugs are set through negotiations between firms and the regulator. What
producers can charge is strictly related to the reimbursement price (reference pricing). This price is
often based on external referencing to foreign prices for the same drug or prices of similar products
on the market.8 In other European countries (e.g. Netherlands, Ireland) pure price-ceiling applies
and the maximum that the producer can charge is given by the regulated price.
For the sake of simplicity, here we do not focus on the negotiation mechanism and how it occurs.
As a consequence, the regulated price is considered as an exogenous variable for the parties:
pSBL < p < pSBH
This implies that, under the MES+PC mandate, pharmaceutical firm solve (7) taking into account
the following further constraints: ei ≥ e for, i = L,H, and p < pSBH .
Proposition 3. The solution for the profit maximimazation problem under MES + PC regulation is
characterized as follows:
- v′L(eL) = c′(eL) +ˆNH−µNL
˜·ˆv′H(eL)− v′L(eL)
˜;
- v′H(eH) = c′(eH)ˆNH(NH − λ)−1
˜- p = vH(eH)−
ˆvH(eL)− vL(eL)
˜where λ is the Lagrangian multiplier for the constraint p < pH and pi, ei is the price-efficacy pair
delivered to the market under the regulatory mix MES+PC. Proof: see appendix A.5
Proposition 3 shows that the regulatory mix implies a quality deterioration fot the H-type buyers
given that the following relation holds:
eH < eH = eSBH
Hence, MES+PC implies that H-type buyers receive less efficacy then they received in the unregulated
case while it induces an improvement of the efficacy delivered to L-type buyers.
8Though reference pricing differs substantially from the price-ceiling mechanism, a wide evidence supports its efficiency
“in cutting drug prices, in controlling relative demand of highly priced drugs, and in encouraging the appropriate use of
drugs”(Miraldo [12]).
7
In order to examine the welfare proprieties of the regulatory mix, we evaluate dW/dp at the
unregulated equilibrium:
dWdp
˛p=pSB
H
=
HXi=L
Niˆv′i(ei)− c′(ei)
˜· deidp
(11)
From proposition 1 we know that the term in brackets is positive for L-type buyers and null for
H-type ones. Furthermore, we pointed out that deL/dp is positive while deH/dp is negative. Hence
the sign of equation 11 depends on the distance between p and pSBH and on the sizes of the two group
of buyers.9
4 Empirical analysis
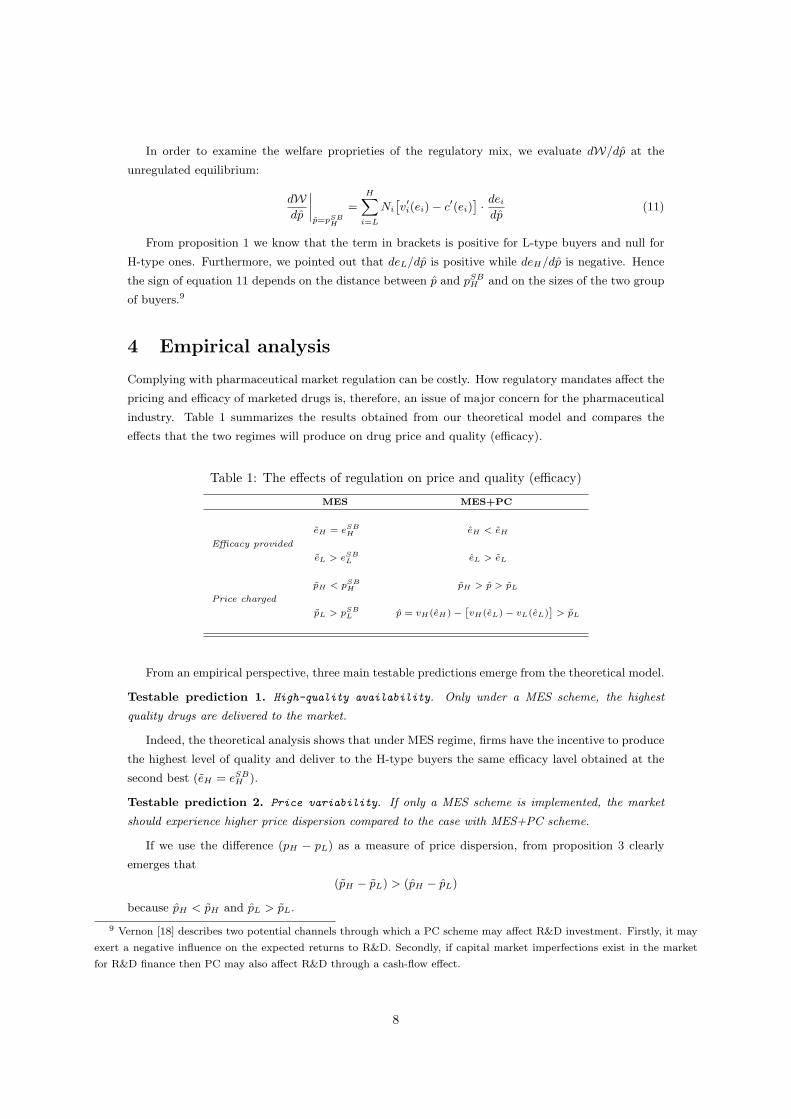
Complying with pharmaceutical market regulation can be costly. How regulatory mandates affect the
pricing and efficacy of marketed drugs is, therefore, an issue of major concern for the pharmaceutical
industry. Table 1 summarizes the results obtained from our theoretical model and compares the
effects that the two regimes will produce on drug price and quality (efficacy).
Table 1: The effects of regulation on price and quality (efficacy)
MES MES+PC
eH = eSBH eH < eH
Efficacy provided
eL > eSBL eL > eL
pH < pSBH pH > p > pL
Price charged
pL > pSBL p = vH(eH)−
ˆvH(eL)− vL(eL)
˜> pL
From an empirical perspective, three main testable predictions emerge from the theoretical model.
Testable prediction 1. High-quality availability. Only under a MES scheme, the highest
quality drugs are delivered to the market.
Indeed, the theoretical analysis shows that under MES regime, firms have the incentive to produce
the highest level of quality and deliver to the H-type buyers the same efficacy lavel obtained at the
second best (eH = eSBH ).
Testable prediction 2. Price variability. If only a MES scheme is implemented, the market
should experience higher price dispersion compared to the case with MES+PC scheme.
If we use the difference (pH − pL) as a measure of price dispersion, from proposition 3 clearly
emerges that
(pH − pL) > (pH − pL)
because pH < pH and pL > pL.
9 Vernon [18] describes two potential channels through which a PC scheme may affect R&D investment. Firstly, it may
exert a negative influence on the expected returns to R&D. Secondly, if capital market imperfections exist in the market
for R&D finance then PC may also affect R&D through a cash-flow effect.
8

Testable prediction 3. Correlation between price and quality. If only a MES scheme is im-
plemented, a higher correlation between price and efficacy is expected for low efficacy drugs. Moreover,
if
(pH − p) > (eH − eH)
then MES scheme provides also a higher correlation for the high efficacy drugs compared to MES+PC.
In order to clarify prediction 3 it is worth notice that moving from MES to MES+PC implies a
quality improvement for the L-type buyers (eL− eL > 0) but does not generate any effect on the price
charged (pL = pL). This result leads to conclude that under MES regime the price’s responsiveness of
low efficacy drugs is lower than under the regulatory mix. To demonstrate the validity of the second
statement provided in prediction 3 it is enough to show that - under the assumption that passing
from MES to MES+PC entails a quality deterioration for the high efficacy drugs that is lower than
the price reduction (pH/p > eH/eH) - the price’s responsiveness of high efficacy drugs realized is
higher than under regulatory mix.
The aim of the next sections is to empirically test these predictions. We have collected data on
Italian and US pharmaceutical markets, which represent two good examples of the regulatory regimes
that we have discussed in our theoretical framework. In fact, while in both markets we observe a
MES regime, only in US prices are completly free to fluctuate. On the contrary, in Italy several forms
of price regulation apply.10
Unfortunately, as we will clarify later, our data allows only to test prediction 2 and prediction
3. In fact, for what concerns prediction 1, our sample includes, by construction, the same set of
drugs across the different regimes. Though Italy and US represent two polar cases with respect to
the regulatory schemes associated to drug industry, they are very close for what concerns the other
main characteristics of the pharmaceutical market: willingness-to-pay, new drugs availability and
affordability. As a consequence, the level of drug efficacy is equalized across the two countries and
therefore we can not empirically test the difference in the average quality delivered to those markets
by the pharmaceutical industry.
Though we cannot test this prediction with our data, we believe that the literature supports it.
First, countries with tighter PC regimes tend to experience longer delays in the introduction of new
drugs. The existing literature on this topic confirms this statement (Danzon et al [5]). Mitchell [13]
reports that, between 2000 and 2005, 73% (52 drugs) of the new medicines approved in both the EU
and the US received their approval first from the FDA. On average, FDA approval came 1 year ahead
of clearance by the EMEA. This gap does not depend on faster FDA processing, but rather on firm
choice to submit drugs first to FDA.11
Similar conclusions can be reached within EU. For example, in the European market firm strategies
are to market drugs first in the UK or Germany (where price regulation is less stringent) and then
in countries with more stringent price regulation (i.e., France, Italy and Spain).
10For the time period to which this study refers, in Italy two different PC schemes coexist: the Average European Price
(AEP) - for old products and me-too products - and a scheme based on price negotiation - for new medicines registered
by EMEA or for all those drugs for which AEP cannot be implemented. A free price setting scheme exists in Italy for
OTC drugs and for not reimbursable drugs. However, as we will see later, the empirical analysis on the Italian side will
concentrate only on prescribed and reimbursable drugs that are all under price control (Kanavos [8]).11This has been also confirmed in an interview by Ken Kaitin, Director of the Tufts Center for the Study of Drug
Development, who stated ”Investors tend to invest in places where there is less control over prices, and it is always better
to do your clinical trials in the countries where you plan to market” (Mitchell [13]).
9

4.1 Data
Our primary source of data comes from the Tufts - New England Medical Center - Cost Effective-
ness Analysis Registry that allows us to compare cost-effectiveness of a broad range of interventions
(among which drugs are the most studied) using standardized cost-utility ratios.12 The collection
consists in detailed abstracted information on published cost-effectiveness studies concerning: infec-
tious diseases, cardiovascular diseases, muscular and rheumatological diseases, malignant neoplasm
and neuro-psychiatric diseases. Each study in the dataset computes the cost-effectiveness of one
or more interventions as the incremental costs (converted to 2002 US$) divided by the incremental
health benefits quantified in terms of Quality Adjusted Life Years (QALYs).
Though this measure entails important caveats, QALYs enable a comparison between the benefits
associated with different drugs in a standardized way, thus allowing us to measure the social value
of an innovation in treatment.13 When the cost-effectiveness ratio is lower, the more QALYs can
be accrued per dollar spent: treatments with low levels of $/QALY are preferred. According to the
Tufts terminology, interventions that reduce cost and simultaneously improve health are defined cost-
saving. At the opposite poorly performing interventions, that raise costs while improving poorly
health status, are defined dominated. Therefore, we have obtained a plausible quality indicator (QI
hereafter) by simply inverting the $/QALY measure. Furthermore, we have assigned the value zero to
all dominated drugs, while the maximum value in the class has been given to the drugs defined as
cost-saving.
For different diseases the Tufts registry provides cost-effectiveness analyses of several interventions
and reports information on the following variables:
1. intervention treatment;
2. comparator treatment;
3. cohort of patients;
4. $/QALY [cost/effectiveness ratio of the treatment].
Given the aim of our work, we have selected only interventions based on drugs. We have selected
177 interventions of which: 54 concern cardiovascular diseases, 43 concern infectious diseases, 31
concern muscular and rheumatological diseases, 22 concern neuro-psychiatric diseases, and 15 concern
malignant neoplasm.
Our final sample originated contains 500 observations, of which 310 belonging to the Italian
market (98 brand names) and 190 to the US market (83 brand names). For each brand name
we have then merged in the Italian and US drug prices.14 We extracted the information on US
drugs’ brand names from the FDA and Merck Manuals On Line Digital Library. We estimated US
prices using information from the Medical Expenditure Panel Survey (MEPS), which is a nationally
representative dataset of Americans.15 We obtained Italian brand names and prices from the AIFA,
the Italian National Agency for Drug Administration and Control Prices. The prices provided by
AIFA have been computed as a average of list prices of all packages available on the Italian market
while MEPS provides unit prices (ratios between expenditure and quantity purchased). All prices
have been converted in price per milligram and for comparison Italian prices have been expressed
12See https://research.tufts-nemc.org/cear/default.aspx13See McGregor [11] for a consideration of the strengths and methodological shortcomings of this measure.14When the comparison involve a combination of active ingredients we have computed the average price per milligram.15www.merck.com/mmhe/index.html.
10

in current 2005 US$ per mg.16 Table 2 provides the variables list, with the relative description and
source, used in our empirical analysis.
Table 2: Variables and Data SourcesVariable Description Source
id active principle Tufts Center for the Study of Drug Development
nameit Italian brand name Italian Agency for Drug Administration and Control (AIFA)
companyit Italian company Italian Agency for Drug Administration and Control (AIFA)
nameus US brand name Merck Manuals On Line Digital Library; FDA
companyus US company Merck Manuals On Line Digital Library
p price per mg (US$ 2005) AIFA for Italy, MEPS for US
QI quality indicator Our calculation on $/QALY provided by
Tufts Center for the Study of Drug Development
Given that the same active ingredient (or combination of active ingredients) appears in different
comparison yielding different QI, our final step has been to collapse the dataset with respect to brand
name, generating a new sample organized as shown in table 3 and whose summary statistics are
reported in table 4.
16The exchange rate used are from the Federal Reserve Bank of St. Louis.
11
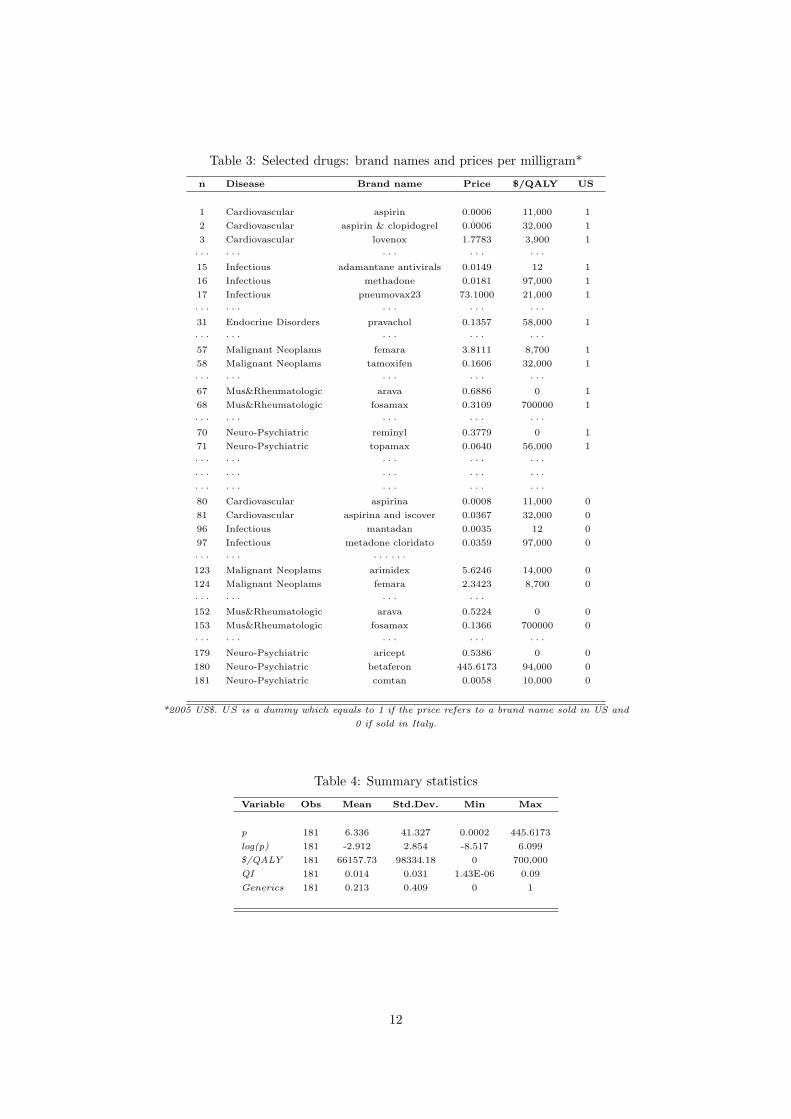
Table 3: Selected drugs: brand names and prices per milligram*
n Disease Brand name Price $/QALY US
1 Cardiovascular aspirin 0.0006 11,000 1
2 Cardiovascular aspirin & clopidogrel 0.0006 32,000 1
3 Cardiovascular lovenox 1.7783 3,900 1
· · · · · · · · · · · · · · ·15 Infectious adamantane antivirals 0.0149 12 1
16 Infectious methadone 0.0181 97,000 1
17 Infectious pneumovax23 73.1000 21,000 1
· · · · · · · · · · · · · · ·31 Endocrine Disorders pravachol 0.1357 58,000 1
· · · · · · · · · · · · · · ·57 Malignant Neoplams femara 3.8111 8,700 1
58 Malignant Neoplams tamoxifen 0.1606 32,000 1
· · · · · · · · · · · · · · ·67 Mus&Rheumatologic arava 0.6886 0 1
68 Mus&Rheumatologic fosamax 0.3109 700000 1
· · · · · · · · · · · · · · ·70 Neuro-Psychiatric reminyl 0.3779 0 1
71 Neuro-Psychiatric topamax 0.0640 56,000 1
· · · · · · · · · · · · · · ·· · · · · · · · · · · · · · ·· · · · · · · · · · · · · · ·80 Cardiovascular aspirina 0.0008 11,000 0
81 Cardiovascular aspirina and iscover 0.0367 32,000 0
96 Infectious mantadan 0.0035 12 0
97 Infectious metadone cloridato 0.0359 97,000 0
· · · · · · · · · · · ·123 Malignant Neoplams arimidex 5.6246 14,000 0
124 Malignant Neoplams femara 2.3423 8,700 0
· · · · · · · · · · · ·152 Mus&Rheumatologic arava 0.5224 0 0
153 Mus&Rheumatologic fosamax 0.1366 700000 0
· · · · · · · · · · · · · · ·179 Neuro-Psychiatric aricept 0.5386 0 0
180 Neuro-Psychiatric betaferon 445.6173 94,000 0
181 Neuro-Psychiatric comtan 0.0058 10,000 0
*2005 US$. US is a dummy which equals to 1 if the price refers to a brand name sold in US and
0 if sold in Italy.
Table 4: Summary statistics
Variable Obs Mean Std.Dev. Min Max
p 181 6.336 41.327 0.0002 445.6173
log(p) 181 -2.912 2.854 -8.517 6.099
$/QALY 181 66157.73 98334.18 0 700,000
QI 181 0.014 0.031 1.43E-06 0.09
Generics 181 0.213 0.409 0 1
12
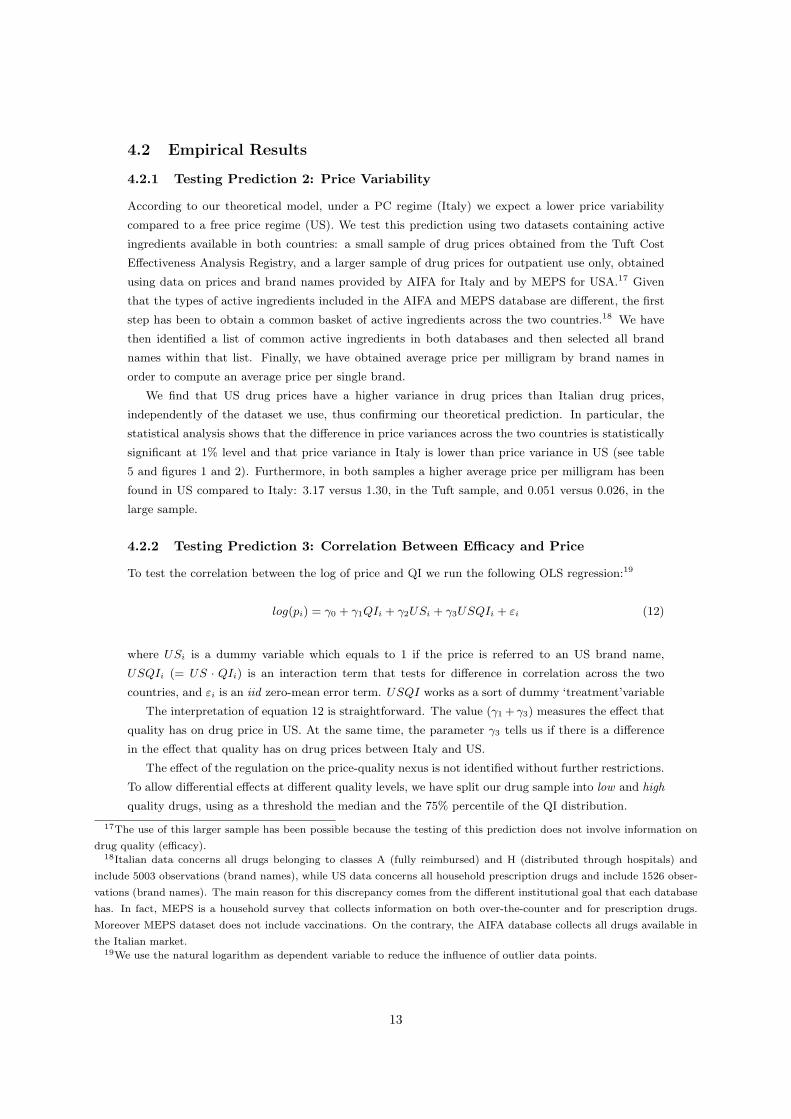
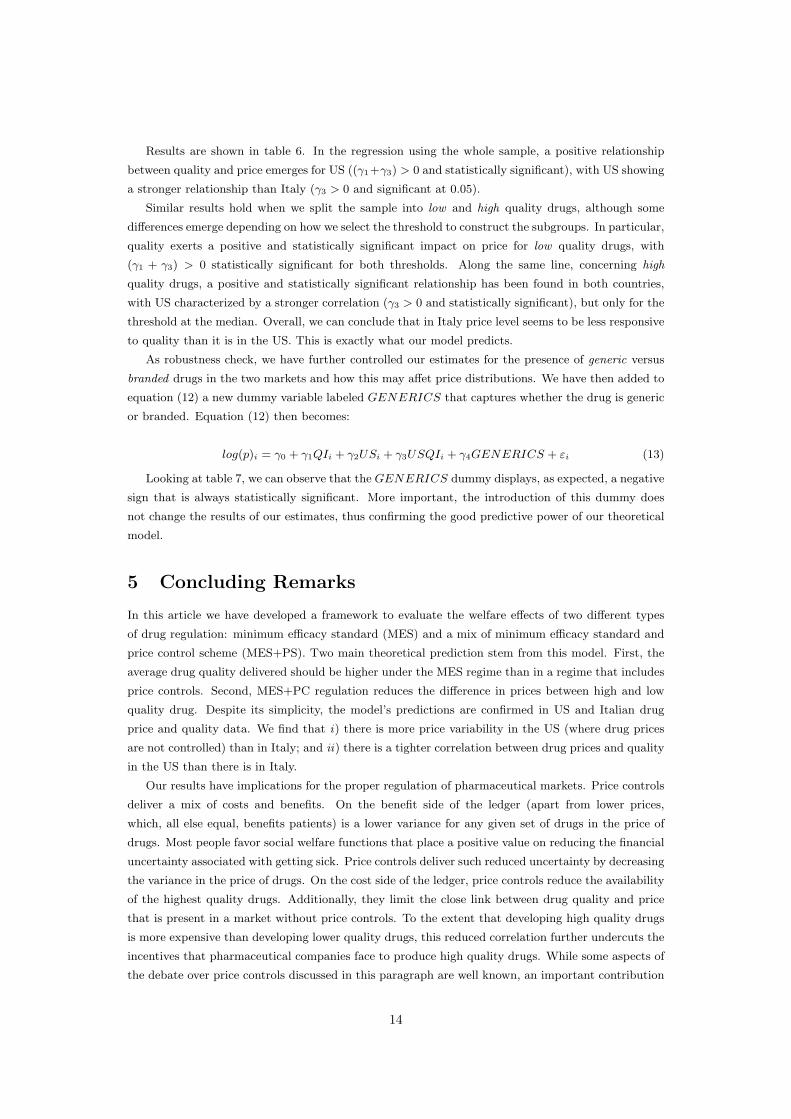
4.2 Empirical Results
4.2.1 Testing Prediction 2: Price Variability
According to our theoretical model, under a PC regime (Italy) we expect a lower price variability
compared to a free price regime (US). We test this prediction using two datasets containing active
ingredients available in both countries: a small sample of drug prices obtained from the Tuft Cost
Effectiveness Analysis Registry, and a larger sample of drug prices for outpatient use only, obtained
using data on prices and brand names provided by AIFA for Italy and by MEPS for USA.17 Given
that the types of active ingredients included in the AIFA and MEPS database are different, the first
step has been to obtain a common basket of active ingredients across the two countries.18 We have
then identified a list of common active ingredients in both databases and then selected all brand
names within that list. Finally, we have obtained average price per milligram by brand names in
order to compute an average price per single brand.
We find that US drug prices have a higher variance in drug prices than Italian drug prices,
independently of the dataset we use, thus confirming our theoretical prediction. In particular, the
statistical analysis shows that the difference in price variances across the two countries is statistically
significant at 1% level and that price variance in Italy is lower than price variance in US (see table
5 and figures 1 and 2). Furthermore, in both samples a higher average price per milligram has been
found in US compared to Italy: 3.17 versus 1.30, in the Tuft sample, and 0.051 versus 0.026, in the
large sample.
4.2.2 Testing Prediction 3: Correlation Between Efficacy and Price
To test the correlation between the log of price and QI we run the following OLS regression:19
log(pi) = γ0 + γ1QIi + γ2USi + γ3USQIi + εi (12)
where USi is a dummy variable which equals to 1 if the price is referred to an US brand name,
USQIi (= US · QIi) is an interaction term that tests for difference in correlation across the two
countries, and εi is an iid zero-mean error term. USQI works as a sort of dummy ‘treatment’variable
The interpretation of equation 12 is straightforward. The value (γ1 + γ3) measures the effect that
quality has on drug price in US. At the same time, the parameter γ3 tells us if there is a difference
in the effect that quality has on drug prices between Italy and US.
The effect of the regulation on the price-quality nexus is not identified without further restrictions.
To allow differential effects at different quality levels, we have split our drug sample into low and high
quality drugs, using as a threshold the median and the 75% percentile of the QI distribution.
17The use of this larger sample has been possible because the testing of this prediction does not involve information on
drug quality (efficacy).18Italian data concerns all drugs belonging to classes A (fully reimbursed) and H (distributed through hospitals) and
include 5003 observations (brand names), while US data concerns all household prescription drugs and include 1526 obser-
vations (brand names). The main reason for this discrepancy comes from the different institutional goal that each database
has. In fact, MEPS is a household survey that collects information on both over-the-counter and for prescription drugs.
Moreover MEPS dataset does not include vaccinations. On the contrary, the AIFA database collects all drugs available in
the Italian market.19We use the natural logarithm as dependent variable to reduce the influence of outlier data points.
13
Results are shown in table 6. In the regression using the whole sample, a positive relationship
between quality and price emerges for US ((γ1+γ3) > 0 and statistically significant), with US showing
a stronger relationship than Italy (γ3 > 0 and significant at 0.05).
Similar results hold when we split the sample into low and high quality drugs, although some
differences emerge depending on how we select the threshold to construct the subgroups. In particular,
quality exerts a positive and statistically significant impact on price for low quality drugs, with
(γ1 + γ3) > 0 statistically significant for both thresholds. Along the same line, concerning high
quality drugs, a positive and statistically significant relationship has been found in both countries,
with US characterized by a stronger correlation (γ3 > 0 and statistically significant), but only for the
threshold at the median. Overall, we can conclude that in Italy price level seems to be less responsive
to quality than it is in the US. This is exactly what our model predicts.
As robustness check, we have further controlled our estimates for the presence of generic versus
branded drugs in the two markets and how this may affet price distributions. We have then added to
equation (12) a new dummy variable labeled GENERICS that captures whether the drug is generic
or branded. Equation (12) then becomes:
log(p)i = γ0 + γ1QIi + γ2USi + γ3USQIi + γ4GENERICS + εi (13)
Looking at table 7, we can observe that the GENERICS dummy displays, as expected, a negative
sign that is always statistically significant. More important, the introduction of this dummy does
not change the results of our estimates, thus confirming the good predictive power of our theoretical
model.
5 Concluding Remarks
In this article we have developed a framework to evaluate the welfare effects of two different types
of drug regulation: minimum efficacy standard (MES) and a mix of minimum efficacy standard and
price control scheme (MES+PS). Two main theoretical prediction stem from this model. First, the
average drug quality delivered should be higher under the MES regime than in a regime that includes
price controls. Second, MES+PC regulation reduces the difference in prices between high and low
quality drug. Despite its simplicity, the model’s predictions are confirmed in US and Italian drug
price and quality data. We find that i) there is more price variability in the US (where drug prices
are not controlled) than in Italy; and ii) there is a tighter correlation between drug prices and quality
in the US than there is in Italy.
Our results have implications for the proper regulation of pharmaceutical markets. Price controls
deliver a mix of costs and benefits. On the benefit side of the ledger (apart from lower prices,
which, all else equal, benefits patients) is a lower variance for any given set of drugs in the price of
drugs. Most people favor social welfare functions that place a positive value on reducing the financial
uncertainty associated with getting sick. Price controls deliver such reduced uncertainty by decreasing
the variance in the price of drugs. On the cost side of the ledger, price controls reduce the availability
of the highest quality drugs. Additionally, they limit the close link between drug quality and price
that is present in a market without price controls. To the extent that developing high quality drugs
is more expensive than developing lower quality drugs, this reduced correlation further undercuts the
incentives that pharmaceutical companies face to produce high quality drugs. While some aspects of
the debate over price controls discussed in this paragraph are well known, an important contribution
14
of this paper is to highlight the reduction in the variance of drug prices and the reduction in the
correlation between price and quality of drugs caused by price controls. How policy makers and the
population at large should value these costs and benefits is of course beyond our scope here.
15
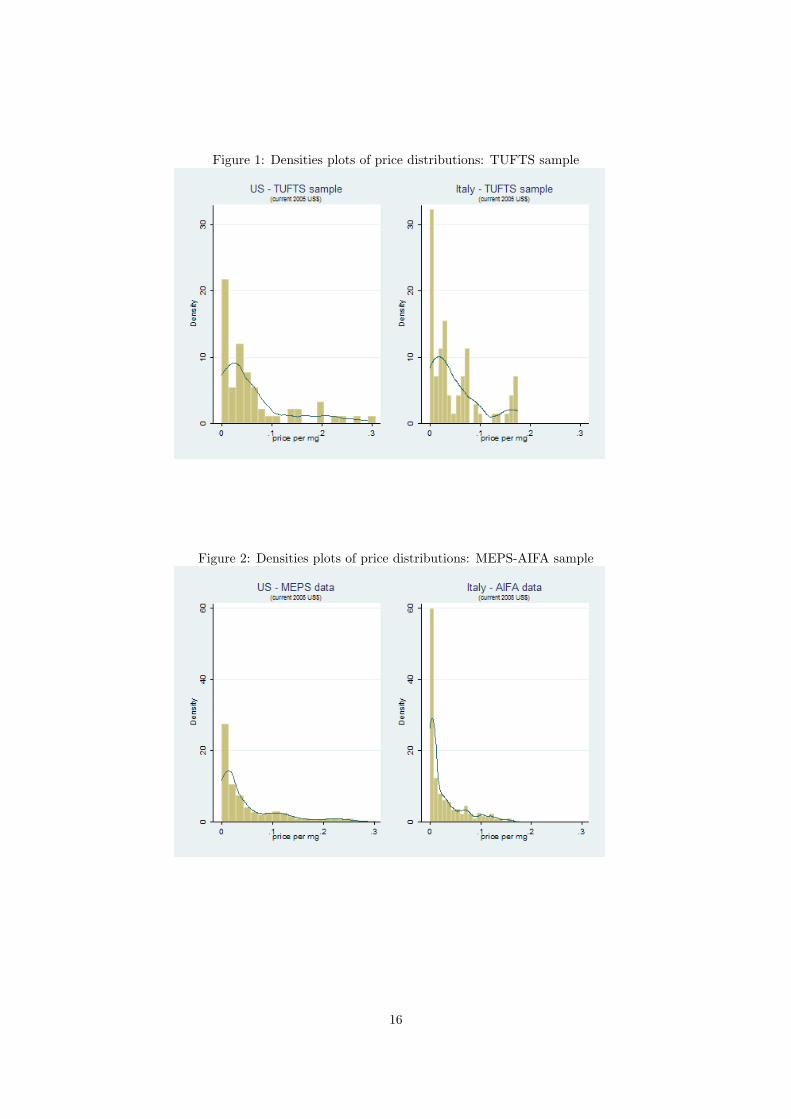
Figure 1: Densities plots of price distributions: TUFTS sample
Figure 2: Densities plots of price distributions: MEPS-AIFA sample
16
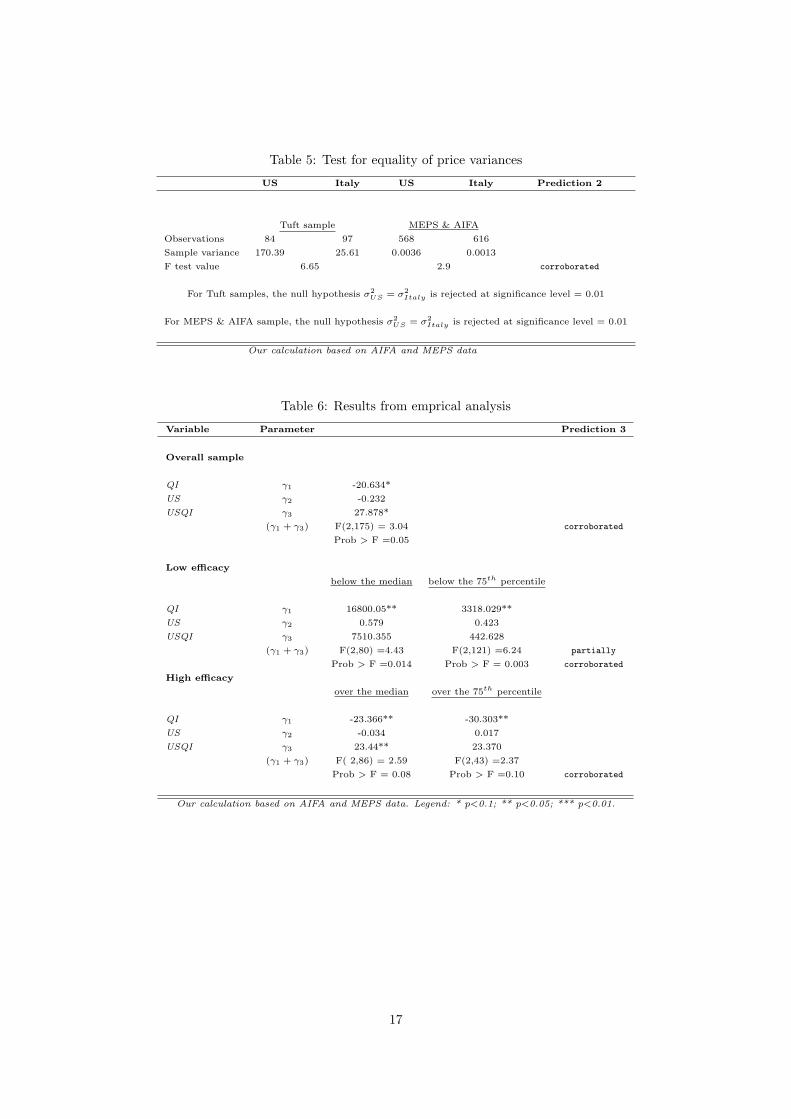
Table 5: Test for equality of price variances
US Italy US Italy Prediction 2
Tuft sample MEPS & AIFA
Observations 84 97 568 616
Sample variance 170.39 25.61 0.0036 0.0013
F test value 6.65 2.9 corroborated
For Tuft samples, the null hypothesis σ2US = σ2
Italy is rejected at significance level = 0.01
For MEPS & AIFA sample, the null hypothesis σ2US = σ2
Italy is rejected at significance level = 0.01
Our calculation based on AIFA and MEPS data
Table 6: Results from emprical analysis
Variable Parameter Prediction 3
Overall sample
QI γ1 -20.634*
US γ2 -0.232
USQI γ3 27.878*
(γ1 + γ3) F(2,175) = 3.04 corroborated
Prob > F =0.05
Low efficacy
below the median below the 75th percentile
QI γ1 16800.05** 3318.029**
US γ2 0.579 0.423
USQI γ3 7510.355 442.628
(γ1 + γ3) F(2,80) =4.43 F(2,121) =6.24 partially
Prob > F =0.014 Prob > F = 0.003 corroborated
High efficacy
over the median over the 75th percentile
QI γ1 -23.366** -30.303**
US γ2 -0.034 0.017
USQI γ3 23.44** 23.370
(γ1 + γ3) F( 2,86) = 2.59 F(2,43) =2.37
Prob > F = 0.08 Prob > F =0.10 corroborated
Our calculation based on AIFA and MEPS data. Legend: * p<0.1; ** p<0.05; *** p<0.01.
17

Table 7: Robustness checkVariable Parameter Prediction 3
Overall sample
QI γ1 -13.527
US γ2 -0.041
USQI γ3 22.125*
GENERICS γ4 -2.869***
(γ1 + γ3) F(2,169) = 2.36 corroborated
Prob > F =0.09
Low efficacy
below the median below the 75th percentile
QI γ1 9883.294 3318.400**
US γ2 0.121 -0.295
USQI γ3 13289.14 708.913
GENERICS γ4 -2.044*** -2.703***
(γ1 + γ3) F(2,79) =3.13 F(2,120) =4.89 partially
Prob > F =0.05 Prob > F = 0.01 corroborated
High efficacy
over the median over the 75th percentile
QI γ1 -12.816 -31.275**
US γ2 -0.010 -0.910
USQI γ3 22.518* 32.163*
GENERICS γ4 -3.280*** -3.121***
(γ1 + γ3) F( 2,85) = 1.49 F(2,44) =3.44
Prob > F = 0.23 Prob > F =0.04 corroborated
Our calculation based on AIFA and MEPS data. Legend: * p<0.1; ** p<0.05; *** p<0.01.
18

Figure 3: Box-plot, log(price) over QI
19

References
[1] Besanko, D., S. Donnenfeld, and L. J. White, 1988, “The Multiproduct Firm, Quality Choice,
and Regulation”, Journal of Industrial Economics, 36(4), pp. 411-429.
[2] Bolton, M., and Dewatripont, M., Contract Theory, The MIT Press, Cambridge, Massachusetts.
[3] Bhattacharya, J., and Vogt, W., 2003, “A Simple Model of Pharmaceutical Price Dynamics”,
Journal of Law and Economics, 46, pp. 599-626.
[4] Danzon, P.M., and Chao, L.W., 2000, “Does Regulation Drive out Competition in Pharmaceutical
Markets?”, Journal of Law and Economics, University of Chicago Press, 43(2), pp. 311-57.
[5] Danzon, P.M., Wang, Y.R, and Wang, LLeon, 2005, “The Impact of Price Regulation on the
Launch Delay of New Drugs - Evidence from Twenty-Five Major Markets in the 1990s”, NBER
Working Paper No. W9874.
[6] Di Masi, J.A., Hansen, R.W., and Grabowski, H.G., 2005, “Extraordinary claims require extraor-
dinary evidence,”, Journal of Health Economics, 24(5), pp. 1034-1044.
[7] Federal Trade Commission, The Pharmaceutical Industry: A Discuss of Com-
petitive and Antitrust Issues in an Environment of Change, available on line,
http://www.ftc.gov/reports/pharmaceutical/drugexsum.htm.
[8] Kanavos, P., 2003 “Overview of pharmaceutical pricing and reimbursement regulation in Europe”,
Japanese Pharmacology and Therapeutics 31(10), pp. 819-836.
[9] Laffont, J-J., and Tirole, J., 1993, A Theory of Incentives in Procurement and Regulation, The
MIT Press, Cambridge, London, England.
[10] Maynard, A., and Bloor, K., 2003, “Dilemmas In Regulation Of The Market For Pharmaceuti-
cals”, Health Affairs, 22(3), pp. 31-41.
[11] McGregor M., 2003, “Cost-utility analysis: use QALYs only with great caution”, Canadian
Medical Association Journal, 168(4), pp. 433-434.
[12] Miraldo, M., 2007, “Reference Pricing Versus Co-Payment in the Pharmaceutical Industry:
Price, Quality and Market Coverage”, CHE Reseearch Paper n.25, Centre for Health Economics,
University of York.
[13] Mitchell, P., 2007, “Price controls seen as key to Europe’s drug innovation lag”, Nature Reviews
Drug Discovery 6, pp.257-258.
[14] Peltzman, S., 1973, “An Evaluation of Consumer Protection Legislation: The 1962 Drug Amend-
ments”, Journal of Political Economy, 81(5), pp. 1049-1091.
[15] Sappington, D.e.M., 2005, “Regulating Service Quality: A Survey”, Journal of Regulatory Eco-
nomics, 27(2), pp. 123-154.
[16] Scherer, F.M., 2004, “The Pharmaceutical Industry Prices and Progress”, New England Jurnal
of Medicine, 351(9), pp. 927-932.
[17] US Department of Commerce, International Trade Administration (Washington), 2004 Pharma-
ceutical Price Controls in OECD Countries.
[18] Vernon, John A., 2005, “Examining the link between price regulation and pharmaceutical R&D
investment”, Health Economics, 14, pp. 1-16.
20

A Appendix
A.1 Symbology
Table 8: Symbology
Symbol Description
e efficacy threshold
ei i-type drug efficacy
Ωi i-type producer feasibility set
ζ innovative drug
vi willingness-to-pay for efficacy
r R&D expenditure
pF Bi , eF B
i first best price-efficacy pair
pSBi , eSB
i second best price-efficacy pair
pi, ei price-efficacy pair under MES
pi, ei price-efficacy pair under MES+PC
A.2 Second best solution: erasing constraints
First best allocation implies efficient consumption and zero rent for the buyers: v′i(ei) = c′(ri) and
vi(ei) = pi with i = L,H. However, under incomplete information, this outcome is not incentive
compatible because the H-type enjoys a positive rent by choosing the pair eL, pL rather than her
own first best allocation. Hence the H-type buyer mimics L-type in order to realize a positive surplus.
By doing so she gets:
vH(eL)− pL = vL(eL)− pL + [vH(eL)− vL(eL)]| z >0
This implies that, even though the principal delivers a eL to the L-type such as vL(eL) − pL = 0,
H-type buyer will continue to benefit from an information rent.
At the opposite, L-type buyer will not find convenient to consume higher efficacy drug. Hence we
can omit incentive compatibility constraint for L-type buyer.
vH(eH)− pH ≥ vH(eL)− pL ≥ vL(eL)− pL ≥ 0 (14)
A.3 Proof of proposition 1
Constraints (7) provide:
- pL = vL(eL) = pFBL
- pH = vH(eH)− [vH(eL)− vL(eL)]| z <0
< pFBH
Plugging pL and pH into the profit function yields:
maxp,e
Π = NL ·ˆvL(eL)− c(eL)
˜+NH ·
ˆvH(eH)− [vH(eL)− vL(eL)]− c(eH)
˜FOCs:
21
- ∂Π/∂eL = 0⇒ v′L(eL) = c′(eL) + NHNL·ˆv′H(eL)− v′L(eL)
˜| z >0
- ∂Π/∂eH = 0⇒ v′H(eH) = c′(eH)
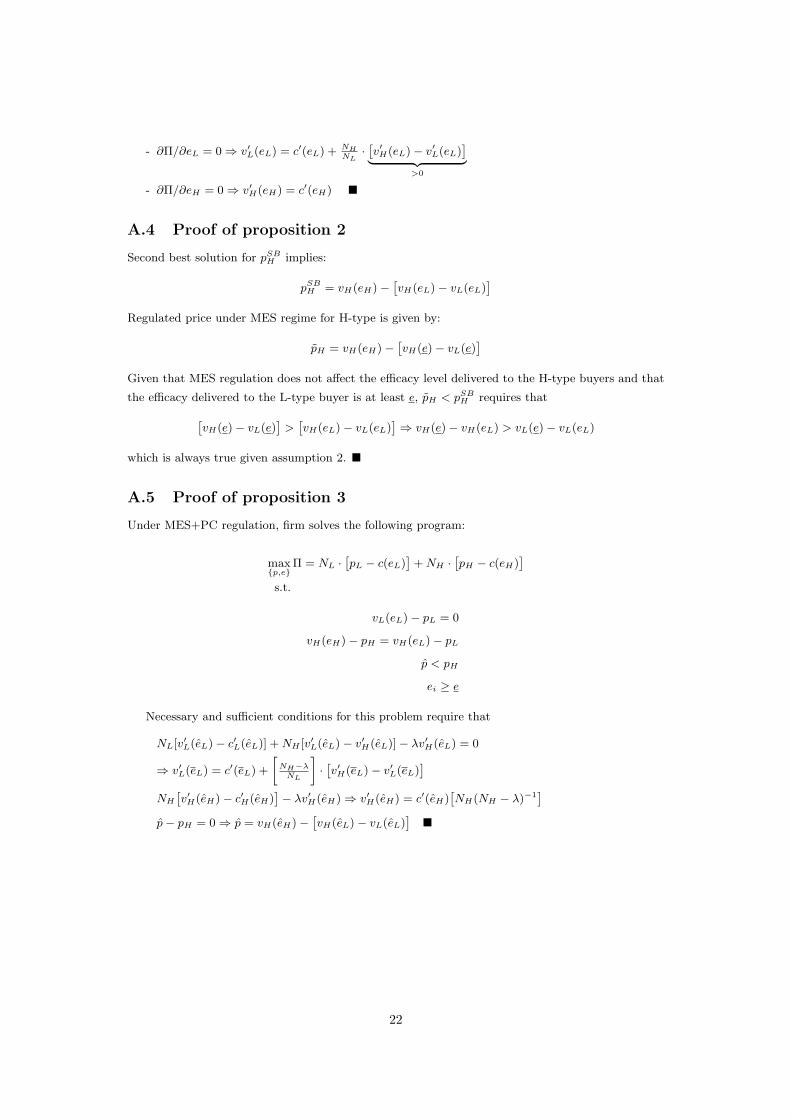
A.4 Proof of proposition 2
Second best solution for pSBH implies:
pSBH = vH(eH)−ˆvH(eL)− vL(eL)
˜Regulated price under MES regime for H-type is given by:
pH = vH(eH)−ˆvH(e)− vL(e)
˜Given that MES regulation does not affect the efficacy level delivered to the H-type buyers and that
the efficacy delivered to the L-type buyer is at least e, pH < pSBH requires thatˆvH(e)− vL(e)
˜>ˆvH(eL)− vL(eL)
˜⇒ vH(e)− vH(eL) > vL(e)− vL(eL)
which is always true given assumption 2.
A.5 Proof of proposition 3
Under MES+PC regulation, firm solves the following program:
maxp,e
Π = NL ·ˆpL − c(eL)
˜+NH ·
ˆpH − c(eH)
˜s.t.
vL(eL)− pL = 0
vH(eH)− pH = vH(eL)− pL
p < pH
ei ≥ e
Necessary and sufficient conditions for this problem require that
NL[v′L(eL)− c′L(eL)] +NH [v′L(eL)− v′H(eL)]− λv′H(eL) = 0
⇒ v′L(eL) = c′(eL) +
»NH−λNL
–·ˆv′H(eL)− v′L(eL)
˜NHˆv′H(eH)− c′H(eH)
˜− λv′H(eH)⇒ v′H(eH) = c′(eH)
ˆNH(NH − λ)−1
˜p− pH = 0⇒ p = vH(eH)−
ˆvH(eL)− vL(eL)
˜
22